 Chao Han
 Yuetong Zhang
 Guorui Wang2
 Zhihui Zhang
- 1College of Earth Science and Engineering, Shandong University of Science and Technology, Qingdao, China
- 2Shandong Geo-Surveying and Mapping Institute, Jinan, China
- 3Xishan Coal and Electricity (Group) Co., Ltd., Taiyuan, China
Accurate investigation of shale pores is critical to the assessment of shale-gas reservoir properties. Qualitative and quantitative methods have been commonly conducted in shale pore studies. In this study, we take the black shale from the Upper Ordovician and Lower Silurian black shale in the Southern Sichuan Basin as an example. Both qualitative and quantitative methods were used to study the pores at multiple scales, and we discuss the effectiveness of shale pore detection by multiple methods. The following results were obtained: 1) The black shale is composed of quartz, feldsaper, calcite, dolomite and clay minerals in the study area, and its average TOC and porosity are 2.19 and 2.12%, respectively. 2) The CT results show that the pore size of macropores (pore size >0.5 μm) mainly ranges from 2 to 16 μm. Nitrogen adsorption analysis shows that organic-rich shale has abundant organic matter pores with narrow necks and wide bodies. The pores of organic-poor shale are mainly composed of mineral-associated pores with narrow slit shapes. The NMR results show that with increasing TOC, the left peak T2 relaxation times move leftwards, meaning that organic matter pores have a larger pore size than matrix pores at the mesopore scale. 3) CT data identify lamellation fractures and bed-cutting fractures, and their development is controlled by mineral type and content, TOC and laminae density. 4) The determination of segmentation thresholds in CT and transverse surface relaxivity in NMR seriously affects the accuracy of the results.
Introduction
The remarkable success of the US shale gas revolution aroused wide concern among Chinese petroleum geologists (Jarvie et al., 2007; Wang et al., 2013; Lv et al., 2020). In recent years, China has achieved breakthroughs in shale gas exploration, and its known reserves have reached 2 × 10¹² m3, with an annual production of 200 × 108 m3 in 2020 (Zhang et al., 2017; Li et al., 2021; Zhao et al., 2021). The black marine shale from the Upper Ordovician Wufeng Formation and Lower Silurian Longmaxi Formation in the Sichuan Basin has high organic matter content (TOC), high maturity, large thickness and wide distribution and is the main shale gas exploration target in China (Xu et al., 2020; Li et al., 2021). Shale gas reservoirs are typical “self-sources and self-reservoirs,” and their pore types differ from those of conventional reservoirs. A previous study showed that the main pore sizes of black shales are nanopores.
A series of qualitative and quantitative approaches, such as low-pressure nitrogen and CO2 gas adsorption, field emission-scanning electron microscopy (FE-SEM), nuclear magnetic resonance (NMR), high-pressure mercury intrusion (HPMI), and X-ray microcomputed tomography (CT), provide multiscale methods to determine pore properties, such as pore volume, pore size, specific surface area, and pore connectivity (Zhang et al., 2015; Ji et al., 2017; Huang et al., 2020; Li et al., 2020; Wang et al., 2020; Li, 2022). However, these methods cannot show pore distribution in three-dimensional space, limiting the further understanding of shale gas reservoir controlling factors. In this study, shale core samples from the Upper Ordovician Wufeng Formation and Lower Silurian Longmaxi Formation in the Sichuan Basin were collected. By combining organic geochemistry, petrology, CT scanning, helium porosity, NMR and low-pressure nitrogen adsorption, multiscale pore characteristics were investigated, and the effectiveness of shale pore detection by multiple methods was discussed.
Geological setting
The Sichuan Basin is located in southern China and covers a total area of 180×103 km2 (Han et al., 2016, 2019; Wang et al., 2020). It was formed from multistage tectonic cycles, including the Caledonian, Hercynian, Indosinian, Yanshanian, and Himalayan movements. The basement of the Sichuan Basin is composed of pre-Sinian metamorphic rocks, including Archaean-early Proterozoic gneiss rock and meso-upper Proterozoic low metamorphic greenschist.
From the Sinian to the Middle Triassic, the Sichuan Basin mainly deposited marine carbonate, and its thickness ranged from 4 to 7 km. Since the Late Triassic, the Sichuan Basin has entered the inner land lake stage (Mou et al., 2011). The Longmaxi Formation, with thicknesses ranging from 160 to 600 m, is composed of black shale, while its lower member commonly contains black shales with high TOC and abundant graptolites. Its upper member is composed of argillaceous limestone, silty mudstone and siltstone, with low TOC content. From bottom to top, the TOC content of the Longmaxi Formation shows a decreasing trend (Han et al., 2016, 2018). Figure 1.
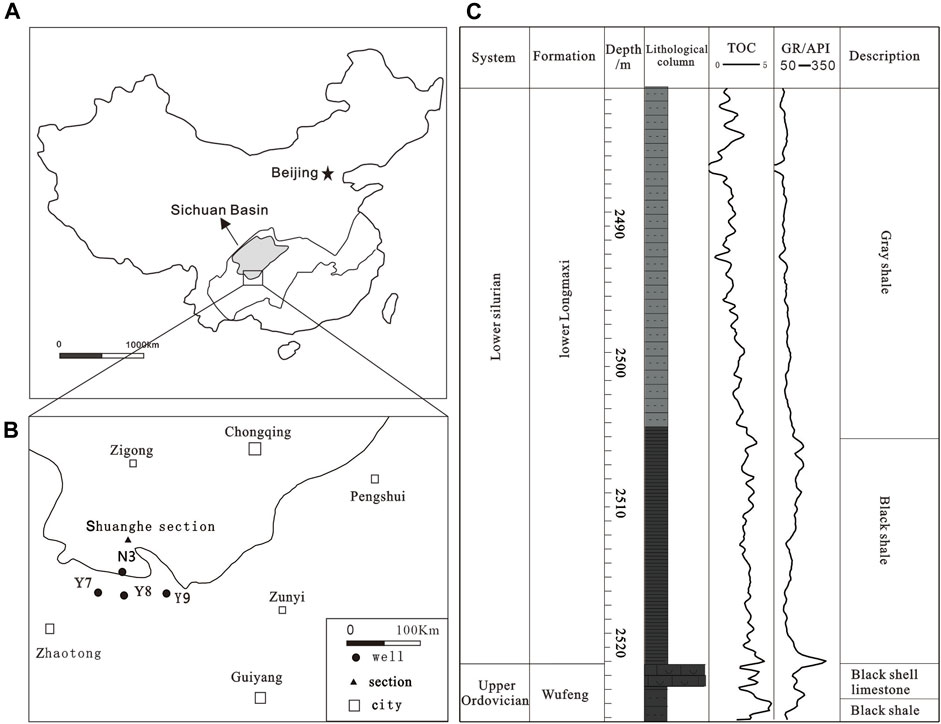
FIGURE 1. Geographic location and lithological column of the Longmaxi and Wufeng Formations. (A) Location of Sichuan Basin; (B) Location of the study area (modified according to Wang et al., 2013); (C) Lithological column Longmaxi and Wufeng formation, Well N3.
Samples and experiments
A total of 72 shale samples from the Lower Longmaxi Formation and Wufeng Formation were collected from four wells and one outcrop section in the southern Sichuan Basin. The mineral content of black shale samples was analysed using RINT-TTR3 X-ray Diffraction (XRD) at a current of 100 mA and a voltage of 45 kV. The TOC content was determined using a LECO CS-230 carbon analyser. CT scanning is completed by nano Voxel-3502 E at a current of 35 μA and a voltage of 50 kV, and its voxel size is 0.5 μm. NMR was performed by RecCore04. Low-temperature nitrogen adsorption was completed by QuadraSorb Station.
Experimental results
Mineralogy, porosity and organic geochemistry
XRD results show that the black shale of the Longmaxi Formation is composed of quartz (average: 30.78 wt%), calcite (average: 14.57 wt%), feldspar (average: 7.82 wt%), dolomite (average: 9.62 wt%), clay (36.04 wt%) and pyrite (2.54 wt%). Quartz, feldsaper, calcite, dolomite and clay occupy a large proportion, and their ternary diagram shows that their percentages vary greatly (Figure 2A). Clay mainly contains chlorite, illite and illite–smectite, and the ternary diagram shows that illite and illite–smectite account for the majority of the composition (Figure 2B). The distributions of TOC and porosity are shown in Figure 2A. The TOC of black shale ranges from 0.34 wt% to 7.7 wt%, with an average of 2.19 wt%, the highest TOC content in the bottom of the Longmaxi Formation (Figure 3A). The porosity of black shale ranges from 0.68 to 4%, with an average of 2.02% (Figure 3B).
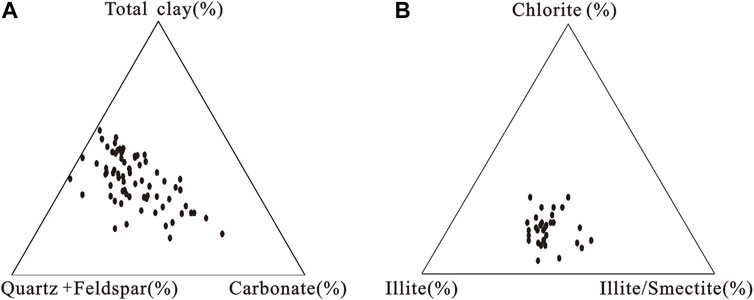
FIGURE 2. Ternary diagram of the XRD mineral composition (A) and clay type (B) for the study shale samples.

FIGURE 3. Distributions of TOC and porosity of black shale in the study area.
CT results
The quantitative and qualitative data presented in this section, such as three-dimensional (3D) distribution pores and fractures, pore volume, and pore size, were calculated from CT data (Figures 4). The dataset comprised 3,950 2D images, each comprising square pixels with a side length of 0.5 μm. The distribution of fractures shows two distinct types. The first type is lamellation fractures parallel to bedding layers, showing good connectivity (Figures 5A,B), and its thickness mainly ranges from 40 to 70 μm (Figure 5C). The second type is bed-cutting fractures, which are composed of a series of isolated fractures and show irregular distribution and poor connectivity (Figures 5C,D). The widths of the fractures range from 20 to 110 μm, with lengths varying from 65 to 500 μm (Table 1), and their thicknesses are mainly 2–6 μm (Figure 5F). Figure 6 shows the pore three-dimensional (3D) distribution, the percentage number of pores and fractures, and the pore volume distribution with different pore diameters. Limited by the low resolution of the CT technique (0.5 μm), pores larger than 0.5 μm were recognized. The pore volumes of the two selected samples account for 2.44 and 2.56%, and fractures account for 0.42 and 0.41%. The pore volume mainly comes from pores with diameters of 4–8 µm.
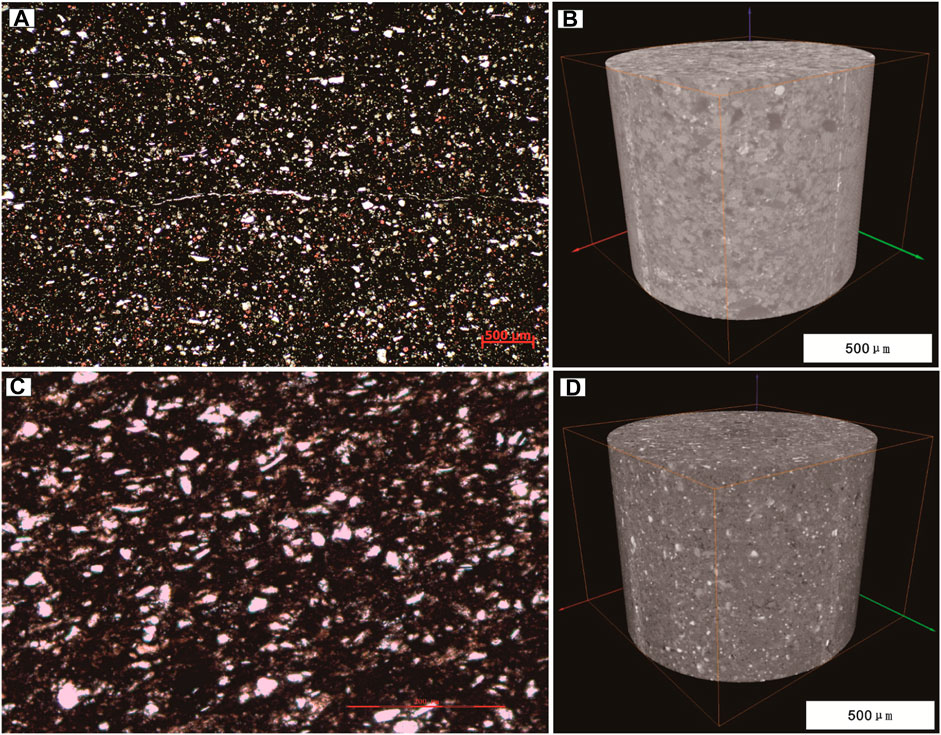
FIGURE 4. Thin section observations and three-dimensional image from CT of the black shale. (A) Thin section observations, Well Y7, 2275.26 m, sample 7–15, horizontal bedding. (B) Three-dimensional image of sample 7–15 from CT; (C) thin section observations, well Y7, 2286.71 m, sample 7–18; (D) three-dimensional image of sample 7–18 from CT.
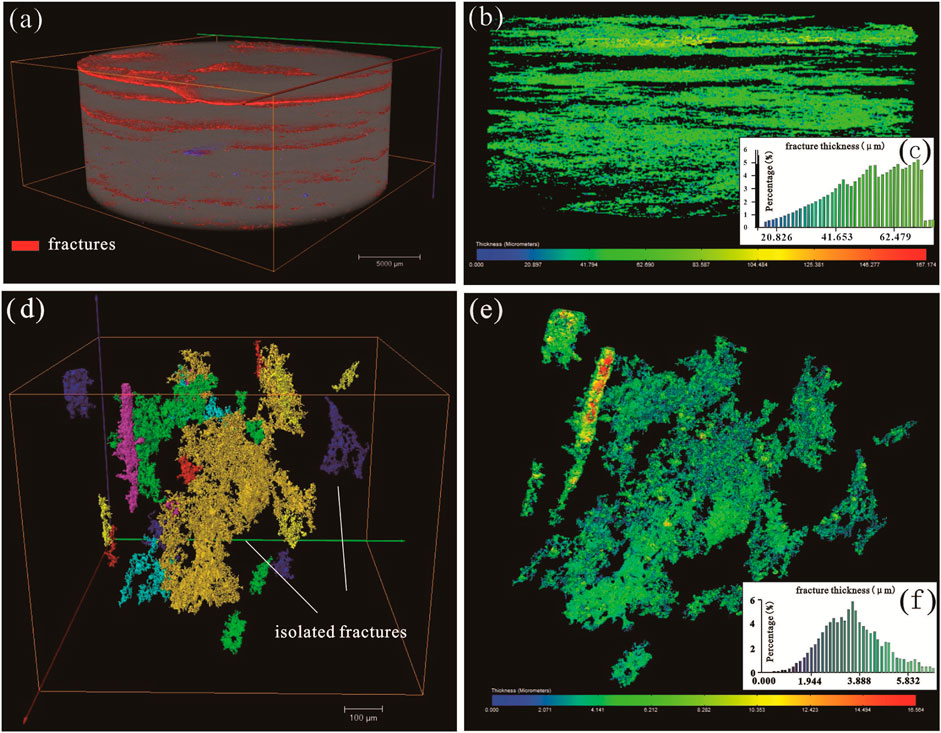
FIGURE 5. Three-dimensional distribution of the two types of fractures from the CT data. (A) Three-dimensional image of lamellation fractures from CT, sample tj-17, shuanghe section; (B) lamellation fractures were given different colours by their thickness, sample tj-17, shuanghe section; (C) thickness distribution of lamellation fractures, sample tj-17, shuanghe section; (D) three-dimensional image of bed-cutting fractures from CT, Well Y7, 2286.71 m, sample 7–18; (E) bed-cutting fractures were given different colours by their thickness, Well Y7, 2286.71 m, sample 7–18; (F) thickness distribution of bed-cutting fractures, Well Y7, 2286.71 m, sample 7–18.
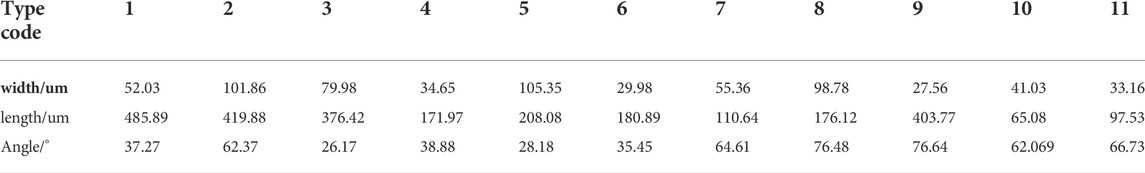
TABLE 1. The size features of fractures.
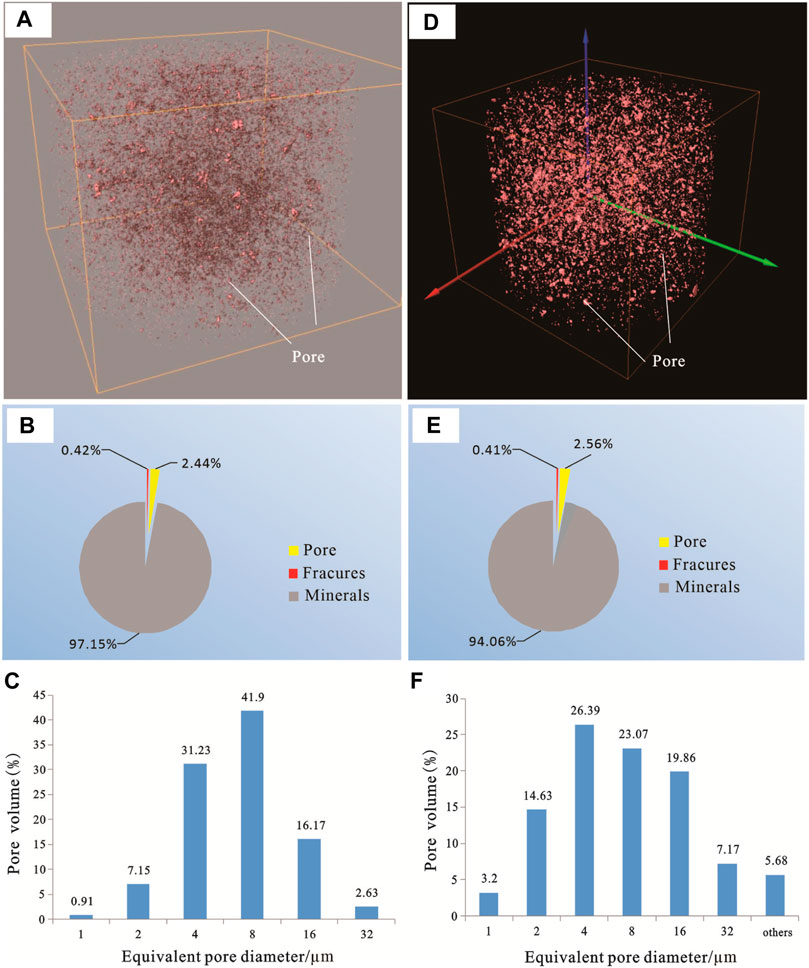
FIGURE 6. Pore features from CT data. (A) Three-dimensional distribution of pores, Well Y7, 2275.26 m, sample 7–15; (B) the percentage of pore volume, sample 7–15; (C) pore size distribution of sample 7–15; (D) three-dimensional distribution of pores, Well Y7, 2286.71 m, sample 7–18; (E) the percentage of pore volume, sample 7–18; (F) pore size distribution of sample 7–18.
Low-temperature nitrogen adsorption
The nitrogen adsorption-desorption isotherms are shown in Figures 7, 8. According to the classification of the International Union of Pure and Applied Chemistry (IUPAC), these isotherms of black shale feature Type IV hysteresis loops. The hysteresis loop shape shows that the organic-rich shale pore type is H2 (inkbottle-shaped pore), which has narrow necks and wide bodies. These isotherms of organic-poor shale feature Type IV characterized H4-type hysteresis loops, which means narrow slit-shaped pores developed (De Boer, 1958; Sing, 1985). Using nitrogen adsorption-desorption isotherms, BET surface areas and BJH pore volume were calculated. The pore size distribution (PSD) shows that pores with diameters of approximately 4 nm are the main source of pore volume (Figures 7B,C). The BET surface areas are in the range of 3.902–17.84 m2/g (Figure 9A), and their average value is 11.93 m2/g (Figure 9A). The BJH pore volumes range from 0.017 to 0.063 cc/g (Figure 9B), and their average value is 0.041 cc/g.
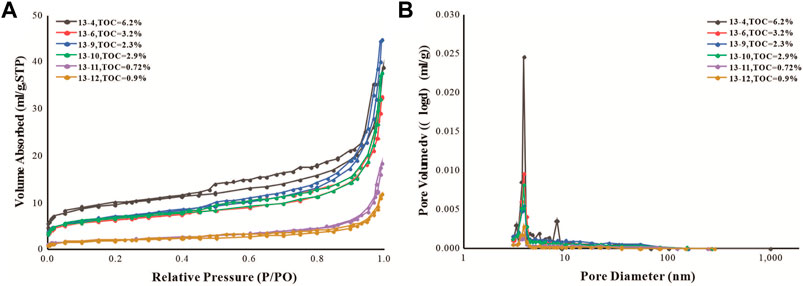
FIGURE 7. Nitrogen adsorption and desorption isotherms (A) and pore-volume distributions (B) for six representative core samples.
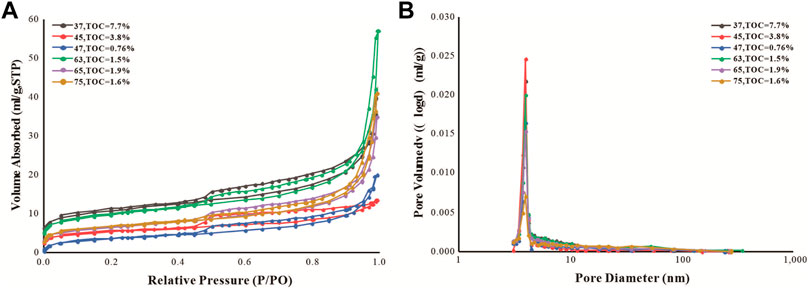
FIGURE 8. Nitrogen adsorption and desorption isotherms (A) and pore-volume distributions (B) for six outcrop samples.
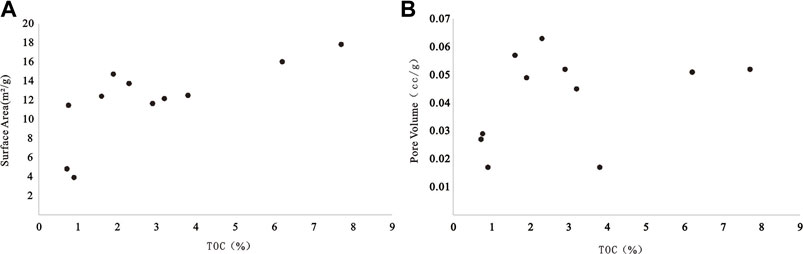
FIGURE 9. Relationship between TOC and surface area and pore volumes obtained from nitrogen adsorption isotherm analyses.
NMR analysis results
The current study suggest that the detected T2 correlates with pore size in NMR measurements (Yao et al., 2010). Twelve black shale samples from two well cores were subjected to NMR measurements. The NMR amplitudes of the black shale sample mainly show bimodal distributions, supplemented with few trimodal and unimodal distributions. The T2 relaxation times of shale samples range from 0.01 to 110 ms (Figure 10). The first peak (P1) normally was at 0–10 ms, the second peak was at 8–16 ms, and the third peak was at 13–110 ms. P3 is interpreted as a fracture. Figure 9.
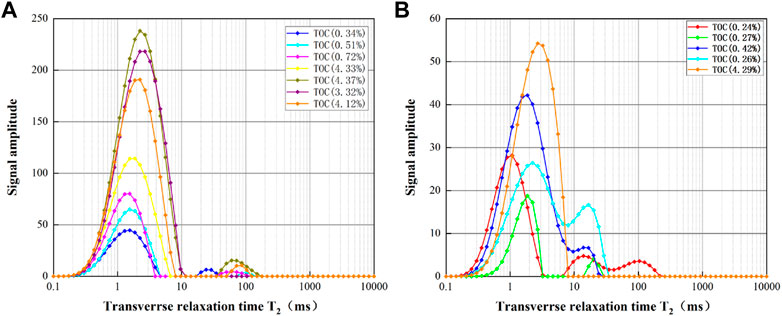
FIGURE 10. T2 spectra for seven outcrop samples (A) and five core samples (B).
The T2 relaxation times are controlled by the pore size of the rock, and the relationship between the T2 relaxation times and pore size can be expressed as follows (Liang et al., 2016; Zhang et al., 2017):
Fs is the geometric factor of pore shape, which is equal to two for a cylindrical pore and three for a spherical pore, r is the pore radius in nanometres, and ρ2 is the proportionality constant between 1/T2 and the surface-to-volume ratio of the pore. For simplification purposes, the value of Fs is given as two because the pore morphology of shale is regarded as cylindrical.
Combined with the PSD from nitrogen adsorption, we define ρ2 as 0.5 nm/ms. The pore radius can be derived from Eq. 2 and is expressed as Eq. 3:
Therefore, the pore size of P1 is 0–20 nm, and that of P2 is 20–140 nm.
Discussion
Pore type and PSD in black shale
Based on the occurrence position, pore types are subdivided into interparticle pores found between particles and crystals, intraparticle pores located within particles and organic matter pores located within organic matter (Loucks, et al., 2012). On the basis of pore size, pores were divided into micropores (pore diameter<2 nm), mesopores (pore diameter 2–50 nm) and macropores (pore diameter>50 nm) (Sing, 1985).
In this study, limited by the low resolution of CT, pores with sizes larger than 0.5 μm were identified, and their pore sizes mainly ranged from 2 to 16 μm. The PSD from nitrogen adsorption shows that organic-rich shale commonly has a higher pore volume and surface area than organic-poor shale (Figure 9), and the peak of the PSD is approximately 4 nm. In Figure 10A, the peak of the T2 relaxation times moves leftwards with increasing TOC, while this trend is not obvious in Figure 10B because their TOC gap is small. Since the T2 relaxation times are positively related to pore size in NMR experiments (Liang et al., 2016; Zhang et al., 2017), the trend shows that organic pores have a larger pore size than matrix pores.
Our previous study showed that black shale has long-dimensional OM pores ranging from a few nanometres to one hundred nanometres, the pore size of interparticle pores ranges from 50 nm to 1 μm, and intraparticle pores have an obvious pore size distribution with pore sizes ranging from 25 nm to 3 μm in the southern Sichuan Basin (Han et al., 2016; Han et al., 2018). The relationship between shale composition and pore volumes shows that mesopore volumes had a moderate-strong positive correlation with TOC and carbonate content, while a moderate-weak negative correlation with quartz and clay content and macropore volumes had a moderate positive correlation with quartz content (Han et al., 2018). Both NMR and nitrogen adsorption show that organic pores are the main source of mesopores, which is consistent with previous studies proven by both qualitative and quantitative methods, such as N2 gas adsorption and FE-SEM images (Yang et al., 2016; Han et al., 2018; He et al., 2021; Qian et al., 2022).
Fracture types and controlling factors
Fractures are a key factor controlling shale gas accumulation and productivity (Gale et al., 2017; Li et al., 2018; Chen et al., 2021; Zhao et al., 2021). CT imaging shows that the black shale has two distinct types of fractures, lamellation fractures and bed-cutting fractures, in the study area. The thickness of bed-parallel fractures is generally dozens of times that of bed-cutting fractures (Figure 5). The development of fractures is controlled by mineral type and content, TOC and laminae density (Zeng et al., 2013; Cai et al., 2020; Lan et al., 2021; Xu et al., 2021). Lamellation fractures are commonly related to the primary sedimentary structure of shale (Xiang et al., 2022). The minerals in shale are commonly arranged in layers, and the mineral type and content vary in different layers. As a result, adjacent layers have different compressive abilities when subjected to compressional stress, and lamellation fractures form at laminae interfaces (Zeng et al., 2013; Gu et al., 2020; Xu et al., 2021). Laminae density also affects the formation of lamellation fractures. When the laminae density is less than 4 cm−1, the laminae density has an obvious correlation with the density of the lamellation fracture. However, when the laminae density is greater than 4 cm−1, the density of the lamellation fracture remains at approximately 1 cm−1 with the increase in fracture (Xu et al., 2021). Shale composition is an important factor affecting fractures, including mineral composition and content and TOC content (Ding et al., 2012; Zeng et al., 2013; Yin and Wu, 2020; Li, 2022). The statistical results show that with increasing quartz content, the fracture density increases first when the quartz content is less than 50%, while the fracture density decreases when the quartz content is over 50% (Han et al., 2022). Because of the positive relationship between TOC and quartz content, the relationship between TOC and fracture density also shows a similar trend (Han et al., 2022).
Effectiveness evaluation of shale pore detection by multiple methods
Nitrogen adsorption, CT and NMR are popular methods to detect shale pore structure. Primitive CT data comprise 3,950 2D images, and the pore features calculated from CT data are severely affected by X-ray images. Meanwhile, OM and pores show similar and continuing thresholds in X-ray images, and it is difficult to accurately determine the boundaries (Wang et al., 2019). If the threshold value increased from 42 to 54, shale porosity could change from 14% to nearly 49% (Bai et al., 2013). Therefore, the determination of segmentation thresholds is a problem that cannot be ignored.
The NMR method has been used in reservoir characterization since 1956 (Brown and Fatt, 1956). With the development of NMR instruments, NMR has been widely used to determine petrophysical properties and fluid characteristics in coal and shale (Liu et al., 2020; Zheng et al., 2020; Zhao et al., 2022). From Ea. (2), ρ2, called the transverse surface relaxivity, is a key parameter to calculate pore size. However, the value of ρ2 varies from 2 nm/ms to 21 nm/ms in shale (Coates et al., 1999; Curtis et al., 2010; Sondergeld et al., 2010). Therefore, accurately obtaining the value of the transverse surface relaxivity is still a critical issue.
Conclusion
1. The black shale of the Longmaxi Formation is mainly composed of quartz, feldspar, calcite, dolomite and clay minerals in the study area; its TOC ranges from 0.34 to 7.7% (average: 2.19%) and has a porosity ranging from 0.68 to 4% (average of 2.02%).
2. Limited by low resolution, CT results could identify macropore features with pore sizes larger than 0.5 μm, and their pore size distribution is mainly from 2 to 16 μm. Nitrogen adsorption analysis shows that organic-rich shale contains abundant OM pores that have narrow necks and wide bodies, and its PSD peaks at approximately 4 nm. NMR analysis shows that PSD has two peaks: P1 is 0–20 nm, and P2 is 20–140 nm. The left peak of T2 relaxation times moves leftwards with increasing TOC. This trend shows that organic matter pores have a larger pore size than matrix pores.
3. The black shale has two distinct types of fractures, lamellation fractures and bed-cutting fractures, in the study area. Their development is controlled by mineral type and content, TOC and laminae density.
4. Although NMR and CT have been widely used in shale pores, the determination of segmentation thresholds in CT and transverse surface relaxivity in NMR is still a problem to solve further.
Data availability statement
The original contributions presented in the study are included in the article/Supplementary Material, further inquiries can be directed to the corresponding author.
Author contributions
CH is responsible for the idea and writing of this paper and YZ, GW, ZZ, HL, and QL are responsible for the experiments.
Funding
This manuscript was supported by the National Natural Science Foundation of China (41702131 and 41972108).
Conflict of interest
The author GW was employed by Shandong Geo-surveying and Mapping Institute. The author HL was employed by Xishan Coal and Electricity (Group) Co. Ltd. Taiyuan, China.
The remaining authors declare that the research was conducted in the absence of any commercial or financial relationships that could be construed as a potential conflict of interest.
Publisher’s note
All claims expressed in this article are solely those of the authors and do not necessarily represent those of their affiliated organizations, or those of the publisher, the editors and the reviewers. Any product that may be evaluated in this article, or claim that may be made by its manufacturer, is not guaranteed or endorsed by the publisher.
References
Bai, B., Elgmati, M., Zhang, H., and Wei, M. (2013). Rock characterization of Fayetteville shale gas plays. Fuel 105, 645–652. doi:10.1016/j.fuel.2012.09.043
Brown, R. J. S., and Fatt, I. (1956). Measurements of fractional wettability of oil fields' rocks by the nuclear magnetic relaxation method. Trans. AIME 207, 262–264. doi:10.2118/743-G
Cai, C., Kang, Y., Yang, Y., Wang, X., Li, Y., Huang, M., et al. (2020). The effect of shale bedding on supercritical CO2 jet fracturing: A experimental study. J. Pet. Sci. Eng. 195, 107798. doi:10.1016/j.petrol.2020.107798
Chen, G. B., Li, T., Yang, L., Zhang, G. H., Li, J. W., and Dong, H. J. (2021). Mechanical properties and failure mechanism of combined bodies with different coal-rock ratios and combinations. J. Min. Strata Control Eng. 3 (2), 023522. doi:10.13532/j.jmsce.cn10-1638/td.20210108.001
Coates, G. R., Xiao, L., and Prammer, M. G. (1999). NMR logging principles and applications. Houston: Haliburton Energy Services.
Curtis, M. E., Ambrose, R. J., and Sondergeld, C. H. (2010). “Structural characterization of gas shales on the micro-and nano-scales,” in Paper presented at the Canadian Unconventional Resources and International Petroleum Conference, Calgary, Alberta, Canada, October 19–21, 2010. SPE137693. doi:10.2118/137693-MS
De Boer, J. H. (1958). The structure and propertied of porous materials. London: Butterwort-Heinemann.
Ding, W. L., Li, C., and Li, C. Y. (2012). Dominant factor of fracture development in shale and its relationship to gas accumulation. Earth Sc Front. 19 (2), 212–220.
Gale, J. F. W., Laubach, S. E., Olson, J. E., Eichhubl, P., and Fall, A. (2017). Natural fractures in shale: A review and new observations. Bulletin 101 (8), 2165–2216. doi:10.1306/08121413151
Gu, Y., Ding, W. L., Tian, Q. T., Xu, S., Zhang, W., Zhang, B., et al. (2020). Developmental characteristics and dominant factors of natural fractures in lower silurian marine organic-rich shale reservoirs: A case study of the Longmaxi Formation in the fenggang block, southern China. J. Pet. Sci. Eng. 192, 107277. doi:10.1016/j.petrol.2020.107277
Han, C., Han, M., Jiang, Z., Han, Z., Li, H., Song, Z., et al. (2019). Source analysis of quartz from the Upper Ordovician and Lower Silurian black shale and its effects on shale gas reservoir in the southern Sichuan Basin and its periphery, China. Geol. J. 54 (1), 438–449. doi:10.1002/gj.3192
Han, C., Jiang, Z., Han, M., Wu, M., and Lin, W. (2016). The lithofacies and reservoir characteristics of the upper ordovician and lower silurian black shale in the southern Sichuan Basin and its periphery, China. Mar. Pet. Geol. 75 (4), 181–191. doi:10.1016/j.marpetgeo.2016.04.014
Han, L., Li, X., Guo, W., Ju, W., Cui, Y., Liu, Z., et al. (2022). Characteristics and dominant factors for natural fractures in deep shale gas reservoirs: A case study of the wufeng-longmaxi formations in luzhou block, southern China1. Lithosphere 2022, 9662175. doi:10.2113/2022/9662175
Han, M., Han, C., Han, Z., Song, Z., Zhong, W., Li, H., et al. (2018). Mineral compositional controls on the porosity of black shales from the Wufeng and Longmaxi Formations (Southern Sichuan Basin and its surroundings) and insights into shale diagenesis. Energy Explor. Exploitation 36 (4), 665–685. doi:10.1177/0144598718763890
He, S., Li, H., Qin, Q., and Long, S. (2021). Influence of mineral compositions on shale pore development of longmaxi formation in the dingshan area, southeastern sichuan basin, china. Energy fuels. 35 (6), 10551–10561. doi:10.1021/acs.energyfuels.1c01026
Huang, Z. Q., Zhang, Y., Xie, L. Z., and ZhaoHeRen, P. B. L. (2020). Comparative study of porosity test methods for shale. Arab. J. Geosci. 13 (2), 94. doi:10.1007/s12517-020-5086-5
Jarvie, D. M., Hill, R. J., Ruble, T. E., and Pollastro, R. M. (2007). Unconventional shale-gas systems: The Mississippian Barnett Shale of north-central Texas as one model for thermogenic shale-gas assessment. Am. Assoc. Pet. Geol. Bull. 91, 475–499. doi:10.1306/12190606068
Ji, W., Song, Y., Rui, Z., Meng, M., and Huang, H. (2017). Pore characterization of isolated organic matter from high matured gas shale reservoir. Int. J. Coal Geol. 174, 31–40. doi:10.1016/j.coal.2017.03.005
Lan, S. R., Song, D. Z., Li, Z. L., and Liu, Y. (2021). Experimental study on acoustic emission characteristics of fault slip process based on damage factor. J. Min. Strata Control Eng. 3 (3), 033024. doi:10.13532/j.jmsce.cn10-1638/td.20210510.002
Li, H. (2022). Research progress on evaluation methods and factors influencing shale brittleness: A review. Energy Rep. 8, 4344–4358. doi:10.1016/j.egyr.2022.03.120
Li, X., Zhu, H., Zhang, K., Li, Z., Yu, Y., Feng, X., et al. (2021). Pore characteristics and pore structure deformation evolution of ductile deformed shales in the Wufeng-Longmaxi Formation, southern China. Mar. Pet. Geol. 127, 104992. doi:10.1016/j.marpetgeo.2021.104992
Li, Y. F., Sun, W., Liu, X. W., Zhang, D. W., Wang, Y. C., and Liu, Z. Y. (2018). Study of the relationship between fractures and highly productive shale gas zones, Longmaxi Formation, Jiaoshiba area in eastern Sichuan. Pet. Sci. 15 (3), 498–509. doi:10.1007/s12182-018-0249-7
Li, Y., Zhou, D., Wang, W., Jiang, T., and Xue, Z. (2020). Development of unconventional gas and technologies adopted in China. Energy Geosci. 1 (1–2), 55–68. doi:10.1016/j.engeos.2020.04.004
Liang, Xiao, Mao, Z. Q., Zou, C. C., Jin, Y., and Zhu, J. C. (2016). A new methodology of constructing pseudo capillary pressure (Pc) curves from nuclear magnetic resonance (NMR) logs. J. Pet. Sci. Eng. 147, 154–167. doi:10.1016/j.petrol.2016.05.015
Liu, Z. S., Liu, D. M., Zhou, Y. F., Cai, Y., Yao, Y., and Pan, Z. (2020). Application of nuclear magnetic resonance (NMR) in coalbed methane and shale reservoirs: A review. Int. J. COAL Geol. 2020, 103261. doi:10.1016/j.coal.2019.103261
Loucks, R. G., Reed, R. M., Ruppel, S. C., and Hammes, U. (2012). Spectrum of pore types and networks in mudrocks and a descriptive classification for matrix-related mudrock pores. Am. Assoc. Pet. Geol. Bull. 96, 1071–1098. doi:10.1306/08171111061
Lv, D., Song, Y., Wang, Z., Cong, P., and Van Loon, A. J. T. (2020). The complex transgression and regression history of the northern margin of the Palaeogene Tarim Sea (NW China), and implications for potential hydrocarbon occurrences. Mar. Pet. Geol. 112, 104041. doi:10.1016/j.marpetgeo.2019.104041
Mou, C. L., Zhou, K. K., and Liu, W. (2011). Early Paleozoic sedimentary environment of hydrocarbon source rocks in the Middle-Upper Yangtze region and petroleum and gas exploration. Acta Geol. Sin. 85 (4), 526–532. doi:10.1007/s12583-011-0163-z
Qian, C., Li, X., Shen, W., Zhang, Q., Guo, W., Hu, Y., et al. (2022). Study on the pore structure and fractal characteristics of different lithofacies of Wufeng–Longmaxi Formation shale in southern Sichuan Basin, China. ACS Omega 7 (10), 8724–8738. doi:10.1021/acsomega.1c06913
Sing, K. S. W. (1985). Reporting physisorption data for gas/solid systems with special reference to the determination of surface area and porosity (Recommendations 1984). Pure Appl. Chem. 57 (4), 603–619. doi:10.1351/pac198557040603
Sondergeld, C. H., Ambrose, C. S., and Rai, J. (2010). “Micro-structural studies of gas shales,” in Paper presented at the SPE Unconventional Gas Conference, Pittsburgh, Pennsylvania, USA, February 23–25, 2010. SPE131771. doi:10.2118/131771-MS
Wang, Y., Dong, D., Yang, H., Wang, S., Huang, J., et al. (2013). Quantitative characterization of reservoir space in the lower silurian longmaxi shale, southern sichuan, China. Sci. China Earth Sci. 57 (2), 313–322. doi:10.1007/s11430-013-4645-y
Wang, Y., Wang, L., Wang, J., Jiang, Z., Wang, C. C., Fu, Y., et al. (2019). Multiscale characterization of three-dimensional pore structures in a shale gas reservoir: A case study of the longmaxi shale in Sichuan basin, China. J. Nat. Gas. Sci. Eng. 66, 207–216. doi:10.1016/j.jngse.2019.04.009
WangLiu, X. L., Wang, Y., Sheng, Y., Zheng, S., Wu, W., Luo, Z., et al. (2020). Comparison of the pore structures of lower silurian Longmaxi Formation shales with different lithofacies in the southern Sichuan Basin, China. J. Nat. Gas. Sci. Eng. 81, 103419. doi:10.1016/j.jngse.2020.103419
Xiang, J., Zhu, Y., Wang, Y., Chen, S., and Jiang, Z. (2022). Structural deformation and its pore-fracture system response of the Wufeng-Longmaxi shale in the Northeast Chongqing area, using FE-SEM, gas adsorption, and SAXS. J. Pet. Sci. Eng. 209, 109877. doi:10.1016/j.petrol.2021.109877
Xu, S., Hao, F., Shu, Z., Zhang, A., and Yang, F. (2020). Pore structures of different types of shales and shale gas exploration of the Ordovician Wufeng and Silurian Longmaxi successions in the eastern Sichuan Basin, South China. J. Asian Earth Sci. 193 (66), 104271. doi:10.1016/j.jseaes.2020.104271
Xu, X., Zeng, L., Tian, H., Ling, K., Che, S., Yu, X., et al. (2021). Controlling factors of lamellation fractures in marine shales: A case study of the fuling area in eastern Sichuan Basin, China. J. Petroleum Sci. Eng. 207, 109091. doi:10.1016/j.petrol.2021.109091
Yang, R., He, S., Yi, J., and Hu, Q. (2016). Nano-scale pore structure and fractal dimension of organic-rich Wufeng-Longmaxi shale from Jiaoshiba area, Sichuan Basin: Investigations using FE-SEM, gas adsorption and helium pycnometry. Mar. Pet. Geol. 70, 27–45. doi:10.1016/j.marpetgeo.2015.11.019
Yao, Y. B., Liu, D. M., Che, Y., Tang, D., Tang, S., and Huang, W. (2010). Petrophysical characterization of coals by low-field nuclear magnetic resonance (NMR). Fuel 89 (7), 1371–1380. doi:10.1016/j.fuel.2009.11.005
Yin, S., and Wu, Z. (2020). Geomechanical simulation of low-order fracture of tight sandstone. Mar. Pet. Geol. 100, 1–10. doi:10.1016/j.marpetgeo.2020.104359
Zeng, W., Zhang, J., Ding, W., Zhao, S., Zhang, Y., Liu, Z., et al. (2013). Fracture development in Paleozoic shale of Chongqing area (South China). Part one: Fracture characteristics and comparative analysis of main controlling factors. J. ASIAN EARTH Sci. 75, 251–266. doi:10.1016/j.jseaes.2013.07.014
Zhang, Q., Dong, Y., Liu, S., Elsworth, D., and Zhao, Y. (2017). Shale pore characterization using NMR Cryoporometry with octamethylcyclotetrasiloxane as the probe liquid. Energy fuels. 31 (7), 6951–6959. doi:10.1021/acs.energyfuels.7b00880
Zhang, X., Liu, C., Zhu, Y., Chen, S., Wang, Y., and Fu, C. (2015). The characterization of a marine shale gas reservoir in the lower Silurian Longmaxi Formation of the northeastern Yunnan Province, China. J. Nat. Gas. Sci. Eng. 27, 321–335. doi:10.1016/j.jngse.2015.08.070
Zhao, K. K., Jiang, P. F., Feng, Y. J., Sun, X. D., Cheng, L. X., and Zheng, J. W. (2021). Investigation of the characteristics of hydraulic fracture initiation by using maximum tangential stress criterion. J. Min. Strata Control Eng. 3 (2), 023520. doi:10.13532/j.jmsce.cn10-1638/td.20201217.001
Zhao, R., XueDong, H. Z., Lu, S., Li, J., Tian, S., wang, M., et al. (2022). Multi-scale pore structure characterization of lacustrine shale and its coupling relationship with material composition: An integrated study of multiple experiments. Mar. Pet. Geol. 140, 105648. doi:10.1016/j.marpetgeo.2022.105648
Keywords: sichuan basin, black shale, pore characteristics, CT, NMR
Citation: Han C, Zhang Y, Wang G, Li H, Zhang Z and Li Q (2022) Qualitative–quantitative multiscale pore characteristics of black shale from the Upper Ordovician and Lower Silurian black shale in the Southern Sichuan Basin, China. Front. Earth Sci. 10:981127. doi: 10.3389/feart.2022.981127
Received: 29 June 2022; Accepted: 19 July 2022;
Published: 13 September 2022.
Edited by:
Shuai Yin, Xi’an Shiyou University, ChinaReviewed by:
Qing Li, China University of Petroleum, ChinaChao Liang, China University of Petroleum, China
Copyright © 2022 Han, Zhang, Wang, Li, Zhang and Li. This is an open-access article distributed under the terms of the Creative Commons Attribution License (CC BY). The use, distribution or reproduction in other forums is permitted, provided the original author(s) and the copyright owner(s) are credited and that the original publication in this journal is cited, in accordance with accepted academic practice. No use, distribution or reproduction is permitted which does not comply with these terms.
*Correspondence: Zhihui Zhang, emh6aGlodWkwMUAxMjYuY29t