 Ikuo Katayama
 Masaki Yoshida
 Ken-ichi Hirauchi3
- 1Department of Earth and Planetary Systems Science, Hiroshima University, Hiroshima, Japan
- 2Volcanoes and Earth’s Interior Research Center, Research Institute for Marine Geophysics, Japan Agency for Marine-Earth Science and Technology (JAMSTEC), Yokosuka, Japan
- 3Department of Geosciences, Shizuoka University, Shizuoka, Japan
The breaking and bending of rigid and elastic lithosphere was probably essential for the initiation of plate subduction, although how this occurred is still poorly understood. Here we test effects of rheological stratification and elasticity of lithosphere on subduction initiation, which are possibly resulting from thermal cracking and seawater penetration into the lithosphere. In addition to the strong influence of water on rheological behavior, the material rigidity is also sensitive to the development of crack and fluid saturation. Numerical modeling indicates that water-weakening and a low-rigidity lithosphere are essential for the initiation of plate subduction, and such conditions are likely to have arisen on the early Earth due to extensive thermal contraction of the planet. Our results indicate that the formation of thermal cracks and penetration of seawater play an important role on subduction initiation, and are likely to have operated on planets other than Earth. However, if the ocean is disappeared, fluid penetration is likely to cease and plate tectonics would have stopped due to increasing the strength and rigidity of the lithosphere.
1 Introduction
Plate tectonics facilitates the recycling of materials, including carbon and water, into the Earth’s interior, and this has acted to stabilize the climate and nurtured biological evolution throughout geological history (e.g., Korenaga, 2013; Stern and Gerya, 2018). Although the physical mechanism that underlies plate tectonics is simple, being driven by the negative buoyancy of cold and dense lithosphere, the initiation of plate subduction requires the bending and breaking of strong lithosphere, which is difficult to achieve. The development of a weak zone within the lithospheres has been discussed in previous studies (e.g., Regenauer-Lieb et al., 2001; Hall et al., 2003; Bercovici and Ricard, 2014; Gerya et al., 2015); however, a major barrier to the initiation of subduction is achieving the flexural bending of rigid lithosphere that behaves elastically over geological timescales. Flexural rigidity is an indicator of bending capability and is controlled mainly by the elastic properties and rheological structure of the lithosphere (Watts et al., 2013; Turcotte and Schubert, 2014), indicating it is highly sensitive to crack development and fluid-rock interaction.
During the early history of Earth, rapid cooling due to the formation of an ocean likely resulted in the extensive formation of thermal cracks within the lithosphere. Simple viscoelastic models suggest that the accumulation of thermal stress could have created tensional cracks as deep as 50 km (Korenaga, 2007). These fractures could have facilitated the penetration of seawater, reduced the rigidity of the lithosphere, and enabled the development of weak zones that became plate boundaries (Figure 1). As a modern analogue, the plate-bending faults at close to trench cause fluid infiltration and serpentinization of the oceanic lithosphere that are inferred from low seismic velocity and high electrical conductivity (e.g., Fujie et al., 2013; Naif et al., 2015; Grevemeyer et al., 2018). A significant reduction of plate rigidity is suggested by the flexure modeling that simulates the bathymetric profiles toward the trench (Contreras-Reyes and Osses, 2010). However, the present-day hydration mechanism is a consequence of plate subduction, which cannot apply to the onset of subduction on the early Earth. Such that the extensive thermal contraction is one of the plausible mechanisms to reduce the strength and rigidity of the lithosphere. In this study, we test this hypothesis based on rock physics and thermomechanical modeling, examining how plate rigidity and the style of mantle convection are influenced by thermal cracking and fluid penetration.
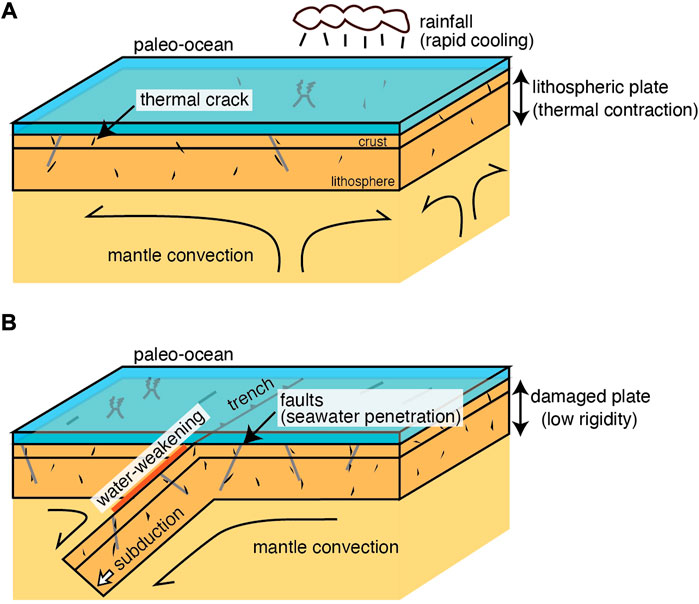
FIGURE 1. Schematic illustration of the initiation of plate tectonics. (A), Effective cooling of the lithospheric plate results in the development of thermal cracks. (B), Plate subduction can be triggered by water weakening due to penetration of seawater along fault zones and the low rigidity of the damaged lithosphere.
2 Plate strength model
2.1 Development of thermal cracks and its influence on elastic properties
Thermal cracks form when the thermal stress exceeds the material strength. Such cracks can develop over a wide range of scales, from the grain scale as a result of the different thermal expansivities of minerals (Kranz, 1983), to the geological scale due to cooling of the lithosphere (Turcotte, 1974). Given a thermal expansivity of 10–5 K−1, a bulk modulus of 100 GPa, and temperature difference of 1,000 °C, thermal stress can be created as high as 1 GPa, which is sufficiently large to fracture geological materials. Although such stress could be dissipated by viscous relaxation, the cold parts of lithosphere are strong enough to accumulate thermal stress according to the temperature-dependent viscosity (Korenaga, 2007). Such development of thermal cracks can change the elastic properties of the lithosphere.
The effective medium theory indicates that elastic properties of rocks are strongly dependent on crack density and crack geometry (e.g., Kuster and Toksöz, 1974; O’Connell and Budiansky, 1974; Kachanov et al., 1994). Figure 2 shows how Young’s and shear moduli change with crack porosity and crack aspect ratio. Laboratory experiments indicate the aspect ratio of ∼10–3 for thermal cracks developed in granitic rocks (Wang et al., 2013), suggesting that even small amounts of thermal crack can drastically decrease the elastic properties of materials (Figure 2). Although a large extrapolation is needed for the scale of cracks between laboratory and geological events, application of the effective medium theory indicates that a marked decrease in elastic properties is expected in a thermally damaged lithosphere.
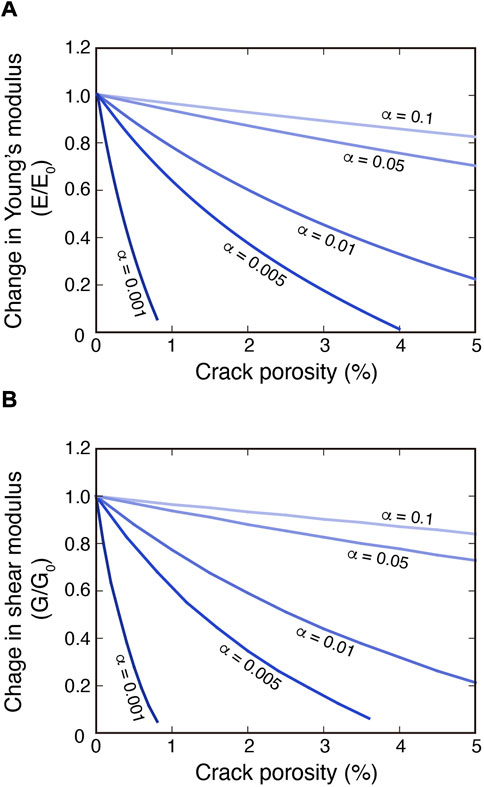
FIGURE 2. Effect of crack on elastic properties of rocks. Changes in Young’s modulus (A) and shear modulus (B) as a function of crack porosity (%) with different aspect ratio α, calculated from the effective medium theory of Kuster and Toksöz (1974).
2.2 Calculation of the plate strength
The plate strength is mainly controlled by brittle deformation at shallow depths, in which the strength is determined from the resistance to frictional sliding. The shear stress at which frictional sliding begins is proportional to the frictional coefficient and the normal stress applied to the fault plane. If faults are filled by aqueous fluids, pore fluid pressure reduces the effective normal stress acting on a fault plane, resulting in a decrease of the mechanical strength of the lithosphere. In the calculation of wet model, we assumed a hydrostatic pore pressure (pore fluid pressure ratio of λ = 0.3). Frictional coefficient is nearly constant for various materials under dry condition; however, hydrous phyllosilicates showed a markedly low frictional coefficient under fluid-bearing conditions (Moore and Lockner, 2007; Katayama et al., 2015; Hirauchi et al., 2016). Such that we calculated the brittle strength using frictional coefficient of µ = 0.6 for the dry model and µ = 0.1 for the wet model. These two effects, pore fluid pressure and low frictional coefficient, cause a marked decrease in the brittle strength of the lithosphere at fluid-saturated environment.
At deeper depths, plastic deformation becomes dominant as temperature increases with depths, and the plastic strength is calculated using flow laws. A commonly used flow law is the power-law relationship between strain rate (
where A is a pre-exponential factor, d is grain size, H is activation enthalpy (H = E + PV, where E is activation energy, V is activation volume and P is pressure), T is temperature, and R is the gas constant. If deformation is controlled by diffusion creep, the stress and grain-size exponents are n = 1 and m = 3, respectively, whereas dislocation creep is insensitive to grain-size and has the stress exponent of n ∼3 (e.g., Kohlstedt et al., 1995). This relationship is commonly used to calculate the plastic strength of lithosphere; however, the power-law creep has limitations under certain conditions (Tsenn and Carter, 1987). Under high stress, the stress dependence of activation enthalpy becomes important, and the appropriate flow law is changed to
where
Figure 3 shows the plastic strength of each creep mechanism including the effect of backward motion in the Peierls creep. Plastic deformation is generally controlled by the weakest constituent mineral, and we used flow laws of plagioclase and olivine to calculate the plastic strength of crust and mantle, respectively. Given that water has a strong influence on plastic deformation, the flow parameters determined under dry and fluid-saturated conditions were applied for the dry and wet models (Table 1). To calculate the strength profile, we assumed a constant strain rate of 10–15, 10–16, or 10–17 s−1 and a grain size of 1 mm, noting that these values have little influence on the lithospheric strength (Figure 4). We also applied the flow parameters determined by the Bayesian statistics (Jain et al., 2017), which gives a slightly lower yield stress, but the overall shape of the strength envelope does not change.
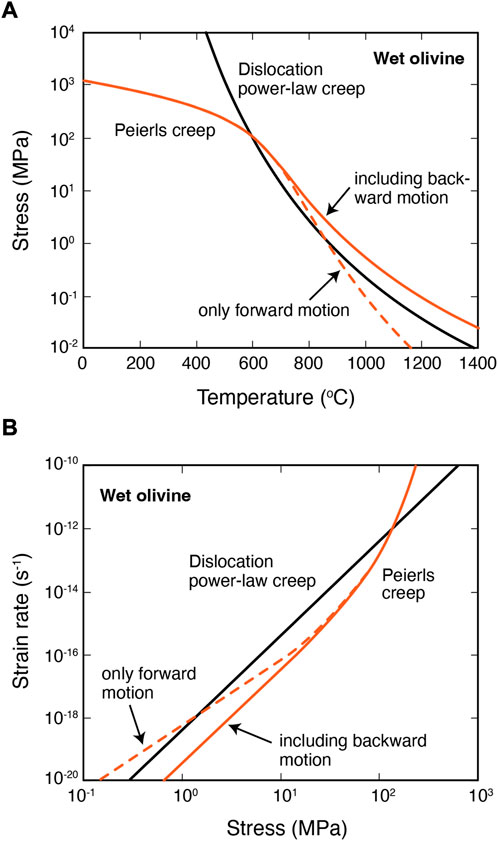
FIGURE 3. Relationship between stress and temperature for wet olivine calculated using a constant strain rate of 10–15 s−1 (A). Peierls creep dominates at low temperatures. Relationship between strain rate and stress for wet olivine calculated using a temperature of 700 °C (B). Calculation without backward direction results in a crossover of Peierls at low stress.
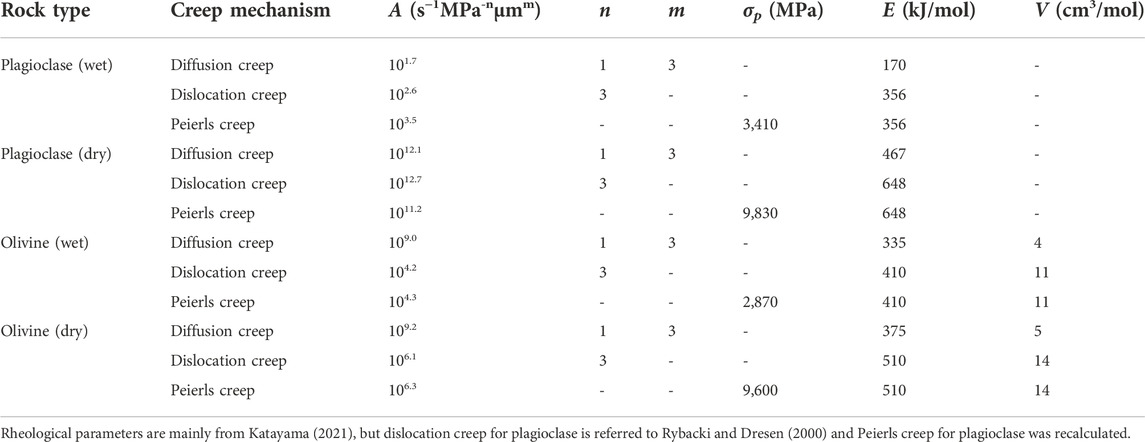
TABLE 1. Flow law parameters used to calculate plastic strength.
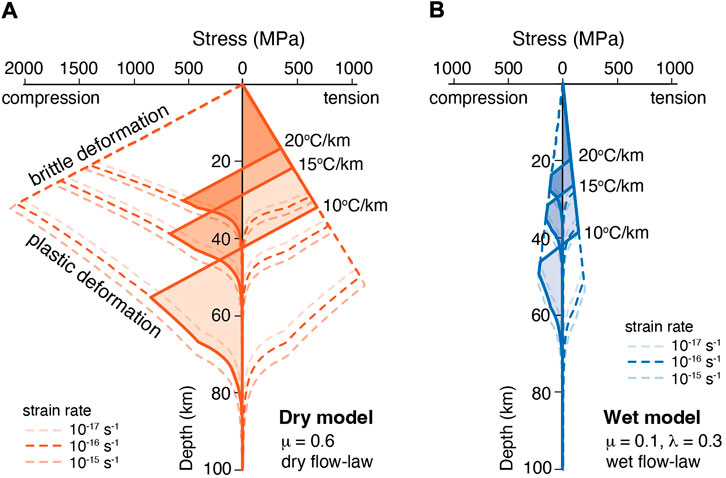
FIGURE 4. Strength profiles of lithosphere for dry (A) and wet (B) models. Plastic strengths for variable thermal gradients calculated using different strain rates of 10–15, 10–16 and 10–17 s−1. A flexural curvature of 5×10⁻⁷ m−1 was assumed, and positive and negative stresses correspond to tension and compression, respectively. The bending moment was calculated via a balance between tensional and compressional forces within the flexed lithosphere (shaded area). The depth of Moho was assumed to be 20 km, in which the crustal thickness could be thicker during Archean than that of the present-day oceanic crust.
2.3 Calculation of the flexural rigidity
On the geological time scales, the lithosphere behaves as an elastic layer. However, a purely elastic behavior, i.e., linear stress distribution, is unrealistic because the constituting rocks are deformed by frictional sliding in the upper parts and by plastic creep in the lower parts as illustrated in the strength envelope of lithosphere (Figure 4). Such that the flexure of the lithosphere has been discussed using a rheologically layered model; in this case flexural rigidity is obtained by numerical integration of the bending moment in the lithosphere (e.g., Goetze and Evans, 1979; McNutt, 1984). The bending moment must be balanced between tensional and compressional forces in the lithosphere, and is given by,
where Tm is the mechanical thickness of the lithosphere, σ(z) is the strength at depth z, and zn is the depth of the neutral stress plane where the stress field switches from tension to compression or vice versa. The analytical solution for the bending moment of lithosphere is expressed as,
where E is Young’s modulus, ν is Poisson’s ratio, K is flexural curvature, and h is elastic thickness (McNutt, 1984). This relationship is used to calculate the flexural rigidity D, which is expressed as the bending moment divided by the curvature (D = M/K). Because the bending moment of lithosphere is strongly dependent on the mechanical strength at depths close to the brittle-plastic transition, the incorporation of Peierls creep makes a large contribution to the estimate of flexural rigidity. Mechanical strength in both brittle and plastic regimes is highly dependent on the presence of water, such that a marked change in the bending moment is expected between the dry and wet models. In addition to strength weakening by the penetration of seawater, the presence of thermal cracks can markedly change the elasticity of the lithosphere. Consequently, the flexural rigidity is strongly reduced in the wet model (Figure 5), indicating that the flexure of an elastic layer would be substantially enhanced in a thermally damaged lithosphere, thereby promoting the initiation of plate subduction.
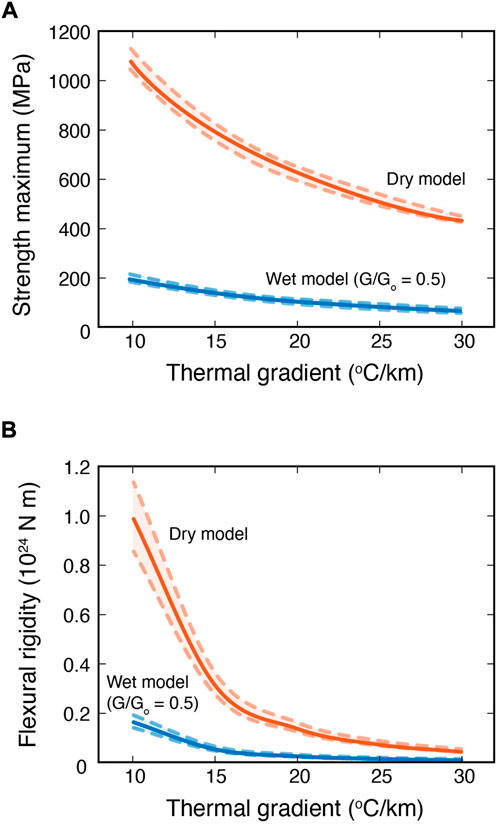
FIGURE 5. Maximum strength (A) and flexural rigidity of lithosphere (B) calculated in the dry and wet models as shown in Figure 4. In the wet model, the shear modulus was assumed to be half that of the dry model. Solid lines represent calculations using a strain rate of 10–16 s−1, and dashed lines show variations in strain rates between 10–15 and 10–17 s−1.
3 Numerical modeling of plate subduction
We have tested how strength weakening and flexural rigidity of the lithosphere influence the style of plate subduction using thermomechanical numerical simulations. The computational domain of the numerical model was filled by a fluid with visco-elasto-plastic rheology in 2-D Cartesian geometry (e.g., Liao and Gerya, 2014; Yoshida et al., 2020). The width and depth of the model were 750 km and 310 km along the horizontal (x) and vertical (z) directions, respectively (Figure 6). The thermo-chemical convection of the fluid was solved using the finite-difference and a marker-in-cell methods. The grid interval of the computational grid was uniform through the entire domain and set as 2 km for the x and z directions. The number of tracer markers in the entire domain was 750 × 310 for the x and z directions, respectively, which is equivalent to an average tracer density of 1 km in both directions.
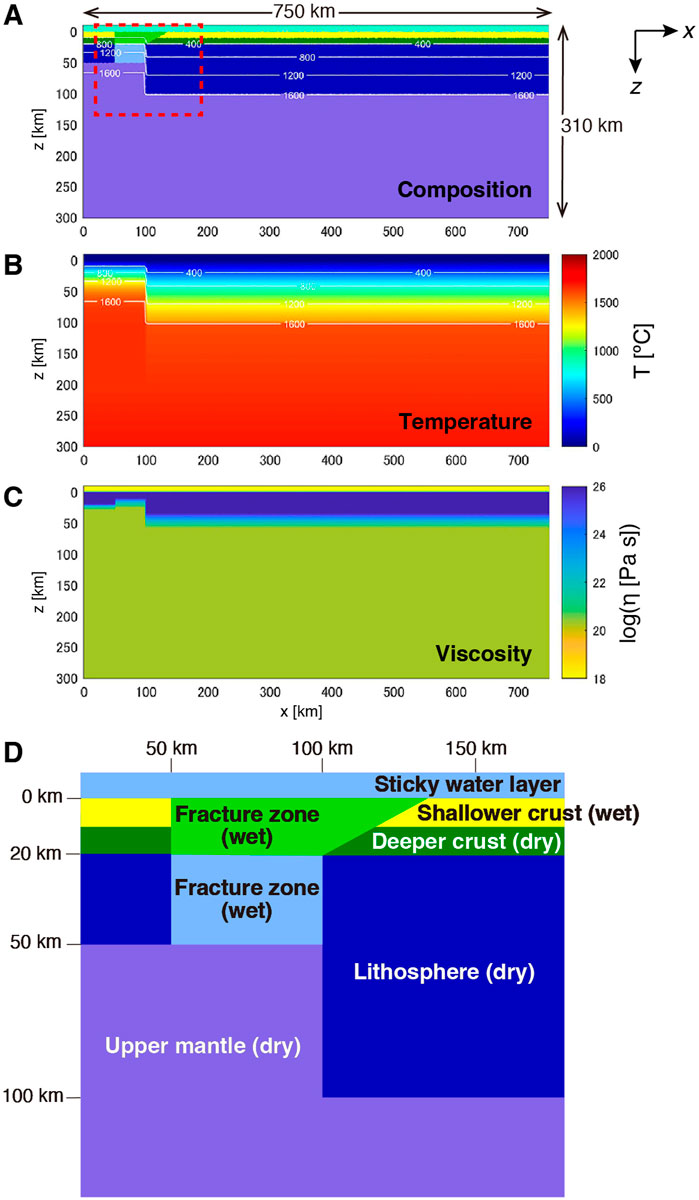
FIGURE 6. Initial condition for the numerical simulation. (A) Composition field (B) temperature field (C) viscosity structure, and (D) a close-up view of the area enclosed by the dashed red rectangle in (A). The computational domain comprised shallower and deeper crustal layers with the same thickness of 10 km and the underlying lithosphere with a variable thickness: the depths of the bottom of the right and left lithospheres were set to 100 km and 50 km, respectively. White contours represent isotherms with a contour interval of 400 °C.
The boundaries of the computational domain were set as being shear-stress free and impermeable. Isothermal boundary conditions were imposed on the top and bottom surface boundaries (0 °C and 1700 °C, respectively), and a symmetric condition was imposed on the side boundaries. Considering that the reference temperature of the Archean mantle is about 200 °C higher than that of the present-day mantle (Korenaga, 2013), the potential temperature at the top surface was set to 1,550 °C. The initial condition of the thermal state above the bottom of the lithosphere was based on the half-space cooling model (Turcotte and Schubert, 2014), and the adiabatic thermal gradient in the upper mantle was set to 0.5 °C km−1.
We set up a calculation domain containing shallower and deeper crustal layers, the lithosphere, and the upper mantle with a localized fracture zone caused by extensive cracking and water penetration (Figure 6D). A sticky water layer with a thickness of 10 km and a constant viscosity of 1018 Pa s was included in the topmost part of the computational domain to enable free surface deformation (e.g., Schmeling et al., 2008). The viscosity except for the sticky water layer was determined by the flow law parameters shown in Table 1 and was truncated between ηum and 1026 Pa s, where ηum is a free parameter that controls the upper mantle viscosity. The physical properties of each rock type in the numerical model are listed in Table 2.
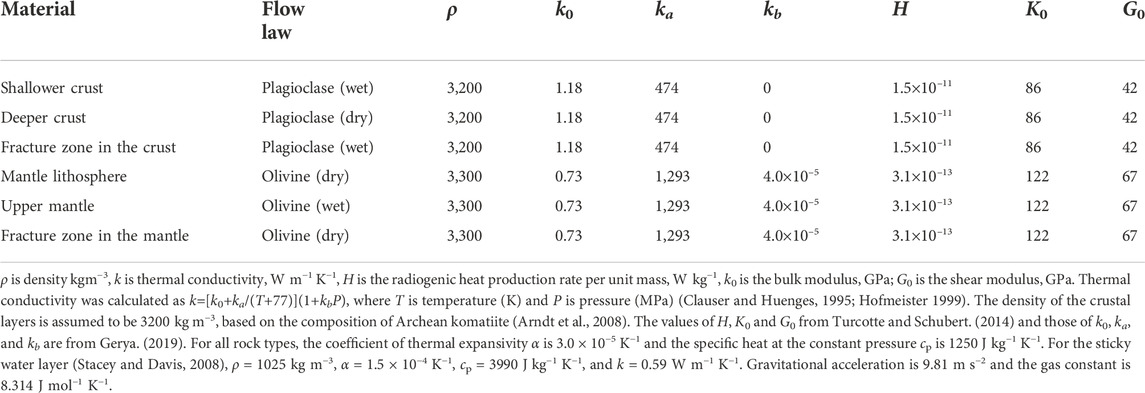
TABLE 2. Physical parameters used in the numerical simulation.
For the visco-elasto-plastic rheology used in the numerical modeling, the deviatoric strain rate
where
where the dislocation power-law creep and Peierls creep are both related to the dislocation motion and do not operate simultaneously; therefore, the faster one is a rate-controlling mechanism (e.g., Frost and Ashby, 1982). The shallower crust is assumed to be fluid-saturated conditions with µ = 0.1 and λ = 0.9, whereas the deeper crust and mantle are assumed to be dry conditions with µ = 0.6. The cohesion of the lithosphere and upper mantle was set to 50 MPa. As seawater can penetrate along the fracture networks easily, the wet rheology with a low frictional coefficient was used for the fracture zone. In addition to the water weakening, we tested how the style of subduction is affected by the elasticity of the lithosphere, using different shear moduli G/G0 = 1 to 0.1, where G0 is the reference shear modulus. Note that both G and E are both sensitive to the development of cracks, and the changes in G show a similar trend as in E (Figure 2).
Figure 7 shows the results of numerical modeling for the wet model with different plate rigidity. The upper mantle viscosity ηum was assumed to be 2×10²⁰ Pa s. Even though water weakening in the fracture zone is considered in the models, bending of the lithosphere does not occur in the model with strong rigidity (G/G0 = 1); consequently, plate subduction is not initiated even after a long duration (Figure 7A). However, for the models with G/G0 = 0.5, the viscoelastic instability overcomes the barrier of flexural bending, resulting in subduction initiation within the weak fracture zone (Figure 7B). Subduction is further facilitated in the model with a lower rigidity (G/G0 = 0.2) (Figure 7C). Note that for the model with G/G0 = 1 (Figure 7D), no further initiation of subduction was observed even after a sufficiently long time (∼50 Myr), during which secondary downwelling plumes are fully developed owing to the thermal instability at the base of the stagnant lithosphere (e.g., Solomatov and Moresi, 2000).
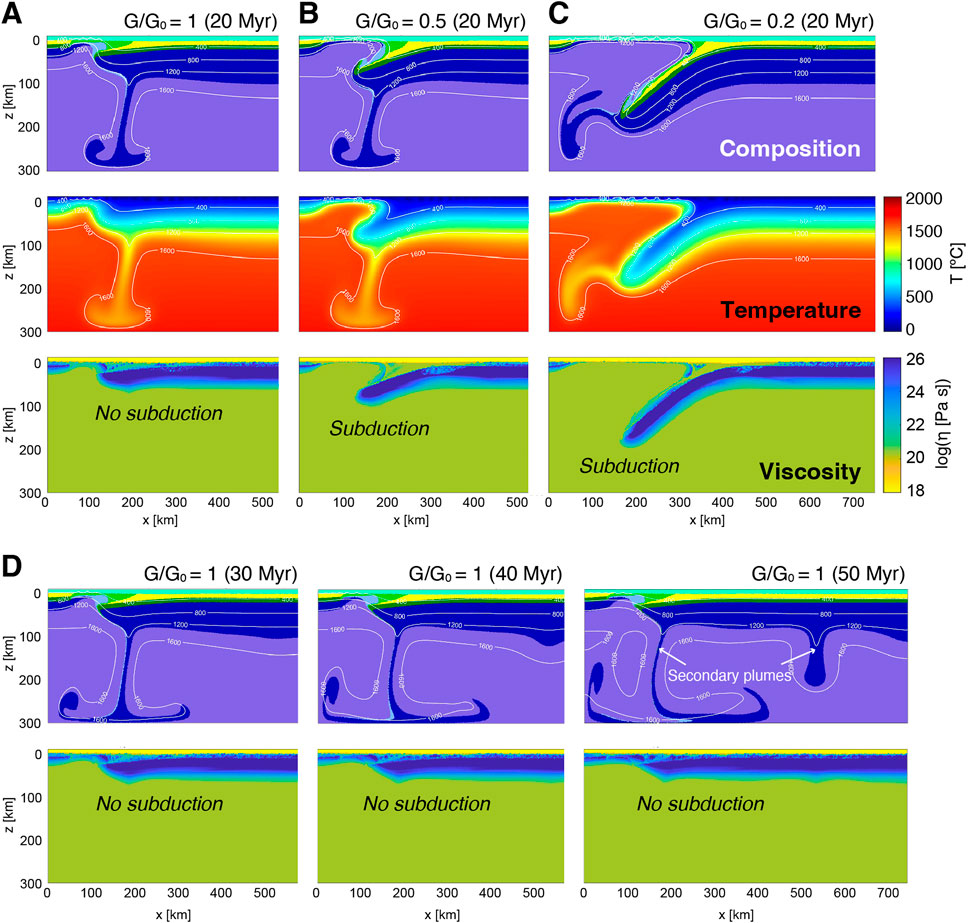
FIGURE 7. Results of numerical modeling for wet condition with different values of plate rigidity. (A–C) Snapshot of simulation results using (A) G/G0 = 1 (B) G/G0 = 0.5, and (C) G/G0 = 0.2 at 20 Myr after the start of the simulation. From top to bottom, the composition field, the temperature field, and the viscosity structure are shown. Plate subduction occurs in cases (B) and (C,D) Snapshot of simulation results using G/G0 = 1 at 30, 40, and 50 Myr after the start of the simulation. The upper mantle viscosity ηum was assumed to be 2×10²⁰ Pa s.
Here, to see the effect of wet condition in the shallower crust on the subduction initiation, we have performed additional models in which the shallower crust is composed of the dry rheology same as the deeper crust, keeping the fracture zone under wet condition (Figure 8). The upper mantle viscosity ηum was assumed to be 2×10²⁰ Pa s same as the wet model. In the case that the shallower and deeper crusts have the dry condition, plate subduction did not occur even for G/G0 = 0.2 (Figure 8C), which suggests that water penetration into the shallower crust is essential for plate subduction. In such a dry model, the behavior of the stagnant lithosphere had little effect on G/G0, because little deformation of the fracture zone occurs; consequently, plate subduction did not occur after a long duration even for the model with G/G0 = 0.2 (Figure 8D).
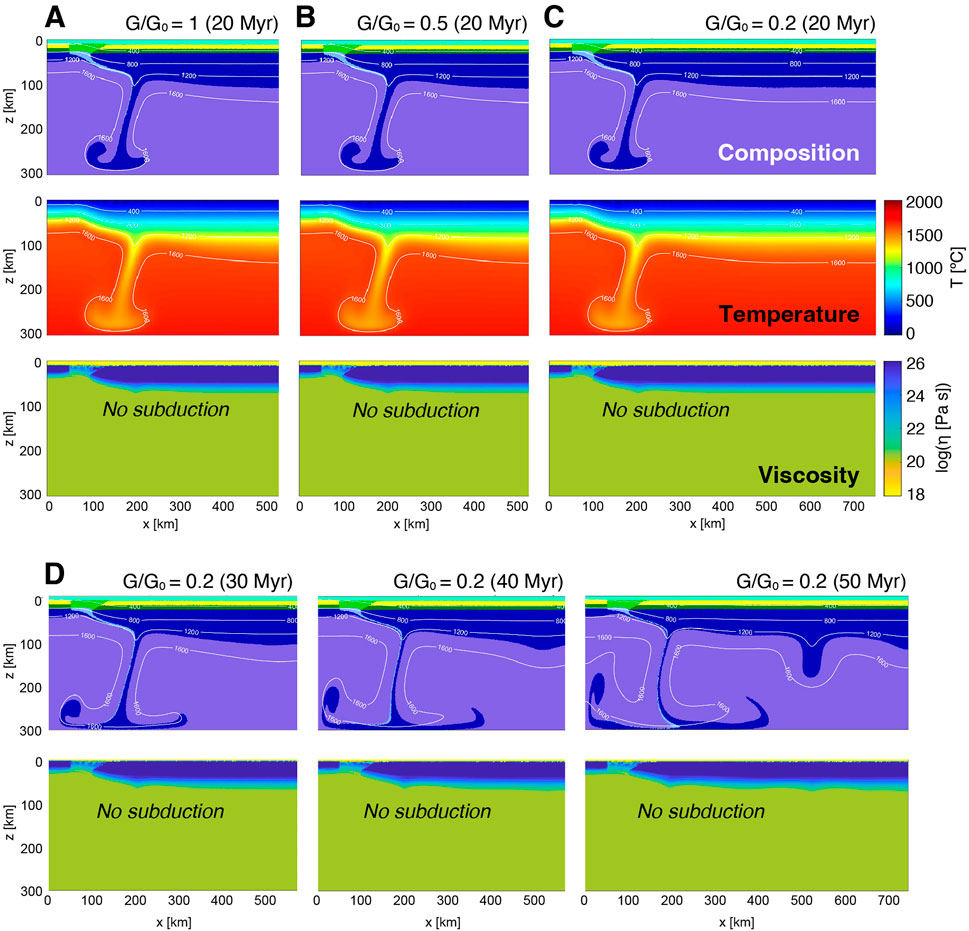
FIGURE 8. Results of numerical modeling for dry condition in both shallower and deeper crust. (A–C) Snapshot of simulation results using (A) G/G0 = 1 (B) G/G0 = 0.5, and (C) G/G0 = 0.2 at 20 Myr after the start of the simulation. Plate subduction does not occur in any cases (D) Snapshot of simulation results using G/G0 = 0.2 at 30, 40, and 50 Myr after the start of the simulation. The upper mantle viscosity ηum was assumed to be 2×10²⁰ Pa s same as the wet model.
On the other hand, in the wet model, the subduction style is roughly classified into three regimes as a function of G/G0, and the upper mantle viscosity ηum (Figure 9). Our numerical results demonstrate that the possibility of subduction depends also on the upper mantle viscosity because it is achieved by a balance between the negative buoyancy of subducting plate and the viscous resistance acting on the edge of subducting plate. As the rigidity of lithosphere is reduced, the range of the upper mantle where subduction occurs tends to increase. The upper mantle viscosity for realizing the plate subduction is 3×10²⁰ Pa s or lower for the models with G/G0 ≥ 0.2, which is comparable to the average viscosity of the upper mantle obtained from a recent study on glacial isostatic adjustment (Argus et al., 2021).
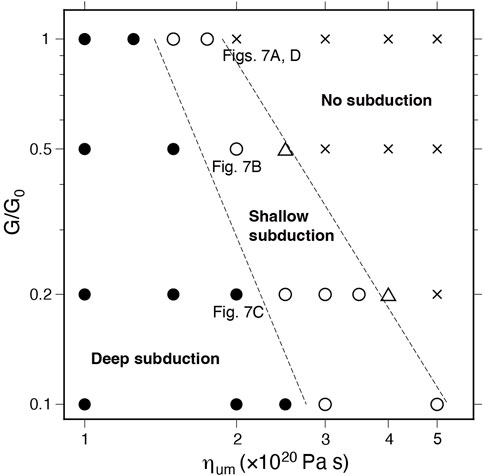
FIGURE 9. Regime diagram showing subduction style in the wet model as a function of upper mantle viscosity ηum and G/G0. Solid circles indicate that the subducting plates reaches the deeper part of the upper mantle, whereas open circles indicate that the plate becomes stagnant in the shallower part of the upper mantle (i.e., at a depth of ∼100 km). Crosses indicate that plate subduction does not occur, and open triangles represent intermediate regions between the subduction and no-subduction regimes. Dashed lines indicate the approximate boundaries between regimes with different subduction styles.
4 Discussions
4.1 Possible existence of damaged lithosphere
Our results indicate that plate subduction is facilitated by strength weakening and low flexural rigidity, which can be accomplished by the development of thermal cracks in the lithosphere and the penetration of seawater into the fracture zone. Thermal cracks were possibly widespread on the early Earth due to a large thermal contrast in the lithosphere; however, it is difficult to prove the existence of damaged lithosphere in the past. The present-day oceanic lithosphere exhibits intraplate seismicity depths down to ∼50 km (e.g., Wiens and Stein, 1983). These events are away from the plate boundaries, and are possibly related to contraction cracks that relieve the thermal stress in the cooling lithosphere (Turcotte, 1974). In the ophiolite sequences where the paleo-oceanic plates were emplaced, the developments of microcracks in the deeper sections were likely associated with anisotropic thermal contraction during cooling (e.g., Nicolas et al., 2003). These crack networks would be the main mechanisms favoring pervasive seawater penetration into the deep oceanic crust possibly down to the mantle. In the regions close to the trench, low seismic velocity and high electrical conductivity were observed in the relatively old oceanic lithosphere, suggesting the seawater penetration into the mantle depths along the fracture zones (e.g., Fujie et al., 2013; Naif et al., 2015; Grevemeyer et al., 2018). Although these are associated with the tensional stress due to the plate bending, the elastic properties can be influenced by the fracture developments and water infiltration. In fact, the significant reduction of flexural rigidity is indicated at close to the trench, most likely caused by the weakening of the oceanic lithosphere due to the hydration along the bending-related faults (Contreras-Reyes and Osses, 2010).
4.2 Subduction initiation on early earth and potential on other planets
It is widely accepted that the key process for subduction initiation is the formation of a weak plate boundary, although the weakening mechanism remains controversial (e.g., Regenauer-Lieb et al., 2001; Hall et al., 2003; Bercovici and Ricard, 2014; Gerya et al., 2015). Plate tectonics operates only on Earth, which differs from the other terrestrial planets in having liquid oceans, suggesting that water could play an important role in subduction initiation. However, we must avoid explaining the initiation of plate subduction by a hydration process that itself requires the operation of plate tectonics (Lu et al., 2021). In this sense, thermal cracking is the most plausible mechanism of deep fluid penetration and weakening of the lithosphere (Korenaga, 2007). Our results indicate that weakening coupled with a low flexural rigidity is essential for the initiation of plate subduction; in contrast, most previous models have considered the weakening effect but not changes in plate rigidity (e.g., Regenauer-Lieb et al., 2001; Hall et al., 2003; Bercovici and Ricard, 2014; Gerya et al., 2015). Thielmann and Kaus (2012) considered that subduction initiation was caused by buckling and shear heating associated with a low shear modulus, although these authors did not discuss the mechanism that leads to reduce plate elasticity.
We propose that both thermal contraction and seawater penetration are required for the operation of plate tectonics, and that these conditions were possibly achieved in the other terrestrial planets during their early stage of history. On Mars, the former presence of a global ocean has been inferred from geomorphology (Baker et al., 1991) and widespread occurrence of clay minerals (Ehlmann et al., 2011). The hemispheric dichotomy of the Martian topography might be attributed to the ancient operation of plate tectonics (Zuber, 2001), which might have ceased as the ocean disappeared. A similar situation might have occurred on Venus, where an ancient ocean is expected to have existed, if the initial water endowment was similar to that of Earth (Kasting, 1988). Thus, the plate tectonics may be a ubiquitous feature of rocky planets in their early history, but its operation timescales are dependent on the presence of liquid ocean.
Data availability statement
The datasets presented in this study can be found in online repositories. The names of the repository/repositories and accession number(s) can be found below: Hiroshima University Institutional Repository (https://ir.lib.hiroshima-u.ac.jp/ja/00052830).
Author contributions
IK designed the projects and calculated the plate strength and rigidity, and MY conducted the numerical modeling. All authors discussed the results and their implications.
Funding
This study was supported by the Japan Society for the Promotion of Science (20H00200).
Acknowledgments
We thank two reviewers for various comments, which greatly improved the manuscript.
Conflict of interest
The authors declare that the research was conducted in the absence of any commercial or financial relationships that could be construed as a potential conflict of interest.
Publisher’s note
All claims expressed in this article are solely those of the authors and do not necessarily represent those of their affiliated organizations, or those of the publisher, the editors and the reviewers. Any product that may be evaluated in this article, or claim that may be made by its manufacturer, is not guaranteed or endorsed by the publisher.
References
Argus, D. F., Peltier, W. R., Blewitt, G., and Kreemer, C. (2021). The viscosity of the top third of the lower mantle estimated using GPS, GRACE, and relative sea level measurements of glacial isostatic adjustment. J. Geophys. Res. 126, e2020JB021537. doi:10.1029/2020JB021537
Arndt, N., Lesher, C. M., and Barnes, S. J. (2008). Komatiite. London, UK: Cambridge Univ. Press, 467.
Baker, V. R., Strom, R. G., Gulick, V. C., Kargel, J. S., Komatsu, G., and Kale, V. S. (1991). Ancient oceans, ice sheets and the hydrological cycle on Mars. Nature 352, 589–594. doi:10.1038/352589a0
Bercovici, D., and Ricard, Y. (2014). Plate tectonics, damage and inheritance. Nature 508, 513–516. doi:10.1038/nature13072
Clauser, C., and Huenges, E. (1995). “Thermal conductivity of rocks and minerals,” in Rock physics and Phase Relations, 105–126.
Contreras-Reyes, E., and Osses, A. (2010). Lithospheric flexure modelling seaward of the Chile trench: Implications for oceanic plate weakening in the trench outer Rise region. Geophys. J. Int. 182, 97–112. doi:10.1111/j.1365-246X.2010.04629.x
Ehlmann, B. L., Mustard, J. F., Murchie, S. L., Bibring, J. P., Meunier, A., Fraeman, A. A., et al. (2011). Subsurface water and clay mineral formation during the early history of Mars. Nature 479, 53–60. doi:10.1038/nature10582
Frost, H. J., and Ashby, M. F. (1982). Deformation-mechanism maps: The plasticity and creep of metals and ceramics. Pergamon Press, 166.
Fujie, G., Kodaira, S., Yamashita, M., Sato, T., Takahashi, T., and Takahashi, N. (2013). Systematic changes in the incoming plate structure at the Kuril trench. Geophys. Res. Lett. 40 (1), 88–93. doi:10.1029/2012GL054340
Gerya, T. (2019). Introduction to numerical geodynamic modelling. 2nd Edition. London, UK: Cambridge Univ. Press, 358.
Gerya, T., Stern, R., Baes, M., Sobolev, S., and Whattam, S. (2015). Plate tectonics on the Earth triggered by plume-induced subduction initiation. Nature 527, 221–225. doi:10.1038/nature15752
Goetze, C., and Evans, B. (1979). Stress and temperature in the bending lithosphere as constrained by experimental rock mechanics. Geophys. J. Int. 59, 463–478. doi:10.1111/j.1365-246x.1979.tb02567.x.1111/j.1365-246X.1979.tb02567.x
Grevemeyer, I., Ranero, C. R., and Ivandic, M. (2018). Structure of oceanic crust and serpentinization at subduction trenches. Geosphere 14 (2), 395–418. doi:10.1130/GES01537.1
Hall, C. E., Gurnis, M., Sdrolias, M., Lavier, L. L., and Müller, R. D. (2003). Catastrophic initiation of subduction following forced convergence across fracture zones. Earth Planet. Sci. Lett. 212, 15–30. doi:10.1016/S0012-821X(03)00242-5
Hirauchi, K., Fukushima, K., Kido, M., Muto, J., and Okamoto, A. (2016). Reaction-induced rheological weakening enables oceanic plate subduction. Nat. Commun. 7, 12550. doi:10.1038/ncomms12550
Hofmeister, A. M. (1999). Mantle values of thermal conductivity and the Geotherm from Phonon Lifetimes. Science 283, 1699–1706. doi:10.1126/science.283.5408.1699
Jain, C., Korenaga, J., and Karato, S. (2017). On the yield strength of oceanic lithosphere. Geophys. Res. Lett. 44, 9716–9722. doi:10.1002/2017gl075043
Kachanov, M., Tsukrov, I., and Shafiro, B. (1994). Effective moduli of solids with cavities of various shapes. Appl. Mech. Rev. 47, S151–S174. doi:10.1115/1.3122810
Kasting, J. F. (1988). Runaway and moist greenhouse atmospheres and the evolution of Earth and Venus. Icarus 74, 472–494. doi:10.1016/0019-1035(88)90116-9
Katayama, I., Kubo, T., Sakuma, H., and Kawai, K. (2015). Can clay minerals account for the behavior of non-asperity on the subducting plate interface? Prog. Earth Planet. Sci. 2, 30. doi:10.1186/s40645-015-0063-4
Katayama, I. (2021). Strength models of the terrestrial planets and implications for their lithospheric structure and evolution. Prog. Earth Planet. Sci. 8, 1. doi:10.1186/s40645-020-00388-2
Kohlstedt, D., Evans, B., and Mackwell, S. (1995). Strength of the lithosphere: Constraints imposed by laboratory experiments. J. Geophys. Res. 100, 17587–17602. doi:10.1029/95jb01460
Korenaga, J. (2013). Initiation and evolution of plate tectonics on Earth: Theories and observations. Annu. Rev. Earth Planet. Sci. 41, 117–151. doi:10.1146/annurev-earth-050212-124208
Korenaga, J. (2007). Thermal cracking and the deep hydration of oceanic lithosphere: A key to the generation of plate tectonics? J. Geophys. Res. 112, B05408. doi:10.1029/2006JB004502
Kranz, R. L. (1983). Microcracks in rocks: A review. Tectonophysics 100, 449–480. doi:10.1016/0040-1951(83)90198-1
Kuster, G. T., and Toksöz, M. N. (1974). Velocity and attenuation of seismic waves in two-phase media: Part I. Theoretical formulations. Geophysics 39, 587–606. doi:10.1190/1.1440450
Liao, J., and Gerya, T. (2014). Influence of lithospheric mantle stratification on craton extension: Insight from two-dimensional thermo-mechanical modeling. Tectonophysics 631, 50–64. doi:10.1016/j.tecto.2014.01.020
Lu, G., Zhao, L., Chen, L., Wan, B., and Wu, F. (2021). Reviewing subduction initiation and the origin of plate tectonics: What do we learn from present-day Earth? Earth Planet. Phys. 5, 123–140. doi:10.26464/epp2021014
McNutt, M. K. (1984). Lithospheric flexure and thermal Anomalies. J. Geophys. Res. 89, 11180–11194. doi:10.1029/JB089iB13p11180
Moore, D. E., and Lockner, D. A. (2007). in Friction of the smectite clay montmorillonite. The Seismogenic zone of subduction Thrust faults. Editors T. Dixon, and C. Moore (New York: Columbia Univ. Press), 317–345.
Naif, S., Key, K., Constable, S., and Evans, R. L. (2015). Water-rich bending faults at the middle America trench. Geochem. Geophys. Geosyst. 16, 2582–2597. doi:10.1002/2015GC005927
Nicolas, A., Mainprice, D., and Boudier, F. (2003). High-temperature seawater circulation throughout crust of oceanic ridges: A model derived from the Oman ophiolites. J. Geophys. Res. 108, 2371. doi:10.1029/2002JB002094
O’Connell, R. J., and Budiansky, B. (1974). Seismic velocities in dry and saturated cracked solids. J. Geophys. Res. 79, 5412–5426. doi:10.1029/jb079i035p05412
Regenauer-Lieb, K., Yuen, D. A., and Branlund, J. (2001). The initiation of subduction: Criticality by addition of water? Science 294, 578–580. doi:10.1126/science.1063891
Rybacki, E., and Dresen, G. (2000). Dislocation and diffusion creep of synthetic anorthite aggregates. J. Geophys. Res. 105, 26017–26036. doi:10.1029/2000jb900223
Schmeling, H., Babeyko, A. Y., Enns, A., Faccenna, C., Funiciello, F., Gerya, T., et al. (2008). A benchmark comparison of spontaneous subduction models–Towards a free surface. Phys. Earth Planet. Interiors 171, 198–223. doi:10.1016/j.pepi.2008.06.028
Solomatov, V. S., and Moresi, L. N. (2000). Scaling of time-dependent stagnant lid convection: Application to small-scale convection on Earth and other terrestrial planets. J. Geophys. Res. 105, 21795–21817. doi:10.1029/2000jb900197
Stacey, F. D., and Davis, P. M. (2008). Physics of the Earth. 4th ed. London, UK: Cambridge Univ. Press, 532.
Stern, R. J., and Gerya, T. (2018). Subduction initiation in nature and models: A review. Tectonophysics 746, 173–198. doi:10.1016/j.tecto.2017.10.014
Thielmann, M., and Kaus, B. J. (2012). Shear heating induced lithospheric-scale localization: Does it result in subduction? Earth Planet. Sci. Lett. 359, 1–13. doi:10.1016/j.epsl.2012.10.002
Tsenn, M. C., and Carter, N. L. (1987). Upper limits of power law creep of rocks. Tectonophysics 136, 1–26. doi:10.1016/0040-1951(87)90332-5
Turcotte, D. L. (1974). Are transform faults thermal contraction cracks? J. Geophys. Res. 79, 2573–2577. doi:10.1029/jb079i017p02573
Turcotte, D. L., and Schubert, G. (2014). Geodynamics. 3rd ed. London, UK: Cambridge Univ. Press, 636.
Wang, X. Q., Schubnel, A., Fortin, J., Guéguen, Y., and Ge, H. K. (2013). Physical properties and brittle strength of thermally cracked granite under confinement. J. Geophys. Res. Solid Earth 118, 6099–6112. doi:10.1002/2013JB010340
Watts, A. B., Zhong, S. J., and Hunter, J. (2013). The behavior of the lithosphere on seismic to geologic timescales. Annu. Rev. Earth Planet. Sci. 41, 443–468. doi:10.1146/annurev-earth-042711-105457
Wiens, D. A., and Stein, S. (1983). Age dependence of oceanic intraplate seismicity and implications for lithospheric evolution. J. Geophys. Res. 88, 6455–6468. doi:10.1029/JB088iB08p06455
Yoshida, M., Saito, S., and Yoshizawa, K. (2020). Dynamics of continental lithosphere extension and passive continental rifting from numerical experiments of visco-elasto-plastic thermo-chemical convection in 2-D Cartesian geometry. Tectonophysics 796, 228659. doi:10.1016/j.tecto.2020.228659
Keywords: plate rigidity, thermal crack, water weakening, early earth, subduction initiation
Citation: Katayama I, Yoshida M and Hirauchi K-i (2022) Effects of rheological stratification and elasticity of lithosphere on subduction initiation. Front. Earth Sci. 10:988320. doi: 10.3389/feart.2022.988320
Received: 07 July 2022; Accepted: 01 November 2022;
Published: 17 November 2022.
Edited by:
John Hernlund, Tokyo Institute of Technology, JapanReviewed by:
Bernhard Maximilian Steinberger, GFZ German Research Centre for Geosciences, GermanyMasanori Kameyama, Ehime University, Japan
Copyright © 2022 Katayama, Yoshida and Hirauchi. This is an open-access article distributed under the terms of the Creative Commons Attribution License (CC BY). The use, distribution or reproduction in other forums is permitted, provided the original author(s) and the copyright owner(s) are credited and that the original publication in this journal is cited, in accordance with accepted academic practice. No use, distribution or reproduction is permitted which does not comply with these terms.
*Correspondence: Ikuo Katayama, a2F0YXlhbWFAaGlyb3NoaW1hLXUuYWMuanA=