 Qi Zhang
 Chun-Chi Ma1
 Yalong Jiang
- 1State Key Laboratory of Geohazard Prevention and Geoenvironment Protection, Chengdu University of Technology, Chengdu, China
- 2The Key Laboratory of Safety for Geotechnical and Structural Engineering of Hubei Province, School of Civil Engineering, Wuhan University, Wuhan, China
- 3State Key Laboratory of Water Resources and Hydropower Engineering Science, Wuhan University, Wuhan, China
- 4School of Civil Engineering and Architecture, East China Jiaotong University, Nanchang, China
- 5Jiangxi Key Laboratory of Infrastructure Safety and Control in Geotechnical Engineering, Nanchang, China
- 6Huaneng Coal Industry Co., Ltd., Beijing, China
Per-existing flaws are wide existence in rock mass, which have a significant effect on mechanical properties and fracturing behaviors. To investigate the effects of flaw type, infilling material, and flaw shape on the mechanical properties and fracture evolution of rock, a series of uniaxial compression tests were conducted on sandstone specimens. The bonded-particle model (BPM) and acoustic emission (AE) techniques were adopted to study the cracking process and AE characteristics of sandstone. The results indicate that relatively rigid infilling can significantly improve the mechanical properties of the rock. The AE simulation in the BPM revealed its fracture evolution, and there is a good consistency between fracture evolution and AE events. The cracking process and crack type around the hole-like flaw are influenced by the type of infilling material and its shape due to changes in the stress state around the hole-like flaw. Tensile cracks in nature usually initiate from the top or the bottom of a hole-like flaw. The shear and compaction cracks in nature prefer to initiate within the infilling material or from the lateral sides of the hole-like flaw. The cracking process of rocks can be characterized by the b-value, the variation of which is comparable with fracture behaviors and energy dissipation.
1 Introduction
Rock masses are typically regarded as heterogeneous due to the presence of a considerable number of discontinuities like fissures, holes, bedding planes, joints, and faults. Cracks prefer to initiate from these discontinuities under stress concentration by an external force (Zhu et al., 2005; Zhang et al., 2015; Zhou et al., 2016; Bai et al., 2018, 2019, 2021). These cracks may propagate along the discontinuity and coalesce into a macroscopic fracture path, resulting in the failure of the rock mass. To predict the fracturing behavior within the rock mass and guarantee its stability, the cracking processes and failure mechanisms should be understood well. Many studies have investigated the cracking processes in rock-like materials or rocks that contain pre-existing fractures, including glass (Hoek and Bieniawski 1965), molded gypsum (Park and Bobet 2009), resin (Dyskin et al., 2003), mortar (Liu et al., 2017), PMMA (polymethyl methacrylate) (Lee and Jeon 2011), and natural rock (sandstone, marble, and granite) (Wong and Einstein 2009; Zhu et al., 2019). According to such research, cracks that primarily initiate from a pre-existing fracture, commonly called “primary cracks”, are tensile in nature (Martin and Chandler 1994; Bobet 2000; Wu and Wong 2012). Shear cracks are infrequently observed in primary cracks. Cracks initiated after primary cracks are commonly called “secondary cracks”. These are considered shear cracks in their early stage (Bobet and Einstein 1998; Bobet 2000). However, some researchers have indicated that both tensile and shear cracks are present in secondary cracks (Wong and Einstein 2009; Zhang and Zhang 2018). Compared to primary cracks, secondary cracks have a more complicated failure nature.
The above research has mainly focused on cracking behavior in specimens with pre-existing fractures that are either open or closed. In the field, natural discontinuities are generally filled (Figure 1). The mechanical properties of the infilling materials have a significant effect on the cracking initiation, propagation, and coalescence, as well as the stress concentration surrounding the pre-existing fracture (Lu et al., 2016; Chang et al., 2018). The strength of specimens containing a filled pre-existing fracture are significantly affected by the length of the pre-existing fracture, with the strength of the specimen linearly decreasing as the length of the filled pre-existing fracture increases (Zhong et al., 2020). A relatively rigid infill can sharpen the strength of a pre-existing fracture (Zhu et al., 2019) The stress level of crack initiation in an opening fracture is higher than that of filled fracture (Zhuang et al., 2014). Miao et al. (2018) indicated that specimens with filled pre-existing fractures had a higher crack initiation stress level than specimens with opening pre-existing fractures which developed on the mechanical properties of the filling materials.
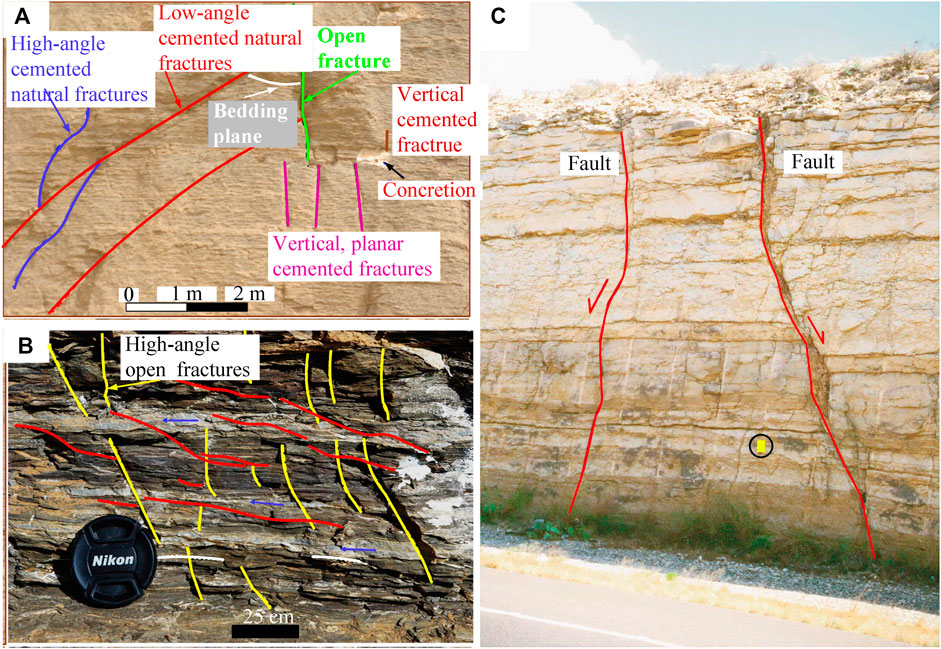
FIGURE 1. Discontinuities in rocks observed in the field: (A) Different types of fracture traces and their intersection relationships; (B) Close-view on the small-scale fractures in relation to the lithological change; (C) normal faults in the Buda Limestone (modified from Abouelresh and Babalola (2019) and Ferrill and Morris (2003)).
Previous research has advanced our knowledge of the cracking mechanisms and fracture behaviors in specimens with filled pre-existing fractures subjected to compressive pressure. However, the stress distribution, fracture mechanics, and crack failure nature in material with opening and filled pre-existing fractures have been little researched. The main objective of the present study is to study the effect of the shape of pre-existing fractures and infilling properties on crack patterns and failure nature. Acoustic emission (AE) simulation and moment tensor inversion are used, based on the discrete element method (i.e., bonded-particle model—BPM).
2 Methodology
The parallel bonded model is a type of the BPM which simulates rocks or rock-like materials using a dense packing assembly of particles with non-uniform sizes (Bai et al., 2022). All the interactions between these particles are bonded, and they all have normal and shear stiffness as well as tensile and shear strengths. A bond breaks and a micro-tensile or micro-shear crack forms when the force exerted on the bonds exceeds either their tensile or shear strength. For a thorough explanation of the BPM in terms of the constitutive model and mechanical behavior, refer to Potyondy and Cundall (2004). Based on the parallel bonded model, Hazzard and Young (2002) proposed an AE simulation method. The force change and particle deformation of the failure sources are used to calculate the moment tensor matrix of an AE event. Then, the moment magnitude can be calculated using an empirical formula from this matrix. The moment tensor matrix can be decomposed into an isotropic part and a deviatoric part. The force condition of the cracking processes and the nature of crack failure can be revealed and distinguished by the ratio of the isotropic part to the deviatoric part. For a detailed introduction of the AE simulation and failure nature distinction in the BPM, refer to previous studies (Feignier and Young 1992; Zhang Q. and Zhang XP. 2017; Zhang et al., 2017). This method has been extensively used to investigate the cracking processes of intact rock (Zhang et al., 2019) and rock-like material containing a single flaw (Yang and Jing 2011) and to distinguish the failure mechanism of macroscopic fracture paths and hydraulic fractures (Zhang XP. and Zhang Q. 2017; Zhang et al., 2020a; Zhang et al., 2020b). These results suggest that this method can be used to numerically simulate the AE characteristics of rock during the fracturing process. Therefore, the parallel bonded model combined with AE simulation is adopted in the present study to investigate the effect of the shape of a pre-existing fracture and infilling mechanical properties on the distribution of AE magnitudes, b-value, and failure nature.
3 Simulation modeling
The numerical model of the sandstone is 120 mm high and 60 mm wide (Figure 2). The pre-existing fracture is replaced in the following section by the term “hole-like flaw” that was created in the center of the model, both circle, square, and trapezoid. The size of the model and hole-like flaw was identical to that in the laboratory test (Zhu et al., 2019). The model contained about 33,500 particles, each with a radius following a uniform distribution and falling between 0.2 and 0.33 mm. The calibration of the mechanical properties of the specimen containing the filled hole-like flaw was achieved in two steps. The micro-parameters of the intact sandstone and two filling materials under uniaxial compression were first calibrated using the intact models. Table 1 compares the mechanical characteristics between the numerical modeling and laboratory tests, including uniaxial compressive strength (UCS), Young’s modulus, and Poisson ratio. It suggests that the BPM’s micro-parameters (Tables 2–4) can capture the fundamental mechanical properties of the rock and the filling materials. The filling materials were then filled into the hole-like flaw. Figure 3 shows the comparison of the UCS of the specimens containing opening flaw and filled flaw in the BPM and laboratory tests. The change tendency of the UCS of the numerical simulation is comparable to that observed from laboratory tests. The maximum error is approximately 10%. Therefore, these micro-parameters of the BPM in Tables 2–4 are used to study the cracking processes, fracture mechanical, and AE characteristics in specimens containing hole-like flaws. Note that the filling material was cement mortar. The two types of filling material had different mixtures. The mixture mass ratio of Type I is cement: quartz sand: water = 1:4:0.75, and that of Type II is cement: quartz sand: water = 1:2:0.45 (Zhu et al., 2019).
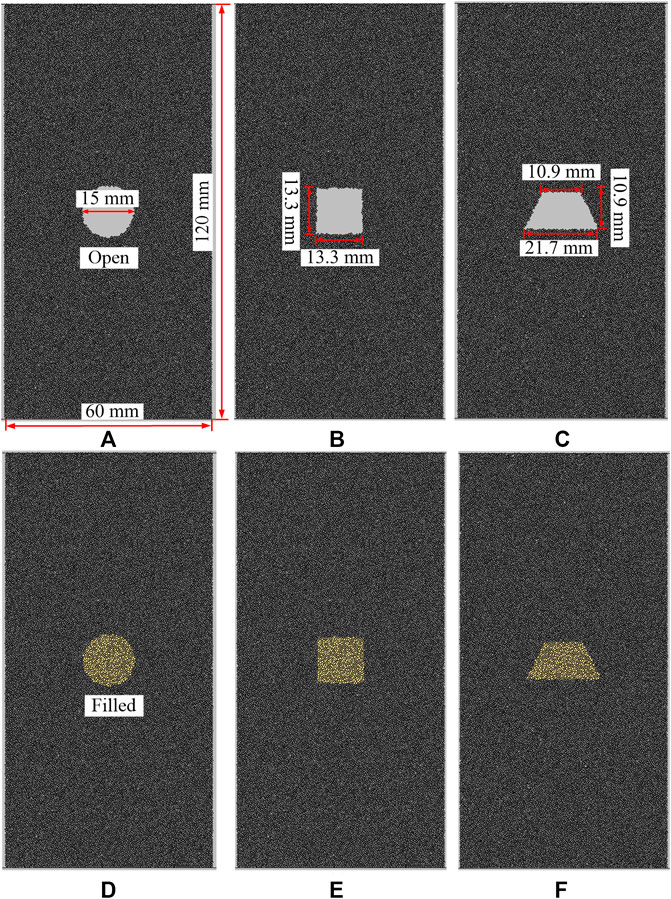
FIGURE 2. Numerical models containing opening hole-like flaws and filled hole-like flaws (A) circle opening flaw; (B) square opening flaw; (C) trapezoid opening flaw; (D) circle filled flaw; (E) square filled flaw; (F) trapezoid filled flaw.
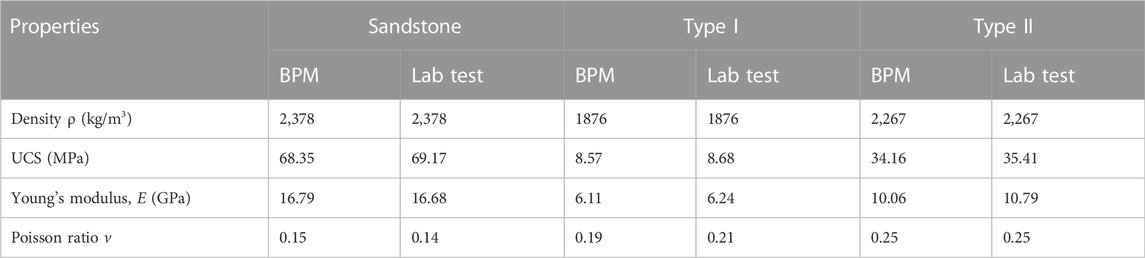
TABLE 1. Basic physical and mechanical parameters of the sandstone and the filling materials: comparison of the BPM and laboratory tests (Zhu et al., 2019).

TABLE 2. Micro-parameters of sandstone in the BPM.
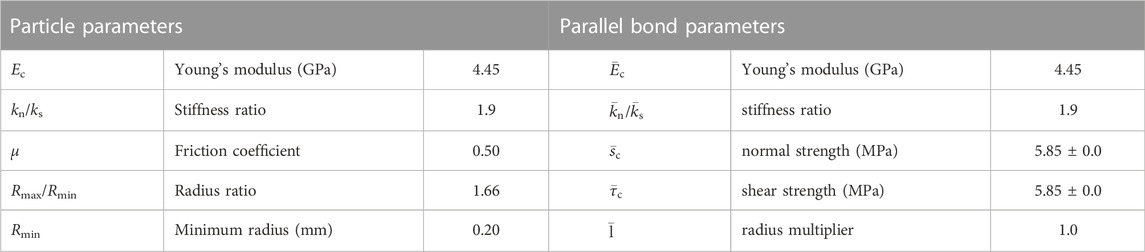
TABLE 3. Micro-parameters of filling material (type I) in the BPM.
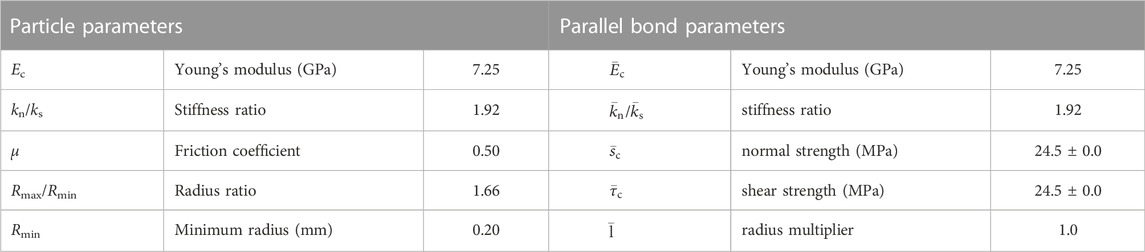
TABLE 4. Micro-parameters of (type II) in the BPM.
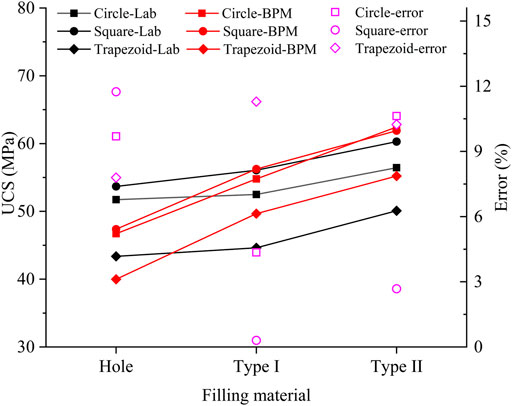
FIGURE 3. Comparison of the UCS between the BPM simulation and the laboratory tests (Zhu et al., 2019).
4 Results
4.1 Failure modes
To guarantee the accuracy of this study of the AE features and damage evolution of the specimen, the ultimate failure modes between the numerical simulation and the laboratory test are primarily compared (see Figure 4). Micro-shear and micro-tensile crack are shown by red and white segments, respectively. In the specimen containing an opening hole-like flaw, a macro-fracture path initiates from the top and bottom of the opening flaw and propagates along the direction of loading. This macro-fracture path is the primary cracks that just consist of micro-tensile cracks (white). Two macro-fracture paths penetrate through the specimen, each of which contains both micro-tensile cracks (white) and micro-shear cracks (red). The fracture path is the secondary cracks. These initiate from the lateral sides of the flaw for the circular and square flaws whereas, for the trapezoidal flaw, the secondary cracks initiate from the edge corner of the flaw. According to their geometry, secondary cracks are generally considered shear in nature (Zhu et al., 2019). In general, the failure modes of the specimen containing an opening flaw in numerical studies are in agreement with those observed from laboratory tests (Figures 4A, B, G, H, M, N). Note that the primary cracks cannot be observed in the final stage of laboratory tests due to crack closure.
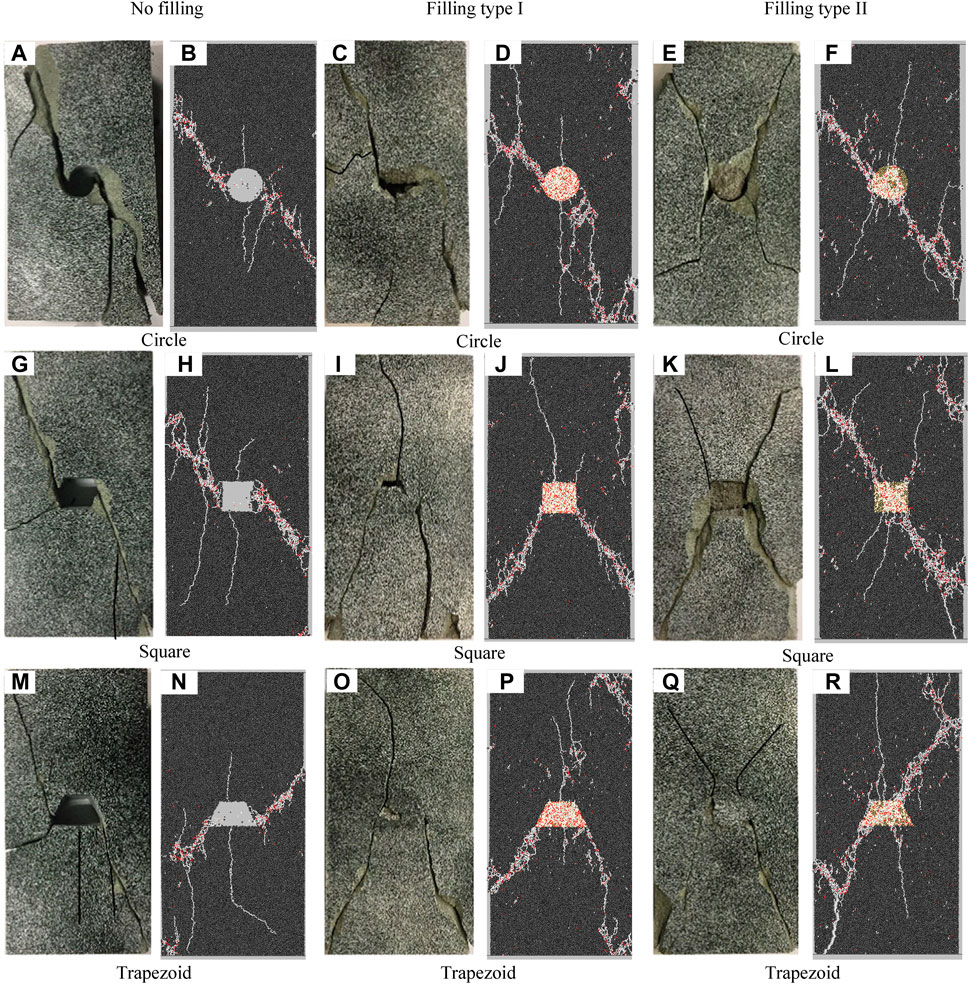
FIGURE 4. Comparison of failure patterns between the BPM simulation and the laboratory tests (Zhu et al., 2019): (A,C,E,G,I,K,M,O), and (Q): results of the lab test; (B,D,F,H,J,L,N,P), and (R) results of the BPM test. Micro-tensile crack and micro-shear crack are represented by white and red segments, respectively.
For the type I material, the primary cracks initiate from the top and bottom of the flaw, and solely contain micro-tensile cracks; this agrees well with that observed in the specimen containing the opening hole-like flaw. The cracking process of the secondary cracks is different. For the circular flaw, the secondary cracks initiate from the lateral sides of the flaw. As the secondary cracks propagate, they do not penetrate the specimen but turn its propagation direction parallel along the loading direction. For the square and trapezoidal flaws, the secondary cracks initiate from the edge corner of the flaw and propagate to the lateral sides of the specimen. Generally, the failure mode of these specimens is approximately Y-shaped in distribution, which agrees well with those observed from laboratory tests (Figures 4C, D, I, J, O, P).
For type II material, the macro-fractures mainly initiate from the edge corner of the flaw (lateral sides of the circular flaw). These fractures gradually propagate toward the end corners of the specimen. The failure mode is approximately X-shaped in distribution. Compared to the infilling materials of type I, fewer micro-cracks initiate within the hole-like flaw with the type II material, which has greater rigidity and strength. These phenomena and final failure mode are in agreement with those obtained from laboratory experiments (Figures 4E, F, K, L, Q, R).
4.2 AE characteristics
Figure 5 shows the curves of the stress-strain, cumulative AE event, magnitude distribution, and b-value of the specimen containing the circular hole-like flaw. Note that the curves of the square and trapezoid hole-like flaws are similar to Figure 5. These curves are thus not analyzed and discussed but this is available in the supplementary file. No AE events are evident in the early stage of the loading—the crack closure stage—because those micro-cracks are not preset in the specimens. As the loading increases, the AE event begins. Near point A (34.76 MPa), the number of AE events gently increases. The stress level is considered to be the stress threshold of crack initiation. As the loading increases, the number of AE event increases linearly. This corresponds to the primary crack initiation and propagation along the direction of loading. As the loading increases to the stress level of 43.98 MPa (B point), the number of AE events increases sharply. At this moment, a considerable number of AE events occur around the circular opening flaw, implying that the secondary cracks are initiating. The stress level is considered to be the stress threshold of crack damage. The loading then increases to the peak, and the number of AE events rapidly increases. Thereafter, the stress level drops sharply to a low level.
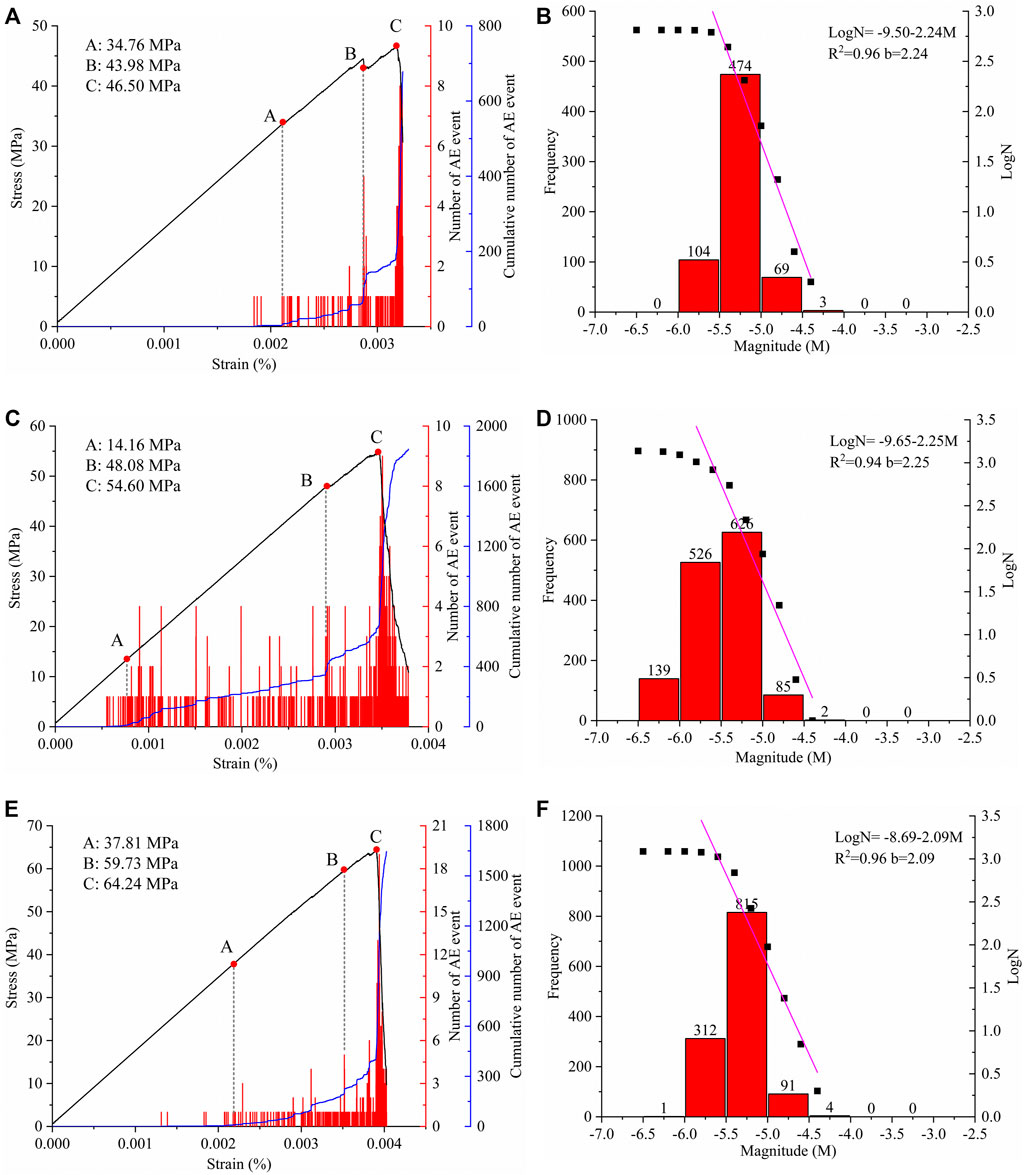
FIGURE 5. Curves of stress-strain, AE event of the specimen containing circular hole-like flaw; (A) and (B) opening circular flaw; (C) and (D) circular flaw filling with type I material; (E) and (F) circular flaw filling with type II material.
In the specimens containing a filled hole-like flaw (Figures 5C, E), the AE characteristics are different from specimens containing an opening flaw. For the type I material, few AE events occur at the low stress level (approximately 10 MPa) due to the infilling material’s (type I) low rigidity and strength, where micro-cracks prefer to initiate. As the loading increases to point A (14.16 MPa), the AE event becomes more active and the cumulative number of AE events increases linearly. At this moment, these micro-cracks initiate within the filled hole-like flaw, unlike that observed in the specimen containing the opening flaw. The cracking processes and failure nature will be discussed in the following section. The stress level of point A is considered to be the stress threshold of crack initiation. As the loading increases, the micro-cracks initiate within the filled flaw and from the top and bottom of the flaw. At the stress level of point B (48.08 MPa), the tensile cracks initiating from the top and bottom of the filled flaw have propagated a short distance along the loading direction, and then the cumulative number of AE events begins to increase sharply. Therefore, the stress level of point B is considered to be the stress threshold of crack damage. As the loading increases, the macro-fracture paths initiate from the lateral sides of the filled flaw. At point C (54.60 MPa), the stress level reaches peak and the specimen fails.
For the specimen containing the filled hole-like flaw with type II, the curves of the AE event and the cumulative number of AE events are similar to those in the specimen containing the opening flaw. This is because the infilling material of type II has high rigidity and strength. In the early stage of loading, a few AE events occur within the filled flaw. The stress levels of points A, B, and C correspond to 37.81 MPa, 59.73 MPa, and 64.24 MPa.
Figures 5B, D, F show the frequency of the AE magnitude distribution of the specimen containing the circular flaw. The AE magnitude ranges from −6.5 to −4.0 as a normal distribution. For a better understanding of the AE magnitude variation, a rigorous method, originally used in earthquake studies, was used to calculate the b-value. This defines the relative abundance of larger to smaller events, which can be calculated from the relationship between the magnitude and frequency of the acoustic emission event:
where M is magnitude, N is the number of acoustic emission events with magnitude greater than or equal to M, and a and b are constants. The constant a represents the acoustic emission activity rate; the constant b is the b-value. The higher b-value represents more occurrences of low magnitude acoustic emission events, whereas the lower b-value signifies the dominance of higher magnitude acoustic emission events. The cumulative number of AE events versus AE magnitude is first plotted, and then, the b-value is calculated by fitting the linear part of the plotted data (Figure 5B). The b-values are, respectively, 2.24, 2.25, and 2.09, corresponding to the specimen containing the opening circular flaw, filled with type I and type II. The b-value corresponds to post-failure stress—a stress level of 0.7 times of peak. This indicates a larger number of AE events with a large AE magnitude occurring in the specimen containing the flaw filled with type II. Figure 6 shows the AE magnitude distribution of the three specimens. The black square, red circle, and blue triangle represent the AE magnitude containing the opening circular flaw, filled with type I and type II. The larger magnitude of AE events mainly occurs at peak stress level. The AE distribution in specimens containing the opening flaw and filled with type II is similar. There are few AE events with low magnitude that occur in the early stage. As the loading increases, the AE event quantity and magnitude increase. In the specimen containing the flaw filled with type I, a large number of AE events with low magnitude occur throughout the test, induced by the low strength of the infilling material.
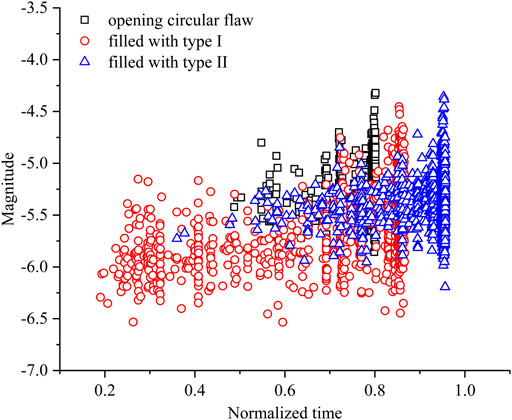
FIGURE 6. AE magnitude distribution of the specimen containing the circular hole-like flaw.
4.3 Cracking sequence and failure nature
In laboratory tests, the crack failure’s nature is mainly distinguished by the orientation of crack propagation or the morphology of the cracks. If the macro-fracture path is nearly parallel to the loading direction, it is generally considered tensile in nature. The tensile fracture path generally has a narrow aperture and its surface is smooth and clean. If the macro-facture path propagates obliquely to the loading direction, it is generally considered shear in nature and is usually associated with localized surface spalling. However, this method cannot distinguish the failure nature of micro-cracks. The present study distinguishes the failure nature of micro-cracks based on moment tensor inversion. As an AE event is recorded, the moment tensor matrix of the AE event can be calculated. Then, the matrix can be decomposed into isotropic and deviatoric components. The failure nature of the AE event is thus distinguished (Feignier and Young 1992):
where tr(M) is the moment tensor trace, and mi* is the deviatoric eigenvalue. The ratio R ranges from 100 (pure explosion) to -100 (pure implosion). “Tensile,” “shear,” and “compaction” corresponds to R larger than 30, between −30 and 30, and less than −30, respectively. More description is available in our previous studies that have demonstrated that this method can effectively distinguish the nature of micro-cracks and the macro-fracture path (Zhang Q. and Zhang XP. 2017; Zhang XP. and Zhang Q. 2017).
Figure 7 shows the fracture evolution in the specimens containing a circular hole-like flaw. Tensile, shear, and compaction AE events are indicated by blue, green, and orange circles, respectively. The radius of the circles is proportional to the AE magnitude. In the specimen containing the opening flaw, the micro-cracks (shear and compaction) initially occur around the opening flaw (Figure 7A) rather than initiating from its top and bottom, which differs from the laboratory test. Due to the stress concentration around the opening flaw, some bonds with low strength prefer to break. In laboratory testing, at the initial stage the AE system cannot effectively detect the AE event since the energy of these micro-cracks is low. As the loading increases, the micro-cracks around the opening flaw do not propagate further. The tensile cracks initiate from the top and bottom of the opening flaw and propagate along the direction of loading (Figures 7B, C). When these tensile cracks stop propagating, many shear and compaction micro-cracks initiate from the lateral sides of the opening flaw (Figure 7D). As the loading increases further, the macro-fracture path forms and the specimen fails (in Figure 7E). The fracture evolution and crack failure nature in the specimen containing the opening flaw are comparable with laboratory tests and theoretical analysis.
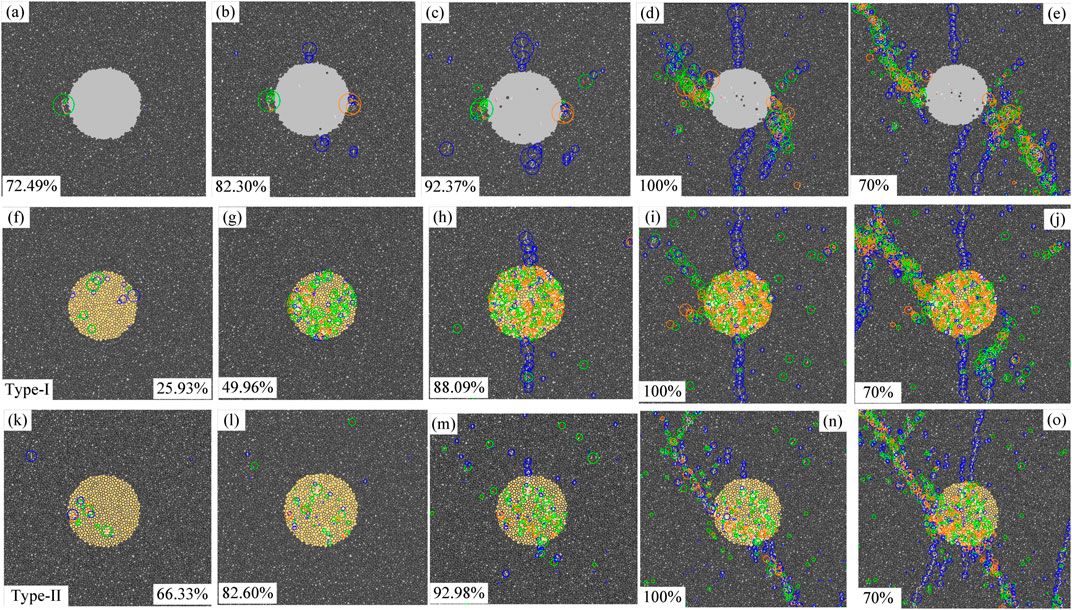
FIGURE 7. Fracture evolution of the specimen containing the circular hole-like flaw: (A–E): cracking process around the opening flaw; (F–J): cracking process around the filled flaw (type-I infilling material); (K–O): cracking process around the filled flaw (type-II infilling material). The tensile, shear, and compaction AE events are indicated, respectively, by blue, green, and orange circles.
In the specimens containing the filled hole-like flaw with type I, the micro-cracks primarily occur within the infilling. In the early stage, tensile and shear micro-cracks initiate within the infilling (Figure 7F). As the loading increases, a large number of shear cracks initiate within the infilling (Figure 7G). As the infilling loses bearing capability, the tensile cracks initiate from the top and bottom of the filled flaw and propagate along the loading direction (Figure 7H). As the loading increases to a peak, a macro-fracture path forms around the left side of the filled flaw, which is shear in nature (Figure 7I). The final two macro-fracture paths fail the specimen (Figure 7J). In the specimen containing the flaw filled with type II, the cracking sequence and failure nature of cracks are similar to that filled with type I. However, the infilling material does not completely fail, even in the final stage (in Figure 7O). In addition, the stress level of the tensile cracks initiating from the top and bottom of the filled flaw is larger than that filled with type I.
A comparison of the opening and filled flaws indicates that crack initiation and prorogation are obviously influenced by the infilling material. When the circular flaw is opening or filled with low-strength infilling, the tensile stress concentration occurs at the top and bottom of the flaw. Due to the tensile strength of rock being much lower than the shear strength, the tensile cracks prefer to initiate from the top and bottom of the flaw. When the flaw is filled with high strength infilling, the stress concentration around the filled flaw can be effectively reduced. Therefore, the stress levels of tensile crack initiation and the damage stress of the specimen are improved. The cracking sequence and failure nature of the cracks are comparable with laboratory tests and theoretical analysis. For the square and trapezoidal flaws, the fracture evaluation and crack failure nature (Figures 8, 9) are similar to those observed in Figure 7; these processes are not discussed in detail.
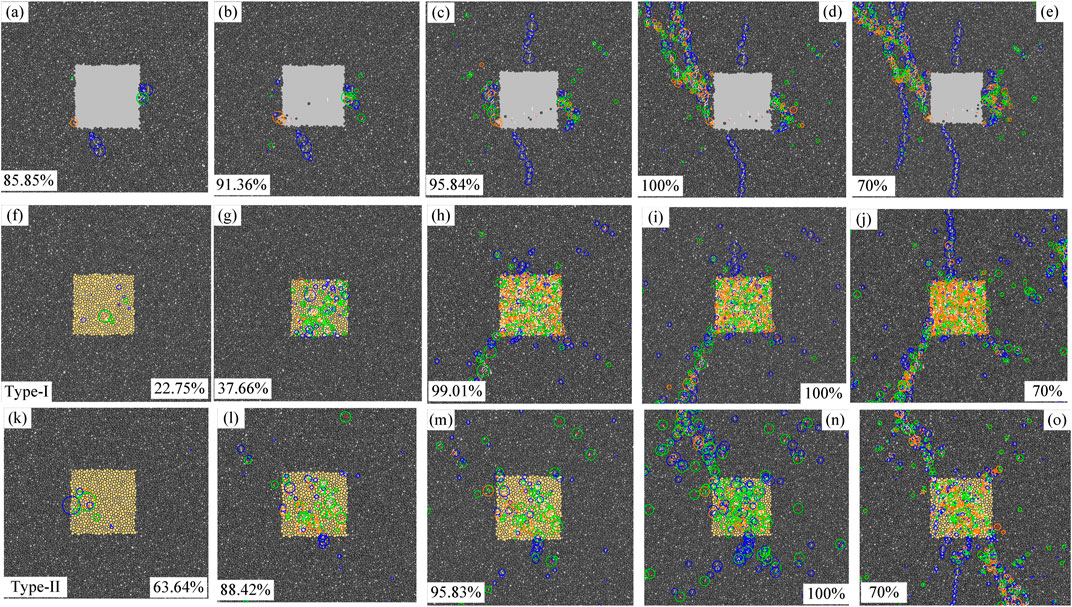
FIGURE 8. Fracture evolution of the specimen containing the square hole-like flaw: (A–E): cracking process around the opening flaw; (F–J): cracking process around the filled flaw (type-I infilling material); (K–O): cracking process around the filled flaw (type-II infilling material).
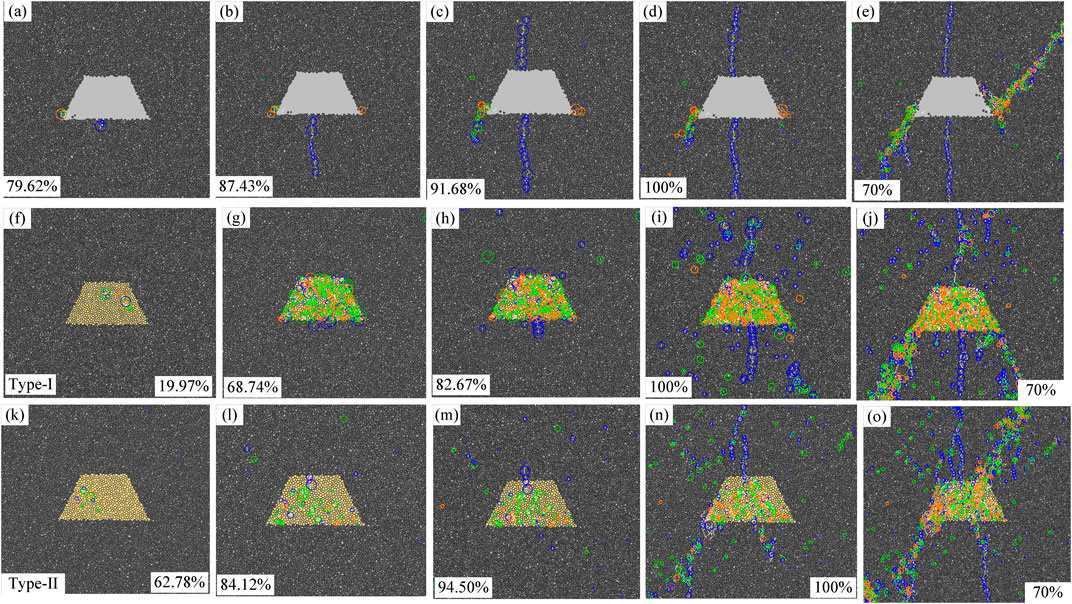
FIGURE 9. Fracture evolution of the specimen containing the trapezoid hole-like flaw: (A–E): cracking process around the opening flaw; (F–J): cracking process around the filled flaw (type-I infilling material); (K–O): cracking process around the filled flaw (type-II infilling material).
5 Discussion
The b-value can qualitatively reflect the crack initiation and propagation and the evolution processes in rocks. Previous studies (Yoon et al., 2012; Zhang Q. and Zhang XP. 2017) have indicated that, when micro-cracks become active, the b-value is high whereas, as the macro-fracture path forms, the b-value is low. Figure 10 shows the b-value of the specimen with the circular hole-like flaw (for the specimen containing square and trapezoid flaws, the results are similar). The numerical results indicate two sharp decreases in b-value during the fracture process. In the specimen containing the opening circular hole-like flaw, the first decrease occurs in the pre-peak region at about 90% of the peak stress. This variation is caused by few larger magnitude AE events clustering close to the lateral sides of the hole-like flaw. Thereafter, the b-value slightly increases as the axial stress increases. At 92%, the b-value begins to sharply increase, which corresponds to the macro-fracture path initiating from the top and bottom of the flaw (Figure 7C). As the axial stress continuously increases, the second decrease of the b-value begins at 97% of the peak stress. This variation of the b-value is associated with the macroscopic fracture of the specimen. This phenomenon is comparable with several experimental findings (Scholz 1968; Main et al., 1989; Lockner 1993; Amitrano 2003). For the circular flaw filled with type I and type II materials, the variations of the b-value are similar. The time at which the AE event occurs can be different. For type I material, the AE event occurs earlier (about 30% of the peak stress) while, for type II material, it occurs at about 78% of the peak stress—caused by the strength of the infilling materials. This phenomenon is comparable with that observed in laboratory tests (Zhu et al., 2019).
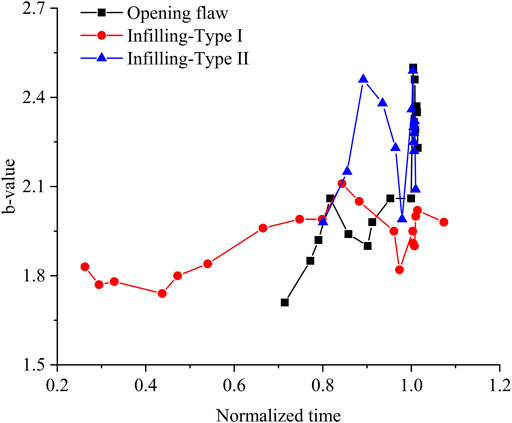
FIGURE 10. b-value of the specimen containing the circular hole-like flaw.
In addition, the b-value is related to energy dissipation. In the BPM, the external loading is stored at contacts between adjacent particles as strain energy (Es). When a crack initiates, the strain energy is converted into kinetic (Ek) and frictional energy (Ef) (Yoon et al., 2012). If a micro-tensile crack forms, the stored strain energy in the contact is mainly converted into kinetic energy. If a micro-shear crack forms, the strain energy is mainly converted into kinetic energy and frictional energy. When micro-cracks occur, kinetic energy causes contact force changes at the contacts surrounding the cracks. The AE magnitude is calculated based on the force change and particle deformation of the cracking sources. Figure 11 shows the curves of b-value, kinetic energy, and frictional energy versus the normalized time (1 corresponding to the peak stress) of the specimen containing the opening flaw. Note that the change in trend in the specimen containing filled flaws is similar. The results of the specimen containing the opening circular hole-like flaw are used as representative results. It seems that, as the b-value decreases at 90%, kinetic and frictional energy sharply increase, corresponding to the decrease in b-value. The kinetic and frictional energy then slightly decrease, which corresponds to the increase in b-value. At the 98%, kinetic and frictional energy gradually increase, corresponding to the increase in b-value. Thence, the kinetic and frictional energy sharply increase, corresponding to the decrease in b-value. In the BPM, the variation of the b-value can effectively reproduce the cracking processes and energy dissipation.
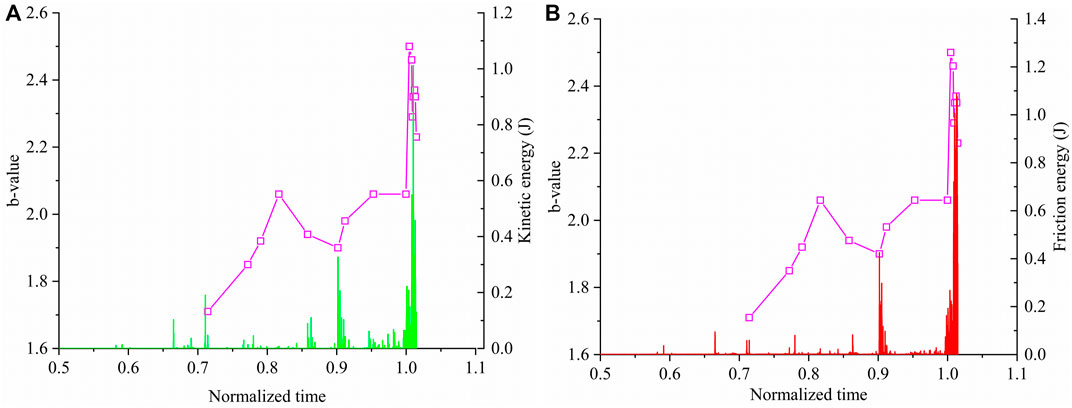
FIGURE 11. b-value versus the kinetic energy and friction energy of the specimen containing the opening circular hole-like flaw: (A) b-value and kinetic energy; (B) b-value and friction energy.
6 Conclusion
Acoustic emission activity can be used to characterize rock cracking processes by providing unique information about the amount of internal damage, the spatial distribution of micro-cracks, and the magnitude distribution of AE events. In the present study, the effects of the shape of the hole-like flaw, mechanical properties of infilling materials on the cracking processes, failure modes, AE characteristics, and b-value are discussed and analyzed, based on the AE simulation. The main conclusions are:
1) The infilling materials have a significant effect on crack initiation and propagation. In the specimen containing the opening hole-like flaw, one or two macro-fracture paths form which penetrates through the rock specimen diagonally along the specimen. When the specimen containing the hole-like flaw filled with a low strength material (type I), the failure mode presents a Y-shape. When the infilling material has high strength (type II), the failure mode presents a X-shape.
2) The cracks initiating from the top and bottom of the flaw are tensile in nature, while the cracks initiating within the infilling material or from the lateral sides of the hole-like flaw are shear or compaction.
3) As the kinetic and friction energy sharply increase during the cracking process, the b-value rapidly decreases. The b-value can effectively reflect the cracking processes and energy dissipation in rocks.
Data availability statement
The raw data supporting the conclusion of this article will be made available by the authors, without undue reservation.
Author contributions
QZ: conception and design of experiment, and drafting and finalizing the article. C-CM: collection and revision of relevant literature. YJ: statistical analyses and interpretation of data. HG: statistical analyses of data.
Funding
This work was financially supported by the State Key Laboratory of Geohazard Prevention and Geoenvironment Protection (Grant No. SKLGP 2021K010), the National Natural Science Foundation of China (Grant No. 52108382), the Fundamental Research Funds for the Central Universities (Grant No. 2042022kf1054), and the Jiangxi Natural Science Foundation (20212BAB204012).
Conflict of interest
HG was employed by Huaneng Coal Industry Co. Ltd.
The remaining authors declare that the research was conducted in the absence of any commercial or financial relationships that could be construed as a potential conflict of interest.
Publisher’s note
All claims expressed in this article are solely those of the authors and do not necessarily represent those of their affiliated organizations, or those of the publisher, the editors and the reviewers. Any product that may be evaluated in this article, or claim that may be made by its manufacturer, is not guaranteed or endorsed by the publisher.
Supplementary material
The Supplementary Material for this article can be found online at: https://www.frontiersin.org/articles/10.3389/feart.2022.992206/full#supplementary-material
References
Abouelresh, M. O., and Babalola, L. O. (2019). 2D spatial analysis of the natural fractures in the organic-rich Qusaiba Shale outcrop, NW Saudi Arabia. J. Petroleum Sci. Eng. 186, 106780. doi:10.1016/j.petrol.2019.106780
Amitrano, D. (2003). Brittle-ductile transition and associated seismicity: Experimental and numerical studies and relationship with the b value. J. Geophys. Res. 108, 233–236. doi:10.1029/2001JB000680
Bai, B., Rao, D. Y., Xu, T., and Chen, P. P. (2018). SPH-FDM boundary for the analysis of thermal process in homogeneous media with a discontinuous interface. Int. J. Heat Mass Transf. 117, 517–526. doi:10.1016/j.ijheatmasstransfer.2017.10.004
Bai, B., Wang, Y., Rao, D. Y., and Bai, F. (2022). The effective thermal conductivity of unsaturated porous media deduced by pore-scale SPH simulation. Front. Earth Sci. 10. doi:10.3389/feart.2022.943853
Bai, B., Yang, G. C., Li, T., and Yang, G. S. (2019). A thermodynamic constitutive model with temperature effect based on particle rearrangement for geomaterials. Mech. Mater. 139, 103180. doi:10.1016/j.mechmat.2019.103180
Bai, B., Zhou, R., Cai, G., Hu, W., and Yang, G. C. (2021). Coupled thermo-hydro-mechanical mechanism in view of the soil particle rearrangement of granular thermodynamics. Comput. Geotechnics 137 (8), 104272. doi:10.1016/j.compgeo.2021.104272
Bobet, A., and Einstein, H. H. (1998). Fracture coalescence in rock-type materials under uniaxial and biaxial compression. Int. J. Rock Mech. Min. Sci. 35 (7), 863–888. doi:10.1016/S0148-9062(98)00005-9
Bobet, A. (2000). The initiation of secondary cracks in compression. Eng. Fract. Mech. 66 (2), 187–219. doi:10.1016/S0013-7944(00)00009-6
Chang, X., Deng, Y., Li, Z., Wang, S., and Tang, C. A. (2018). Crack propagation from a filled flaw in rocks considering the infill influences. J. Appl. Geophys. 152, 137–149. doi:10.1016/j.jappgeo.2018.03.018
Dyskin, A. V., Sahouryeh, E., Jewell, R. J., Joer, H., and Ustinov, K. B. (2003). Influence of shape and locations of initial 3-D cracks on their growth in uniaxial compression. Eng. Fract. Mech. 70 (15), 2115–2136. doi:10.1016/S0013-7944(02)00240-0
Feignier, B., and Young, R. P. (1992). Moment tensor inversion of induced microseisnmic events: Evidence of non-shear failures in the −4 < M < −2 moment magnitude range. Geophys. Res. Lett. 19, 1503–1506. doi:10.1029/92gl01130
Ferrill, D. A., and Morris, A. P. (2003). Dilational normal faults. J. Struct. Geol. 25 (2), 183–196. doi:10.1016/S0191-8141(02)00029-9
Hazzard, J. F., and Young, R. P. (2002). Moment tensors and micromechanical models. Tectonophysics 356 (1-3), 181–197. doi:10.1016/S0040-1951(02)00384-0
Hoek, E., and Bieniawski, Z. T. (1965). Brittle fracture propagation in rock under compression. Int. J. Fract. 26, 276–294. doi:10.1007/BF00962960
Lee, H., and Jeon, S. (2011). An experimental and numerical study of fracture coalescence in pre-cracked specimens under uniaxial compression. Int. J. Solids Struct. 48 (6), 979–999. doi:10.1016/j.ijsolstr.2010.12.001
Liu, Y., Dai, F., Fan, P. X., Xu, N. W., and Lu, D. (2017). Experimental investigation of the influence of joint geometric configurations on the mechanical properties of intermittent jointed rock models under cyclic uniaxial compression. Rock Mech. Rock Eng. 50, 1453–1471. doi:10.1007/s00603-017-1190-6
Lockner, D. (1993). The role of acoustic emission in the study of rock fracture. Int. J. Rock Mech. Min. Sci. Geomechanics Abstr. 30 (7), 883–899. doi:10.1016/0148-9062(93)90041-B
Lu, Y., Wang, L., Li, Z., and Sun, H. (2016). Experimental study on the shear behavior of regular sandstone joints filled with cement grout. Rock Mech. Rock Eng. 50, 1321–1336. doi:10.1007/s00603-016-1154-2
Main, I. G., Meredith, P. G., and Jones, C. (1989). A reinterpretation of the precursory seismic b-value anomaly from fracture mechanics. Geophys J. Int. 96 (1), 131–138. doi:10.1111/j.1365-246X.1989.tb05255.x
Martin, C. D., and Chandler, N. A. (1994). The progressive fracture of Lac du Bonnet granite. Int. J. Rock Mech. Min. Sci. Geomechanics Abstr. 31 (6), 643–659. doi:10.1016/0148-9062(94)90005-1
Miao, S., Pan, P. Z., Wu, Z., and Zhao, S. (2018). Fracture analysis of sandstone with a single filled flaw under uniaxial compression. Eng. Fract. Mech. 204, 319–343. doi:10.1016/j.engfracmech.2018.10.009
Park, C. H., and Bobet, A. (2009). Crack coalescence in specimens with open and closed flaws: A comparison. Int. J. Rock Mech. Min. Sci. 46 (5), 819–829. doi:10.1016/j.ijrmms.2009.02.006
Potyondy, D. O., and Cundall, P. A. (2004). A bonded-particle model for rock. Int. J. Rock Mech. Min. Sci. 41 (8), 1329–1364. doi:10.1016/j.ijrmms.2004.09.011
Scholz, C. H. (1968). The frequency-magnitude relation of microfracturing in rock and its relation to earthquakes. Bull. Seismol. Soc. Am. 58 (1), 399–415. doi:10.1785/bssa0580010399
Wong, L. N. Y., and Einstein, H. H. (2009). Crack coalescence in molded gypsum and carrara marble: Part 1. Macroscopic observations and interpretation. Rock Mech. Rock Eng. 42, 475–511. doi:10.1007/s00603-008-0002-4
Wu, Z., and Wong, L. N. Y. (2012). Frictional crack initiation and propagation analysis using the numerical manifold method. Comput. Geotechnics 39, 38–53. doi:10.1016/j.compgeo.2011.08.011
Yang, S. Q., and Jing, H. W. (2011). Strength failure and crack coalescence behavior of brittle sandstone samples containing a single fissure under uniaxial compression. Int. J. Fract. 168, 227–250. doi:10.1007/s10704-010-9576-4
Yoon, J. S., Zang, A., and Stephansson, O. (2012). Simulating fracture and friction of Aue granite under confined asymmetric compressive test using clumped particle model. Int. J. Rock Mech. Min. Sci. 49, 68–83. doi:10.1016/j.ijrmms.2011.11.004
Zhang, Q., and Zhang, X. P. (2017a). A numerical study on cracking processes in limestone by the b-value analysis of acoustic emissions. Comput. Geotechnics 92, 1–10. doi:10.1016/j.compgeo.2017.07.013
Zhang, Q., Zhang, X. P., Ji, P. Q., Zhang, H., Tang, X., and Wu, Z. (2020a). Study of interaction mechanisms between multiple parallel weak planes and hydraulic fracture using the bonded-particle model based on moment tensors. J. Nat. Gas Sci. Eng. 76, 103176. doi:10.1016/j.jngse.2020.103176
Zhang, Q., and Zhang, X. P. (2018). The crack nature analysis of primary and secondary cracks: A numerical study based on moment tensors. Eng. Fract. Mech. 210 (1), 70–83. doi:10.1016/j.engfracmech.2018.05.006
Zhang, Q., Zhang, X. P., Zhang, H., Ji, P. Q., Wu, S., and Peng, J. (2020b). Study of interaction mechanisms between hydraulic fracture and weak plane with different strengths and widths using the bonded-particle model based on moment tensors. Eng. Fract. Mech. 225, 106813. doi:10.1016/j.engfracmech.2019.106813
Zhang, S., Wu, S., and Duan, K. (2019). Study on the deformation and strength characteristics of hard rock under true triaxial stress state using bonded-particle model. Comput. Geotechnics 112, 1–16. doi:10.1016/j.compgeo.2019.04.005
Zhang, X. P., Wong, L. N. Y., and Wang, S. (2015). Effects of the ratio of flaw size to specimen size on cracking behavior. Bull. Eng. Geol. Environ. 74, 181–193. doi:10.1007/s10064-014-0596-6
Zhang, X. P., and Zhang, Q. (2017b). Distinction of crack nature in brittle rock-like materials: A numerical study based on moment tensors. Rock Mech. Rock Eng. 50, 2837–2845. doi:10.1007/s00603-017-1263-6
Zhang, X. P., Zhang, Q., and Wu, S. (2017). Acoustic emission characteristics of the rock-like material containing a single flaw under different compressive loading rates. Comput. Geotechnics 83, 83–97. doi:10.1016/j.compgeo.2016.11.003
Zhong, Z., Deng, R., Zhang, J., and Hu, X. (2020). Fracture properties of jointed rock infilled with mortar under uniaxial compression. Eng. Fract. Mech. 228, 106822. doi:10.1016/j.engfracmech.2019.106822
Zhou, X., Wang, Y., and Xu, X. (2016). Numerical simulation of initiation, propagation and coalescence of cracks using the non-ordinary state-based peridynamics. Int. J. Fract. 201, 213–234. doi:10.1007/s10704-016-0126-6
Zhu, Q., Li, D., Han, Z., Li, X., and Zhou, Z. (2019). Mechanical properties and fracture evolution of sandstone specimens containing different inclusions under uniaxial compression. Int. J. Rock Mech. Min. Sci. 115, 33–47. doi:10.1016/j.ijrmms.2019.01.010
Zhu, W. C., Liu, J., Tang, C. A., Zhao, X. D., and Brady, B. H. (2005). Simulation of progressive fracturing processes around underground excavations under biaxial compression. Tunn. Undergr. Space Technol. 20 (3), 231–247. doi:10.1016/j.tust.2004.08.008
Keywords: bonded-particle model, acoustic emission, opening hole-like flaw, filled hole-like flaw, uniaxial compression test
Citation: Zhang Q, Ma C-C, Jiang Y and Geng H (2023) Numerical study of the effect of infilling material in a hole-like flaw on acoustic emission characteristics and damage evolution in sandstone. Front. Earth Sci. 10:992206. doi: 10.3389/feart.2022.992206
Received: 12 July 2022; Accepted: 06 December 2022;
Published: 04 January 2023.
Edited by:
Stelios M. Potirakis, University of West Attica, GreeceReviewed by:
Bing Bai, Beijing Jiaotong University, ChinaCao Rihong, Central South University, China
Copyright © 2023 Zhang, Ma, Jiang and Geng. This is an open-access article distributed under the terms of the Creative Commons Attribution License (CC BY). The use, distribution or reproduction in other forums is permitted, provided the original author(s) and the copyright owner(s) are credited and that the original publication in this journal is cited, in accordance with accepted academic practice. No use, distribution or reproduction is permitted which does not comply with these terms.
*Correspondence: Yalong Jiang, eWFsb25namlhbmdAd2h1LmVkdS5jbg==