 Wei Zhao
 Cui Hao2
 Jie Cao
 Xiaoqing Lan
- 1Collaborative Innovation Center on Forecast and Evaluation of Meteorological Disasters and Key Laboratory of Meteorological Disaster, Ministry of Education, Nanjing University of Information Science and Technology, Nanjing, China
- 2Beijing Meteorological Service, Beijing, China
- 3Center for Monsoon System Research, Institute of Atmospheric Physics, Chinese Academy of Sciences, Beijing, China
- 4National Meteorological Service Center, China Meteorological Administration, Beijing, China
Severe wind events which occur in the metropolis of Beijing in China bring major catastrophes. Characteristics of severe winter and spring wind events over Beijing during the past 40 years have been analyzed. An artificial intelligence-based method is adopted to categorize the favorable large-scale circulation patterns and dominant weather systems. Four categories are concluded and compared to each other in terms of distributions of geopotential height at 500 hPa, temperature at 500 hPa, sea level pressure and their corresponding anomalies in 1979–2019. It is found that the first category (T1) which is dominated by strong cold trough at upper levels with strong cold-core high locating at surface is the most conducive circulation pattern, while the fourth category (T4) which is controlled by weak trough and strong ridge with strong low cyclone at surface is the least one. The second and third categories, represented by T2 and T3, are under the control of strong cold trough and warm ridge at upper levels with weak high at surface, and of weak trough and strong ridge with strong low cyclone at surface, respectively. Characteristics and differences under different backgrounds of global temperatures are analyzed by separating the past 40years into two distinct periods. The decreasing trends of intensities of the trough and ridge, the temperature at 500hPa, together with the surface systems, are found to be responsible for the decrease in severe wind events in T1, T2 and T3 in the last 20 years, while T4 is distinct to the other three categories with little change in its circulation pattern, and thus continues contributing to the severe wind events over Beijing. The results found in this study with the usage of an AI-based algorithm will benefit for the operational forecasting for extreme wind events over Beijing.
Introduction
Due to the frequent occurrence of cold air activities in winter and spring, severe wind events hit Beijing in China every year. Extreme winds are catastrophic and pose threats to public facilities, traffic safeties, agricultural productions, as well as the safeties of peoples’ lives and properties (Qian and Zhang, 2007; Liu and Guo, 2012; Xu et al., 2014). As the Capital of China, the economy and urban population in Beijing have increased rapidly during the past decades (United Nations, 2018). Severe winds and secondary disasters over Beijing and the surrounding North China Plain have thus caused more human casualties and property damage. Therefore, it is of great importance to study severe wind events over Beijing.
Characteristics of the frequency, intensity, and persistence of severe winds are often associated with certain atmospheric circulation patterns dominated by specific large-scale weather systems. Previous studies have shown that the strength of East Asian winter winds and the location of the trough over East Asia have a great influence on the intensity of severe winter and spring winds over Beijing (Gong and WangZhu, 2001; Li et al., 2006; Xu et al., 2006; Chen and Wang, 2015). Cold high pressure system and Mongolian cyclones from the Siberia are the corresponding dominant weather systems at surface. The stronger the intensities of cold high pressure system and Mongolian cyclone, the stronger the wind events are (Wu and Wang, 2002; Kang et al., 2010; Li et al., 2022). Statistical clustering methods, such as EOF analysis and K-means clustering methods, are commonly used for categorizing the atmospheric circulations and dominant weather systems in meteorology (Yamal et al., 1988; Dommenget and Latif, 2002; Zhou and Yu, 2005; Solidoro et al., 2007). The self-organizing feature mapping network (SOM) method first designed by Kohonen (1982) is an ideal tool for extracting features because the input data are treated as a continuum without relying on correlation, cluster or Eigen function analysis (Liu et al., 2006). It is widely used in the arena of data downscaling and visualizations (Jensen et al., 2012; Pearce et al., 2014; Dyson, 2015; Stauffer et al., 2016). In the 20th century, the applications of this AI-based algorithm are increasingly widespread in atmospheric sciences (Reusch et al., 2005; Cassano et al., 2006; Johnson et al., 2008; Swales et al., 2016; Mattingly et al., 2016; Huang et al., 2017; Rodriguez-Morata et al., 2018). Many scientists have adopted it in the arena of classifying atmospheric circulations (Liu and Weisberg, 2005, 2011; Johnson et al., 2008). During the recent 10 years, SOM methods have also been widely used in extreme weather and climate events, such as extreme precipitations (Tymvios et al., 2010; Loikith et al., 2017), droughts (Zhuang et al., 2018), and environmental pollution phenomena (LiaoSun et al., 2018; Callahan and Mankin, 2020; Li et al., 2021). However, fewer studies have been performed on severe wind events over the metropolis in China. For example, the detailed distributions of favorable synoptic patterns and their differences in severe wind events during 1979–2019 have not been conducted before with the adoptions of either K-means or SOM methods. Recently, the K-means clustering has been adopted by China Meteorological Administration for performing mid-term forecasting of large-scale circulations favorable for extreme weather and climate events.
Climatological studies on the relationship between the increasing global temperature and precipitation variability (Katz and Brown, 1992; Du et al., 2019; Yu and Zhai, 2021; Zhang et al., 2021) have indicated that uneven extreme floods and droughts tend to occur more frequently in the future. Comparative analysis of the different large-scale circulation patterns under the climatic background of global warming (Cao and Yin, 2020) will be conducted in this paper. Focus will be put on the characteristics of wind speed intensities and temporal variations in different large-scale circulation types in the two distinct periods, while the possible reasons are beyond the scope of this study. Besides, there are many recent studies on the relationship between the meteorological parameter of wind and the concentration of air pollutants over Beijing and its surroundings (Chen et al., 2009; Zhang et al., 2012; Miao et al., 2017; Yin et al., 2019, 2020). It is found that meteorological paramters are influenced by weather systems of large and small scales (Aneja et al., 2000; Cao and Yin, 2020). Large-scale systems dominate the regional meteorological background, while local circulations also play important roles in the transports and concentrations of air pollutants. However, most of those researches focused on either haze weather which requires small velocities or severe wind events in summer seasons governed by weather systems which are distinctly different from the cold airflows in winter and spring seasons. Therefore this study will investigate the classifications and characteristics of large-scale circulation patterns conducive to severe wind events in the winter and spring seasons over Beijing based on the SOM applications to the recent 40 years.
The remainder of this paper is organized as follows. Data and methodology are described in Introduction, followed by descriptions of the characteristics of severe wind events over Beijing during the past 40 years in Introduction. Categories of different large-scale patterns conducive to the severe wind events are obtained by SOM method in Introduction, while their characteristics and differences under different backgrounds of global temperatures are analyzed in Introduction. Last section is the summation and discussions of this study.
Data and methodology
Data
Both observational data and reanalysis datasets are adopted in this study.
The observational data from local observatory of the Beijing Southern Suburb Observatory (Station No. 54511) are provided by the Beijing Meteorological Bureau. The data sequence of the winter and spring (December-May) from 1979 to 2019 is checked after quality control. The standard for selecting the severe wind day is strictly in accordance with the regulations of China’s meteorological observation business (Editorial board of Atmospheric Science Dictionary, 1994). To be specific, the instantaneous wind speed of 17 m/s and above, or visually estimated wind force reaching to and exceeding eight levels, is counted for a severe wind case. Once there’s a severe wind case during 20:00 in 1 day and 20:00 in the next day of Beijing local time, it is marked as a severe wind day.
ERA5 (Hersbach et al., 2018) is the fifth generation of the European Center for Medium-Range Weather Forecasts reanalysis data, which has been significantly upgraded from ERA Interim (Dee et al., 2011). The variables adopted in this study for analyzing and categorizing conducive large-scale circulations include geopotential height and temperature at 500 hPa, together with sea level pressure and wind 10 m above the ground with a horizontal resolution of 1° x 1°.
Methodology
The adopted SOM method is an AI-based method based on unsupervised, iterative and competitive learning procedure which allows unsupervised learning clustering of data (Kohonen et al., 2001). It is a neural network with only one input layer and one competing layer. The nodes at the competing layer have a topological relationship with each other, which can be one-dimensional linear or at two-dimensional planes. Each node at the competing layer represents either a neuron or a certain category of clusters. Once the input data finds only one node at the competing layer with the best match, the winning node is determined. The parameters of the winning node are then updated with the usage of the stochastic gradient descent method. Parameters of the adjacent points around the winning node are also updated according to their distances to the winning node. The final convergence is obtained through continuous iteration, and thus leads to the completion of clustering. Whether or not a node at the competing layer learns from the one at the input layer is determined by the neighborhood function. Only those that are topologically close enough to the winning node will be updated according to the SOM learning algorithm.
Python is used in this study to cluster the large-scale circulation patterns of severe wind events over Beijing during the past 40 winters and springs. All the variables on the points at the input layer are normalized by the L2 norm. In other words, each element value in the eigenvector is divided by the L2 norm of the vector. The specific steps are listed as follows:
Step 1. Start from inputting the machine learning series in the vector form, denoted by (x1, x2, … , xn), and the resulting number of clusters (m). Here, n represents the total amounts of neuron nodes at the input layer.
Step 2. Initialize the network connection weight (wji), and randomly assign and normalize the initial value to wji. Here wji is between the jth neuron node at the output layer and the ith neuron node at the input layer; j=1, 2, ... m; i=1, 2, ... n. Determine the initial values of the learning rate η(0) (0<η (0) <1) and the winning field Nj*(0). Determine the maximum training step (T), together with the permissible error accuracy (ε).
Step 3. Select one group from (x1, x2, … , xn) randomly, and marked as xk with k=1, 2, … , n.
Step 4. Calculate the Euclidean distance between the input vector xk from Step 3 and wji from Step 2 with i ranging from one to n. Then find the winning neuron node which has the minimum distance dj* with j ranging from one to m.
Step 5. Update the values of wji at tth time based on the following expression as:
Wji (t+1) = wji(t) + η(t)[xk–wji(t)]
Here η(t) is the function of topological distance between the kth neuron node and the j* winning field.
Step 6.Start over from Step 3 by selecting another group from (x1, x2, … , xn) and run through Step 4 to Step 5, until all of the n groups are performed.
Step 7. Update the values of η(t) and the Nj*(t) with t ranging from one to T.
Stpe 8. Calculate the error Ej = ||wt–wt-1|| = ∑j=1, … ,m ||wj,t–wj,t-1||.
Step 9. The iterative step stops when Ej < ε, otherwise go back to Step 3 until the end of T.
Temporal variations of severe wind events over beijing
Seen from the temporal variations of severe wind days over Beijing from 1979 to 2019 in Figure 1, the overall trend in the past 40 years presented by the observation data (black solid curves) is decreasing. It is consistent with many researches (Yan et al., 2014; Callahan and Mankin, 2020; Li et al., 2021). To be specific, severe winter and spring wind days over Beijing declines at the rate of 3.2 days per decade. 1980–1988 is a period of frequent occurrences, with an average of more than 10 days per year. The year of 1980 reaches the maximum (25 days). From the year of 1989, the windy days sharply decrease with only 1 day of strong winds every year and then rise slowly until the year of 2002 after which remains in the range of 3–13 days each year. After 2002, most years have windy days below 5 days. The year of 2010 reaches another maximum value in the past 20 years with 15 days, while the windy days during the past 5 years shrink to less than 5 days.
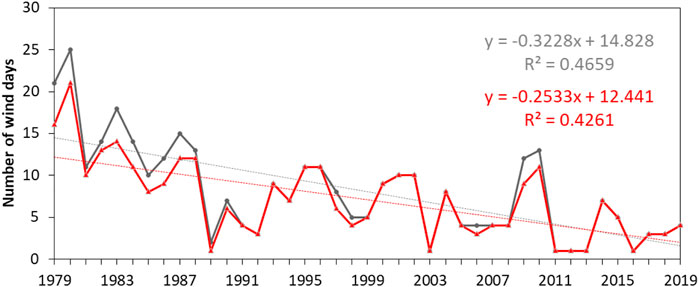
FIGURE 1. Temporal evolutions of severe wind days over Beijing during 1979 and 2019 by the observational data (solid black curves) and ERA5 reanalysis data (solid red curves). The dotted grey and red curves are the corresponding trends of univariate linear regression.
The maximum velocities at a height of 10 m above the surface of the Earth are obtained from ERA5 analysis data of the same period. The number of windy days which meet the standard of severe wind days in last section is depicted in Figure 1 with solid red curves. It is found that the temporal evolution trends of the two datasets are similar. Besides, the consistency between these two is higher after the 1990s. Therefore, the validity of the velocity data from ERA5 reanalysis datasets is solid for the follow-up comparative analyses using the SOM method.
The four circulation categories conducive to severe wind events over beijing and their individual characteristics
The four categories and their primary features
In order to figure out the typical circulation patterns conducive to winter and spring severe winds over Beijing, the geopotential height field at 500hPa, the temperature field at 500hPa, and sea level pressure field are chose as the eigenvectors following previous studies by Li et al. (2006), and Chen and Wang (2015), and Ji et al. (2020). The other commonly used meteorological variables for haze events are also tested (Cai et al., 2017), such as the temperature variations in 24 h at 2 m above the surface, the specific humidity at 850hPa, and temperature differences between 850 hPa and 200 hPa. Different from results in air pollutant studies (Chen et al., 2009; Cao and Yin, 2020), they are not as important as the three variables we adopted for analyzing synoptic patterns, and are thus not included in the final experiments. The possible reasons lie in the synoptic-scale characteristics for the unique severe wind events during the winter and spring seasons. Troughs and ridges in the westerly wind belt are clearly represented by the geopotential height field at 500 hPa on this height layer, which include the Ural Mountain ridge, the East Asian trough, and several short-wave troughs. The temperature field at 500 hPa is a powerful variable for characterizing the extent of cold air accumulations. For example, a cold center of -40°C indicates that cold air has already accumulated to a substantial depth. Sea level pressure fields are capable of representing weather systems of synoptic scales conducive to the intensity of extreme winds, such as the Mongolian cyclones and the cold-core high from Siberia (Kang et al., 2010).
A total number of 292 severe wind days are selected from 1979 to 2019 from ERA5 reanalysis data. The above three scalar parameters in the 292 days are then treated as the clustered element fields. Their values at each grid points in the domain of 35°N-70°N and 90°E-130°E are individual input factors to start up the categorizing steps by the SOM method. In the choice of the node number, this paper starts with the setting of four by five node. With the aim to find an ideal result, four by 4, three by 4, three by 3, two by three and two by two and other different schemes are also performed. Finally the number of nodes of 2*2 is determined together with the maximum training step to be settled as 100 steps. The choice of the two by two nodes is determined after considerations from the perspective of both the operational forecasting and several experiments with different nodes. On one hand, according to the Weather forecast manual for Beijing (Ji et al., 2020), the surface synoptic systems responsible for severe winter-season wind events over Beijing in China can be divided into two categories, i.e., the high pressure system with cold core and low pressure system. Meanwhile, the upper level systems are either low vortex with trough or horizontal trough. Therefore, the number of subcategories for severe wind events during the winter and spring seasons over Beijing is limited for operational forecasting. One the other hand, we still performed several sets of experiments with different nodes, such as four by 5, three by 4, and two by 3. Similar patterns can be seen over different subcategories and finally can be concluded into the four categories which are obtained from the two by two nodes. Therefore, we eventually adopt the two by two nodes in our study for analyzing synoptic patterns conducive for severe wind events during the winter and spring seasons over Beijing.
Theresults are four categories represented by T1, T2, T3 and T4 hereafter. T1 contains 51 days (17.5% of the total). Both T2 and T3 contain 87 days, each accounting for 29.8% of the total. T4 contains 67 days which is 22.9% of the total. This categorizing result is relatively stable with obvious differences among each category. Statistical analyses of the severe wind days in different months in the four circulation types lead to different results. It can be seen in Figure 2 that in T1 most gale events occur in December and March, while none in May. In T2, the most and least likely to experience gale days are February and January, and then April and May, respectively. In T3, 87 gale days occur in all of the 6 months with the maximum in April followed by March. In T4, gale days only occur in April and May. As a short conclusion, the distributing features of the above four categories are statistically different especially in T4 which only contains spring gales. The F-test method (Casella and Berger, 2001) is conducted among the three meteorological parameters and their corresponding anomalies with the statistical results listed in Table 1. It is found that the six meteorological parameters obtained from the four classifications all pass the criteria with the F values larger than F-test values. Therefore, the hypothesis of the similarity among T1, T2, T3, and T4 is refuted. In other words, the F-test demonstrates these four types are able to distinguish with each other. Since atmospheric circulations vary sharply during the transition of winter and spring, it is necessary to distinguish each category before further analysis. In other words, the SOM method is capable of capturing and distinguishing these features.
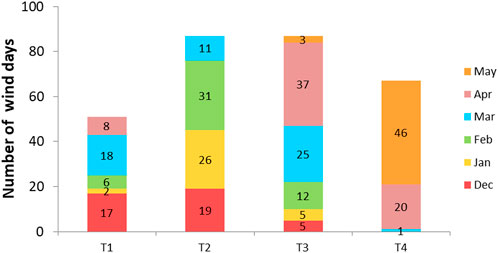
FIGURE 2. Severe wind days in each month in T1, T2, T3, and T4 categories.
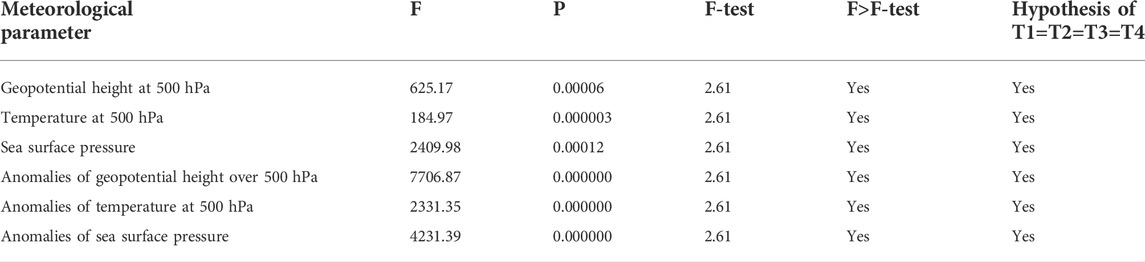
TABLE 1. Results from F-test.
Characteristics of circulation patterns in the four categories
Figure 3 shows the composite of geopotential height at 500 hPa for the four categories (T1, T2, T3 and T4), together with their corresponding anomalies to the winter and spring of 1979–2019. It can be seen that the similarity of the four types lies in the relatively large meridional distributions. Beijing is under the control of the northwest air flow in front of the ridge, which favors the intrusion of the cold air from the north and thus conducive to severe wind events. The difference is that T1 and T3 are affected by vortices and troughs, while their intensities are stronger in T1 with more northward positions. T2 is controlled by strong troughs and ridges, while T4 is by weak troughs and strong ridges.
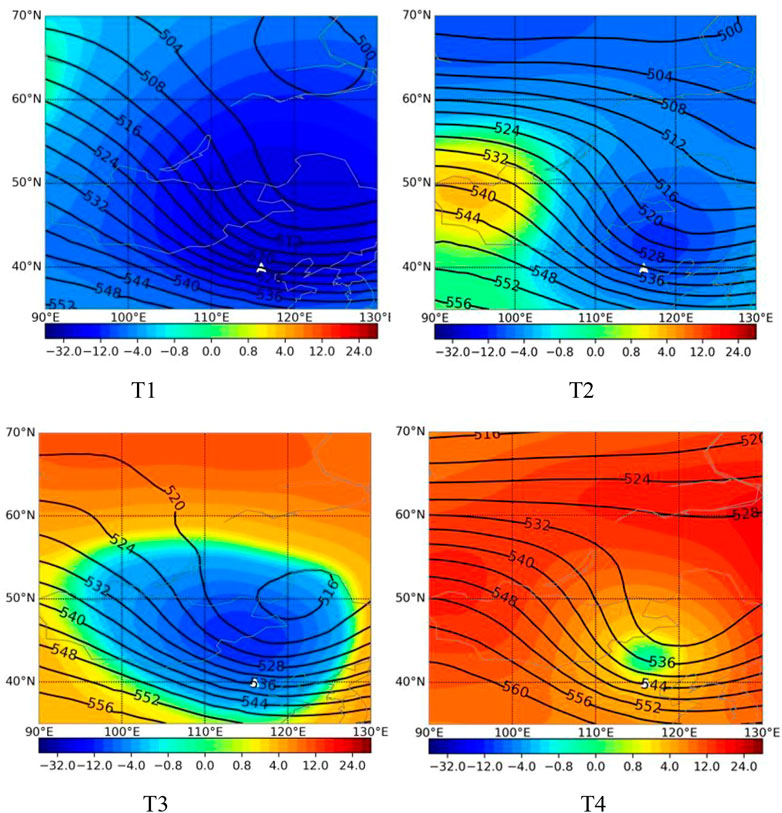
FIGURE 3. The composite fields of geopotential height at 500 hPa (contours) for T1, T2, T3 and T4, and their corresponding anomalies to the winter and spring of 1979–2019 (shaded). Beijing is marked with the white triangle.
The distributions of temperature fields at 500 hPa in the four categories as shown in Figure 4 are also distinctly different with each other. To be specific, the anomaly over Beijing in T1 is entirely negative with extremely cold centers allocated with the low trough. It indicates the accumulation of strong cold air at the upstream side of Beijing. Weak negative anomalies near the trough and ridge in T2 allocate with increased temperature gradients between the negative and positive centers. The cold-core in T3 which relates to the low trough is weak, while the entire area of T4 shows positive anomaly with a relatively cold trough.
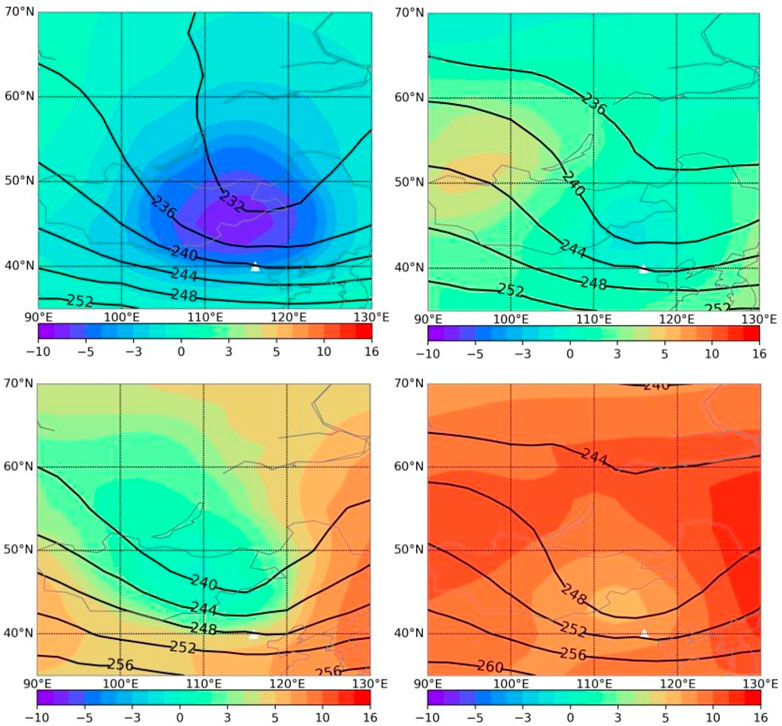
FIGURE 4. Same as Figure 3, except for the temperature at 500 hPa
T1 and T2 share the same characteristics in the form of a high pressure system which can be seen from the distributions of sea level pressure field and their anomalies in Figure 5. Beijing is located in the large value area of the air pressure gradient in front of cold high pressure. The intensity of the high pressure system in T1 is extremely stronger with larger areas. The main part of the high pressure system in T3 lies slightly north, while the low-pressure area is stronger. Therefore, Beijing is located in front of the high pressure system and behind the low-pressure area. In T4, Beijing is also under the joint control of these two surface weather systems. The allocation of the weaker high-pressure system and the stronger low pressure is favorable for the dominant control of the strong low pressure over Beijing.
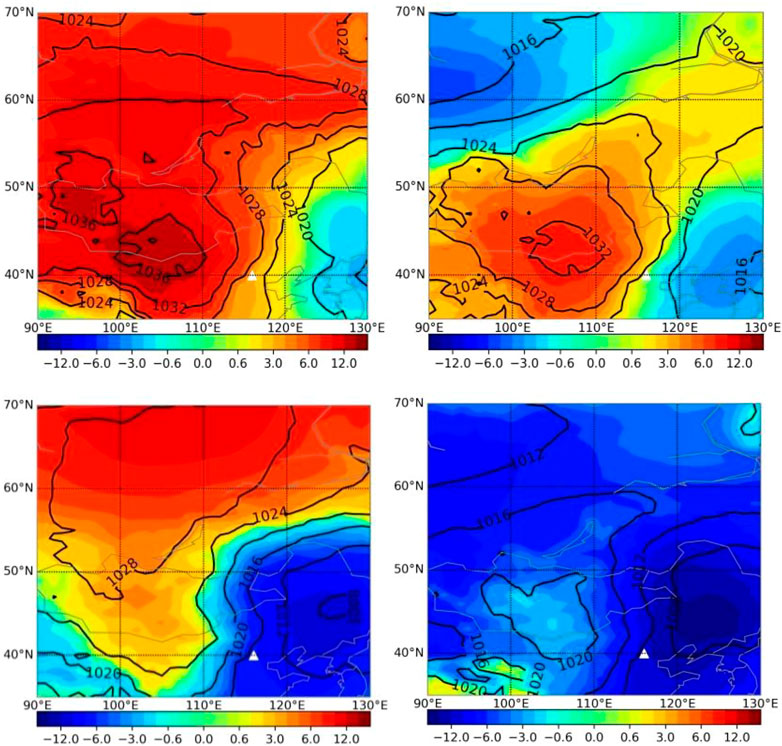
FIGURE 5. Same as Figure 3 except for the sea surface pressure.
Characteristics of the velocities in the four categories
Distributions of the maximum velocity, minimum and averaged ones are analyzed with ERA5 reanalysis data and depicted in the four categories (Figure 6). Three quarters of the velocity in all the four categories are smaller than 23 m s−1. They share similar values in both the minimum velocity (blue curves in Figure 6) and average one (green curves in Figure 6). The main differences among the four categories lie in the frequencies and velocities of severe wind events. The maximum velocity in T1 reaches 29.7 m s−1, with around 5% exceeding 27.9 m s−1. It is therefore the strongest circulation pattern over Beijing which is governed by strong cold trough at upper levels and strong high pressure systems at surface. T3 which is governed by surface cyclones follows with the maximum velocity reaching 28.3 m s−1 and around 5% exceeding 26 m s−1. The thresholds for the rest two patterns are similar to each other which lead to less extreme windy events.
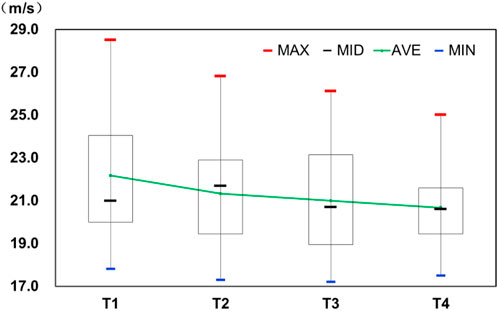
FIGURE 6. Box plot of the daily maximum velocity in T1, T2, T3, and T4.
Preliminary results with comparisons to the categories by the K-means method
Comparisons of the clustering results with assessments between the SOM and K-means methods are performed with the following preliminary results. Four circulation patterns (denoted as K1, K2, K3, and K4; figures omitted) conducive to severe winds are obtained with the adoption of K-means method. According to the F-test method, the four types are able to distinguish with each other. In comparisons to the four patterns obtained by the SOM method, the three similar patterns in the distributions of geopotential height at 500 hPa are as follows: T1 and K1 which are dominated by strong cold trough, T2 and K3 by strong cold trough and warm ridge, T4 and K4 by weak trough and strong ridge. T3 is governed by weak cold vortex or trough, while K2 is by weak cold trough only. The main difference in surface pressure is the lack of high pressure centers as presented in T3. Instead, both K2 and K4 show similar distributions in the form of strong low pressure center.
Quantitative comparisons are performed with the adoption of the Calinski-Harabasz index which is one of the clustering algorithms evaluation measures. It is most commonly used to evaluate the goodness of split by a K-means clustering algorithm. The index CH is calculated from the following expressions:
Here,nj represents the sample number in the jth category. m and k are the total sample numbers and categories, respectively. cpi and cj are the centers of each category, while
Comparative analysis between the period of 1980–1999 and the period of 2000–2019
Compared to the temporal variations of severe wind events during the past 40 years as shown in Figure 1, the interdecadal variation trends are analyzed in terms of the four circulation categories. Differences in the four categories are depicted in Figure 7. It is found that T2 and T3 are the dominant pattern in the 1980s and 1990s, respectively. During 2000–2009, the four types play equal importance. In the recent 10 years, T4 is the most conducive one.
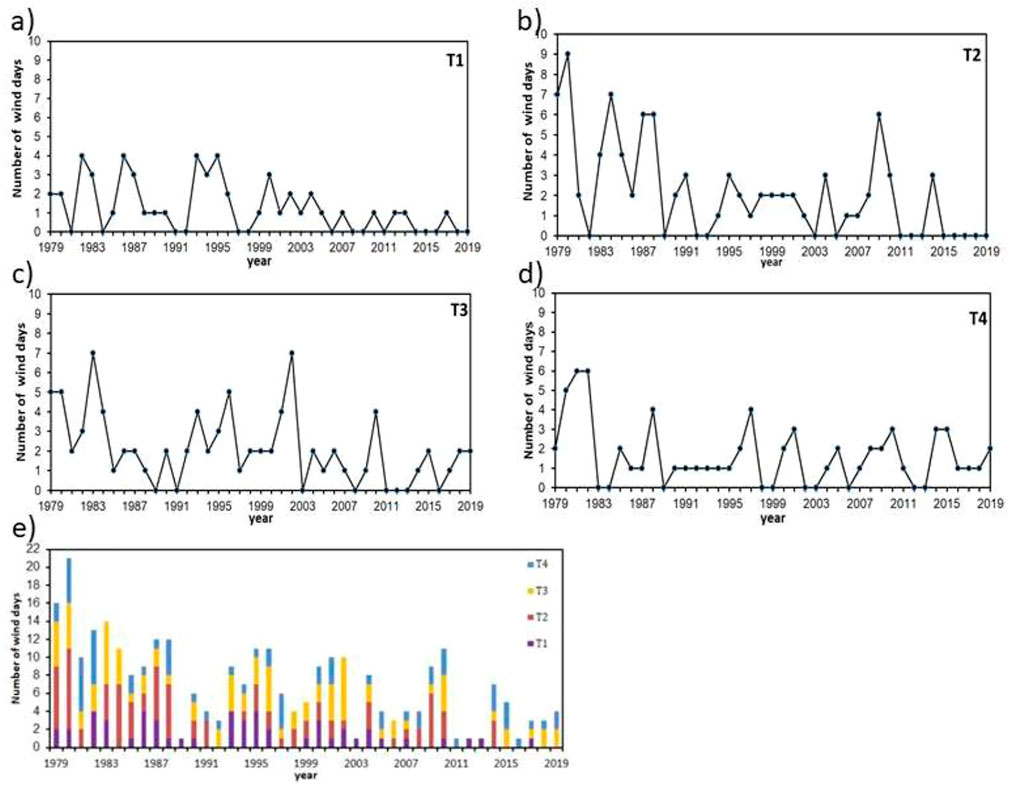
FIGURE 7. Same as Figure 2 but for (A) T1, (B) T2, (C) T3 and (D) T4 categories. (E) quantitative differences among each other.
With the aim to distinguish the characteristics and to figure out the dominant circulation patterns responsible for the influence of increasing global temperature on severe wind events over Beijing in terms of different circulation patterns, the entire period of 1979–2019 is divided into two sequences of 20 years. One is from 1980 to 1999, and the other from 2000 to 2019. The geopotential height at 500hPa, temperature at 500hPa, and the sea level pressure in these two periods are depicted for this composite and anomaly fields in Figures 8–10.
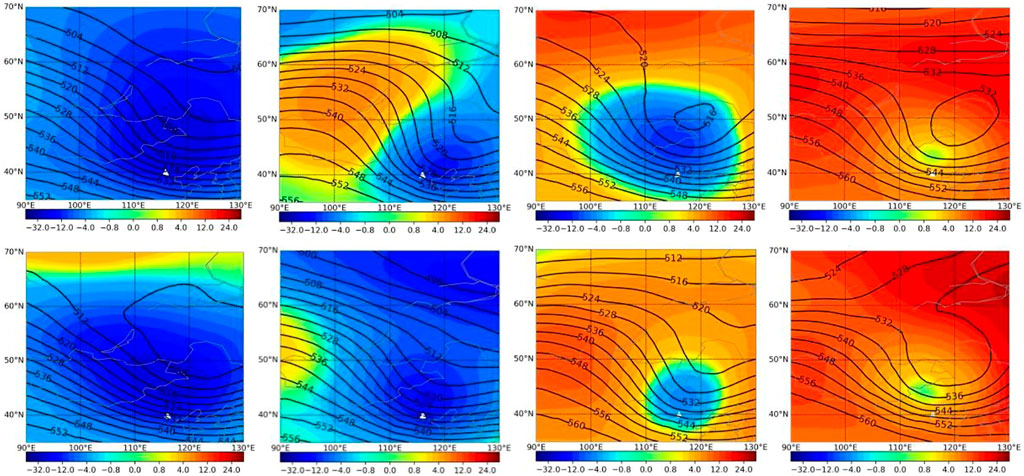
FIGURE 8. Same as Figure 3 but for the period of 1980–1999 (upper row) and 2000–2019 (lower row).
Visible intensity differences of the geopotential height at 500 hPa can be seen in Figure 8 among the four circulation types, especially in T2 and T3. The intensity of the trough and ridge in T2 as well as that of the trough in T3 is much stronger in the first 20 years. The intensity of the trough in T2 varies slightly with the center value of -14 while the center value of its ridge decreases rapidly from 10 to 2. The trough systems in T3 decrease from -10 to -4. The intensity of the trough in T1 is also slightly stronger in the first 20 years, but its width is significantly widened during the last 20 years. It leads to the reduction of meridional circulations in T1. The intensity and its amplitude in T4 change little.
The variations of the distributions of temperature at 500 hPa (Figure 9) are similar to those of geopotential height. The temperature contrast between the cold and warm airflow in T2 decreases from 12 to 6, which is the representation of the weakening intensity of fronts as shown in Figure 8. The area of the cold-core in T3 significantly shrinks with the intensity anomaly changes from -2 to 2. The cold-core center in T1 rises a little from -8 to -5. The intensity in T4 keeps little variations.
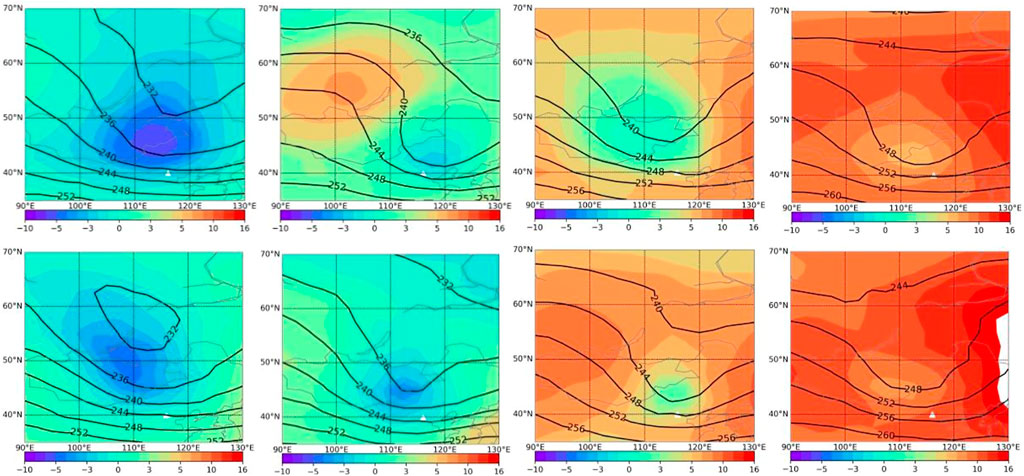
FIGURE 9. Same as Figure 8 but for the temperature at 500 hPa
As shown by the sea level pressure in Figure 10, the high pressure system in T1 sharply weakens in the last 20 years with the center value decreasing from 14 to 8. Together with the northward positioned center, it means the influence of the cold airflow over Beijing decreases. Similarly the intensities of the pressure centers in T2, T3, and T4 all decreases to the extent of two to four.
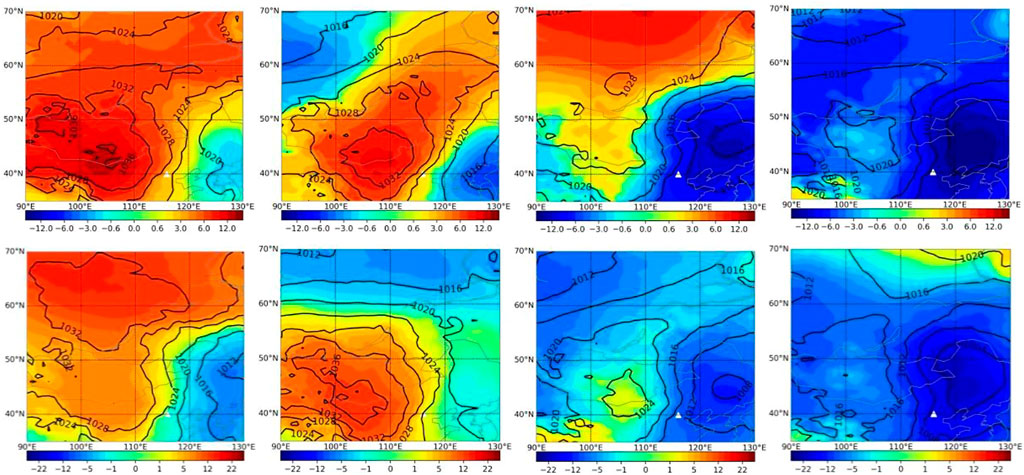
FIGURE 10. Same as Figure 9 but for the sea level pressure.
As a short conclusion, the decreasing trends of intensities of the trough and ridge, the temperature at 500hPa, together with the surface systems, are responsible for the decrease in severe wind events in T1, T2, and T3 in the last 20 years. T4 is distinct to the other three categories with little change in its circulation pattern, and thus keeps contributing to the severe wind events over Beijing.
Conclusion and discussion
In this paper, the large-scale circulation patterns of severe wind events over Beijing from 1979 to 2019 are analyzed and then classified by an AI-based method into four categories occupying 17.5, 29.8, 29.8 and 22.9% of the total events. The validity of the categorizing algorithm as well as the reliability of ERA5 reanalysis data are investigated firstly. Then the intensities of velocity and temporal variations in the four types are analyzed with comparison to the entire events as well as to each other. It is found that during the past 40 years from 1979 to 2019, the occurrence of severe wind events in the winter and spring over Beijing decreases to the extent of 3.2 days every decade. The events occur more frequently in the period of 1980–1988 with more than 10 days every year, and less frequently in the period of 1989–2002 with the threshold of 3–13 days. Since the year of 2002, most years only experience less than five events. Under the decreasing trend of the entire events, the temporal variations for the four categories are distinct with each other. In the 1980s, T2 is the dominant circulation pattern with the other three happening alternately. In the 1990s, T3 occurs most frequently. In the period of 2000–2009, T2 and T3 play identically equal importance. In the recent 10 years, T4 becomes the primary one.
The four categories can be concluded in terms of distributions of geopotential height at 500 hPa, temperature at 500 hPa, and sea level pressure. T1 is dominated by strong cold trough at upper levels with strong high pressure system locating at surface, T2 by strong cold trough and warm ridge at upper levels with weak high at surface, T3 by weak cold vortex or trough with jointly influences of high pressure centers at surface, and T4 by weak trough and strong ridge with strong low cyclone at surface. These differences in circulation patterns lead to different weather systems of synoptic scale responsible for the severe wind events over Beijing. T1 brings the most severe winds while T4 is the weakest one.
The characteristics for the occurrence and intensity variations in circulation patterns under the climatic background of global warming are also investigated in this study. During the latest 20 years from 2000 to 2019, the intensities of the trough and ridge systems at 500hPa, the temperature centers at 500hPa, and the pressure centers at surface, all present a weakening trend in T1, T2 and T3. The combined contributions of the cold air intensity and primary systems lead to the decreasing trend in severe wind events. However, T4 varies little with negligible change in the occurrence of severe wind events during the past 40 years.
The findings of the two most conducive circulation patterns to severe wind events over Beijing, T1 and T4, with the usage of an AI-based algorithm will lead to the operational applications for extreme wind predictions. Preliminary results obtained from the comparisons of the clustering results by SOM and K-means methods show a little advantage of the SOM method from the perspective of one of the clustering algorithms evaluation measures. However detailed comparisons between the SOM method and other methods are beyond the scope of the current study. The relation between T4 and the increasing trend in haze weather in winter and spring over Beijing will be investigated in our follow-up studies. As the urbanization extent increases, the influences of urbanization together with global warming over the extreme wind events also call for attention which is beyond the scope of this study.
Data availability statement
The original contributions presented in the study are included in the article/supplementary material further inquiries can be directed to the corresponding author.
Author contributions
WZ, CH, and JC contributed to conception and design of the study. XL organized the database. HY performed the statistical analysis. WZ wrote the first draft of the manuscript. WZ, CH, and JC wrote sections of the manuscript. All authors contributed to manuscript revision, read, and approved the submitted version.
Funding
This work was supported by the National Natural Science Foundation of China (Nos. 91937301, 41875074), Beijing Natural Science Foundation (8214058), the Scientific Program by Beijing Meteorological Administration (Grant BMBKJ202001005).
Acknowledgments
The authors are thankful to the two reviewers for their comments and suggestions on the original manuscript that improved the presentations of the results.
Conflict of interest
The authors declare that the research was conducted in the absence of any commercial or financial relationships that could be construed as a potential conflict of interest.
Publisher’s note
All claims expressed in this article are solely those of the authors and do not necessarily represent those of their affiliated organizations, or those of the publisher, the editors and the reviewers. Any product that may be evaluated in this article, or claim that may be made by its manufacturer, is not guaranteed or endorsed by the publisher.
References
Aneja, P., Adams, A., and Arya, S. (2000). An observational based analysis of ozone trends and production for urban areas in North Carolina. Chemosphere - Glob. Change Sci. 2, 157–165. doi:10.1016/s1465-9972(00)00007-6
Cai, W., Li, K., Liao, H., Wang, H., and Wu, L. (2017). Weather conditions conducive to Beijing severe haze more frequent under climate change. Nat. Clim. Chang. 7, 257–262. doi:10.1038/NCLIMATE3249
Callahan, C., and Mankin, J. S. (2020). The influence of internal climate variability on projections of synoptically driven Beijing haze. Geophys. Res. Lett. 47 (11), e2020GL088548. doi:10.1029/2020gl088548
Cao, B., and Yin, Z. (2020). Future atmospheric circulations benefit ozone pollution control in Beijing-Tianjin-Hebei with global warming. Sci. Total Environ. 743, 140645. doi:10.1016/j.scitotenv.2020.140645
Casella, G., and Berger, R. (2001). Statistical inference. Belmont, California: Duxbury Press, 521–534.
Cassano, J. J., Uotila, P., and Lynch, A. (2006). Changes in synoptic weather patterns in the polar regions in the twentieth and twenty-first centuries, Part 1: Arctic. Int. J. Climatol. 26, 1027–1049. doi:10.1002/joc.1306
Chen, H., and Wang, H. (2015). Haze days in north China and the associated atmospheric circulations based on daily visibility data from 1960 to 2012. J. Geophys. Res. Atmos. 120, 5895–5909. doi:10.1002/2015jd023225
Chen, Y., Zhao, C., Zhang, Q., Deng, Z., Huang, M., and Ma, X. (2009). Aircraft study of mountain chimney effect of beijing, China. J. Geophys. Res. 114, D08306. doi:10.1029/2008JD010610
Dee, D. P., Uppala, S. M., Simmons, A. J., Berrisford, P., Poli, P., Kobayashi, S., et al. (2011). The ERA-interim reanalysis: Configuration and performance of the data assimilation system. Q. J. R. Meteorol. Soc. 137, 553–597. doi:10.1002/qj.828
Dommenget, D., and Latif, M. (2002). A cautionary note on the interpretation of EOFs. J. Clim. 15 (2), 216–225. doi:10.1175/1520-0442(2002)015<0216:acnoti>2.0.co;2
Du, H., Alexander, L., Donat, M., Lippmann, T., Srivastava, A., Salinger, J., et al. (2019). Precipitation from persistent extremes is increasing in most regions and globally. Geophys. Res. Lett. 46, 6041–6049. doi:10.1029/2019GL081898
Dyson, L. L. (2015). A heavy rainfall sounding climatology over Gauteng, South Africa, using self-organising maps. Clim. Dyn. 45, 3051–3065. doi:10.1007/s00382-015-2523-3
Editorial board of Atmospheric Science Dictionary (1994). Dictionary of atmospheric science. Beijing: China Meteorological Press.
Gong, D. Y., Wang, S. W., and Zhu, J. H. (2001). East Asian winter monsoon and arctic oscillation. Geophys. Res. Lett. 28 (10), 2073–2076. doi:10.1029/2000gl012311
Hersbach, H., Bell, B., Berrisford, P., Biavati, G., Horányi, A., Muñoz Sabater, J., et al. (2018). ERA5 hourly data on pressure levels from 1979 to present. Available at: https://cds.climate.copernicus.eu/cdsapp#!/dataset/reanalysis-era5-pressure-levels?tab=overview (accessed on May 16, 2022).
Huang, W. Y., Chen, R. Y., Yang, Z. F., Wang, B., and Ma, W. Q. (2017). Exploring the combined effects of the Arctic Oscillation and ENSO on the wintertime climate over East Asia using self-organizing maps. J. Geophys. Res. Atmos. 122, 9107–9129. doi:10.1002/2017JD026812
Jensen, A. A., Thompson, A. M., and Schmidlin, F. J. (2012). Classification of Ascension Island and Natal ozonesondes using self-organizing maps. J. Geophys. Res. 117, D04302. doi:10.1029/2011jd016573
Ji, Z., Zhang, Y., Qiao, L., and Sun, J. (2020). Weather forecast manual for Beijing in China. Beijing: China Meteorological Press, 287pp.
Johnson, N. C., Feldstein, S. B., and Tremblay, B. (2008). The continuum of Northern Hemisphere teleconnection patterns and a description of the NAO shift with the use of self-organizing maps. J. Clim. 21 (23), 6354–6371. doi:10.1175/2008jcli2380.1
Kang, Z. M., Jin, R. H., and Bao, Y. Y. (2010). Characteristic analysis of cold wave in China during the period of 1951-2006[ J]. Plateau Meteorol. 29 (2), 420–428.
Katz, R., and Brown, B. (1992). Extreme events in a changing climate: Variability is more important than averages. Clim. Change 21, 289–302. doi:10.1007/bf00139728
Kohonen, T. (1982). Self-organized formation of topologically correct feature maps. Biol. Cybern. 43, 59–69. doi:10.1007/bf00337288
Kohonen, T., Schroeder, M. R., and Huang, T. S. (2001). Self-organizing maps. Berlin, Germany: Springer-Verlag.
Li, F., Jiao, M. Y., Ding, Y. H., and Jin, R. H. (2006). Climate change of Arctic Atmospheric circulation in last 30 years and its effect on strong cold events in China. Plateau Meteorol. 25 (2), 209–219.
Li, H. Y., Lin, S., Wang, Y., Huang, P., and Yu, Y. (2022). Characteristics of cold wave activities in Beijing-Tianjin-Hebei region from 1961 to 2017. J. Arid Meteorology 40 (1), 41–48.
Li, J., Hao, X., Liao, H., Hu, J., and Chen, H. (2021). Meteorological impact on winter PM2.5 pollution in Delhi: Present and future projection under a warming climate. Geophys. Res. Lett. 48, e2021GL093722. doi:10.1029/2021GL093722
Liao, Z. P., Sun, J. R., Yao, J. L., Liu, L., Li, H. W., Liu, J., et al. (2018). Self-organized classification of boundary layer meteorology and associated characteristics of air quality in Beijing. Atmos. Chem. Phys. 18, 6771–6783. doi:10.5194/acp-18-6771-2018
Liu, X., and Guo, X. (2012). Analysis and numerical simulation research on severe surface wind formation mechanism and structural characteristics of a squall line case. Chin. J. Atmos. Sci. 36 (6), 1150–1164. (in Chinese with English abstract). doi:10.3878/j.issn.1006-9895.2012.11212
Liu, Y. G., and Weisberg, R. H. (2005). Patterns of ocean current variability on the West Florida Shelf using the self-organizing map. J. Geophys. Res. 110, C06003. doi:10.1029/2004jc002786
Liu, Y. G., Weisberg, R. H., and Mooers, C. N. K. (2006). Performance evaluation of the self-organizing map for feature extraction. J. Geophys. Res. 111, C05018. doi:10.1029/2005jc003117
Liu, Y., and Weisberg, R. H. (2011). “A review of self-organizing map applications in meteorology and oceanography,” in Self organizing maps-Applications and novel algorithm design (Inno, Honeywell: InTech). doi:10.5772/13146
Loikith, P. C., Lintner, B. R., and Sweeney, A. (2017). Characterizing large-scale meteorological patterns and associated temperature and precipitation extremes over the Northwestern United States using self-organizing maps. J. Clim. 30 (8), 2829–2847. doi:10.1175/Jcli‐D‐16‐0670.1
Mattingly, K. S., Ramseyer, C. A., Rosen, J. J., Mote, T. L., and Muthyala, R. (2016). Increasing water vapor transport to the Greenland Ice Sheet revealed using self-organizing maps. Geophys. Res. Lett. 43, 9250–9258. doi:10.1002/2016GL070424
Miao, Y., Guo, J., Liu, S., Liu, H., Li, Z., Zhang, W., et al. (2017). Classification of summertime synoptic patterns in Beijing and their associations with boundary layer structure affecting aerosol pollution. Atmos. Chem. Phys. 17, 3097–3110. doi:10.5194/acp-17-3097-2017
Pearce, J. L., Waller, L. A., Chang, H. H., Klein, M., Mulholland, J. A., Sarnat, J. A., et al. (2014). Using self-organizing maps to develop ambient air quality classifications: A time series example. Environ. Health 13, 56. doi:10.1186/1476-069X-13-56
Qian, W. H., and Zhang, W. W. (2007). Change in cold wave events and warm winter in China during the last 46 years. Chin. J. Atmos. Sci. 31 (6), 1266–1278.
Reusch, D. B., Alley, B. A., and Hewitson, B. C. (2005). Relative performance of self-organizing maps and principal component analysis in pattern extraction from synthetic climatological data. Polar Geogr. 29 (3), 188–212. doi:10.1080/789610199
Rodriguez-Morata, C., Ballesteros-Canovas, J. A., Rohrer, M., Espinoza, J. C., Beniston, M., and Stoffel, M. (2018). Linking atmospheric circulation patterns with hydro-geomorphic disasters in Peru. Int. J. Climatol. 38 (8), 3388–3404. doi:10.1002/joc.5507
Solidoro, C., Bandelj, V., Barbieri, P., Cossarini, G., and Fonda Umani, S. (2007). Understanding dynamic of biogeochemical properties in the northern Adriatic Sea by using self-organizing maps and k-means clustering. J. Geophys. Res. 112, C07S90. doi:10.1029/2006jc003553
Stauffer, R. M., Thompson, A. M., and Young, G. S. (2016). Tropospheric ozonesonde profiles at long-term us monitoring sites: 1. A climatology based on self-organizing maps. JGR. Atmos. 121, 1320–1339. doi:10.1002/2015JD023641
Swales, D., Alexander, M., and Hughes, M. (2016). Examining moisture pathways and extreme precipitation in the US Intermountain West using self-organizing maps. Geophys. Res. Lett. 43, 1727–1735. doi:10.1002/2015GL067478
Tymvios, F., Savvidou, K., and Michaelides, S. C. (2010). Association of geopotential height patterns with heavy rainfall events in Cyprus. Adv. Geosci. 23, 73–78. doi:10.5194/adgeo-23-73-2010
United Nations (2018).Epartment of economic and social affairs, population division. 2019,World urbanization prospects: The 2018 revision (ST/ESA/SER.A/420). New York: United Nations, 126pp.
Wu, B. Y., and Wang, J. (2002). Possible impact s of winter Arctic oscillation on Siberian High, the East Asian winter monsoon and Sea ice extent. Adv. Atmos. Sci. 19 (2), 297–320.
Xu, H., Zou, H., Li, P., and Tan, B. (2014). Statistical analysis on strong surface wind and its impacts on flight safety at Nyingchi Airport. Plateau Meteorol. 33 (4), 907–915. (in Chinese with English abstract). doi:10.7522/j.issn.1000-0534.2013.00055
Xu, M., Chang, C. P., Fu, C., Qi, Y., Robock, A., Robinson, D., et al. (2006). Steady decline of east Asian monsoon winds, 1969–2000: Evidence from direct ground measurements of wind speed. J. Geophys. Res. 111, D24111. doi:10.1029/2006jd007337
Yamal, B., White, D. A., and Leathers, D. J. (1988). Subjectivity in a computer-assisted synoptic climatology Ⅱ: Relationships to surface climate. J. Climatol. 8, 227–239.
Yan, F., Zhou, S., and Ma, Y. (2014). Variation characteristics of gale in spring and its weather patterns in shijiazhuang. J. Arid Meteorology 32 (2), 207–214. doi:10.11755/j.issn.1006-7639(2014)-02-0207
Yin, Z. C., Cao, B. F., and Wang, H. J. (2019). Dominant patterns of summer ozone pollution in eastern China and associated atmospheric circulations. Atmos. Chem. Phys. 19 (22), 13933–13943. doi:10.5194/acp-19-13933-2019
Yin, Z. C., Li, Y. Y., and Cao, B. F. (2020). Seasonal prediction of surface O3-related meteorological conditions in summer in North China. Atmos. Res. 246, 105110. doi:10.1016/j.atmosres.2020.105110
Yu, B., Li, S., Hao, C., Liu, Y., Du, J., and Lu, L. (2022). Relationship between snowfall in the yanqing zone of winter olympic games and the easterly wind in the boundary layer. Chin. J. Atmos. Sci. 46 (1), 181–190. (in Chinese with English abstract). doi:10.3878/j.issn.1006-9895.2106.21055
Yu, B., Li, S., Huang, F., Jin, N., and Du, J. (2019). Comparative analysis of continuous cold wave events in beijing-tianjin-hebei region in january 2016. J. Arid Meteorology 37 (6), 954–963.
Yu, R., and Zhai, P. (2021). Changes in summer persistent precipitation over the middle–lower reaches of the Yangtze River and associated atmospheric circulation patterns. J. Meteorol. Res. 35, 393–401. doi:10.1007/s13351-021-0186-z
Zhang, J. P., Zhu, T., Zhang, Q. H., Li, C. C., Shu, H. L., Ying, Y., et al. (2012). The impact of circulation patterns on regional transport pathways and air quality over Beijing and its surroundings. Atmos. Chem. Phys. 12 (11), 5031–5053. doi:10.5194/acp-12-5031-2012
Zhang, W., Furtado, K., Wu, P., Zhou, T., Chadwich, R., Marzin, C., et al. (2021). Increasing precipitation variability on daily-to-multiyear time scales in a warmer world. Sci. Adv. 7, eabf8021. doi:10.1126/sciadv.abf8021
Zhou, T. J., and Yu, R. C. (2005). Atmospheric water vapor transport associated with typical anomalous summer rainfall patterns in China. J. Geophys. Res. 110 (8), D08104. doi:10.1029/2004jd005413
Keywords: SOM method, large-scale circulation, synoptic weather system, global warming, severe wind event in spring and winter seasons
Citation: Zhao W, Hao C, Cao J, Lan X and Huang Y (2022) Characteristics of large-scale atmospheric circulation patterns conducive to severe spring and winter wind events over beijing in china based on a machine learning categorizing method. Front. Earth Sci. 10:998108. doi: 10.3389/feart.2022.998108
Received: 19 July 2022; Accepted: 26 August 2022;
Published: 13 September 2022.
Edited by:
Fei Ge, Chengdu University of Information Technology, ChinaCopyright © 2022 Zhao, Hao, Cao, Lan and Huang. This is an open-access article distributed under the terms of the Creative Commons Attribution License (CC BY). The use, distribution or reproduction in other forums is permitted, provided the original author(s) and the copyright owner(s) are credited and that the original publication in this journal is cited, in accordance with accepted academic practice. No use, distribution or reproduction is permitted which does not comply with these terms.
*Correspondence: Jie Cao, MDAzNTQyQG51aXN0LmVkdS5jbg==