Abstract
Recent advances in distributed acoustic sensing (DAS) technology have allowed more intense measurements of subsurface and environment events, providing improved geohazard monitoring and subsurface characterization. This study discussed the subsurface evaluation enabled by the DAS-vertical seismic profiling (DAS-VSP) system in the East China Sea, China. Taking advantage of a continuous recording of the vibrational wavefields through the strain deformation of the fiber deployed along the borehole, DAS-VSP is considered an emerging and promising alternative borehole acquisition method. It provides a wider-spectrum range of recordings in a cheaper, denser, and more continuous tense compared to conventional geophones. We explored the 3D DAS-VSP signal processing and imaging strategy. Based on a set of 3D DAS-VSP data of exceptional quality, this study reviewed the common processing challenges and practical solutions for de-noise, de-ghosting, de-multiple, and wavefield separation arising from the DAS acquisition mechanism in the offshore VSP scenario. High-quality down-going multiples were separated and imaged using the pre-stack Gaussian beam depth migration in addition to the primary reflection wavefield, providing significant additional illumination to support the subsurface evaluation. The current results validated the efficiency of the DAS-VSP survey and encouraged better geological interpretation.
1 Introduction
Uncertainties in subsurface/geohazard evaluation are among the main concerns for safe offshore drilling (Hadley et al., 2008; Acocella, 2015). Better subsurface characterization using geophysical methods can reduce these uncertainties. The emerging fiber-optic distributed acoustic sensing (DAS) technology has demonstrated strengths in monitoring environmental changes (Zhu et al., 2021), near-surface hazards (Fang et el., 2020), and deep subsurface events (Daley et al., 2013). The DAS system uses a fiber optic cable to provide distributed strain sensing based on the internal natural flaws of the thin glass fibers (Krohn et al., 2014). Compared to conventional geophysical sensors (e.g., seismic geophones), the stable performance of the optic fiber under high-temperature, high-hydrogen, and corrosive environments makes it well adapted for ultra-deep wellbore and deep water settings (Zhan, 2020; Li et al., 2021). The past decade has witnessed the rapid development of DAS surveys in many geophysical surveys, including ocean bottom acquisition, vertical seismic profiling (VSP), integrated borehole and surface seismic surveys, 4D reservoir monitoring, and micro-seismic monitoring (Mateeva et al., 2012, 2017, Yu et al., 2016; Zhan et al., 2019).
Unlike surface seismic surveys, whose source and receiver arrays are deployed on the surface, VSP surveys equip three-component (3-C) geophones along the wellbore. Therefore, VSP is advantageous in providing reliable time-depth registration of wave propagation and higher-quality subsurface reflectivity measurements around the wellbore (Stewart et al., 1984; Oristaglio, 1985). Owing to the shortened travel path, the subsurface receivers record higher-resolution and higher signal-to-noise ratio (SNR) wavefields. As the receivers are deployed closer to the subsurface targets, more reliable kinematic and dynamic seismic wave information on the formations (e.g., seismic velocity, quality factor, seismic wavelets, and anisotropy) can be obtained (Gaiser 2016; Wo et al., 2021; Huang et al., 2022).
DAS-VSP, in particular, has gained increased attention as the DAS recording system facilitates cheaper, repeatable, and denser spatial sampling, as well as time-lapse monitoring of subsurface formations and reservoirs (Li et al., 2015; Willis et al., 2021). Several studies have reported on subsurface formation parameters and images from DAS-VSP. Zhang et al. (2020) reported quality factor (Q) estimation for the DAS-VSP data. Horne et al. (2020) analyzed the anisotropy parameters from a walkaway DAS-VSP case. Mizuno and Ali (2021) reported satisfactory results of the application of generalized radon transform migration to DAS-VSP data. Wilson et al. (2021) evaluated carbonate sequestration using a time-lapse 3D DAS-VSP survey.
The present work reviewed a 3D offshore DAS-VSP case in the Pinghu oilfield, East China Sea, China. We explored a list of typical signal processing challenges related to the DAS acquisition system as well as promising solutions.
2 Geologic background
The study area was located on the Pinghu slope to the west of the Xihu Sag, East China Sea (Figure 1). The Pinghu oilfield comprises eight geologic structures, including the Fangheting, Bajiaoting, Wanghuting, and Shuangzhaoting. All of them have provided commercial oil and gas flow from drilled wells. The reservoirs are reported primarily controlled by fractured anticlines (Su et al., 2018). Therefore, the delineation of the fault and fracture networks may provide key clues to understanding the reservoir distribution.
FIGURE 1

Survey area (marked in yellow) is located on the Pinghu slope to the west of the Xihu Sag, East China Sea, China. The distances between the survey area and three adjacent cities, namely, Zhoushan, Ningbo, and Taizhou are 280 km, 338 km, and 346 km, respectively. The map was created using Google Earth.
The dominant fault system extends over 100 km along the north-northeast (NNE) direction and plays a key role in retaining the gas accumulation. Early surface seismic surveys with steamer met great challenges in supplying quality data for deep targets. Moreover, lateral variation around the reservoir in the survey area complicates reservoir characterization given the less-satisfactory image quality of the streamer data. Therefore, in 2021, a new 3D survey with joint ocean-bottom nodes (OBN) and DAS-VSP was carried out to provide an integrated surface and borehole seismic image. Figure 2 shows a schematic configuration of the 3D joint OBN and DAS-VSP survey revised after Walker and McIntosh (2011). The present paper focused on the 3D DAS-VSP survey with the fiber-optical cables deployed in two wells (B1 and B2). The primary objective of this survey was to provide better illumination and finer characterization of the reservoir around the wellbore. This study examined the common challenges in processing the 3D DAS-VSP data and focused on providing an optimized solution and imaging strategy to supply an enhanced final image.
FIGURE 2

Schematic diagram showing the joint ocean-bottom nodes (OBNs) and VSP-DAS survey (revised after Walker and Mclntosh, 2011).
3 3D VSP survey acquisition
To improve the seismic illumination around the target area, the 3D-VSP survey was designed based on the following considerations: 1. to extend the borehole receiver range closely to, if not to penetrate, the target formation at a depth of around 3500 m below the mudline; and 2. to increase the lateral illumination within the maximum capacity of the length of the source array. Therefore, we designed a DAS fiber covering measured depths of 3580 m and 3170 m for wells B1 and B2, respectively. In addition, both wells were planned to deviate to allow wider lateral illumination. The bottoms of the well offsets were 1530 m and 350 m for wells B1 and B2, respectively. Table 1 lists the detailed acquisition parameters.
TABLE 1
| Well name | Depth range (m) | Sampling interval (m) | Source azimuth (°) | Source offset (m) | Source interval (m) | Source array interval (m) | Total shot number |
|---|---|---|---|---|---|---|---|
| B1 | 1-3580 | 1 | 120 | -4000–4000 | 37.5 | 50 | 48411 |
| B2 | 1-3170 | 1 | 120 | -4000–4000 | 37.5 | 50 | 62473 |
3D DAS-VSP acquisition parameters.
We calculated the theoretical fold coverage at wells B1 and B2 around the target formation as shown in Figure 3 based on the designed acquisition parameters. For both wells, the fold counts were >3000 around the wellbore, with a bin size of 20 m. The premium imaging areas were > 8 km2. This survey configuration was believed to be adequate for the 3D-VSP imaging around the target area.
FIGURE 3

Fold coverage map calculated under the designed acquisition configuration for wells (A) B1 and (B) B2. The outermost coral areas mark the coverage of shots while the green lines denote the receiver array.
Figure 4 shows examples of the raw shot gathers at different offsets from near to far (500 m, 1000 m, 2000 m, 3000 m, and 4000 m, respectively). The raw data were generally of good quality, with high signal-to-noise ratio (SNR) events observed throughout the entire depth range in both the down-going and up-going wavefields. In the up-going wavefield, we noticed strong converted-wave events below a depth of 2000 m, which required designated wavefield separation efforts given the acoustic imaging strategy. Both surface and interval multiples appeared to be fairly strong, especially at the near and middle offset ranges. Reverberating noises were observed at several shallow depths, showing zigzag patterns due to the poor cable coupling effect. To ensure a satisfactory image, the signal processing focused on these issues and ensured that the processed wavefield mainly contained the P-wave primary reflections.
FIGURE 4

DAS-VSP raw shot gathers at different offset ranges from near to far (500 m, 1000 m, 2000 m, 3000 m, and 4000 m, respectively).
4 3D DAS-VSP data preparation
The general process of offshore 3D VSP imaging processing includes data loading, geometry setup, trace editing, first break picking, static correction, de-noising, amplitude compensation, deconvolution, wavefield separation, velocity analysis, and migration imaging. Several new challenges in processing offshore DAS-VSP data are reviewed in the following sections.
4.1 Cable-reverberation suppression
Although fiber-optical cables can easily cover the entire borehole with densely distributed sensors, one common issue with fiber cable recording is that proper cable coupling or wellbore cementation cannot always be guaranteed. Poorly coupled sections result in coherent reverberation noise, often referred to as “ringing” or “zigzag” noises (Martuganova et al., 2021). Figure 5A shows a raw section with cable-reverberation noise in the time domain. The signal behaves periodically in both the frequency spectrum and its auto-correlation spectrum, as shown in Figures 5B, C, respectively. The cable reverberations share a frequency range with the primary P-wavefield. Thus, eliminating the cable-reverberation noise at a specific depth range without affecting the reflections can be complicated (Willis et al., 2019).
FIGURE 5
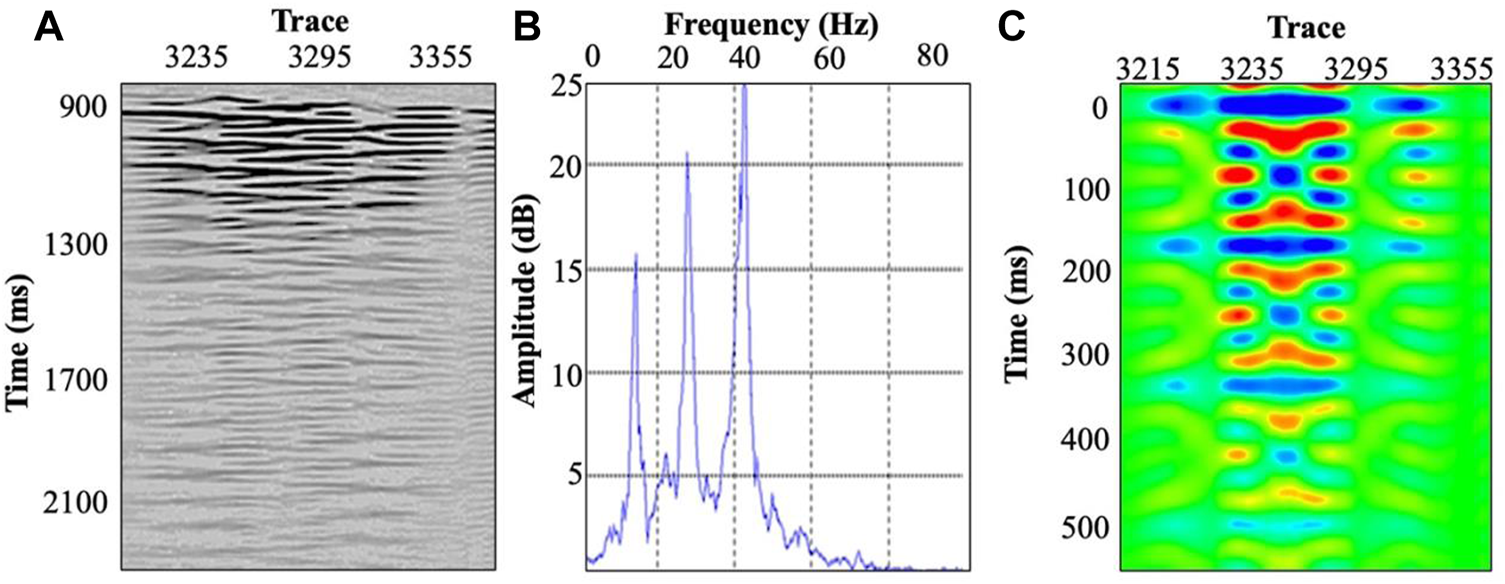
Characteristics of the DAS-VSP zigzag reverberation noise. (A) Raw record. (B) Frequency spectrum. (C) Autocorrelation of the reverberation noise.
The present study applied a cable-reverberation suppression method based on a transform, where refers to the two-way intercept time at the slowness , given the periodic feature in the cable-reverberation’s auto-correlation spectrum domain. This transforms the offset-time (x-t) domain seismic records to the time-slowness () domain, allowing the periodically appearing ringing noises to be predicated using a least-squares linear fit (Turner, 1990).
Figure 6A shows an example of the raw shot gather with the cable-reverberation noises appearing at the shallow depths (indicated by red arrows). Figures 6B, C show the processed shot gather using a domain filter and the removed cable-reverberation noises, respectively. The domain allows better separation of the primary reflection from the cable-reverberation noise. By subtracting the predicted noise from the full record and applying the inverse transform, we obtain the primary wavefields without sacrificing many of the useful signals. The current application proves that the filter can efficiently eliminate DAS-VSP cable-reverberation ringing noise.
FIGURE 6

Example shot gathers (A) before and (B) after the zigzag cable-reverberation noise is removed, as shown in (C). Red arrows: appearance of cable-reverberation noises.
4.2 De-ghosting in the frequency-slowness domain
Another source of noise is the offshore acquisition environment. Offshore acquisition often utilizes an airgun source that fires below the sea surface. When the up-going wave travels across the sea surface, which shows strong impedance contrast at nearly a reflectivity coefficient around -1, a strong reflection (often referred to as a “ghost wave”) with a reversed polarity occurs and propagates downwards. Hence, the ghost wave appears to be similar to the primary wave with a reversed polarity and a delay time window in the shot record. Attenuating ghost waves is critical to ensure the quality of the final image of the primary reflection wavefield. The present study adopted a de-ghost method based on the frequency–wavenumber domain filtering, which is briefly described as follows (Bernth and Sonneland, 1983; Weglein and Dragoset, 2005; Yilmaz and Baysal, 2015; Wang et al., 2016).
We first simplified our problem by assuming that the seismic records contained only the primary and the ghost wavefields. We assumed that other types of noises of interferences were already separated.
Thus, the seismic record ( ‘S’) can be expressed as follows:where P and G represent the primary reflections and ghost waves, respectively.
With the time delay between the ghost wave and the first arrival of the primary wave, denoted by Δτ, we can represent the ghost wavefield aswhere R is the reflectivity coefficient at the boundary of the sea surface to air, which is close to -1. Hence, the polarity of the ghost wave is reversed compared to the primary wave. We further introduce Eq. 2 to equation (1) and rewrite the total wavefields in the frequency-slowness (f-p) domain (or, equivalently, frequency–wavenumber domain) as
Thus, , which is the linear f-p transform operator. Therefore, Eq. 1 can be represented as
The resulting Eq. 4 corresponds to a linear decomposition of the ghost and the primary wavefields that can be solved using the conjugate gradient method by approximating the least-squares solution.
Figure 7 shows the applied de-ghosting result in an example flattened shot gather. Figure 7A shows the raw record with its first arrival event aligned at 100 ms. The dashed red box indicates the strong ghost wave following the first arrival event with identical move-out but reversed polarity, as opposed to the first arrivals. After applying the f-p domain de-ghosting filter, the ghost waves (Figure 7C) were efficiently attenuated, resulting in a more focused primary wavefield (Figure 7B).
FIGURE 7

Example shot gather showing the (A) raw record flattened by the first arrivals, (B) de-ghosting record, and (C) removed ghost wave. Red dashed box: ghost wave following the first arrival with the identical move-out but reversed polarity.
4.3 Wavefield separation
After noise suppression, we next separated the P-wave reflection field for imaging. The wavefield separation plays a critical role in VSP data preparation and greatly affects the final image. One of the most common and effective references to differentiate different wave modes is through their varying apparent velocities. A variety of velocity-based filters have been designed for desired wave modes, including the median filter, F-K filter, and filter (Blias, 2007).
Figure 8A shows an example raw shot gather. As the raw record includes complex wavefields whose behaviors can be differentiated in various domains, we utilized a combination of filters to separate the P-wave primary reflections: we first applied the median and filters to isolate the down-going and up-going fields. As the reflections in this area are distributed mostly in the up-going wavefield, we further separated the P-wave reflections using the F-K and the median filters, as shown in Figure 8B. Figure 8C shows the removed down-going field, which contained the transmitted P- and S-waves.
FIGURE 8

Example shot gather showing the wavefield separation processing. (A) Raw shot gather. (B) Separated P-wave primary reflection. (C) Removed down-going field.
The current study primarily utilized P-wave and compared it to the surface seismic image. However, the S-wave field showed a fairly strong recording even at the near-offset range, given the well deviation. Figure 9 shows an example up-going wavefield of a near-offset shot gather in two-way-time (TWT). The P- and converted S-wave reflections are marked by blue solid and red dashed lines, respectively. Both wavefields are of sufficient quality for utilization. In this example, we further separated the P- and S-mode using an F-K filter in TWT. The separated P-wavefield for acoustic imaging is shown in Figure 9B. A shear-wave image can be achieved when a reasonable S-wave velocity model is available, which is not covered in the present study.
FIGURE 9

An example upgoing wavefield showing (A) the raw record flattened by the first arrivals, and (B) the separated P-wave reflection wavefield. Blue solid lines: P-waves; red dashed lines: SV-waves.
4.4 3D DAS-VSP imaging
Among a variety of well-developed depth migration algorithms, the pre-stack Gaussian beam migration (GBM) has proven advantages in efficiency compared to wave-equation-based methods (e.g., reverse-time-migration) as well as high imaging accuracy compared to the standard Kirchhoff migration (Hill, 1990 and 2001; Etgen et al., 2009). Therefore, we applied this method to migrate the 3D VSP datasets of considerable volume. By constructing the Green’s function with the Gaussian beams, the GBM method allows a weighted summation of the effective rays around the imaging point, which can be expressed aswhere the positions of the source and the calculation point are represented by x and x′, respectively. The horizontal and vertical components of the initial slowness of the central ray are denoted by and , respectively. and are the complex travel time and amplitude, respectively. Finally, represents the energy of the Gaussian beam.
Based on the characteristics of the VSP acquisition configuration, the down-going wavefield from the source to the reflector is considered a forward wavefield, while the up-going wavefield from the reflection point to the receiver is taken as a reverse wavefield. The VSP common-shot-gather pre-stack Gaussian beam depth migration is implemented by first tracing the ray between the source and the receiver. Then, the forward wavefield on the source side and the reverse wavefield on the receiver side are calculated. Finally, we obtain the VSP image by cross-correlating the forward and reverse wavefields. Eq. 6 gives the image condition of the offset VSP common-shot-gather pre-stack Gaussian beam depth migration:where and denote the Green’s function from the source to the image point and from the image point to the receiver, respectively.
4.4.1 Migration of the primary P-wave reflection wavefield
We first image the primary P-wavefield using a 3D velocity profile built from the surface seismic survey. Figure 10 displays an example cross-section of the velocity model projecting the trajectory of Well B1. The final 3D DAS-VSP imaging profiles for both wells are shown in Figure 11. Some fine and enriched details of the layer boundaries, as well as the fault planes around the borehole region, can be revealed on the VSP images to support a better interpretation of the fault/fracture networks and the subsurface evaluation.
FIGURE 10

Cross-section of the smoothed 3D P-wave velocity model used for VSP imaging plotted on top of the surface seismic image. Red solid line: projected trajectory of Well B1.
FIGURE 11

Final images of the 3D DAS-VSP primary reflection wavefields from wells (A) B1 and (B) B2. The original depth migration profiles are converted to the time domain for display.
4.4.2 Migration of down-going multiples
The offshore DAS-VSP data recorded high-quality down-going wavefields, as shown in Figure 8C, which includes not only the primary transmissions but also rich multiples following the first arrivals, which can potentially be utilized for imaging. As the corresponding reflectors of the multiples showed a much wider distribution than the primary reflectors, they can effectively broaden the VSP image range given the proper imaging condition. Although many studies have discussed the mirror migration of down-going multiples in VSP, including interferometric migration by He et al. (2007), generalized Radon transform (GRT) migration by Li et al. (2019), and reverse time migration (RTM) by Jiang et al. (2016); Cheng et al. (2022), no or very few publications have yet proposed migrating the multiples in a DAS-VSP survey using GBM. Inspired by the idea of mirror migration of the down-going wave of the OBN data (as illustrated in Figure 12), we performed mirror migration in the VSP common-receiver gather to migrate the down-going multiples using the GBM method (Jiang et al., 2022; O'Brien et al., 2013). In addition, the down-going multiples show attenuation and dispersion due to the increased travel distances compared to the primaries. Thus, the Q-compensated GBM (Gray and Bleistein, 2009) was reinforced to achieve higher-resolution images.
FIGURE 12

Schematic diagram showing the first-order multiple imaging principle.
A separated down-going multiple wavefield is a prerequisite before imaging. As shown in Figure 13, the primary reflection in the P-wave upgoing domain and the down-going multiples (after the first arrivals were rejected) were mostly separated in the domain. The primary upgoing reflections appeared to be more focused in the negative wavenumber domain, while the down-going multiples were likely to be more extensively distributed in the positive wavenumber domain. However, it remains challenging to distinguish the first- and higher-order multiples for the massive volume of 3D field data when the velocity model is highly uncertain. Future studies are needed to further improve the first- and higher-order multiple wavefields separation for more enhanced images.
FIGURE 13

Separation of upgoing wavefield and down-going multiples in the domain for wells (A) B1 and (B) B2.
The 3D DAS-VSP down-going wavefields for wells B1 and B2 are migrated and displayed in Figures 14A, B. Both images were converted to the time domain to compare time domain surface seismic sections. Figures 15A–C show a comparison of the 2D projected images of the streamer data, OBN data, and the DAS-VSP, respectively. Among the three images, that of the streamer data was more contaminated by noises, especially deeper in the section. The OBN image showed better SNR compared to the streamer image. However, the image quality degraded in the deeper section. The DAS-VSP image was superior, with (1) greatly improved SNR even for deep targets, as indicated by the red circle; and (2) more continuous and smoother events compared to the other two images. Moreover, some details (indicated by the red arrows) were enhanced in the DAS-VSP image, which might support better formation and fault network interpretation. Enlargement of the portion around the target area (marked by the red circles in Figure 15) for the streamer, OBN, and DAS-VSP data, respectively, as shown in Figures 16A–C, showed that the deep target was clearly improved in the 3D DAS-VSP survey, with higher SNR and better amplitude recovery. Similarly, we observed enhancements in the 3D DAS-VSP image (Figure 16F) obtained from Well B2 compared to those from the streamer (Figure 16D) and OBN (Figure 16E) surveys.
FIGURE 14

Final images of the 3D DAS-VSP down-going multiples from wells (A) B1 and (B) B2. The original depth migration profiles are converted to the time domain for display.
FIGURE 15

Comparisons of images from the (A) streamer, (B) OBN, and (C) DAS-VSP data.
FIGURE 16

Enlarged images around the target areas of the (A) streamer data, (B) OBN data and (C) DAS-VSP data from Well B1; as well as the (D) streamer data (E) OBN data and (F) DAS-VSP data from Well B2.
5 Conclusion
The results of this study demonstrated the capability of the evolving DAS technology to characterize the subsurface complexity using an offshore 3D VSP survey acquired in the East China Sea. We explore practical solutions to several characteristic challenges related to this emerging fiber-optic sensing technology applied in a marine VSP acquisition case. We analyzed the cable-reverberation ringing noise in the DAS acquisition system and effectively eliminate it using the domain filter. The strong ghost waves/surface multiples often observed in offshore seismic surveys were separated and suppressed in the f − k/f − p domain. We migrated both the primary reflection wavefield and the down-going multiples using the pre-stack Gaussian beam depth migration. Taking advantage of the high-quality down-going multiples, we provided illumination coverage in addition to the primary reflection field. The Q-compensated migration can be helpful to improve the resolution of the images of multiples. Given that the incident angle of the multiples is often smaller than the primary waves to the same source–receiver pair for the flat layers investigated by a VSP configuration, utilizing the multiple wavefields might benefit the DAS sensing system, as the fiber cable loses its sensitivity large-angle incident P-wavefields. The final image of the down-going multiple supplements the primary reflection image with significantly improved lateral illumination of shallower depth ranges. The current 3D DAS-VSP image showed improvement compared to both streamer and OBN surveys, allowing better subsurface interpretation and formation evaluation.
Statements
Data availability statement
The raw data supporting the conclusion of this article will be made available by the authors, without undue reservation.
Author contributions
YC, JZ, CL, ZC, and PD contributed to the study conception and design. GH and JL supervised and outlined the manuscript, respectively. YC and PD processed the data and prepared the plots. JZ and YC wrote the manuscript. All authors contributed to the manuscript revision and approved the submitted version.
Funding
JZ was funded by the National Natural Science Foundation of China (grant no. 42104130) the China Postdoctoral Science Foundation (grant no. 2021M690536), and the Fundamental Research Funds for the Central Universities. The 2022 Annual Special Issues in Seismic Processing and Interpretation Challenges of BGP (grant no. 03-03-03-2022) funded this study.
Acknowledgments
The authors would like to thank Shanghai Petroleum Corporation Ltd. for sharing the field data and for the permission for publication.
Conflict of interest
YC, ZC, PD, and JL were employed by BGP Inc. China National Petroleum Co., and CL was employed by Shanghai Petroleum Corporation, Ltd.
The remaining authors declare that the research was conducted in the absence of any commercial or financial relationships that could be construed as a potential conflict of interest.
Publisher’s note
All claims expressed in this article are solely those of the authors and do not necessarily represent those of their affiliated organizations, or those of the publisher, the editors, and the reviewers. Any product that may be evaluated in this article, or claim that may be made by its manufacturer, is not guaranteed or endorsed by the publisher.
References
1
Acocella V. (2015). Grand challenges in Earth science: Research toward a sustainable environment. Front. Earth Sci.3, 68. 10.3389/feart.2015.00068
2
Bernth H. Sonneland L. (1983). Society of Exploration Geophysicists, 264–265.Wave field extrapolation techniques for prestack attenuation of water reverberations, SEG Int. Expo. Annu. Meet,
3
Blias E. (2007). VSP wavefield separation: Wave-by-wave optimization approach. Geophysics72 (4), T47–T55. 10.1190/1.2744124
4
Cheng L. Simmons J. Tura A. (2022). Society of Exploration Geophysicists, 3594–3598.Imaging and fold comparison of mirror reverse time migration vs. interferometric imaging for VSP data, SEG Tech. Program Expand. Abstr,
5
Daley T. M. Freifeld B. M. Ajo-Franklin J. Dou S. Pevzner R. Shulakova V. et al (2013). Field testing of fiber-optic distributed acoustic sensing (DAS) for subsurface seismic monitoring. Lead. Edge32 (6), 699–706. 10.1190/tle32060699.1
6
Etgen J. Gray S. H. Zhang Y. (2009). An overview of depth imaging in exploration geophysics. Geophysics74 (6), WCA517–WCA17. 10.1190/1.3223188
7
Fang G. Li Y. E. Zhao Y. Martin E. R. (2020). Urban near surface seismic monitoring using distributed acoustic sensing. Geophys. Res. Lett.47 (6), e2019GL086115. 10.1029/2019gl086115
8
Gaiser J. (2016). 3C seismic and VSP: Converted waves and vector wavefield applications. Soc. Explor. Geophys.36.
9
Gray S. H. Bleistein N. (2009). True-amplitude Gaussian-beam migration. Geophysics74 (2), S11–S23. 10.1190/1.3052116
10
Hadley C. Peters D. Vaughan A. Bean D. “Gumusut-Kakap project: Geohazard characterization and impact on field development plans,” in Proceedings of the International Petroleum Technology Conference, Bangkok, Thailand, March 2008 (European Association of Geoscientists & Engineers). cp-148.
11
He R. Hornby B. Schuster G. (2007). 3D wave-equation interferometric migration of VSP free-surface multiples. Geophysics72 (5), S195–S203. 10.1190/1.2743375
12
Hill N. R. (1990). Gaussian beam migration. Geophysics55 (11), 1416–1428. 10.1190/1.1442788
13
Hill N. R. (2001). Prestack Gaussian-beam depth migration. Geophysics66 (4), 1240–1250. 10.1190/1.1487071
14
Horne S. Armstrong P. Soulas S. (2020). Society of Exploration Geophysicists, 495–499.Deepwater DAS walkaway VSP analysis, SEG Tech. Program Expand. Abstr,
15
Huang X. Greenhalgh S. Han L. Liu X. (2022). Generalized effective biot theory and seismic wave propagation in anisotropic, poroviscoelastic media. J. Geophys. Res. Solid Earth127 (3), e2021JB023590. 10.1029/2021jb023590
16
Jiang T. Zhan G. HanceSugianto T. S. Soulas S. Kjos E. (2016). Society of Exploration Geophysicists, 5582–5586.Valhall dual-well 3D DAS VSP field trial and imaging for active wells, SEG Tech. Program Expand. Abstr,
17
Jiang Z. Sheng J. Yu J. Schuster G. T. Hornby B. E. (2007). Migration methods for imaging different order multiples. Geophys. Prospect.55 (1), 1–19. 10.1111/j.1365-2478.2006.00598.x
18
Krohn D. A. MacDougall T. Mendez A. (2014). Fiber optic sensors: Fundamentals and applications. Bellingham, WA, USA: Spie Press, 233–310.
19
Li W. Mao W. Liang Q. (2019). Society of Exploration Geophysicists, 5325–5329.Joint imaging with primaries and multiples of VSP data by GRT migration, SEG Tech. Program Expand. Abstr,
20
Li Y. Karrenbach M. Ajo Franklin J. B. (2021). A literature review: Distributed acoustic sensing (DAS) geophysical applications over the past 20 years. Distributed Acoust. Sens. Geophys. Methods Appl., 229–291.
21
Li Y. Wu H. Wong W. Hewett B. Liu Z. Mateeva A. (2015). Society of Exploration Geophysicists, 5285–5289.Velocity analysis and update with 3D DAS-VSP to improve borehole/surface seismic images, SEG Tech. Program Expand. Abstr,
22
Martuganova E. Stiller M. Bauer K. Henninges J. Krawczyk C. M. (2021). Cable reverberations during wireline distributed acoustic sensing measurements: Their nature and methods for elimination. Geophys. Prospect.69 (5), 1034–1054. 10.1111/1365-2478.13090
23
Mateeva A. Lopez J. Chalenski D. Tatanova M. Zwartjes P. Yang Z. et al (2017). 4D DAS VSP as a tool for frequent seismic monitoring in deep water. Lead. Edge36 (12), 995–1000. 10.1190/tle36120995.1
24
Mateeva A. Mestayer J. Cox B. Kiyashchenko D. Wills P. Lopez J. et al (2012). Advances in distributed acoustic sensing (DAS) for VSP. SEG technical program expanded abstracts. Soc. Explor. Geophys.5.
25
Mizuno T. Ali S. (2021). Society of Exploration Geophysicists, 422–426.Benchmarking DAS VSP migration methods with geophone VSP migration: Case study for the generalized Radon transform migration, First Int. Meet. Appl. Geoscience Energy,
26
O'Brien J. Farmani B. Atkinson B. (2013). VSP imaging using free-surface multiples: A case study from the gulf of Mexico. Lead. Edge32 (10), 1258–1266. 10.1190/tle32101258.1
27
Oristaglio M. L. (1985). A guide to current uses of vertical seismic profiles. Geophysics50 (12), 2473–2479. 10.1190/1.1441878
28
Stewart R. R. Huddleston P. D. Kan T. K. (1984). Seismic versus sonic velocities: A vertical seismic profiling study. Geophysics49 (8), 1153–1168. 10.1190/1.1441745
29
Su A. Chen H. Chen X. He C. Liu H. Li Q. et al (2018). The characteristics of low permeability reservoirs, gas origin, generation and charge in the central and Western Xihu depression, East China Sea Basin. J. Nat. Gas Sci. Eng.53, 94–109. 10.1016/j.jngse.2018.01.034
30
Turner G. (1990). Aliasing in the tau-p transform and the removal of spatially aliased coherent noise. Geophysics55 (11), 1496–1503. 10.1190/1.1442797
31
Walker C. McIntosh S. “Autonomous nodes–the future of marine seismic data acquisition?,” in Proceedings of the 12th International Congress of the Brazilian Geophysical Society & EXPOGEF, Rio de Janeiro, Brazil, August 2011 (Society of Exploration Geophysicists and Brazilian Geophysical Society), 1–6.
32
Wang C. Gu H. M. Xu Z. Q. Fang Z. Y. Tang Y. J. Zhang J. N. et al (2016). The application of adaptive iteration inversion algorithm to deghost for marine variable-depth streamer data in frequency-slowness domain. Chin. J. Geophys.59 (12), 4677–4689.
33
Weglein A. B. Dragoset W. H. (2005). Multiple attenuation. Tulsa, Oklahoma: Society of Exploration Geophysicists.
34
Willis M. E. Ellmauthaler A. Wu X. LeBlanc M. J. (2021). Important aspects of acquiring distributed acoustic sensing (DAS) data for geoscientists. Distributed Acoust. Sens. Geophys. Methods Appl., 33–44.
35
Willis M. E. Wu X. Palacios W. Ellmauthaler A. (2019). Society of Exploration Geophysicists, 5310–5314.Understanding cable coupling artifacts in wireline-deployed DAS VSP data, SEG Int. Expo. Annu. Meet.
36
Wilson G. A. Willis M. E. Ellmauthaler A. (2021). Evaluating 3D and 4D DAS VSP image quality of subsea carbon storage. Lead. Edge40 (4), 261–266. 10.1190/tle40040261.1
37
Wo Y. Zong J. Hu H. Zhou H. W. Stewart R. R. (2021). Velocity model building for single-offset VSP data via deformable-layer tomography: A Texas salt dome example. Geophysics86 (4), U63–U73. 10.1190/geo2020-0394.1
38
Yilmaz O. Baysal E. European Association of Geoscientists & Engineers, June 2015, An effective ghost removal method for marine broadband seismic data processing, Proceedings of the 77th EAGE Conference and Exhibition, Madrid, Spain,
39
Yu G. Cai Z. Chen Y. Wang X. Zhang Q. Li Y. et al (2016). Walkaway VSP using multimode optical fibers in a hybrid wireline. Lead. Edge35 (7), 615–619. 10.1190/tle35070615.1
40
Zhan G. Li Y. Tura A. Willis M. Martin E. (2019). Introduction to special section: Distributed acoustic sensing and its oilfield potential. Interpretation7 (1). 10.1190/int-2019-0116-spseintro.1
41
Zhan Z. (2020). Distributed acoustic sensing turns fiber optic cables into sensitive seismic antennas. Seismol. Res. Lett.91 (1), 1–15. 10.1785/0220190112
42
Zhang M. Zhao X. Wilson G. A. Willis M. E. Barrios O. (2020). Q estimation from geophone and DAS VSPs. SEG technical program expanded abstracts. Soc. Explor. Geophys., 475–479.
43
Zhu T. Shen J. Martin E. R. (2021). Sensing Earth and environment dynamics by telecommunication fiber-optic sensors: An urban experiment in Pennsylvania, USA. Solid earth.12 (1), 219–235. 10.5194/se-12-219-2021
Summary
Keywords
subsurface characterization, East China Sea, 3D VSP, seismic signal processing, DAS
Citation
Chen Y, Zong J, Liu C, Cao Z, Duan P, Li J and Hu G (2023) Offshore subsurface characterization enabled by fiber-optic distributed acoustic sensing (DAS): An East China Sea 3D VSP survey example. Front. Earth Sci. 11:1033456. doi: 10.3389/feart.2023.1033456
Received
31 August 2022
Accepted
05 January 2023
Published
17 January 2023
Volume
11 - 2023
Edited by
Yunhui Zhang, Southwest Jiaotong University, China
Reviewed by
Gulan Zhang, Southwest Petroleum University, China
Ge Zhan, TGS-NOPEC Geophysical Company (Norway), Norway
Updates
Copyright
© 2023 Chen, Zong, Liu, Cao, Duan, Li and Hu.
This is an open-access article distributed under the terms of the Creative Commons Attribution License (CC BY). The use, distribution or reproduction in other forums is permitted, provided the original author(s) and the copyright owner(s) are credited and that the original publication in this journal is cited, in accordance with accepted academic practice. No use, distribution or reproduction is permitted which does not comply with these terms.
*Correspondence: Jingjing Zong, jjingzong@gmail.com
This article was submitted to Environmental Informatics and Remote Sensing, a section of the journal Frontiers in Earth Science
Disclaimer
All claims expressed in this article are solely those of the authors and do not necessarily represent those of their affiliated organizations, or those of the publisher, the editors and the reviewers. Any product that may be evaluated in this article or claim that may be made by its manufacturer is not guaranteed or endorsed by the publisher.