 David Gallo-Vélez
 Juan Camilo Restrepo
 Alice Newton
- 1CIMA, Centre of Marine and Environmental Research\ARNET - Infrastructure Network in Aquatic Research, University of Algarve, Campus de Gambelas, Faro, Portugal
- 2Facultad de Ciencias Marinas y Ambientales, Universidad de Cádiz, Cádiz, Spain
- 3Grupo de Investigación en Geociencias GEO4, Departamento de Física y Geociencias, Universidad del Norte, Barranquilla, Colombia
River-mouth systems and deltas are hotspots where many of the coastal syndromes can be found. Moreover, these systems provide essential ecosystem services (e.g., recreation, food provisioning, protection against natural hazards). The present study focuses on the socio-ecological system at the delta of the Magdalena River in the central Caribbean Region in Colombia. This research seeks to assess the multidimensional sustainability of the Magdalena river-mouth system (MRm-SES) to improve the knowledge basis for its integrated management. To do so, an assessment tool named “Circles of Coastal Sustainability” (CCS) was used to evaluate the system splitting it into four domains (environmental, social, economic and governance) that were divided into 5 categories each. These domains were evaluated through a total of 52 indicators distributed like this: 16 for the Environmental domain, 16 for the Economic domain, 12 for the Social and Cultural domain and, 8 for the Governance domain. The results show that the overall sustainability of the MRm-SES is classified as “Satisfactory.” None of the domains is in “Excellent” or “Bad” conditions. However, the evaluation of the categories shows that four (4) of them have “Poor” conditions (i.e., Social Benefits, Demographics, Economic Security, and Resources Management). Hence, it is recommended to put those categories at the centre of the discussion to define management strategies (e.g., Preserving and restoring habitats; tackling sources of pollution and excessive sediment; local reduction of net Greenhouse Gas and adaptation to climate change; participation of local communities in the management design and implementation), without disregarding the interrelation with the other categories and dimensions. Finally, it is argued that despite all the improvement opportunities, the CCS is a valuable tool to evaluate and communicate with different stakeholders (academic community, managers and decision-makers, local communities, etc.), to improve the sustainability of coastal systems in Colombia and the world.
1 Introduction
The ocean and its related habitats, including the coastal areas, provide benefits to the global community (e.g., climate regulation, coastal protection, food, recreation, transport routes). However, those benefits rely on the maintenance of the natural processes, marine species and ecosystem functioning which can be affected by human activities (United Nations, 2021). Coasts are special habitats in the transitional zone between land and sea forming part of a land-ocean continuum system (Crossland, 2005). Due to its variety of landscapes and matching services, coasts have always been places of particular interest for human settlers. According to the United Nations, 2.8 billion people live within 100 km of the coast (Future Ocean, International Ocean Institute, German Marine Research Consortium, mare, 2017). Consequently, coastal systems are subject to multiple syndromes including sediment unbalance, variation in water flows, eutrophication and contamination due to inputs from inland activities (e.g., industry, agriculture), changes in land-use and destruction of natural cover, urban sprawling, loss of biodiversity, exploitation of non-renewable resources and global change (e.g., climate change and sea-level rise) (Newton et al., 2012). All these syndromes can be connected to 5 main drivers of change that affect the ocean’s status, for better or for worse, and they are: population growth and demographics, economic activities, technological advances, changing governance structures and geopolitical instability and climate change (United Nations, 2021).
Along the coast is possible to find river-mouth systems and deltas which are hotspots where many of the coastal syndromes can be found (Newton et al., 2012). Historically, these systems have been profoundly influenced by human activities, for example, agriculture and forestry influence the delta growth due to the negative effects in the basin that increase erosion and sediment transport by the rivers. Another example of human-driven changes in deltas is their subsidence due to the extraction of fluids (e.g., water or oil) that leads to the compaction of the sediment layers reducing its volume and contributing to higher relative sea-level rise rates (Davis and FitzGerald, 2020). Increased urbanization and industrialization, changing hydrogeomorphology, large-scale engineering projects and climate change, among others, are also pressures and hazards for these systems (Elliott et al., 2019).
The present study focuses on the socio-ecological system formed at the main river-mouth (i.e., Bocas de Ceniza) of the Magdalena River (henceforth MRm-SES). The Magdalena River basin is the largest watershed in the northern Andes of South America. Along its axis lives approximately 80% of the population in Colombia and houses 80% of the GDP. The sediment yield for this basin is the highest among the rivers draining in the Caribbean coast and the sediment discharges have the same magnitude of rivers with larger basins (e.g., Paraná, and Orinoco) (Restrepo et al., 2017). Both Exogenic Unmanaged Pressures (ExUP) and Endogenic Managed Pressures (EnMP) affect the Magdalena River delta (Elliott et al., 2017). The former, are those outside the study (or managed) area and their causes cannot be directly tackled within that particular system. However, the system still needs to deal with their consequences or state changes, such as sedimentary unbalance, climate change, eustatic sea-level change, soil denudation/erosion in the basin, sea surface temperature change, plastic litter influxes (transported by marine currents and fluvial fluxes), increased flux of contaminants (e.g., litter and toxic substances) and nutrient inputs from the Magdalena river, among others (Restrepo-Ángel, 2008; Restrepo-Ángel et al., 2015; Restrepo et al., 2016; Tejeda-Benítez et al., 2018; Acosta-Coley et al., 2019; Bustos Usta and Torres Parra, 2021). On the other hand, the Endogenic Managed Pressures (EnMP) are those that occur within the study area and can be directly managed. Some examples are littering and waste generation, nutrients and other contaminants inputs, untreated or inadequately treated wastewater disposal to soil and water bodies, deforestation, infrastructure construction, irruption of sediment inputs and the littoral drift, introduction of alien species, among others (Tosic et al., 2018; Rangel-Buitrago et al., 2019; Chacon et al., 2020; Portz et al., 2020; Torres-Bejarano et al., 2020; Villate et al., 2020; Rangel-Buitrago et al., 2021; Ávila and Gallo, 2021).
The starting point of this research was the question: Is the Magdalena River-mouth socio-ecological system sustainable? Other complementary questions emerged from the main one: What indicators can be used/developed to assess the sustainability of the system? What are the categories/domains that require the most attention/action? Can a socio-ecological assessment of the Magdalena river-mouth system help to improve the management of the study area? Hence, the present study is an attempt to understand the main issues hindering the sustainability of the MRm-SES, leaving behind a sectorial view and moving towards a holistic approach that recognizes not only the multiple interactions that occur within the system but also the existent connections with other compartments that have been commonly managed as separate components (e.g., the river basin and the sea) whereas, in reality, they work as whole system interchanging matter and energy. Identifying and understanding the key issues in the different domains of the system and how these interact with each other, is the first step to inform decision-makers and/or to define strategies for tackling the main problems and move towards a sustainable system.
2 Methodology
2.1 Study area
The Magdalena River delta is arcuate and has an estimated area of 1,690 km2. After passing through Calamar, the Magdalena River splits and most of the flow (i.e., >90%) continues its course to the main mouth at ‘Bocas de Ceniza’, near the city of Barranquilla. Additionally, the river has a secondary mouth at Cartagena’s and Barbacoas’ bay where a 10th of the streamflow is discharged through an artificial structure called “Canal del Dique.” The waters from this river also represent an important influx of fresh water for the largest and most complex of Colombia’s swamp marshes: the “Cienaga Grande de Santa Marta - CGSM” (Restrepo et al., 2016; Ávila and Gallo, 2021) which is connected to the Magdalena River through various canals and, depending on the climate and hydrological conditions (i.e., dry/wet season along the Magdalena basin) and other forcing variables such as tides and wind, the fluxes on some of these canals can come to a halt or even flow in the opposite direction (i.e., from the Cienaga towards the River). Figure 1 provides a simplified graphical representation of the Magdalena River basin and its connection to the Caribbean Sea.
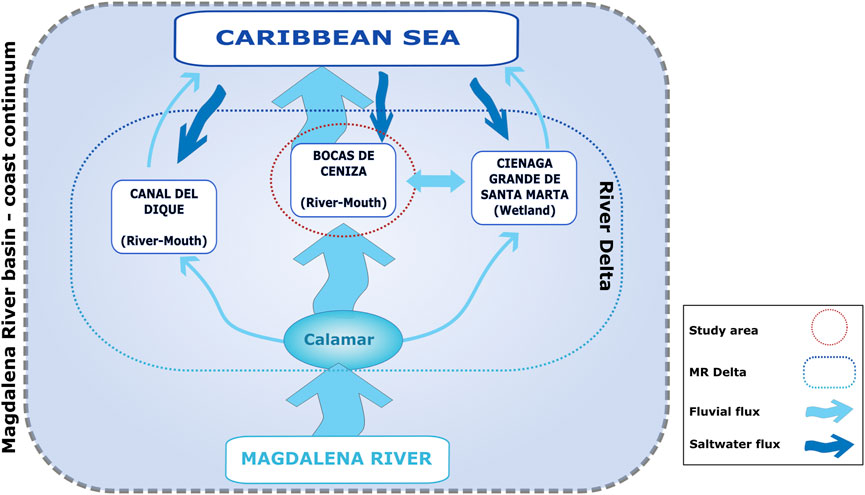
FIGURE 1. The Magdalena River basin—coast continuum. Conceptual diagram.
The delta of the Magdalena River is located in Colombia’s central Caribbean region. It is an area of utmost importance for the environmental and socio-economic dynamics of the Caribbean region in Colombia. To illustrate the socio-economic importance of this deltaic system we can consider that the two main cities of the Caribbean region (i.e., Cartagena and Barranquilla Metropolitan Area—BMA) are in this delta. Considering only the population of those two cities (i.e. 3 million people), the Magdalena Delta is home to nearly a quarter of the population in the Caribbean region of Colombia in 2018 (excluding Antioquia) (DANE, 2018). In economic terms, Atlántico and Bolívar produce more than half and nearly 8% of the Colombian Caribbean region and Colombia’s GDP during 2018, respectively. (DANE, 2021b).
The present assessment is focused on the socio-ecological system of the Magdalena River delta at ‘Bocas de Ceniza’, henceforth, referred to as MRm-SES. It covers a stretch of coast which encompasses a 90-km coastline with NE-SW primary orientation and some sectors E-W-oriented (See Figure 2). The study area has an extension of 390,000 ha, 60% corresponds to land and the remaining 40% corresponds to the marine area. Of the total area, a small portion (i.e., 11%) is within the jurisdiction of the Santa Catalina municipality (Bolívar department) whereas most of the study area is located within the administrative boundaries of the Atlántico department. It is important to note that every time a reference to “Study Area” is made in this document, it corresponds to the red polygon in Figure 2 unless otherwise stated.
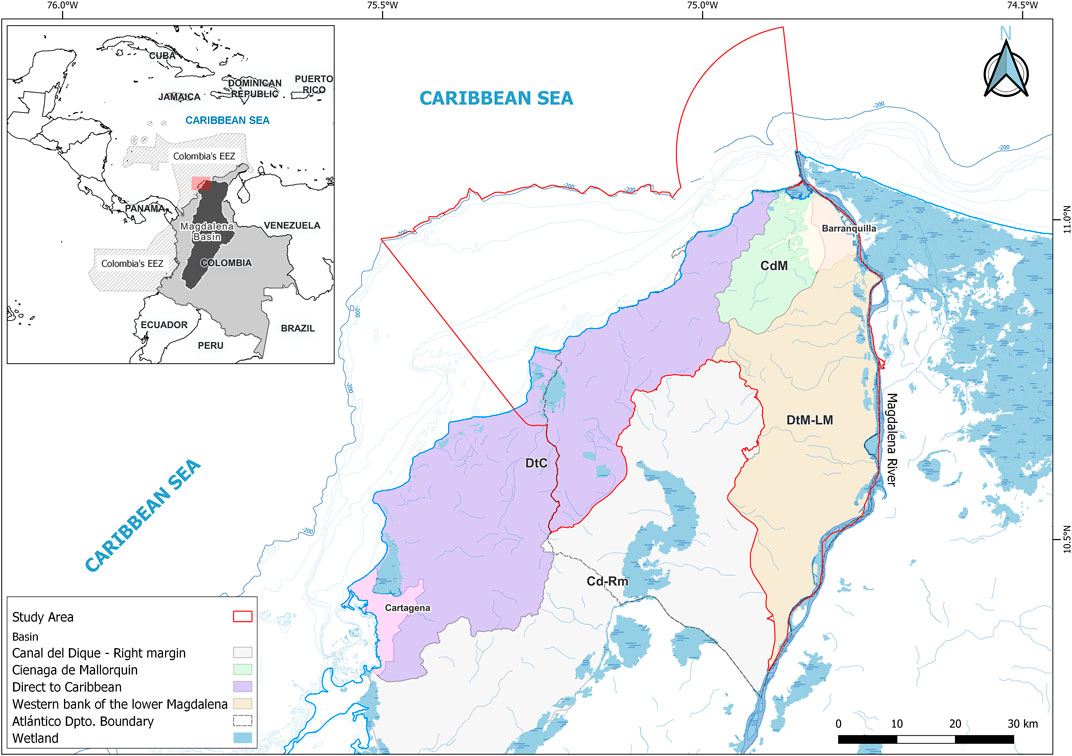
FIGURE 2. Location of the study area (Coordinate Reference System EPSG 4326—WGS 84).
Delimitation of the study area was, first and foremost, based on environmental aspects, namely, drainage basins discharging its waters to the left margin of the lower Magdalena River (between Calamar and Bocas de Ceniza) and directly to the Caribbean Sea; the continental shelf (i.e., isobath −200 m or 12 nautical miles from the low water line in areas where the continental shelf was very narrow such as in front of ‘Bocas de Ceniza’). Further adjustment was done based on administrative aspects (e.g., urban settlements, and municipal and departmental boundaries). In cases where the administrative criteria led to an obvious disruption of a continuous habitat (e.g., “Ciénaga del Totumo” that is shared between the Atlántico and Bolívar departments), preference was given to the environmental criterium.
The Atlántico department is divided into four (4) drainage basins (see Figure 2). The four (4) drainage basins (or hydrographic sub-zones as called by the Institute of Hydrology, Meteorology and Environmental Studies - IDEAM in Colombia) are “Canal del Dique—Right Margin” (Cd-Rm), “Ciénaga de Mallorquin” (CdM), “Direct to the Caribbean” (DtC) and “Western bank of the lower Magdalena” (DtM-LM). A brief description of each of these basins is presented in Table 1.
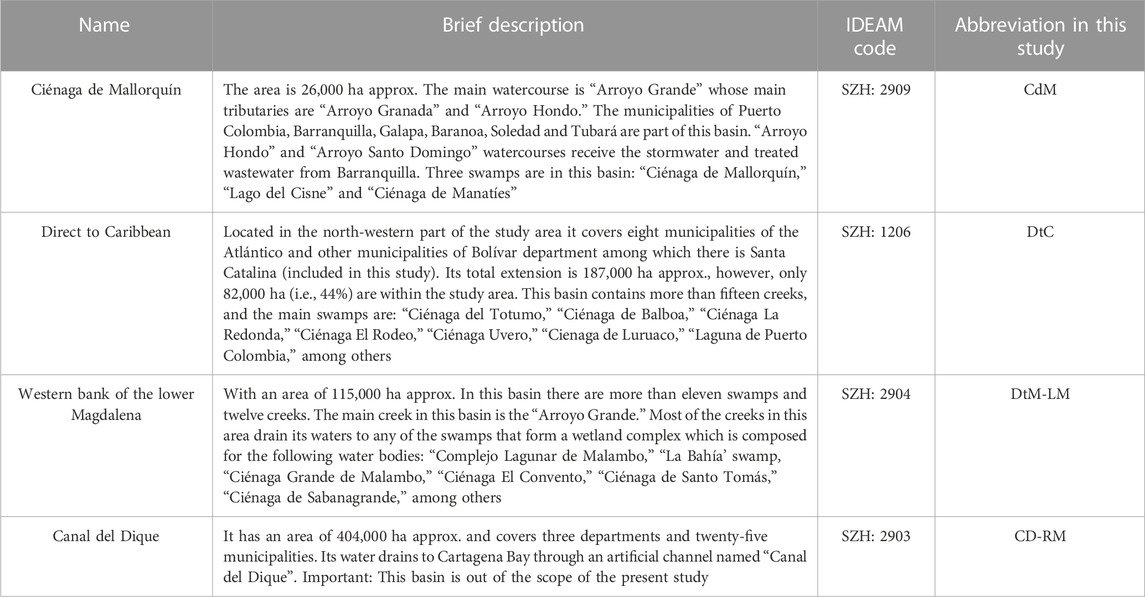
TABLE 1. Drainage basins in the Atlántico department.
The present study focuses on the CdM, DtC and DtM-LM drainage basins, considering that the pressures and impacts that are manifested in them can have direct or indirect repercussions on the coastal zone and marine waters. The first basin (i.e., Cd-Rm), in the south of the Atlántico, was excluded since it is part of the “Canal del Dique” subsystem, which is beyond the scope of the present assessment.
2.2 Socio-ecological assessment framework
There are different frameworks for the assessment of socio-ecological systems. However, they are usually focused on either the social domain (e.g., How’s Life? The safe and just space for humanity) (OECD, 2020); the environmental domain (e.g., Planetary Boundaries, Ocean Health Index) (Steffen et al., 2015; Halpern, 2020); or in evaluating the causes and responses to particular problems or ecosystem services (e.g., DPSIR, DAPSIWRM and Ecosystem Services Approach) (Patrício et al., 2016; Elliott et al., 2017).
In other cases, a more holistic approach has been considered (e.g., Circles of Sustainability) (James, 2015). However, that framework was developed for urban environments and does not take into consideration the particularities of the coastal areas which include, among others: natural habitats and their functionality are more relevant in a coastal setting (where both urban and natural areas interact) than it is in an urban area; Hydrodynamics play an important role in shaping the coast; Economic activities at coastal zones are strongly linked to the ocean (i.e., Blue Economy); the fact that coastal zones intrinsically represent the interaction with river basins and the ocean, requires management that goes beyond the traditional administrative or geographic boundaries (e.g., management of fisheries usually requires a regional rather than a local approach). Hence, this study uses an adaptation of the Circles of Coastal Sustainability (CCS) which was developed with the idea of having a multidimensional approach to evaluating coastal systems (de Alencar et al., 2020).
The CCS was developed to assess the “critical processes that facilitate/constrain sustainability of the world’s coastal zones. The (…) framework can support management by identifying key features that influence environmental sustainability and human wellbeing” (P. de Alencar et al., 2020). To achieve this, the CCS relies on a transdisciplinary approach that involves four (4) domains: Environment, Society and Culture, Economy, and Governance. Those domains are divided into five (5) categories and, each category can be divided into different sub-categories allowing the assessment to account for the distinct levels of resilience, resistance, and hysteresis of local conditions (de Alencar et al., 2020).
The CCS was constructed in a way where domains and categories should remain invariable to avoid “reductionist efforts focused on individual components that can overlook critical interactions.” That is, the four (4) domains and the five (5) categories within each domain should be kept for all cases were CCS is used to evaluate the sustainability of a coastal system. However, subcategories and their indicators can be selected or created upon local specificity and data availability which allows its adaptation to different coastal areas of the world, even though the framework was developed and first applied in the context of a developed country of the European Union (de Alencar et al., 2020). In other words, some of the indicators used in the present study might not be applicable to other systems either because there are different biophysical characteristics (e.g., “Tropical Dry Forest cover change” is not and useful indicator in middle-latitudes systems) or because the information is not available (e.g., “Livelihood diversification Index” might no be used in other systems).
In this adaptation for the Magdalena delta, a semi-quantitative approach is used to assign the scores for most of the indicators with the purpose of reducing the bias that comes from scoring them based on expert qualitative judgement (i.e., four of them were scored based on expert judgement). Specifically, in this study, preponderance is given to less subjective criteria, favouring reference values which are defined following the decision tree shown in Figure 3 where the Absolute Quantitative Thresholds are preferred (e.g., zero poverty) to benchmarking or qualitative comparison against existing literature or based on expert judgement (e.g., Port Infrastructure) which is the last resource to use in absence of adequate quantitative indicators.
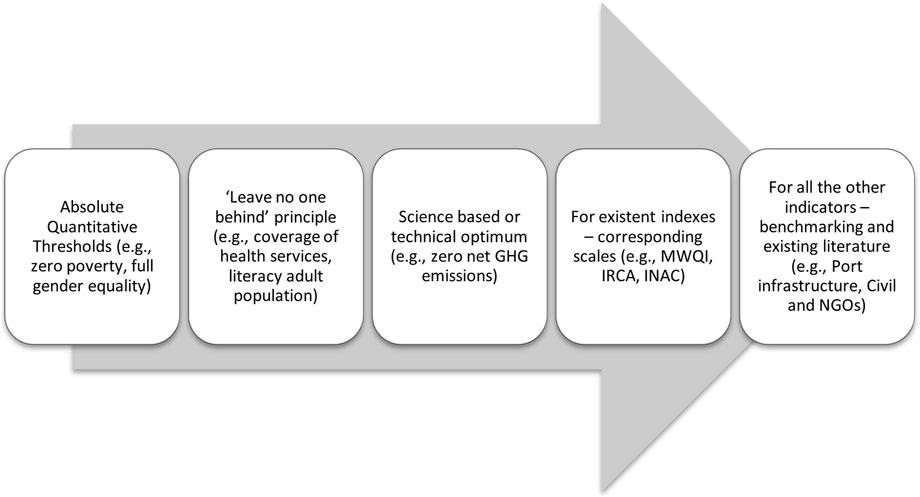
FIGURE 3. Decision tree to define thresholds (upper and lower boundaries) for the indicators. Source: adapted from Sachs et al. (2021).
Additionally, the idea of establishing categorical values for the chosen indicators guarantees that the application of this framework in similar systems (i.e., given the same or similar indicators can be used) can be conducted by different subjects/organizations leading to the same or very similar results.
2.2.1 Subcategories and indicators for the MRm-SES
The CCS framework allows the selection of sub-categories and indicators that are adapted to the local context. A list with 52 indicators (i.e., 16 for the environmental domain, 12 for the social domain, 16 for the economy domain and, 8 for the governance domain) was chosen for the Magdalena River mouth (see Table 2) more information can be found in the Supplementary Material (Table 2 - CCS Magdalena River-mouth Summary).
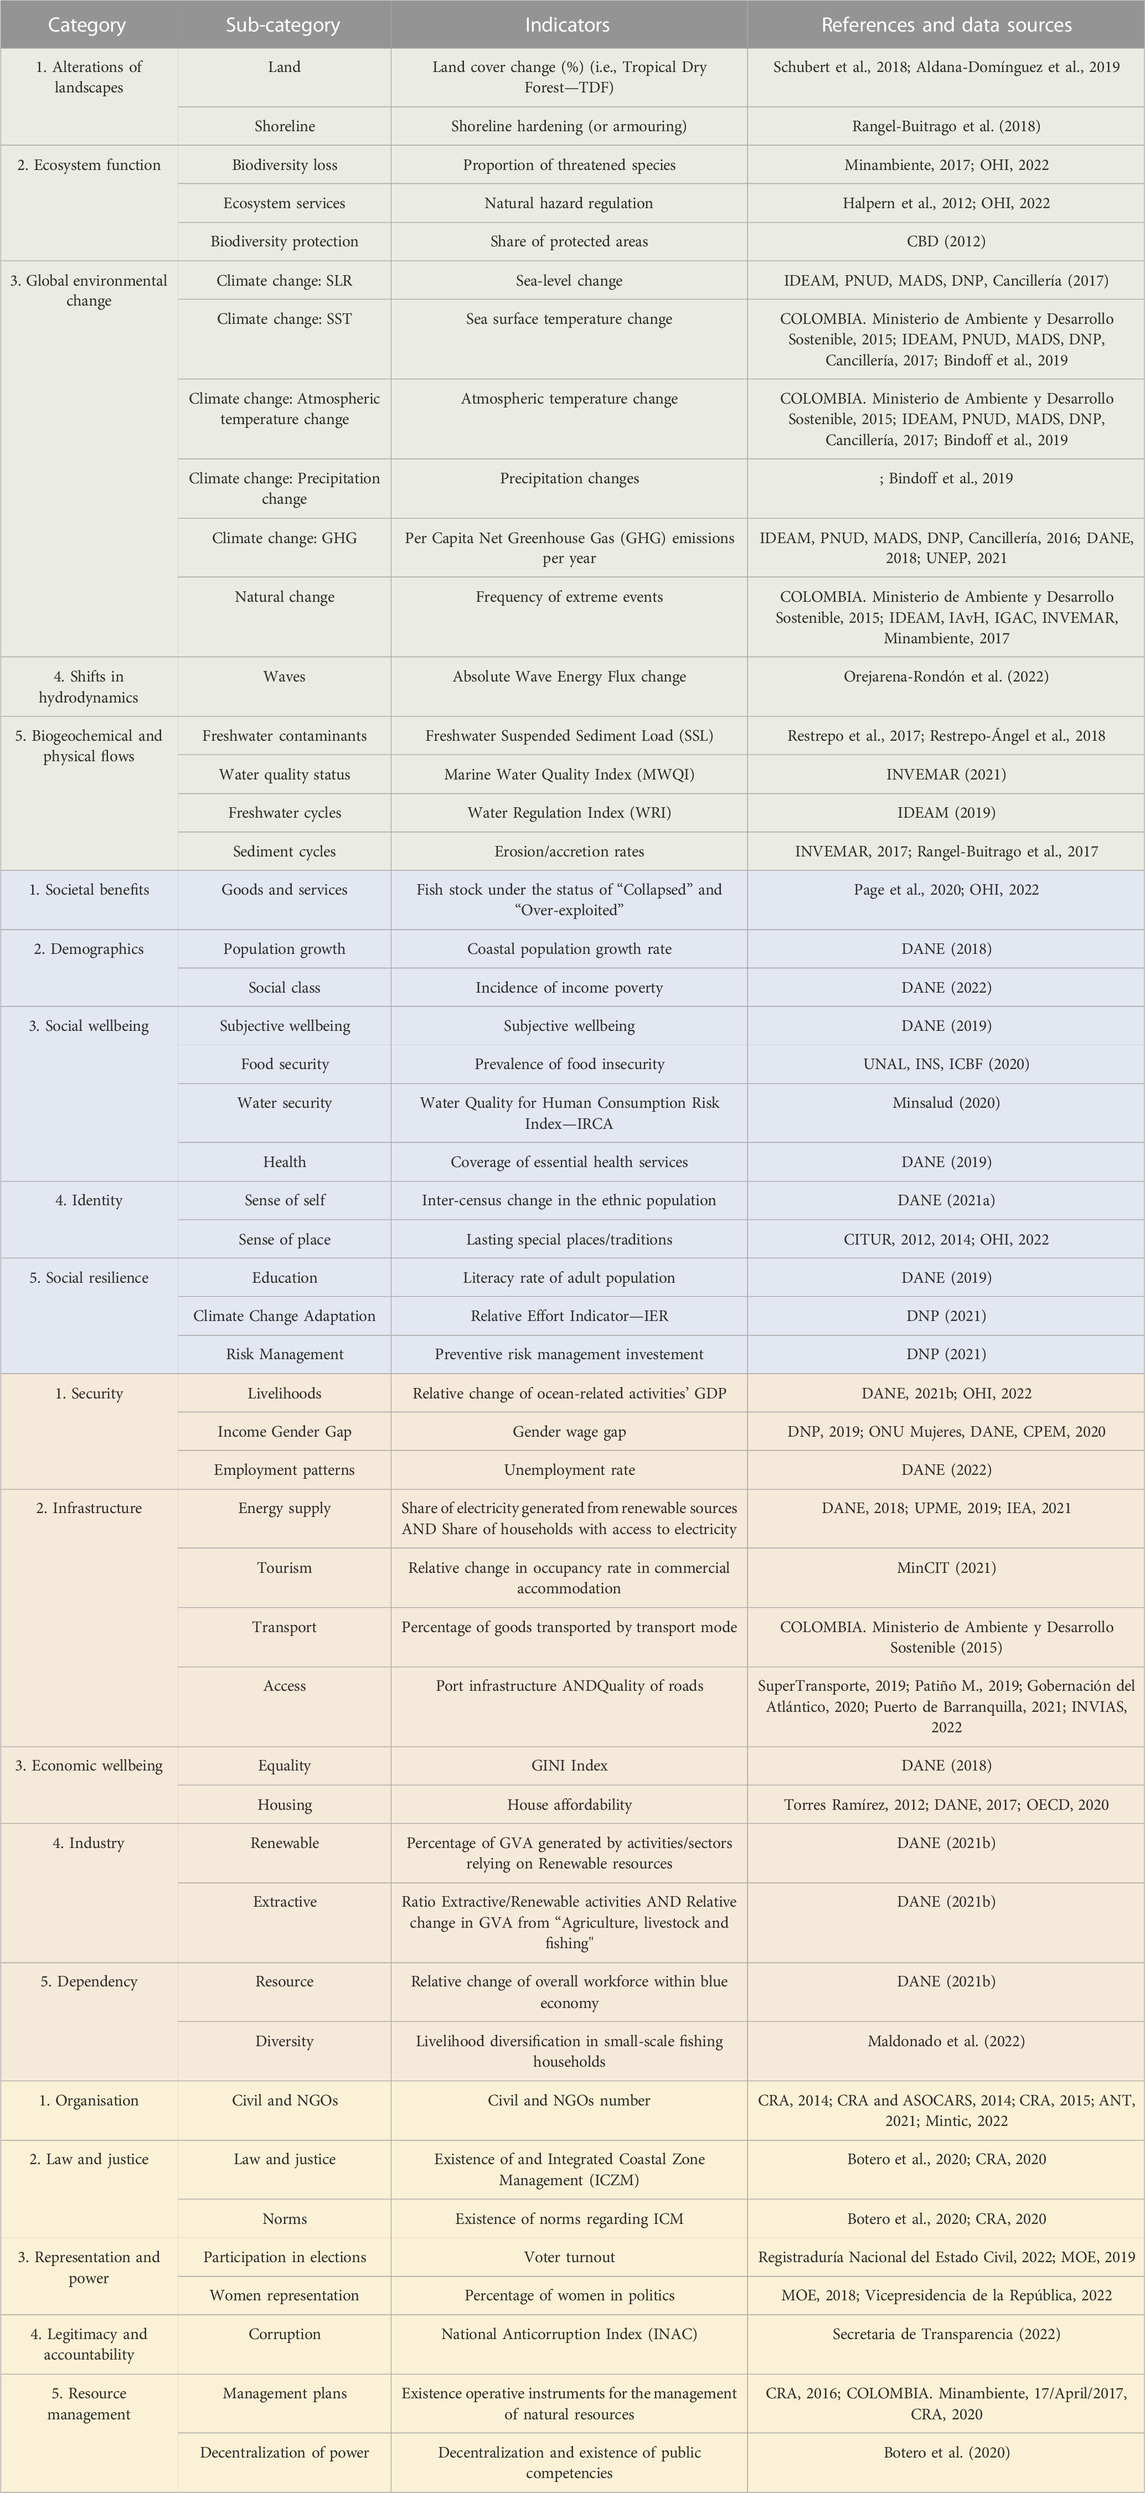
TABLE 2. Indicators used for the present assessment with their corresponding data sources. Note: colours indicate the different domains as follows: Environmental (Green), Social and cultural (Blue), Economy (Orange) and, Governance (Yellow). The colour coding is kept throughout the document.
Where possible, the chosen indicators correspond to those officially used at the national or international level (e.g., OECD or SDG indicators). Where insufficient data was available for an official indicator, or to close data gaps, other metrics from secondary and unofficial providers were selected. “The selection criteria included the practicability of each indicator, the availability of data to support them, and the communicability of the information conveyed by them to managers and other stakeholders” (de Alencar et al., 2020).
2.3 Sustainability score: Defining thresholds, normalization, weighting, and aggregation
Sustainability scores or levels for each indicator range from one (1) to five (5) where the lowest score represents the worst condition and is described as “Bad” and the highest score is obtained when the system presents optimal conditions and is considered ‘Excellent’, in-between is possible to find the “Poor” (Score = 2), “Satisfactory” (Score = 3) and “Good” (Score = 4) levels. Calculating a sustainability score for the domains, categories and indicators involves the following steps: (i) establishing sustainable or performance thresholds; (ii) rescale the data to ensure comparability across indicators (normalization); (iii) aggregating the indicators within subcategories and categories.
2.3.1 Establishing sustainability thresholds
The upper boundary or ideal conditions for each indicator were determined using a decision tree based on the methodology from Sachs et al. (2021) (see Figure 3). Each indicator distribution was censored so that all values exceeding the upper bound scored five (5), and values below the lower bound scored one (1).
It was difficult to define a quantitative scale and ranges for the discretization for four (4) of the indicators. Therefore, a set of conditions based on available literature and expert judgment were used to assign the score. Due to the high uncertainty and subjectivity of this qualitative approach, the indicators using that scoring method were only assessed within the intermediate categories (i.e., Poor, Satisfactory and Good). In other words, they could not achieve an “Excellent” or “Bad” status.
2.3.2 Normalization
To make the data comparable across indicators, “Categorical scales” were defined for the majority of the indicators (OECD and JRC, 2008). Ranges of values were established (i.e., brackets) within the upper and lower limits of each variable/indicator that correspond to a score on the CCS framework scale that goes from one (1) to five (5) as explained above. The categorical ranges defined for each of the quantitative variables are shown in Table 3.
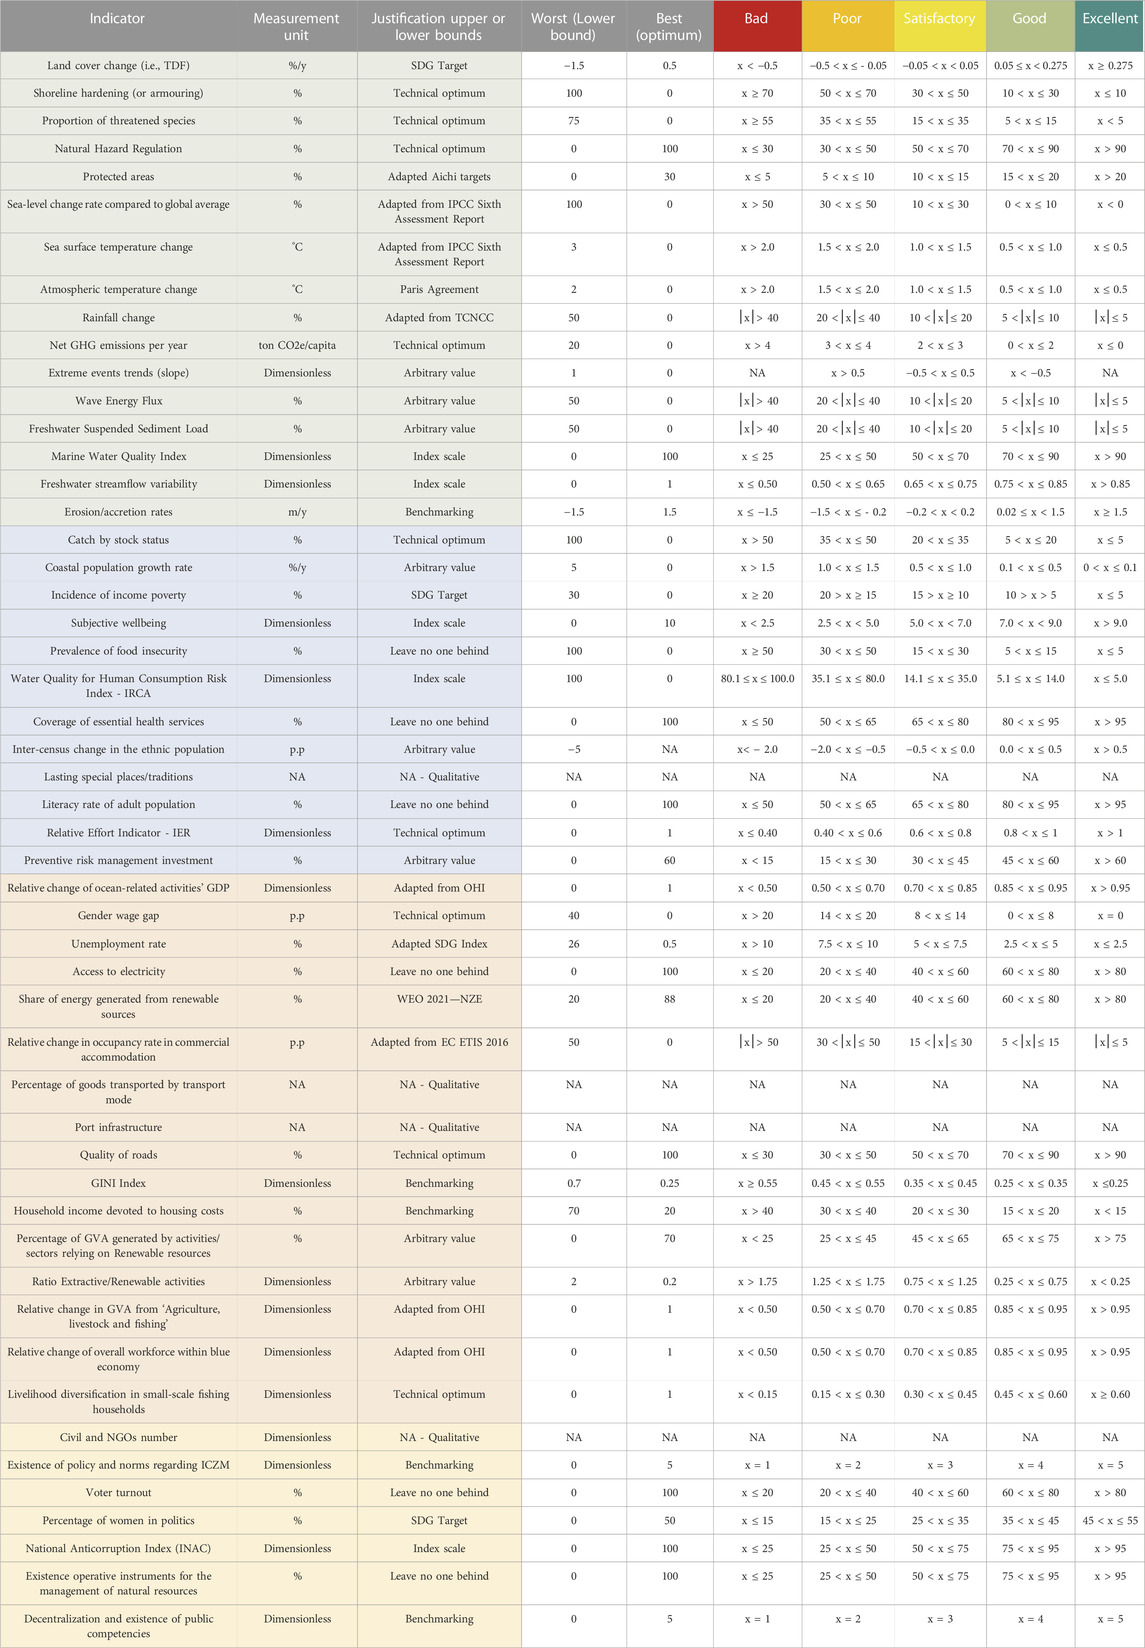
TABLE 3. Categorical scales to normalize the scores from the quantitative indicators of all domains. Notes: NA is written in those indicators that were evaluated using a qualitative approach. In cases where values can be either positive or negative, they are related to “gain” or “losses,” respectively. For instance, a value of—0.5%/y in the “Land-cover change” indicates a yearly reduction of Tropical Dry Forest with respect to a reference condition.
For those indicators where “leave no one behind” (UN Sustainable Development Group, 2022) was chosen as an optimum, a categorical scale was established based on an adaptation from Sachs et al. (2021). Not all indicators received the same brackets division but, the divisions were established in a way that rewards the best performing system and penalises the worst.
Only a few indicators did not require any normalization because in their original source they were already scored from 1 to 5 (i.e., Existence of policy and norms regarding ICZM; Decentralization and existence of public competencies) or because they were scored qualitatively (i.e., “Lasting special places/traditions”; “Percentage of goods transported by transport mode”; “Port infrastructure” and “Quality of roads’; and “Civil and NGOs”).
2.3.3 Weighting
The general idea behind the CCS framework is that every category and domain is equally important. Therefore, it would not be necessary to assign weights to the different variables, that is, all categories and domains have the same weight (i.e., 0.2 each of the categories within the domains and 0.25 for each of the domains).
Despite of this, in terms of scale and availability of information in the system, there are some differences. For this reason, a method of weighting the scores according to the area within each administrative division and the population was adopted. In other words, in those cases where the information available is disaggregated at the municipal or department level, those jurisdictions with a larger area or population will have more weight in the final score.
2.3.4 Aggregation
To define sustainability in its different domains, the framework relies on a bottom-up approach where the sustainability score is first assigned to the indicators from each subcategory. The score of each subcategory is calculated as the ‘median’ of its composing indicators and so on. This means each domain will have a sustainability score calculated as the ‘median’ of the five categories that belong to it.
Unlike what was proposed by P. de Alencar et al. (2020), an overall score for the system was defined for the present case study. Now, understanding that none of the domains is superior or inferior to the others, the final score of the system corresponds to the lowest score within its four domains. For example, if the “Economy,” ‘Socio-cultural’ and ‘Environmental’ domains were scored five (5), but the “Governance” received a score of two (2), then the overall sustainability for the system would be two (2).
2.3.5 Communication
For science communication with stakeholders from different levels and contexts (e.g., decision-makers, academy, public in general) the sustainability score from each category, domain, and system, in general, is represented in a bull-eye-like figure using a different colour matching each level of sustainability as shown in Figure 4.
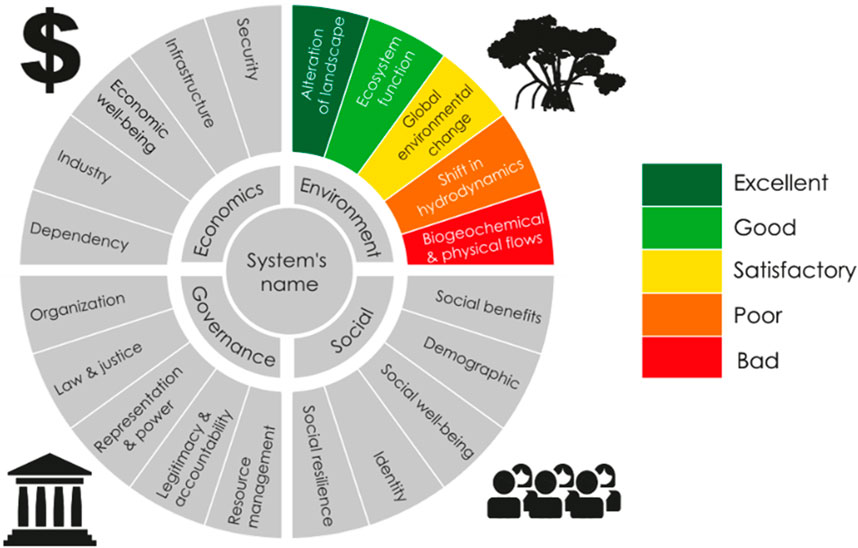
FIGURE 4. Graphical representation of the CCS framework showing the four (4) domains with their respective categories (5).
3 Results
For the assessment of the Magdalena River mouth, a total of fifty-two indicators were chosen. Their distribution among the four domains of the CCS framework is represented in Figure 5. The ‘Economy’ and “Environmental” domains have the highest number of indicators, both with sixteen (16), followed by the “Society” domain comprising twelve (12) indicators. Finally, the complexity of defining quantitative measures for “Governance” is reflected in the small number of indicators (i.e., only 8).

FIGURE 5. Number of indicators by domain.
Using the information presented for each indicator (see Table 4) and taking as a reference the categorical scales defined in the methodology (see Table 3), a sustainability score was assigned to all the indicators. Then they were aggregated by subcategory and, subsequently, by category to obtain the results shown in Table 5. An extended version of this table, with a brief description of the results for each indicator and its corresponding score, is presented as an appendix (see Supplementary Material).
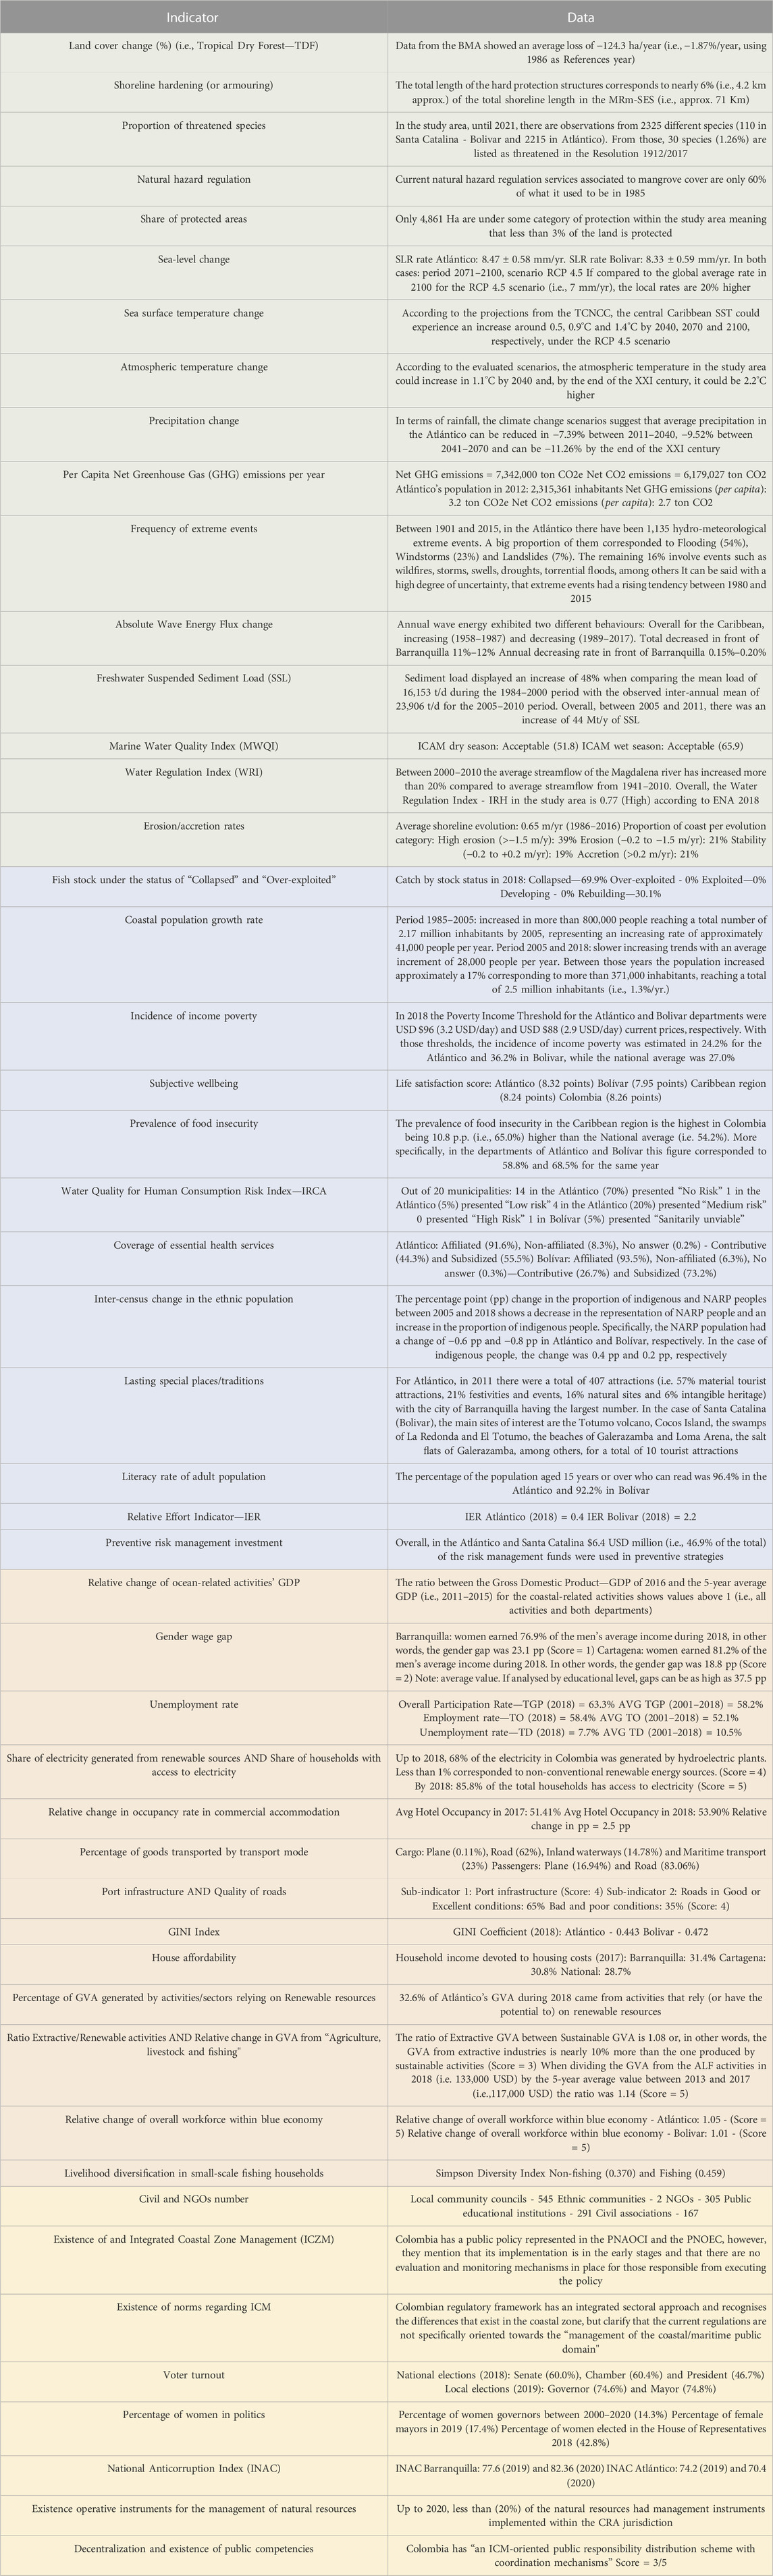
TABLE 4. Data for the assessment of each indicator.
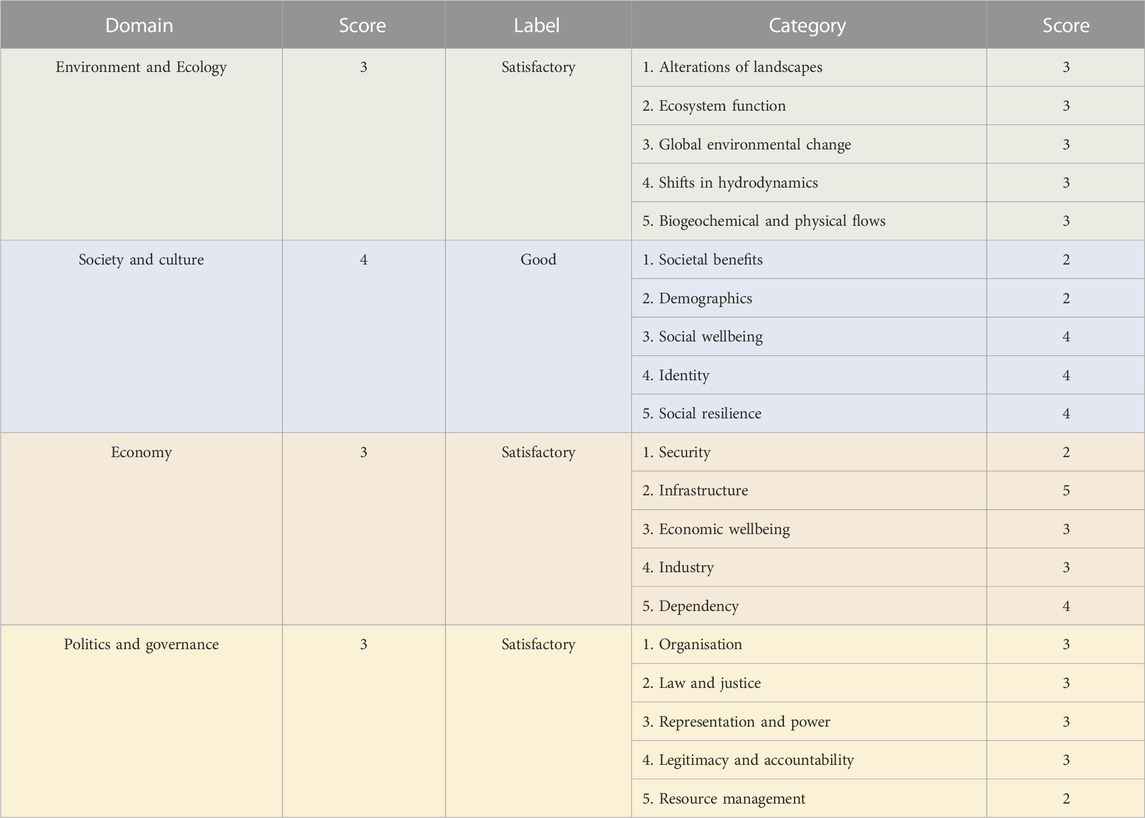
TABLE 5. CCS scores by category and domain for the Magdalena River-mouth. Note: as explained in the methodology, the score for each domain is calculated as the ‘Median’ of the corresponding 5 categories.
The domain with the higher number of indicators scoring “Bad” was the Environmental domain with four out of 16 (i.e., Land Cover Change, Protected areas, Atmospheric temperature change and Freshwater suspended sediment load) followed by the Socio-cultural domain with three indicators in the same sustainability level (i.e., Incidence of Income poverty, Prevalence of food insecurity and Relative Effort towards climate change adaptation). On the contrary, the Economy domain presented only one indicator scoring “Bad” (i.e., Gender wage gap) while having the most indicators in the “Excellent” sustainability level, a total of 5 out of 16 (i.e., Relative change of ocean-related activities; Access to electricity; Relative change in occupancy rate in commercial accommodation; Relative change in GVA from “Agriculture, livestock and fishing”; Relative change of overall workforce within the blue economy). Finally, most of the indicators from the Governance domain stayed in the middle scores of the sustainability scale, namely, five out of 8 scores ‘Satisfactory’. Only one of the indicators in this domain (i.e., Operative instruments for natural resources management) was scored as “Bad.” Overall, the highest proportion of the indicators (i.e., 16 out of 52 - equivalent to 31%) received a “Satisfactory” score, while the lowest proportion correspond to the indicators that scored ‘Excellent’ (i.e., 8 out of 52 - equivalent to 15%) (see Figure 6).
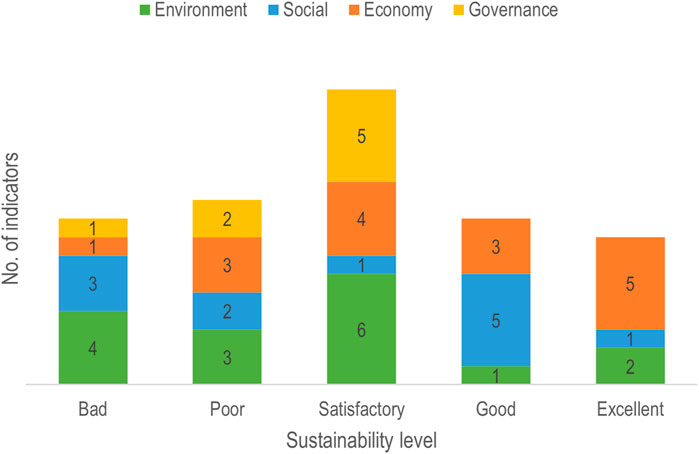
FIGURE 6. Number of indicators by sustainability level.
Regarding the categories, only the “infrastructure” received the highest sustainability score (i.e., “Excellent—5”). None of them reached the lower extreme of the sustainability scale (i.e., “Bad—1”). After “Infrastructure,” the categories with the highest sustainability level are “Social wellbeing,” “Identity” and “Social resilience” from the social domain and “Dependency” in the economic domain. The three of them received a score of “Good—4.” More than half of the categories (i.e., eleven categories) received a “Satisfactory—3’ score. Finally, the categories that received the lowest score are those with a “Poor—2” level of sustainability. They correspond to ‘Societal benefits’ and ‘Demographics’ in the social domain; “Resource management” from the governance domain and, ‘Security’ within the economy domain. The predominance of medium scores within categories is reflected in the scores of the domains that were evaluated as “Satisfactory,” except for the “Social” domain that exhibits a “Good” level of sustainability. In consequence, the MRm-SES was found to have a “Satisfactory” condition (see Figure 7).
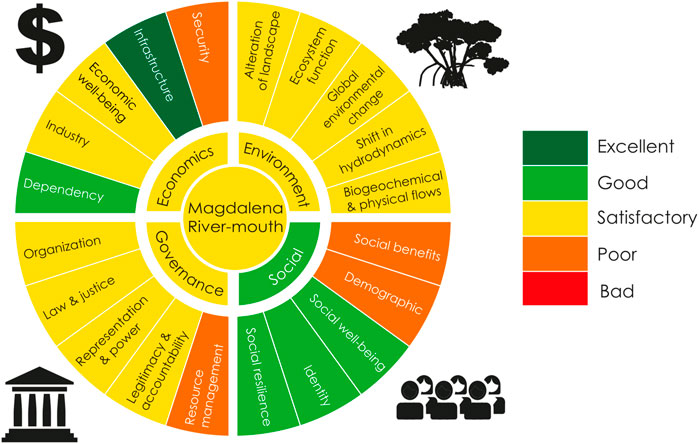
FIGURE 7. CCS score for the Magdalena River-mouth socio-ecological system.
4 Discussion
4.1 The Magdalena River-mouth sustainability issues
It is important to stress that CCS framework focuses on a category-by-category analysis, however, looking at the results of the lower divisions (i.e., sub-categories and indicators) or “de-constructing the score” (OECD and JRC, 2008) has the advantage of providing a deeper understanding of what elements of the system have driven it to the current state.
Nevertheless, this “deconstruction” should be done with caution, without losing sight of the fact that the assessment of indicators and subcategories is only an intermediate step that does not speak to the sustainability of the system in the way the CCS framework conceive it (i.e., through categories and domains). In other words, it may happen that in domains such as the Economic domain, where 16 indicators were selected in total, there is a high number of indicators with a high rating (i.e., 50% of the indicators were assessed as 4- Good or 5-Excellent), however, this does not necessarily imply that the final rating of the domain will be Good or Excellent, the rating of the domain will depend on: (i) How the rating of the indicators that make up the same subcategory is balanced and, (ii) How the ratings of the different subcategories that make up a category are balanced.
4.1.1 Environmental domain
The five categories in this domain have “Satisfactory” conditions. However, these outcomes should be analysed with caution. When looking at the subcategories and indicators nearly half of the indicators (i.e., 7 out of 16 or 44%) were assigned a “Bad” or “Poor” level. These indicators were distributed in four (4) of the five (5) categories. Among the seven indicators more than half are associated with ExUP (i.e., Atmospheric temperature change, Trends in extreme events, Freshwater and SSL, and erosion/accretion rates) while only the three remaining can be managed within the study area, namely, they are EnMP (i.e., Land cover change, protected areas and net GHG emissions per year).
Looking at the above, clues begin to emerge as to what strategies could be pursued to improve the sustainability of the system. Regarding temperature increase, there are no exclusive local measures that can be effective in stopping temperature change given it is associated with GHG emissions on the global scale. Therefore, a greater and immediate commitment to reduce GHG (especially methane) is required from the world’s main generators through their Nationally Determined Contributions (NDC) that, so far, are not enough to limit temperature rise below 1.5°C by the end of the century (Shukla et al., 2022).
Despite absolute GHG emissions being significantly lower than other areas in the region and the world, this does not mean that GHG emissions in the study area should not be considered for management. Compared to emissions in South America and the Caribbean (i.e., 9.2 t CO2e), emissions in the study area are lower but not ideal. The ideal sustainability scenario will be one in which net GHG emissions are zero by mid-century and to achieve this goal radical transitions need to be implemented including reduction of the overall fossil fuel use, the deployment of low-emission energy sources, switching to alternative energy carriers, and energy efficiency and conservation (Shukla et al., 2022). Better yet, the positive effects could spill over or depend on other categories (e.g., reducing the use of fossil fuels requires an electricity grid that is dependable, resilient and relies little on fossil fuels, which would be reflected in the “Infrastructure” category). In addition, investment in energy transition projects could create job opportunities to replace jobs in the oil and gas industry that could reach a global peak by 2028 (Rifkin, 2019).
At this point, it is important to note that Colombia has an energy matrix with a good level of sustainability (almost 70% is generated from renewable sources) (Paniagua and Duarte, 2021) that can become more resilient with the promotion and development of non-conventional renewable energies such solar, hydrogen and onshore and offshore windfarms (UPME, 2019; Renewables Consulting Group, 2022). However, Colombia’s main challenge is therefore how to adapt and/or build new infrastructure to allow an energy transition for the transport and industry sectors, which are the main consumers of fossil fuels in the country (UPME, 2019).
4.1.2 Social and cultural domain
In the “Society and Culture” domain there were two categories whose score was ‘Poor’: The “Social benefits” and the “Demographics.” The former is composed of the “Goods and Services” subcategory, evaluated through the “Catch by fish stock status” indicator which showed that nearly three-quarters of the catch came from species that are under the status of Collapsed or Over-exploited. The stocks have reached this status due to the mismanagement of both artisan and industrial fisheries, pollution and climate change (WWF, 2020). For this reason, marine management measures such as the creation of protected areas and/or special management areas are required, but above all the participation of the communities in the formulation of management measures and the appropriation of the governance of the resources is required (WWF, 2020; Future Ocean, International Ocean Institute, German Marine Research Consortium, mare, 2021). Precisely as a response to this need for management that involves the communities, in Colombia, the formulation of “Consensual Fisheries Management Agreements—ACMP” is being carried out with 9 pilot communities along the Caribbean coast (Saavedra-Díaz et al., 2015). Therefore, it is expected that there will be a monitoring of the compliance and effectiveness of these agreements to know their effects in the short and medium term and to evaluate their replicability with the other fishing communities including those within the study area.
It should be noted that in common-pool resources management, the same as in the case of climate change, measures must go beyond the local scale to reach a regional or even global scale. For the MRm-SES, this implies the management and governance of the Caribbean Large Marine Ecosystem (CLME). To this end, regional and sub-regional agreements have been worked out to develop an integrated regional approach to governing shared Living Marine Resources (sLMR) of the CLME and Adjacent Regions (known as CLME+). However, the implementation of these programmes, projects and initiatives, during 5 years, has not been exempt from challenges such as institutional capacity; lack of capacity building, leadership and awareness; inexistence of legal, political and social capital; abundance of socio-cultural constraints, among others (Fanning et al., 2021). Again, it would be necessary to monitor the implementation of the SAP to evaluate its effects on the fish stocks in the CLME+ region.
The second category is formed by the “Population growth” and the “Social class” subcategories, which received a score of “Poor—2” and “Bad—1,” respectively. There is a common consensus that increasing population could impose higher pressures on the Earth’s and, therefore, coastal habitats. However, this is not the only nor the most crucial factor. For example, in some cases, rising living standards have been considered equally or even more important than population growth in terms of environmental impacts (i.e., consumption and production patterns will be responsible for a 70% increase in consumption per capita while only 30% will be attributable to population growth) (UN-DESA, 2021). Hence, what a priory seems to be a straightforward assessment where population growth stabilization (i.e., net growth = 0) is the optimal condition, becomes a more complex situation.
One thing is sure: “population growth is a major driver of the increasing demand for food” and the current food production is not sustainable. Therefore, to avoid the impacts of a growing population it is paramount to move to sustainable practices (UN-DESA, 2021).
Looking at Income Poverty, the results for the study area are “Bad-1.” In the department of Atlántico one (1) out of five (5) people are in monetary poverty and in Bolívar this figure is about one (1) out of three (3) people. These social and economic problems have direct consequences on the sustainability and management of the resources because people who strongly rely on extractive activities such as fishing have no choice but to keep fishing, even beyond the sustainable thresholds, to survive (Future Ocean, International Ocean Institute, German Marine Research Consortium, mare, 2021). In the end, they are doing it to satisfy their most basic needs and, as Maslow suggested in 1943 and 1970, “one must satisfy the lower-level deficit needs before progressing on to meet higher level growth needs” (Elliott et al., 2017). Hence, alternative sources of income and incentives for habitat preservation and recuperation could improve ecosystem health while providing alternative livelihood opportunities. An example of the application of these strategies can be found in the Cispatá Bay in Colombia where the conservation of eleven (11) thousand hectares of mangrove is helping to tackle climate change while providing alternative sources of income for the locals. It is expected that “For the 12,000 people who depend on the mangroves for food, firewood and livelihoods, the sale of carbon offsets will provide a degree of financial security as well as the initial funding needed to develop a sustainable ecotourism program and improve fishing practices in the region” (Conservation International, 2022).
In the MRM-SES these strategies could be implemented in areas such as Ciénaga de Mallorquín and Ciénaga del Tótumo. Thus, if we assume an optimistic scenario in which 1 ha of mangrove could provide a direct livelihood for at least 1 person, and if we consider that recovery of up to 90% of the original mangrove cover in the study area (i.e., which is the minimum percentage required to reach an ‘Excellent’ condition according to Table 3), the mangrove forests within the MRm-SES could be a source of income for around 720 people (i.e. 720 ha out of a baseline of 800). This is without considering the indirect benefits that could be obtained in the future from activities such as ecotourism or better fishing yields. While these assumptions are optimistic and oversimplify economic dynamics that are not necessarily linear (i.e., it is possible that 1 ha is not sufficient to provide income for one person), they serve to illustrate the fact that habitat restoration, a measure of the environmental domain, could have positive effects on the socio-cultural domain.
4.1.3 Economic domain
The worst category in this domain was the “Security” that was found to have a “Poor” condition. The category was divided into three subcategories (i.e., livelihoods, gender, and employment patterns). The main issue in this category is the high rates of unemployment and the disparities in the gender wage gap which received a score of 1 and 2 meaning ‘Bad’ and “Poor” conditions, respectively. Unemployment can put a strain on the household and public finances, additionally, it can impact individuals and diminish their career prospects. The unemployment rates in the study area are high compared to other countries (e.g., Czech Republic, Iceland and Japan with figures lower than 3%) (OECD, 2022). However, they are considered among the lowest compared to other cities in Colombia (Galvis-Aponte et al., 2019). The unemployment rates in the study area have decreased in the last years due to a lower participation rate, an increase in occupation or both. One aspect that is not considered in the present assessment is the informality of the jobs, which is associated with the quality of the employment (Galvis-Aponte et al., 2019).
In the case of the Gender Wage Gap, it has been associated with multiple factors: economies incapable of generating enough formal jobs, the women’s dominant role in domestic jobs and caregiving, the maternity wage penalty, the presence of gender norms limiting women’s employment, discrimination and poor working conditions for women (ONU Mujeres, DANE, CPEM, 2020; Iregui-Bohórquez et al., 2021).
4.1.4 Governance domain
In the “Politics and governance” domain the “Resource management” subcategory received a “Poor—2” score, mainly due to the inexistence of key instruments for the management of natural resources being the POMIUAC—RM the most important among them.
The lack of an integrative plan for the use of the resources from the different stakeholders present in the coastal zone hampers its sustainable development because, in the best-case scenario, promotes a sectorial view where each individual/stakeholder seeks to maximise their benefit without considering the implications it can have for other actors, for the environment and even for themselves eventually.
Despite presenting poor conditions, it is expected that once the final version of the POMIUAC-RM is formulated (i.e., after the revisions or adjustments that could derive from the “Prior Consultation” process) and the implementation phase begins, it will lead to an improvement of the system. Monitoring of the implementation process (i.e., activities conducted, resources assigned, among others) and a constant evaluation of the system’s evolution, for example, by using some of the indicators presented in this assessment, will be required to identify, since the very early stages of implementation, the positiveness of the outcomes and/or which adjustments are required to make the POMIUAC more effective in achieving its goal.
4.2 Management application of the CCS
The score received by each category serves as an element to prioritise and understand the type of management actions required for the study area such that those categories, where the score was “Bad” or “Poor” require urgent attention and greater efforts for recovery/improvement. Categories with a “Satisfactory” status are those with favourable conditions for achieving a higher level of sustainability through the application of prevention strategies and/or where less effort can lead to greater improvement of the system. Finally, categories with a “Good” or “Excellent” status do not require any immediate action other than preventing deteriorating conditions.
Despite the above, from a management point of view, one should not be drawn into the sectoral approach that has proven to be ineffective in resolving the problems of complex systems such as those found in the coastal zone (Future Ocean, International Ocean Institute, German Marine Research Consortium, mare, 2021). Although the graphic representation of the CCS makes it possible to easily identify those categories with the worst performance, it is necessary to establish the interactions that exist among them to foresee changes (both positive and negative) that would result from an alteration in the status of one or more of the categories. For example, the category of ‘Ecosystem function’ is composed of three subcategories: (i) Biodiversity Loss (ii) Services and (iii) Biodiversity protection. What would happen if the existing relicts of Mangrove along the study area were lost? Directly this would imply a loss of Natural Hazard Protection. However, indirectly this change would be reflected in other categories, for example, in a Business As Usual scenario, the likely compensation strategy for this loss of protection would be the construction of rigid coastal protection works (Rangel-Buitrago et al., 2018), i.e., there would be coastal rigidification that would affect the landscape and sediment transport dynamics. Furthermore, mangroves are nurseries for many species of fish, and their loss could be reflected in a reduction of the fishing stocks affecting the livelihoods of a vulnerable portion of the population (i.e., the artisan fishers). Also, a natural attraction that serves to invite tourism and is related to the ‘Sense of Place’ would be lost, and further connections and consequences could be established. So, what initially was a change related to the status of the Environmental domain, ends up extending to the ‘Socio-cultural’ and “Economic” domains.
Despite those connections that could multiply the effects of a negative impact, they also can be used to design measures that contribute to improving various aspects of the system. For example, mangrove restoration and preservation and the definition of protection status and strategies for the areas where these ecosystems are located, bring multiple benefits. In total, those two measures could have a potential impact (i.e., direct, or indirect) on, at least, a quarter of the indicators. In practical terms, whether that positive impact is strong enough to produce a significant change in the sustainability of the system as measured in the CCS (i.e., indicator, subcategory, categories) will depend on the scale at which the measures are applied as well as their scope (i.e., integral measures can tackle more aspects than those with a sectorial approach).
4.2.1 Managing ExUP and EnMP
The implementation of measures to tackle ExUP is not the responsibility of local managers and institutions in all cases, but the MRm-SES would benefit from their implementation. What is expected is a willingness to participate on the part of decision-makers, the community, and other stakeholders.
• Investment in climate change adaptation measures
• Local strategies to reduce the net GHG contribution in the area, could be through the recovery and preservation of ecosystems that serve as carbon sinks (e.g., mangroves and tropical dry forests), coupled with improved energy efficiency and promoting a more diverse energy matrix that is less dependent on fossil fuels (e.g., reducing incentives or tax exemptions for hydrocarbon exploration and exploitation and instead redirecting this money to renewable energy).
• At the level of the Magdalena River Basin, a coordination mechanism is required between the different CARs with jurisdiction in the Magdalena River Basin so that they can act jointly to solve problems such as deforestation and pollution.
On the other hand, some measures to tackle the EnMP are.
• Designation of new conservation areas under a concept that does not necessarily prohibit their use but promotes a more responsible approach that preserves biodiversity and important habitats.
• Involve the opinions and ancestral knowledge of the communities located within the study area when designing and implementing management measures.
• Work towards the early formulation, updating and/or implementation of the POMIUAC-RM or other strategic plans for resource management in the study area.
The above list is not considered exhaustive, and it is suggested that complementary tools such as the DPSIR framework to define the linkages among categories which can be used to establish tailored measures for the system at a later stage (Gallo Velez et al., 2022).
4.3 The CCS framework: Opportunities for improvement
The CCS framework and representation aim at being a tool for policy analysis and public communication but, moreover, to be an effective call for action. Perhaps one of the advantages of the chosen graphical representations is that, up to a certain extent, it deals with one of the major issues from composite indicators which is mascaraing some issues that draw a simplistic analysis and leads to wrong conclusions (OECD and JRC, 2008). This is done by showing the overall score for the system and each domain while maintaining and showing the results for each category. In this way, is possible to identify what are those aspects that need to be at the centre of the discussion because more effectiveness and actions are required to improve their sustainability.
One aspect that differentiates this study from the one from P. de Alencar et al. (2020) is the attempt to include a semi-quantitative approach to score the sustainability of each category, reducing the bias that comes from an application of qualitative criteria which can be interpreted in different ways by different evaluators, coastal managers, decision-makers, etc. Additionally, the graphical representation suffered major transformations such as the inclusion of the domains and system within the graphic, as well as the use of a more widespread and intuitive colour scale (i.e., traffic-light colours rather than the EU water framework directive colours). Finally, the original framework was tested in Spain but, its application in this study shows that it can be adapted to other latitudes with differences that involve not only geography (and its different habitats, ecosystems, and biomes) but also culture, society, and policy (governance).
Complementarily, the idea behind establishing upper and lower bounds and their respective categorical scales (i.e., ranges within which an indicator receives a certain sustainability score) helps to ensure that the application of this framework in the same socio-ecological system (at different times or by different people) or even in similar systems (i.e., where the same indicators can be used), is based on the same criteria and results in consistent values that do not depend on the view of a particular evaluator. In other words, that the assessment made by two different people/organisations at the same point in time results in very similar levels of sustainability (i.e., taking into account the variability associated with the fact that there are still indicators that are assessed qualitatively). Or, in the case of assessments at different times, the results are truly a reflection of changes in the system and not of changes in assessment criteria.
Despite its advantages, there are still aspects that could improve the reliability of the results and some questions that arise after the application of the CCS framework in the MRm-SES:
• The CCS framework fundamentally relies on secondary information; therefore, it is important to define the degree of confidence of the information presented for each indicator. That is adopting a similar system as the one used in the IPCC or the IPBES reports (IPBES, 2018) (e.g., medium confidence, very likely, high confidence, high confidence, etc.). This degree of confidence should consider not only the quality of the sources employed but also the spatial scale of the information concerning the system being evaluated (i.e., municipal level is more accurate than national level).
To improve the utility of the results by drawing more accurate conclusions, it would be necessary to explore the implication of the different normalization, weighting and aggregation methods for the indicators (for instance, using linear aggregation methods such as arithmetical average or median; or other non-compensatory aggregation methods such as geometric average) (s; Papadimitriou et al., 2019). Would it be worth assigning weights within the indicator and subcategory levels? These are aspects whose implications remain to be explored and further analysed through simulations and statistical analyses. The importance of this point can be illustrated by comparing the results of the Magdalena River-mouth using the arithmetic and geometric means for the aggregation. With the geometric mean, results show a system with apparent worse conditions for three of the four domains even though the scores of the individual indicators remained unchanged (See Figure 8). This may seem like a numerical triviality, but its implications from a management point of view can be important. An aggregation method that allows the compensation of low scores with high scores could lead to masking problems within the different categories of each dimension, giving the erroneous idea that none of the categories requires immediate attention and that the current management is giving results, if not good, at least satisfactory. On the contrary, an aggregation method that overly penalizes all categories, resulting in very low levels of sustainability for many of them, could prevent the clear identification of those areas where intervention is truly needed. In other words, it would not help in the prioritization of management measures and resources. Moreover, it could even lead to inaction.
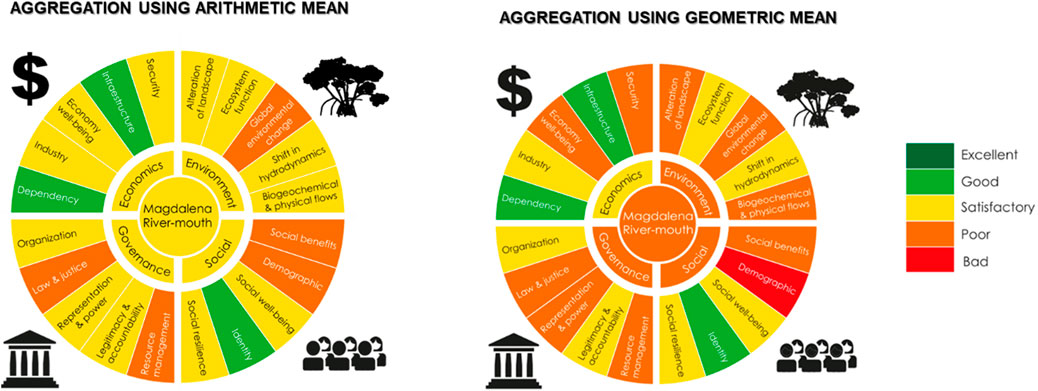
FIGURE 8. Comparison of the CCS results using different aggregation methods (i.e., arithmetic mean—left and geometric mean—right) for the Magdalena River-mouth system.
• What will or could happen in the future? Or how is the system compared to previous states? Is it better/worse? Is there an identifiable trend that suggests the system is improving? Could other socio-ecological tools help foresee changes in some of the categories and domains (e.g., “Future Analysis”) (Biggs et al., 2022).
This assessment was applied to the main mouth of the Magdalena River in Bocas de Ceniza and can provide a general picture of the sustainability of Colombia’s main river delta. However, it is important to investigate what could be the implications of including the other two compartments of the Magdalena River deltaic system such as “Canal del Dique” and “Cienaga Grande de Santa Marta.”
4.4 Application of the CCS around the world
Despite being a recently developed framework, efforts have been made to test its application in coastal systems with different characteristics (e.g., geography, scale, socio-economic conditions, cultural aspects, among others) and using adaptations in the methodology (e.g., qualitative, and semi-quantitative).
The first application of CCS was at the national level and used a qualitative approach to assess the coastal zone of Spain as a whole. In this study, it was identified that over-limitations of biophysical barriers have led to a loss of coastal provisioning services which, in turn, is reflected in impacts on the human wellbeing of the communities that depend on them (de Alencar et al., 2020).
In contrast to this first case study, subsequent case studies, including this one, have focused on more narrowly defined social-ecological systems, such as the Chesapeake Bay—United States (Leyva Ollivier, 2022), Cork Harbour—Ireland (Wint Mon Swe, 2022) and the Sundarbans area—India (Deb, 2022). This has provided more detailed information leading to the identification of more specific strengths, problems, and solutions. For example, Leyva Ollivier (2022) identified that the main problems in Chesapeake Bay are the eutrophication, overexploitation of natural resources and the industrial and human development; while Deb (2022) mentions that for the Sundarbans delta (transboundary region) there is inefficiency and lack of accountability of the government, intensification of cyclones, sea level rise, coastal erosion, and delta subsidence besides the socio-economic pressures which include high poverty levels and persistent lack of basic services and, he also mentions the “need for joint action between their governments for a sustainable future”. Moreover, Wint Mon Swe (2022) suggests that CCS could be used to evaluate not only sustainability but the resilience of a system against climate change.
All of the above points out that CCS is a framework that can be adapted for the assessment and comparison of very diverse coastal systems ranging from bays and estuaries in developed mid-latitude countries (de Alencar et al., 2020; Leyva Ollivier, 2022), to tropical deltas in developing countries, accounting for long-standing (e.g., land cover/use change) and/or recently developed issues in a system (e.g., plastic and novel substances pollution).
However, something briefly mentioned here and agreed by other authors is the need to use other tools to better understand the “system’s structure” (Leyva Ollivier, 2022) and the interconnections that exist between the different elements of the socio-ecological system (Deb, 2022), which in the specific case of CCS, are represented by the Categories. This can help to understand why and how the changes in one category can affect the score for other categories, either for the same or a different domain. For instance, in which way the actualization and execution of current resource management plans in the study area could halt land cover change and/or prevent land-based contamination? What is driving the system to its current state and what can be done to tackle the cause rather than the symptoms?
On the other hand, the application of the different case studies has allowed us to identify possible improvements that have been discussed in this paper and others that are mentioned by other authors. For example, the need to reduce the subjectivity associated with a qualitative assessment of indicators, based purely on discussion with other researchers or experts (Deb, 2022; Leyva Ollivier, 2022; Wint Mon Swe, 2022). Precisely, the adaptation carried out in this study constitutes a step forward in the search for alternatives to reduce such subjectivity.
5 Conclusion
Overall, the sustainability of the Magdalena River-mouth SES can be classified as “Satisfactory.” The “Environmental and Ecological” domain exhibited “Satisfactory” conditions. In the case of the “Social and Cultural” domain, three categories (i.e., “Social wellbeing,” “Identity” and ‘Social resilience’) were rated as having ‘Good’ conditions, and the rest of the categories were rated as “Poor.” The “Economic” domain was the only one where a category reached an “Excellent” status. Finally, none of the “Governance” categories exceeded the “Satisfactory” level and the “Resource management” category had “Poor” conditions.
A total of fifty-two indicators, distributed into twenty categories and four domains, were chosen to evaluate the sustainability of the system. The indicators were distributed like this: sixteen (16) indicators each for the Environment and Economic domains, twelve (12) indicators in the Social domain and eight (8) indicators to evaluate the Governance domain. The categories that presented the worst conditions from each domain were: “Social Benefits” and “Demographics” in the Social domain; “Security” in the Economy domain and Resource Management in the Governance domain.
Based on the sustainability score received by the indicators and the categories, some management measures can be considered. In general terms, they involve: Preserving and restoring habitats; tackling sources of pollution and excessive sediment; local contributions to curve climate change through reduction of net GHG and adaptation measures to climate change; participation of local communities in the management design and implementation.
The main advantage of using the CCS framework to assess coastal socio-ecological systems is that it provides a holistic view of the conditions in the system. Moreover, it gives equal weight to the four (4) dimensions of sustainability reinforcing the concept that a truly sustainable system can only be achieved when all the domains present the same level of sustainability. The graphical representation is another strong aspect of this framework because it allows the communication of the results with stakeholders from different spheres (academia, politics, community, organizations, etc.).
Among the drawbacks of the framework, it is possible to mention the necessity of much different information that, most of the time, is dispersed and has to be collected from different institutions. Moreover, sometimes information is available, but it is not easily accessible. Another inconvenience of this framework is the fact of being currently in its development changes, which means that some aspects of the methodology can change in the future. Finally, a critical aspect for the application of the CCS is the selection of the set of indicators which, could be subject to bias if the selection is done by an individual and not by a multidisciplinary group.
This assessment can be complemented and improved by defining the uncertainty of the information used; reviewing the normalization and aggregation methods; using complementary socio-ecological methods/tools like “future analysis” and DPSIR to define tailored measures for the system. Finally, it is suggested to include the other compartments (i.e., CGSM and Canal del Dique) of the Magdalena River delta.
Data availability statement
The original contributions presented in the study are included in the article/Supplementary Material, further inquiries can be directed to the corresponding author.
Author contributions
DG-V: Conceptualization, Formal analysis, Investigation, Writing—Original draft. JR: Conceptualization, Resources, Writing—Review and Editing, Supervision. AN: Conceptualization, Resources, Writing—Review and Editing, Supervision.
Funding
This research was supported by the ERASMUS+ programme from the European Commission through a scholarship granted to the lead author as a student of the Erasmus Mundus Joint Master Degree in Water and Coastal Management (WACOMA) 2020/2022 (WACOMA; Project No. 586596-EPP-1-2017-1-IT-EPPKA1- JMD-MOB). We acknowledge the funding provided by FCT to the projects LA/P/0069/2020 awarded to the Associate Laboratory ARNET and UID/00350/2020 awarded to CIMA of the University of the Algarve.
Acknowledgments
The authors thank Natalia M. P. de Alencar, Sebastian Ferse and all the people from the global research network of Future Earth Coasts (FEC) whose guidance and feedback facilitated the application of the CCS in the study area. We also thank Marko Tosic who reviewed and made comments over the master dissertation that was the base for the present work, this improved the quality of the final draft. Additionally, the authors thank Maria Esther Leyva Ollivier and the team at the Integration and Application Network (IAN) from the University of Maryland who worked on the backbone of what became the graphical representation used in the present study. Finally, the lead author thanks the Centre for Marine and Environmental Research (CIMA) from the Universidade do Algarve (UALG) who hosted him during the last year of his master and Professor Clara Cordeiro who provided some guidance on the statistical matters. AN acknowledges the contribution of Future Earth Coasts. AN also acknowledges IMBeR and OceanKAN.
Conflict of interest
The authors declare that the research was conducted in the absence of any commercial or financial relationships that could be construed as a potential conflict of interest.
Publisher’s note
All claims expressed in this article are solely those of the authors and do not necessarily represent those of their affiliated organizations, or those of the publisher, the editors and the reviewers. Any product that may be evaluated in this article, or claim that may be made by its manufacturer, is not guaranteed or endorsed by the publisher.
Supplementary material
The Supplementary Material for this article can be found online at: https://www.frontiersin.org/articles/10.3389/feart.2023.1058122/full#supplementary-material
References
Acosta-Coley, I., Duran-Izquierdo, M., Rodriguez-Cavallo, E., Mercado-Camargo, J., Mendez-Cuadro, D., and Olivero-Verbel, J. (2019). Quantification of microplastics along the Caribbean Coastline of Colombia: Pollution profile and biological effects on Caenorhabditis elegans. Mar. Pollut. Bull. 146, 574–583. doi:10.1016/j.marpolbul.2019.06.084
Aldana-Domínguez, J., Ignacio, P., Jorgelina, G.-A., Cecilia, A.-S., Carlos, M., and Francisco, N. (2019). Assessing the effects of past and future land cover changes in ecosystem services, disservices and biodiversity: A case study in Barranquilla metropolitan area (BMA), Colombia. Ecosyst. Serv. 37, 100915. doi:10.1016/j.ecoser.2019.100915
ANT (2021). Portal de Datos Abiertos de la ANT. Agencia Nacional de Tierras. Available at: https://data-agenciadetierras.opendata.arcgis.com/(Accessed April 6, 2022).
Ávila, B., and Gallo, M. N. (2021). Morphological behavior of the Magdalena River delta (Colombia) due to intra and interannual variations in river discharge. J. S. Am. Earth Sci. 108, 103215. doi:10.1016/j.jsames.2021.103215
R. Biggs, A. de Vos, R. Preiser, H. Clements, K. Maciejewski, and M. Schlüter (Editors) (2022). The routledge handbook of research methods for social-ecological systems (New York, USA: Routledge), 527.
Bindoff, N. L., Cheung, W. W. L., Kairo, J. G., Arístegui, J., Guinder, V. A., Hallberg, R., et al. (2019). “Changing Ocean, marine ecosystems, and dependent communities,” in IPCC special report on the ocean and cryosphere in a changing climate. Editors H. O. Pörtner, D. C. Roberts, V. Masson-Delmotte, P. Zhai, M. Tignor, E. Poloczanskaet al. (Cambridge, UK, New York, USA: Cambridge University Press), 447–587.
Botero, C. M., Hurtado, R., and Rodríguez, S. L. (2020). Reporte del avance del manejo costero integrado en Colombia 2009-2019. Rev. Costas Vol. Esp. 1, 43–65. doi:10.26359/costas.e103
Bustos Usta, D. F., and Torres Parra, R. R. (2021). Ocean and atmosphere changes in the Caribbean Sea during the twenty-first century using CMIP5 models. Ocean. Dyn. 71, 757–777. doi:10.1007/s10236-021-01462-z
CBD (2012). Aichi biodiversity targets. Available at: https://www.cbd.int/sp/targets/(Accessed May 30, 2022).
Chacon, S., Serrano, M., Bolívar-Anillo, H., Villate Daza, D., Sanchez, H., and Anfuso, G. (2020). Bosques de manglar del Caribe Norte Colombiano: Análisis, evolución y herramientas de gestión, 31–54.
CITUR (2012). Plan de desarrollo turístico de Bolívar. Ministerio de Comercio, Industria y Turismo; Tourism Consulting S.A.S; Fundación Universitaria CAFAM. Available at: https://citur.gov.co/upload/publications/documentos/160.Plan_de_desarrollo_turistico_de_Bolivar.pdf (Accessed May 21, 2022).
CITUR (2014). Plan de desarrollo turístico del Atlántico. Ministerio de Comercio, Industria y Turismo. Available at: https://citur.gov.co/upload/publications/documentos/159.Plan_de_desarrollo_turistico_Atlantico.pdf (Accessed May 21, 2022).
COLOMBIA. Minambiente, 17/April/2017, CRA (2020). Resolución 0768 del 17 de abril de 2017 “Por la cual se adopta la Guía Técnica para la Ordenación y Manejo Integrado de la Zona Costera”: Res. 768/2017, 46.
COLOMBIA. Ministerio de Ambiente y Desarrollo Sostenible (2015). Plan Integral de Gestión del Cambio Climático Territorial del Departamento de Atlántico.: Atlántico 2040. Ministerio de Ambiente y Desarrollo Sostenible., Bogotá, D.C. Available at: https://www.atlantico.gov.co/images/stories/plan_cambio_climatico/Plan_Integral_Gestion-Atlantico_2040.pdf (Accessed September 22, 2021).
Conservation International (2022). A critical investment in ‘blue carbon’. Conservation International. Available at: https://www.conservation.org/stories/critical-investment-in-blue-carbon (Accessed June 4, 2022).
CRA and ASOCARS (2014). Compilación de documentos generados por las instituciones miembros de ASOCARS, para una caracterización conjunta de la Unidad Ambiental Costera del Río Magdalena Complejo Canal del Dique - sistema Lagunar de la Ciénaga Grande de Santa Marta. CRA. Available at: http://geonodesiam.invemar.org.co/documents/4035 (Accessed September 2, 2021).
CRA (2015). ONG’s del Atlántico se inscribieron para elección de representantes ante consejo directivo de la CRA. Corporación Autónoma Regional del Atlántico. Available at: https://crautonoma.gov.co/prensa/noticias/articulo-927 (Accessed April 6, 2022).
CRA (2016). Plan de Acción cuatrienal: PAC 2016-2019. Atlántico frente al cambio climático. Corporación autónoma regional del Atlántico. Available at: https://www.crautonoma.gov.co/documentos/Planes/PAI%202020-2023%20CRA.pdf (Accessed September 14, 2021).
CRA (2020). Plan de Acción Institucional: PAI 2020-2023. Atlántico sostenible y resiliente. Corporación Autónoma Regional del Atlántico. Available at: https://www.crautonoma.gov.co/documentos/Planes/PAI%202020-2023%20CRA.pdf (Accessed September 14, 2021).
CRA (2014). Plan de Gestión Ambiental Regional. Departamento del Atlántico: 2012-2022. Corporación Autónoma Regional del Atlántico, Barranquilla, Atlántico. Available at: https://crautonoma.gov.co/atencion-al-publico/transparencia-y-acceso-a-informacion-publica/planeacion/plan-de-gestion-ambiental-regional-pgar (Accessed April 1, 2022).
C. J. Crossland (Editor) (2005). Coastal fluxes in the anthropocene: The land-ocean interactions in the coastal zone project of the international geospere-biosphere programme (Berlin, Heidelberg: Springer), 231.
DANE (2018). Censo nacional de Población y vivienda 2018. DANE. Available at: https://www.dane.gov.co/index.php/estadisticas-por-tema/demografia-y-poblacion/censo-nacional-de-poblacion-y-vivenda-2018 (Accessed September 7, 2021).
DANE (2021b). Cuentas nacionales departamentales: PIB por departamento: Valor agregado por municipio - serie (2011-2019 provisional). DANE. Available at: https://www.dane.gov.co/index.php/estadisticas-por-tema/cuentas-nacionales/cuentas-nacionales-departamentales (Accessed September 17, 2021).
DANE (2019). Encuesta nacional de calidad de vida (ECV) 2018. Departamento Administrativo Nacional de Estadística. Available at: https://www.dane.gov.co/index.php/estadisticas-por-tema/salud/calidad-de-vida-ecv/encuesta-nacional-de-calidad-de-vida-ecv-2018#informacion-por-departamentos (Accessed April 26, 2022).
DANE (2017). Encuesta nacional de presupuestos de los hogares (ENPH). Departamento Administrativo Nacional de Estadística. Available at: https://www.dane.gov.co/index.php/estadisticas-por-tema/pobreza-y-condiciones-de-vida/encuesta-nacional-de-presupuestos-de-los-hogares-enph (Accessed April 26, 2022).
DANE (2021a). Enfoque diferencial e interseccional. Departamento Administrativo Nacional de Estadística. Available at: https://www.dane.gov.co/index.php/estadisticas-por-tema/enfoque-diferencial-e-interseccional (Accessed May 4, 2022).
DANE (2022). Gran encuesta integrada de Hogares - GEIH. Departamento administrativo nacional de Estadística. Available at: https://www.dane.gov.co/index.php/estadisticas-por-tema/mercado-laboral (Accessed April 11, 2022).
Davis, R. A., and FitzGerald, D. M. (2020). Beaches and coasts. Hoboken New Jersey: John Wiley and Sons Inc, 518.
de Alencar, N. M. P., Le Tissier, M., Paterson, S. K., and Newton, A. (2020). Circles of coastal sustainability: A framework for coastal management. Sustainability 12 (12), 4886. doi:10.3390/su12124886
Deb, A. (2022). Coastal sustainability assessment of the Sundarbans using the circles of coastal sustainability (CCS) framework: A comparative analysis between India and Bangladesh. [Master thesis] (Ravenna, Italia: Alma Mater Studiorum – Università di Bologna).
DNP (2019). Informes de mercado laboral urbano: Resultados 2018. Departamento Nacional de Planeación; Dirección de Estudios Económicos. Available at: https://colaboracion.dnp.gov.co/CDT/Estudios%20Econmicos/0%20Informe%20de%20Mercado%20Laboral%20Urbano%202018.pdf (Accessed April 27, 2022).
DNP (2021). Sistema de Monitoreo, Reporte y Verificación (MRV) del Financiamiento Climático. Departamento Nacional de Planeación. Available at: https://mrv.dnp.gov.co/Paginas/inicio.aspx (Accessed May 4, 2022).
Elliott, M., Burdon, D., Atkins, J. P., Borja, A., Cormier, R., Jonge, V. N. de, et al. (2017). And DPSIR begat DAPSI(W)R(M)!” - a unifying framework for marine environmental management. Mar. Pollut. Bull. 118, 27–40. doi:10.1016/j.marpolbul.2017.03.049
Elliott, M., Day, J. W., Ramachandran, R., and Wolanski, E. (2019). “A synthesis: What is the future for coasts, estuaries, deltas and other transitional habitats in 2050 and beyond?,” in Coasts and estuaries. The future. Editors E. Wolanski, J. W. Day, M. Elliott, and R. Ramesh (Amsterdam, Netherlands: Elsevier), 1–28.
Fanning, L., Mahon, R., Compton, S., Corbin, C., Debels, P., Haughton, M., et al. (2021). Challenges to implementing regional ocean governance in the wider caribbean region. Front. Mar. Sci. 8, 286. doi:10.3389/fmars.2021.667273
Future Ocean, International Ocean Institute, German Marine Research Consortium, mare (2021). World Ocean Review 2021. Living with the oceans: The ocean, guarantor of life - sustainable use, effective protection. Hamburg: maribus, 335.
Future Ocean, International Ocean Institute, German Marine Research Consortium, mare (2017). World Ocean Review 2017. Living with the oceans: Coasts - a vital habitat under pressure. Hamburg: maribus, 207.
Gallo Velez, D., Restrepo, J. C., and Newton, A. (2022). A socio-ecological assessment of land-based contamination and pollution: the Magdalena delta, Colombia. Front. Mar. Sci., 2567.
Galvis-Aponte, L. A., Rodríguez-Puello, G. O., and Ovallos-Bencardino, S. (2019). Desempleo y calidad de vida laboral en las áreas metropolitanas de Barranquilla, Cartagena y Santa Marta. Documentos de trabajo sobre economía regional y urbana 279. Banco de la República, Cartagena de Indias. Available at: https://repositorio.banrep.gov.co/bitstream/handle/20.500.12134/9670/DTSERU_279.pdf (Accessed June 13, 2022).
Gobernación del Atlántico, 2020. Plan de Desarrollo 2020-2023: ¡Atlántico para la gente!, Barranquilla, Atlántico. Available at: https://www.atlantico.gov.co/images/stories/plan_desarrollo/PlanDesarrollo_2020-2023-Definitivo-A1.pdf. Accessed 13 December 2021.
Halpern, B. S. (2020). Building on a decade of the ocean Health index. One Earth 2, 30–33. doi:10.1016/j.oneear.2019.12.011
Halpern, B. S., Longo, C., Hardy, D., McLeod, K. L., Samhouri, J. F., Katona, S. K., et al. (2012). An index to assess the health and benefits of the global ocean. Nature 488, 615–620. doi:10.1038/nature11397
IDEAM, PNUD, MADS, DNP, Cancillería (2016). Inventario nacional y departamental de Gases de Efecto invernadero - Colombia. Tercera comunicación nacional de Cambio climático. IDEAM; PNUD; MADS; DNP; cancillería; FMAM, bogotá, D.C. Available at: http://documentacion.ideam.gov.co/openbiblio/bvirtual/023634/INGEI.pdf (Accessed December 1, 2022).
IDEAM, IAvH, IGAC, INVEMAR, Minambiente (2017). Mapa de ecosistemas continentales, costeros y marinos de Colombia (MEC): Version 2.1. Bogotá, D.C.: IDEAM.
IDEAM, PNUD, MADS, DNP, Cancillería (2017). Tercera Comunicación Nacional de Colombia a la Convención Marco de las Naciones Unidas Sobre Cambio Climático (CMNUCC). Bogotá, D.C: Tercera comunicación nacional de cambio climático. IDEAM; PNUD; MADS; DNP; Cancillería; FMAM.
IEA (2021). World energy outlook 2021. International energy agency. Available at: https://www.iea.org/reports/world-energy-outlook-2021 (Accessed May 10, 2022).
INVEMAR (2017). Elaboración del análisis de vulnerabilidad marino costera e insular ante el cambio climático para el país. Contrato PNUD No. 0000040357. Santa Marta: Informe Técnico Final (ITF) - 001.
INVEMAR (2021). Metodología de la operación estadística Índice de Calidad de Aguas Marinas y Costeras - oe icam. Santa Marta: Instituto de Investigaciones Marinas y Costeras Jose Benito Vives de Andréis.
INVIAS (2022). Estado de la Red vial. Instituto nacional de Vias. Available at: https://www.invias.gov.co/index.php/component/content/article/2-uncategorised/57-estado-de-la-red-vial (Accessed April 18, 2022).
IPBES (2018). The IPBES regional assessment report on biodiversity and ecosystem services for the americas. Paris: IPBES, 656.
Iregui-Bohórquez, A. M., Melo-Becerra, L. A., Ramírez-Giraldo, M. T., and Tribín-Uribe, A. M. (2021). El camino hacia la igualdad de género en Colombia: Todavía hay mucho por hacer. Colombia: Banco de la República, 98.
James, P. (2015). Urban sustainability in theory and practice: Circles of sustainability. New York, USA: Routledge, 282.
Leyva Ollivier, M. E. (2022). Coast assessment of the Chesapeake bay watershed in the United States of America, using the circles of coastal sustainability framework. [Master thesis] (Ravenna, Italia: Alma Mater Studiorum – Università di Bologna).
Maldonado, J. H., Del Moreno-Sánchez, R. P., Vargas-Morales, M. E., and Leguízamo, E. (2022). Livelihoods characterization of a small-scale fishing community in the Colombian caribbean. Mar. Fish. Sci. 35. doi:10.47193/mafis.3522022010504
Minambiente (2017). List of threatened wild species of continental and marine-coastal biological diversity of Colombia: Resolution 1912 of 2017 issued by the Ministry of Environment and Sustainable Development. Available at: https://listas.biodiversidad.co/list/772de164-541d-4db6-ba38-41ac1c8612c0 (Accessed November 18, 2021).
MinCIT (2021). Citur | Centro de Información Turística de Colombia. Ministerio de Comercio, Industria y Turismo. Available at: https://www.citur.gov.co/pages/1#gsc.tab=0 (Accessed September 20, 2021).
Minsalud (2020). Informe Nacional de Calidad del Agua para Consumo Humano: INCA 2018. Ministerio de Salud y Protección Social; República de Colombia. Available at: https://www.minsalud.gov.co/sites/rid/Lists/BibliotecaDigital/RIDE/VS/PP/SA/inca-2018.pdf (Accessed April 29, 2022).
Mintic (2022). Portal de Datos Abiertos de Colombia. Available at: https://www.datos.gov.co/(Accessed April 6, 2022).
MOE (2019). Datos y resultados electorales. Misión de Observación Electoral. Available at: https://www.datoselectorales.org/datos-y-resultados-electorales/(Accessed April 6, 2022).
MOE (2018). De la participación a la representación efectiva: “La participación política de las mujeres en Colombia”. Bogotá, D.C.: MOE, 39.
Newton, A., Carruthers, T. J., and Icely, J. (2012). The coastal syndromes and hotspots on the coast. Coast. Shelf Sci. 96, 39–47. doi:10.1016/j.ecss.2011.07.012
OECD and JRC (2008). Handbook on constructing composite indicators: Methodology and user guide. Paris: OECD Publishing, 162.
OECD (2022). OECD data: Income inequality. Organization for economic cooperation and development. Available at: https://data.oecd.org/inequality/income-inequality.htm (Accessed April 25, 2022).
OHI (2022). Ocean Health index: Goal: Coastal protection. Available at: https://oceanhealthindex.org/goals/coastal-protection/(Accessed May 17, 2022).
ONU Mujeres, DANE, CPEM (2020). Mujeres y hombres: Brechas de género en Colombia. ONU Mujeres; DANE; CPEM. Available at: https://www2.unwomen.org/-/media/field%20office%20colombia/documentos/publicaciones/2020/11/mujeres%20y%20hombres%20brechas%20de%20genero.pdf?la=es&vs=5814 (Accessed March 12, 2021).
Orejarena-Rondón, A. F., Restrepo, J. C., Correa-Metrio, A., and Orfila, A. (2022). Wave energy flux in the Caribbean Sea: Trends and variability. Renew. Energy 181, 616–629. doi:10.1016/j.renene.2021.09.081
Page, E., Derrick, B., Coulter, A., White, R., Ang, M., Dunstan, D., et al. (2020). “South America: Updated catch reconstructions to 2018,” in Updating to 2018 the 1950-2010 marine catch reconstructions of the sea around us. Part II: The americas and asia-pacific. Editors B. Derrick, M. Khalfallah, V. Relano, D. Zeller, and D. Pauly, 279–312. Fisheries Centre Research Report.
Paniagua, R. C., and Duarte, A. (2021). Generación eléctrica en Colombia y su transición hacia Fuentes Renovables No Convencionales. Corficolombia. Available at: https://investigaciones.corficolombiana.com/documents/38211/0/Generaci%C3%B3n%20el%C3%A9ctrica%20en%20Colombia%20y%20su%20transici%C3%B3n%20hacia%20Fuentes%20Renovables%20No%20Convencionales.pdf/5ffcba57-f7b8-f4b6-35c0-ae9302bd1a0a (Accessed December 4, 2022).
Papadimitriou, E., Neves, A. R., and Becker, W. (2019). “JRC statistical audit of the Sustainable Development Goals index and dashboards,” in Eur 29776 en (European Union: Publications Office of the European Union), 35.
Patiño, M., E. (2019). ABC para entender lo que sucede en el Puerto de Barranquilla. Atlantico, Colombia: EL HERALDO.
Patrício, J., Elliott, M., Mazik, K., Papadopoulou, K.-N., and Smith, C. J. (2016). DPSIR—two decades of trying to develop a unifying framework for marine environmental management? Front. Mar. Sci. 3. doi:10.3389/fmars.2016.00177
Portz, L., Manzolli, R. P., Andrade, C. F. F. de, Villate Daza, D. A., Bolivar Bandeira, D. A., and Alcántara-Carrió, J. (2020). Assessment of heavy metals pollution (Hg, Cr, Cd, Ni) in the sediments of Mallorquin lagoon - Barranquilla, Colombia. J. Coast. Res. 95, 158. doi:10.2112/si95-031.1
Puerto de Barranquilla (2021). Cifras del sector y la ciudad. Sociedad Portuaria Puerto de Barranquilla. Available at: https://www.puertodebarranquilla.com/index.php/cifras-del-sector-y-la-ciudad/?lang=en (Accessed September 20, 2021).
Rangel-Buitrago, N., Mendoza, A. V., Gracia C, A., Mantilla-Barbosa, E., Arana, V. A., Trilleras, J., et al. (2019). Litter impacts on cleanliness and environmental status of Atlantico department beaches, Colombian Caribbean coast. Ocean Coast. Manag. 179, 104835. doi:10.1016/j.ocecoaman.2019.104835
Rangel-Buitrago, N., Mendoza, A. V., Mantilla-Barbosa, E., Arroyo-Olarte, H., Arana, V. A., Trilleras, J., et al. (2021). Plastic pollution on the Colombian central Caribbean beaches. Mar. Pollut. Bull. 162, 111837. doi:10.1016/j.marpolbul.2020.111837
Rangel-Buitrago, N., Williams, A., Anfuso, G., Arias, M., and Gracia, C., A. (2017). Magnitudes, sources, and management of beach litter along the Atlantico department coastline, Caribbean coast of Colombia. Ocean Coast. Manag. 138, 142–157. doi:10.1016/j.ocecoaman.2017.01.021
Rangel-Buitrago, N., Williams, A. T., and Anfuso, G. (2018). Hard protection structures as a principal coastal erosion management strategy along the Caribbean coast of Colombia. A chronicle of pitfalls. Ocean Coast. Manag. 156, 58–75. doi:10.1016/j.ocecoaman.2017.04.006
Registraduría Nacional del Estado Civil (2022). Historical election results. Available at: https://registraduria.gov.co/-Electoral-3634- (Accessed April 6, 2022).
Renewables Consulting Group (2022). Hoja de ruta para el despliegue de la energía eólica costa afuera en Colombia: Reporte final. ERM. Minenergía, Colombia: World Bank Group, 217.
Restrepo-Ángel, J. D., Kettner, A. J., and Syvitski, J. (2015). Recent deforestation causes rapid increase in river sediment load in the Colombian Andes. Anthropocene 10, 13–28. doi:10.1016/j.ancene.2015.09.001
Restrepo-Ángel, J. D. (2008). Applicability of LOICZ catchment–coast continuum in a major Caribbean basin: The Magdalena River, Colombia. Estuar. Coast. Shelf Sci. 77, 214–229. doi:10.1016/j.ecss.2007.09.014
Restrepo, J. C., Orejarena, R. A. F., and Torregroza, A. C. (2017). Suspended sediment load in northwestern South America (Colombia): A new view on variability and fluxes into the Caribbean Sea. J. S. Am. Earth Sci. 80, 340–352. doi:10.1016/j.jsames.2017.10.005
Restrepo, J. C., Schrottke, K., Traini, C., Ortíz, J., Rondón, A., Otero, L., et al. (2016). Sediment transport regime and geomorphological change in a high discharge tropical delta (Magdalena River, Colombia): Insights from a period of intense change and human intervention (1990-2010). J. Coast. Res. 32. doi:10.2112/JCOASTRES-D-14-00263.1
Restrepo-Ángel, J. D., Escobar, R., and Tosic, M. (2018). Fluvial fluxes from the Magdalena River into Cartagena Bay, Caribbean Colombia: Trends, future scenarios, and connections with upstream human impacts. Geomorphology 302, 92–105. doi:10.1016/j.geomorph.2016.11.007
Rifkin, J. (2019). The Green New Deal: Why the fossil fuel civilization will collapse by 2028, and the bold economic plan to save life on earth. New York, United States: St. Martin’s Press, 304.
Steffen, W., Richardson, K., Rockström, J., Cornell, S. E., Fetzer, I., Bennett, E. M., et al. (2015). Sustainability. Planetary boundaries: Guiding human development on a changing planet. Sustain. Sci. (New York, N.Y.) 347, 1259855. doi:10.1126/science.1259855
Saavedra-Díaz, L. M., Rosenberg, A. A., and Pomeroy, R. (2015). “Why Colombian marine Fishers’ knowledge is a fundamental tool for marine resource management and assessment,” in Fishers’ knowledge and the ecosystem approach to fisheries. Applications, experiences and lessons in Latin America. Editors J. Fischer, J. Jorgensen, H. Josupeit, D. C. Kalikoski, and C. M. Lucas (Rome: Food and Agriculture Organization of the United Nations), 89–105.
Sachs, J., Kroll, C., Lafortune, G., Fuller, G., and Woelm, F. (2021). Sustainable development report 2021. Cambridge: Cambridge University Press, 505.
Schubert, H., Caballero Calvo, A., Rauchecker, M., Rojas-Zamora, O., Brokamp, G., and Schütt, B. (2018). Assessment of land cover changes in the hinterland of Barranquilla (Colombia) using landsat imagery and logistic regression. Land 7, 152. doi:10.3390/land7040152
Secretaria de Transparencia (2022). Índice nacional anticorrupción - inac: Resultados INAC. Presidencia de la República. Available at: http://anticorrupcion.gov.co/medir/indice-nacional-anticorrupcion (Accessed April 7, 2022).
P. R. Shukla, J. Skea, R. Slade, A. Al Khourdajie, R. van Diemen, D. McCollumet al. (Editors) (2022). Climate change 2022: Mitigation of climate change: Contribution of working group III to the sixth assessment report of the intergovernmental panel on climate change (Cambridge, UK, New York, USA: Cambridge University Press).
SuperTransporte (2019). Boletín estadístico. Tráfico portuario en Colombia. Año 2018. Mintransporte, Bogotá, D.C. Available at: https://www.supertransporte.gov.co/documentos/2019/Marzo/Puertos_26/2019-03-19_BOLETIN_TRAF_PORT_2018_OBSERVACION.pdf (Accessed September 20, 2021).
Tejeda-Benítez, L., Noguera-Oviedo, K., Aga, D. S., and Olivero-Verbel, J. (2018). Toxicity profile of organic extracts from Magdalena River sediments. Environ. Sci. Pollut. Res. 25, 1519–1532. doi:10.1007/s11356-017-0364-9
Torres Ramírez, J. E. (2012). Estudio sobre el mercado de arrendamiento de vivienda en Colombia: Informe final. Nota técnica IDB-TN-372. Banco Interamericado de Desarrollo. Available at: https://publications.iadb.org/publications/spanish/document/Estudio-sobre-el-mercado-de-arrendamiento-de-vivienda-en-Colombia.pdf (Accessed April 26, 2022).
Torres-Bejarano, F. M., Torregroza-Espinosa, A. C., Martinez-Mera, E., Castañeda-Valbuena, D., and Tejera-Gonzalez, M. P. (2020). Hydrodynamics and water quality assessment of a coastal lagoon using environmental fluid dynamics code explorer modeling system. Glob. J. Environ. Sci. Manage. 6. doi:10.22034/gjesm.2020.03.02
Tosic, M., Restrepo-Ángel, J. D., Izquierdo, A., Lonin, S., Martins, F., and Escobar, R. (2018). An integrated approach for the assessment of land-based pollution loads in the coastal zone. Coast. Shelf Sci. 211, 217–226. doi:10.1016/j.ecss.2017.08.035
UN Sustainable Development Group (2022). Leave No one behind: Universal values. Principle two: Leave No one behind. United Nations. Available at: https://unsdg.un.org/2030-agenda/universal-values/leave-no-one-behind (Accessed September 6, 2022).
Un-Desa, (2021). Global population growth and sustainable development. UN DESA/POP/2021/TR/NO.2. New York, USA: United Nations Publication, 124.
UNAL, INS, ICBF (2020). Encuesta nacional de la Situación nutricional: Ensin 2015. Bogotá, D.C.: ICBF, 683.
UNEP (2021). Emissions Gap Report 2021: The heat is on - a world of climate promises not yet delivered. United Nations Environment Programme, Nairobi. Available at: https://wedocs.unep.org/bitstream/handle/20.500.11822/36990/EGR21.pdf (Accessed May 10, 2022).
United Nations (2021). The second world ocean assessment: World ocean assessment II. Volume I. United Nations. Available at: https://www.un.org/regularprocess/sites/www.un.org.regularprocess/files/2011859-e-woa-ii-vol-i.pdf (Accessed May 5, 2021).
UPME (2019). Plan energético nacional 2020-2050: Documento de consulta. Unidad de Planeación Minero Energética, Bogotá, D.C. Available at: https://www1.upme.gov.co/DemandaEnergetica/PEN_documento_para_consulta.pdf (Accessed November 4, 2022).
Vicepresidencia de la República (2022). Colombian Women’s Observatory: Power and decision-making indicators. Vicepresidencia de la República. Available at: https://observatoriomujeres.gov.co/en/Empowerment (Accessed April 6, 2022).
Villate, D. A., Portz, L., Portantiolo Manzolli, R., and Alcantara-Carrio, J. (2020). Human disturbances of shoreline morphodynamics and dune ecosystem at the puerto velero spit (Colombian caribbean). J. Coast. Res. 95, 711–716. doi:10.2112/si95-138.1
Wint Mon Swe (2022). Assesment of the sustainability and resilience of Cork Harbour against climate change using the concept of Circles of Coastal Sustainability (CCS). [Master thesis] (Ravenna, Italia: Alma Mater Studiorum – Università di Bologna).
WWF (2020). La pesca en Colombia: Del agua a la mesa: Hacia dónde van nuestros océanos. Medellín: Agenda del Mar, 98.
Glossary

Keywords: socio-ecological system, Magdalena River, Caribbean region, indicators, coastal zone management, sustainability assessment
Citation: Gallo-Vélez D, Restrepo JC and Newton A (2023) Assessment of the Magdalena River delta socio-ecological system through the Circles of Coastal Sustainability framework. Front. Earth Sci. 11:1058122. doi: 10.3389/feart.2023.1058122
Received: 30 September 2022; Accepted: 05 April 2023;
Published: 05 May 2023.
Edited by:
Kyungsik Choi, Seoul National University, Republic of KoreaReviewed by:
Miguel Ortega-Sánchez, University of Granada, SpainEmmanoel Vieira Silva-Filho, Fluminense Federal University, Brazil
Copyright © 2023 Gallo-Vélez, Restrepo and Newton. This is an open-access article distributed under the terms of the Creative Commons Attribution License (CC BY). The use, distribution or reproduction in other forums is permitted, provided the original author(s) and the copyright owner(s) are credited and that the original publication in this journal is cited, in accordance with accepted academic practice. No use, distribution or reproduction is permitted which does not comply with these terms.
*Correspondence: David Gallo-Vélez, ZGdhbGxvQHVuaW1hZ2RhbGVuYS5lZHUuY28=