 Chunheng Yan
 Sha Li
 Bin Zhou
 Yan Zhan2*
 Xiangyu Sun
 Lingqiang Zhao
- 1Earthquake Agency of Guangxi Zhuang Autonomous Region, Nanning, China
- 2State Key Laboratory of Earthquake Dynamics, Institute of Geology, China Earthquake Administration, Beijing, China
- 3The Second Monitoring and Application Center, China Earthquake Administration, Xi’an, China
The Yunkai Magmatic Arc (YKMA) is located southwest of the South China Block. It has experienced the amalgamation, splitting, and intracontinental orogeny caused by multistage tectonic thermal events. It is also a concentrated area of strong earthquakes in South China. On 12 October 2019, the Beiliu M5.2 earthquake occurred in the hinterland of the YKMA. To reveal the deep electrical structure of the YKMA and the seismogenic environment of the Beiliu earthquake, 101 high-quality data from the magnetotelluric (MT) survey points were acquired. The deep electrical structure images were obtained by three-dimensional electromagnetic inversion imaging. The results indicated that the deep part of the hinterland of the YKMA is characterized by a mushroom-shaped electrical structure composed of ultra-high resistance (R1, with a resistivity value exceeding 10,000 Ωm) and sub-high resistance (R2, with a resistivity value of about 1,000–10,000 Ωm) bodies. The epicenter of the Beiliu M5.2 earthquake was located in R1, close to the contact region between R1 and R2. There are broad low resistivity zones on the southeast and northwest sides of the YKMA. The low resistivity zones is considered to be correspond to the deep extension of the Wuchuan-Sihui and Hepu-Beiliu brittle-ductile shear zones, respectively. The brittle-ductile shearing of the boundary zones and the oblique upwelling of deep mantle-derived magma from the Leiqiong region are the main reasons for the activation of faults and the activity of moderate and strong earthquakes in the YKMA. In this geodynamic environment, local stress and strain accumulation easily occur in the brittle high resistivity body (R1). When the strain energy accumulation exceeded the threshold value that the rock could withstand, new fracture dislocations occurred in the weak region where R1 and R2 contact, which finally resulted in the 2019 Beiliu M5.2 earthquake.
1 Introduction
Magmatic arc is where magma upwelling, emplacement and eruption occur when the oceanic crust subducts under the continental crust. Now the major island arcs around the Pacific are magmatic arcs, which are prone to volcanoes and strong earthquakes (Hall, 2002). After a long history of geological evolution, most of the ancient magmatic arcs have not been the scene of the past intense volcanic eruption and seismic activity. However, if the ancient magmatic arcs are affected by the current regional dynamic thermal events to activate the crustal tectonic, they will certainly become a zone of strong earthquake activity. The region of Yunkai Great Mountain in the South China block may be a window to explore the activation of ancient magmatic arcs. Yunkai Great Mountain starts from the South bank of the Xijiang River at the junction of Guangxi and Guangdong provinces in the North and reaches Lianjiang City in Guangdong Province in the South. It stretches for more than 200 km from northeast to southwest. Structurally, Yunkai Great Mountain is located in the South China Block at the southeast edge of the Eurasian continental plate, close to the southern end of the tectonic junction zone of the Yangtze and Cathaysia blocks (Qin-Hang tectonic junction zone, QHTJZ; Qin et al., 2017; Yan et al., 2019). It was called the Yunkai Magmatic Arc (YKMA; Figures 1A, B) by Pan et al. (2009). YKMA was formed during the Late Proterozoic to Caledonian. It belongs to the multi-island arc basin system in the southeast margin of the Pan-Cathaysian continent and has experienced the amalgamation, fragmentation, and two significant intracontinental orogenic events which originated from multiple tectonic-thermal events during the Early Paleozoic to Mesozoic (Qiu and Liang, 2006; Shu, 2006; Yu et al., 2006; Zhang et al., 2013; Qin et al., 2017; Wang et al., 2020). Since the Late Cenozoic, the Leiqiong area in the South of YKMA has experienced multi-cycle volcanic eruption (Zhou and Armstrong, 1982; Flower et al., 1992; Zou and Fan., 2010). The geothermal flow, seismological, and geochemical multi-disciplinary studies showed that the upwelling of deep mantle-derived magma in the Leiqiong area may have reached YKMA (Lebedev and Nolet, 2003; Yuan et al., 2006; Lei et al., 2009; Wang and Huang, 2012; Yan et al., 2014; Huang et al., 2015; Wei and Chen, 2016; Xia et al., 2016; Yan et al., 2018; Ge et al., 2022). Compared with the overall low level of modern seismicity of the South China Block, YKMA and the Leiqiong area are the concentrated areas of strong earthquakes in South China. Over the past 400 years, more than eleven earthquakes above M6 have been recorded, including the 1890 Guangxi Luchuan M6 earthquake in the hinterland of YKMA (Zhou et al., 2021). The above evidence suggests that the YKMA and its adjacent area have currently become the concentrated zone of strong earthquake activity, which may be related to the upwelling of deep mantle-derived magma in the Leiqiong area. The lack of detailed historical seismic data and deep exploration results makes it impossible for us to further research.
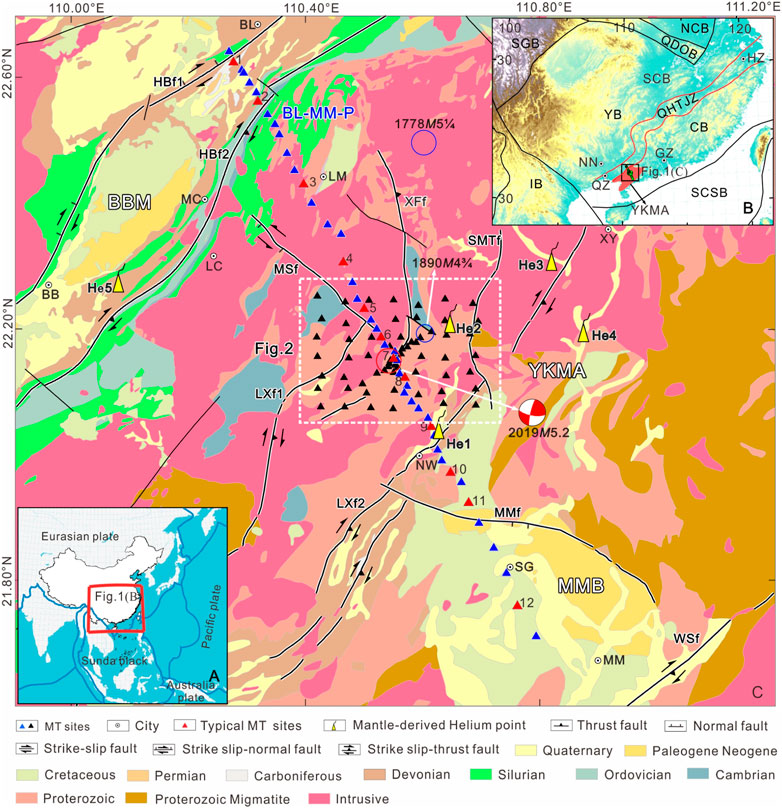
FIGURE 1. (A) Simplified map shows the location of the (B) in East Asia; (B) Simplified map of the South China Block (modified from Yan et al., 2002; Yan et al., 2019); (C) Geology map of the Yunkai magmatic Arc, South China (modified from China Regional Geology Guangxi Chronicle, 2016). NCB, North China Block; SCB, South China Block; YB, Yangtze Block; CB, Cathaysia Block; SGB, Songpan-Ganzi Block; IB, Indosinian Block; SCSB, South China Sea Block; QDOB, Qinling-Dabie Orogen belt; QHTJZ, Qin-Hang tectonic Junction zone; BBM, Bobai Massif; YKMA, Yunkai magmatic Arc; MMB, Maoming Basin; HBf1, Western Hepu-Beiliu fault; HBf2, Eastern Hepu-Beiliu fault; MSf, Michang-Shiwo fault; XFf, Xinfeng fault; LXf1, Western Lianjiang-Xinyi fault; LXf2, Eastern Lianjiang-Xinyi fault; SMTf, Simentang fault; MMf, Northern Maoming basin fault; WSf:Wuchuan-Sihui fault. HZ, Hangzhou; GZ, Guangzhou; NN, Nanning; QZ, Qinzhou; BB, Bobai; BL, Beiliu; LC, Luchuan; MM, Maoming; LJ, Lianjiang; XY, Xinyi; MC, Michang; LM, Liuma; NW, Nawu; SG, Shigu. He1, Xinshidai thermal spring; He2, Wentang thermal spring; He3, XiJiang thermal spring; He4, Reshuiwo thermal spring; He5, Jiatang thermal spring (Zhao et al., 2021).
On 12 October 2019, another M5.2 earthquake occurred in Beiliu City, located in the Guangxi Zhuang Autonomous Region, in the hinterland of YKMA, with a focal depth of about 10 km. Owing to the increase in the density of the regional seismic monitoring network in recent years and the erection of six mobile observation stations after the earthquake, the activity of this earthquake sequence was completely recorded. Overall, 165 aftershocks above ML0.0 were recorded. After the M5.2 earthquake, numerous studies have been carried out regarding the earthquake sequence, focal mechanism, seismogenic structure, and earthquake occurrence mechanism. For example, Li et al. (2019) conducted investigations about surface geology and tectonic geomorphology and concluded that the seismogenic structure was the NW-trending Michang-Shiwo Fault (MSf), but no fault outcrops or surface fractures were found near the epicenter. Yan et al. (2019) achieved the same result based on the integration of focal mechanism solution, precise earthquake location, and seismic intensity distribution. He et al. (2021) studied the rupture directions of the M5.2 earthquake and the M4.2 foreshock, and suggested that these earthquakes resulted from the conjugate activities of the NW-trending MSf and the near SN-trending Xinfeng Fault (XFf). Fan et al. (2022), Huang et al. (2022), and Wen et al. (2022) obtained the velocity structure of the upper crust in the seismic region according to short-period dense array noise imaging and broadband receiver function, and concluded that the strike-slip movement of MSf was blocked by high-speed bodies, resulting in stress accumulation, which finally led to the earthquake. Zhao et al. (2021) observed a high mantle-derived helium anomaly in the earthquake region before the earthquake, and concluded that the earthquake may be related to the upwelling of deep mantle-derived magma in the nearby Leiqiong area. In summary, abundant monitoring data related to the Beiliu earthquake have been acquired, and some understandings of the seismogenic structure and earthquake genetic mechanism have also been attained, but there are still some controversies. In particular, the movement mode of the focal mechanism solution surface of the Beiliu M5.2 earthquake is opposite to the sinistral strike-slip movement of the NW-trending faults and the dextral strike-slip movement of the NE-trending faults in this region (Yan et al., 2019; Figure 1C). The incompatibility of the fault movement mode and deformation behavior may be related to the unique deep seismogenic environment of the Beiliu M5.2 earthquake region. Therefore, to reveal the details of the deep seismogenic environment of the Beiliu earthquake region, to find the evidence that the upwelling of deep mantle-derived magma has affected the earthquake region, and to uncover the mystery of the activation of the ancient YKMA fault structure, profound scientific understanding of the seismogenic structure of the Beiliu M5.2 earthquake is required which itself depends on the high-precision deep detection results.
The existence, transport, and interconnection of fluids can cause a significant increase in the conductivity values of rock masses within a fault zone. Changes in their pressure or slip rates can lead to changes in fault activity (Bürgmann, 2018). The MT method is a geophysical exploration method that uses natural electromagnetic fields as the source. It is the most sensitive method to detect the conductivity of rock masses and is, therefore, commonly used in the detection studies of seismogenic structures (Unsworth and Bedrosian, 2004; Becken et al., 2011; Zhao et al., 2012; Zhang et al., 2016; Zhan et al., 2017; Wang et al., 2018; Ye et al., 2018; Ye et al., 2020). The results of three-dimensional MT exploration in recent years suggest that moderate and strong earthquakes and aftershocks are closely related to the resistivity structure of underground media (Zhao et al., 2012; Zhan et al., 2013; Mohan et al., 2015; Aizawa et al., 2017; Arora et al., 2017; Cai et al., 2017; Sun et al., 2019; Ye et al., 2020; Zhao et al., 2019; Peng et al., 2022). Some moderate and strong earthquakes have occurred near the boundary between high and low resistivity structure of underground media. Earthquakes always occurred in the transition zone of high and low resistivity structures, mainly close to the high resistivity side (Ye et al., 2021; Zhan et al., 2021; Yu et al., 2022; Zhao et al., 2022). In recent years, magnetotelluric exploration aimed at mineral resources has obtained a large-scale deep electrical structure framework of the South China Block (Yan et al., 2019; Xu et al., 2019; Hu et al., 2020; Mao et al., 2021), but the deep electrical structure exploration of the Beiliu M5.2 earthquake region is still lacking.
In this study, we obtained an MT profile and array across the YKMA and Beiliu earthquake region, respectively. The results of the three-dimensional magnetotelluric sounding array in the Beiliu earthquake region are displayed in Figure 1C. Based on the results of seismology, geochemistry, and geothermal flow, the deep electrical structure of YKMA and the deep seismogenic environment of the Beiliu M5.2 earthquake were revealed. The research results are significant for understanding the activation of the ancient YKMA fault structure and the genesis of intraplate earthquakes in South China.
2 Regional geological structure and magnetotelluric profile
There are three groups of NE-trending fault zones in the study area, including the western branch (HBf1) and eastern branch (HBf2) of the Hepu-Beiliu fault zone, the western branch (LXf1) and eastern branch (LXf2) of the Lianjiang-Xinyi fault zone, and the Wuchuan-Sihui fault zone (WSf) from northwest to southeast (China Regional Geology Guangxi Chronicle, 2016; Figure 1C). HBf1 is a normal strike-slip fault dipping NW. HBf2 is a reverse strike-slip fault dipping SE. LXf1 and LXf2 are reverse strike-slip faults dipping SE. WSf is a reverse strike-slip transcrust fault dipping SE, and it is also a large brittle-ductile shear zone with intensive dynamic thermal metamorphism (Peng and Wu, 1994). Besides, there is an NWW-trending fault (MMf) on the northern edge of the Maoming Basin, which has controlled the evolution of this basin (Ye, 2008). The topographic and geological features of the Beiliu M5.2 earthquake region are shown in Figure 2. The Beiliu M5.2 earthquake region is at a low elevation region, with an average elevation of about 100 m, but the northwest side of the Beiliu seismic area shows a southwest-northeast spreading mountain, with an elevation of more than 300 m. The Beiliu earthquake occurred in the area where the mountain meets the plain (Figure 2A). The survey area is characterized by typical conjugate structural systems, including the NE-trending LXf1 and LXf2, NW-trending MSF, and near SN-trending XFf and SMTf. The surface trajectories of MSF and XFf near the epicenter meet but do not intersect (Li et al., 2019).
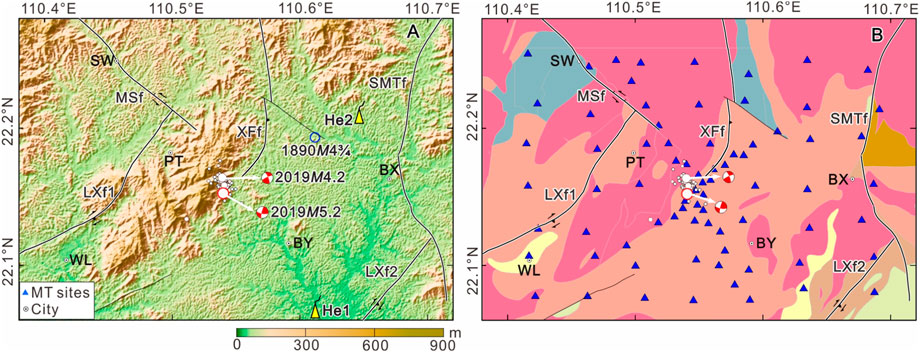
FIGURE 2. (A) Topographic map in Beiliu M5.2 earthquake region; (B) Geology map and distribution of MT sites in Beiliu M5.2 earthquake region. SW, Shiwo; WL, Wenlou; PT, Pingtian; BY, Boyang; BX, Baoxu. The names of faults, stratum and mantle-derived Helium of thermal spring gas are consistent with those in Figure 1.
The study area is divided into the Bobai Massif (BBM) and YKMA by HBf1 (China Regional Geology Guangxi Chronicle, 2016; Figure 1C). BBM is sandwiched between the eastern and western branches of the Hepu-Beiliu fault zone. It is a large collision zone and brittle-ductile shear zone (Huang, 2000; Qin et al., 2008). The outcropped rocks include the Cretaceous-Paleogene glutenite and the Devonian sandstone, mudstone, and limestone. Ordovician-Silurian siltstone and shale are exposed near HBf2. YKMA is located between HBf2 and WSf. Precambrian crystalline basement, shallow metamorphic folded basement, and multistage granitoids are distributed in this region. The Beiliu earthquake region is dominated by shallow metamorphic folded basement granitic plutons (Zhong et al., 1996; Wang et al., 1998; Figure 2B). The Bobai Massif (MMB) in YKMA is covered with Cretaceous-Paleogene red clastic rocks (Ye, 2008).
In this research, the Beiliu-Maoming Magnetotelluric Profile (BL-MM-P) stretched across BBM, YKMA, and MMB from northwest to southeast. The profile began from Beiliu in Guangxi Province, through the Beiliu earthquake region, to about 10 km northwest of Maoming in Guangdong Province, with a total length of about 115 km. We obtained 43 survey points, with an average point distance of 2.5 km (Figure 1C). Given the characteristics of the conjugate tectonic system and the mixed distribution of intrusive rocks and metamorphic rocks in the Beiliu earthquake area, the magnetotelluric sounding array was arranged around the epicenter of the Beiliu earthquake. We obtained a total of 58 survey points. The distance between the survey points in the epicenter area was smaller than 1 km (Figure 2).
3 Acquisition, processing, analysis, and inversion of electromagnetic data
3.1 Data acquisition and processing
From December 2020 to March 2021, the MTU-5A magnetotelluric observation system was used for magnetotelluric data acquisition. The electric field components in the SN and EW directions, and the magnetic field components in the SN, EW, and vertical directions were observed. To obtain high-quality electromagnetic data, the recording time of each survey point included two nights, and that of the survey points near strong electromagnetic interference sources included three nights. Meanwhile, a remote reference station (YCK in Supplementary Figure S1.1, about 150 km away from the northwest end and 270 km away from the southeast end of the BL-MM-P profile) was set up for synchronous observation in Xiangzhou County, located in Laibin City, northeast of the study area, to eliminate the strong near-field electromagnetic interference. After processing the data using the remote reference and without robust technologies (Gamble et al., 1979; Egbert and Booker, 1986; Han et al., 2022), the data quality was greatly improved and the continuity of apparent resistivity and phase curve was improved (Supplementary Figures S1.2, S1.3). Finally, 101 MT survey points were obtained.
The apparent resistivity and impedance phase curves of 12 typical survey points distributed in BBM, YKMA, and MMB on the BL-MM-P profile are shown in Figure 3. The apparent resistivity curve of each survey point in BBM is characterized by high-low-sub high values with the increase in frequency, indicating that there is a high-resistance layer in the shallow part of this sectionas well as a low-resistance body with a certain thickness in the deep part. The apparent resistivity of each survey point in YKMA is larger than 100 Ω·m in almost all frequency bands, and the curve is characterized by low-high-sub low values with the increase of frequency. These suggest that there are low-resistance layers in the shallow part and high-resistance bodies in the deep part, which are the manifestations of crystalline metamorphic rocks and granitic intrusive rocks. The resistivity tends to decrease further with depth. The apparent resistivity values of the survey points in MMB are generally below hundreds of Ω·m. The apparent resistivity values of No. 5–7 survey points in the Beiliu earthquake region are relatively high, especially in the middle frequency band such that the apparent resistivity reaches 1,000–10,000 Ω·m, and the apparent resistivity tends to decrease in the low-frequency band, indicating that there is a high-resistance body in the middle and deep parts of the earthquake region.
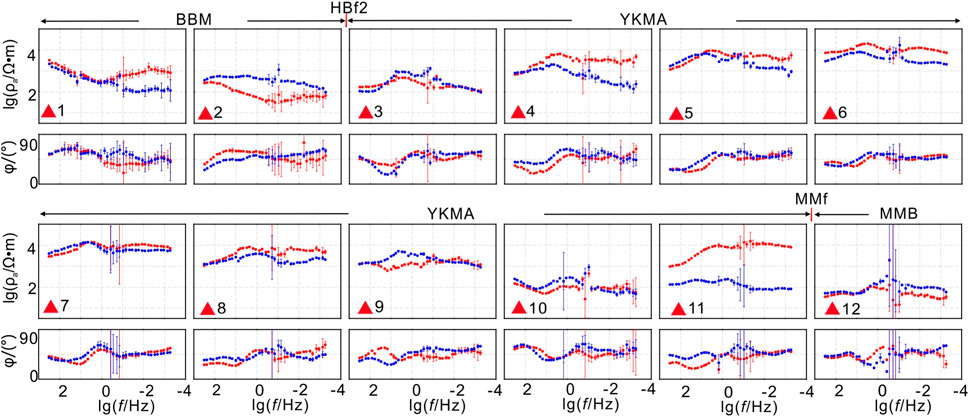
FIGURE 3. Apparent resistivity and impedance phase curves of typical MT sites. Red dots denote XY mode, blue dots denote YX mode. The names of faults, BBM, YKMA, and MMB are consistent with those in Figure 1.
3.2 Regional dimensional analysis
The phase tensor decomposition technology is one of the important tools for the qualitative analysis of electromagnetic data. The two-dimensional deviation degree of the phase tensor (β) can be employed to determine the dimensional characteristics of underground structures (Caldwell et al., 2004; Bibby et al., 2005). Considering the errors of data in the study area, it is suggested that the three-dimensional property of the deep structure is strong when |β| is greater than 5 (Booker, 2014; Cai et al., 2017). The variation of the two-dimensional deviation value of phase tensor decomposition of each survey point on the BL-MM-P profile with the period is shown in Figure 4A. According to the change of |β| with the period, the values of |β| in the middle- and high-frequency bands over 10 seconds are all smaller than 5. As the period increases, the |β| value of many survey points in the southeast of XFf becomes greater than 5, suggesting that the shallow structure of the study area is simple, while the middle and deep structures are complex, displaying obvious three-dimensional characteristics. The two-dimensional deviation plan of the phase tensor of six periods in the Beiliu earthquake region is exhibited in Figure 4B. It can be observed that the |β| value in the high-frequency band with a period of smaller than 2.7 s is generally smaller than 5, and the principal axis directions of the phase tensor ellipses are similar, demonstrating that the shallow structure in the Beiliu earthquake region is characterized by strong two-dimensional characteristics. In the middle- and low-frequency bands with a period of more than 2.7 s, the |β| values of sporadic survey points are initially greater than 5, and then those of most survey points become greater than 5. The |β| values of survey points in the epicenter area of the Beiliu earthquake are even greater, indicating that the three-dimensional nature of the Beiliu earthquake region is very strong. Therefore, to achieve an effective and reliable BL-MM-P profile and a deep electrical structure in the Beiliu earthquake region, it is necessary to perform a three-dimensional magnetotelluric inversion simulation.
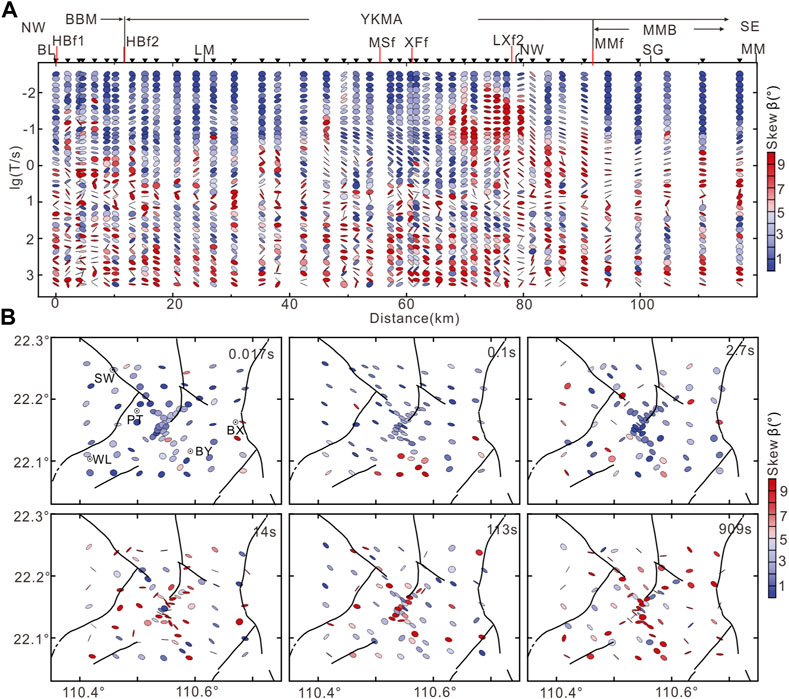
FIGURE 4. (A) Phase tensor ellipses filled with the absolute value of skew angle β along the profiles (upper); (B) Phase tensor ellipses in Beiliu M5.2 earthquake region filled with the absolute value of skew angle β for six periods (bottom). The names of faults, city, BBM, YKMA, and MMB are consistent with those in Figure 1.
3.3 Analysis of regional electrical differences
The geometric mean of the maximum and minimum phases in the phase tensor (i.e., the phase tensor invariance) is used as a parameter to measure the trend of resistivity with depth (Heise et al., 2008). When the
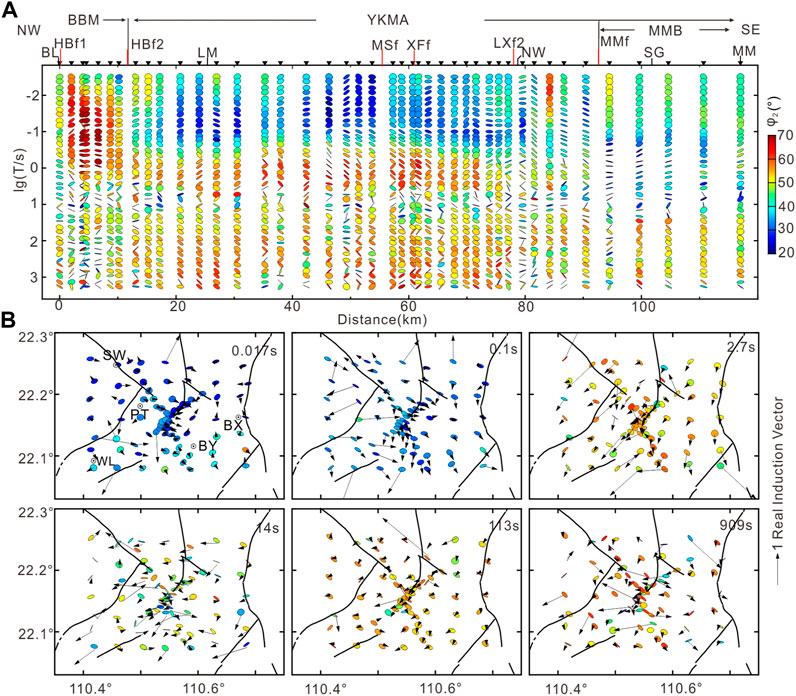
FIGURE 5. (A) Phase tensor ellipses filled with the phase tensor invariant along the profiles (upper); (B) Phase tensor ellipses in Beiliu M5.2 earthquake region filled with the phase tensor invariant for six periods (bottom). The names of faults, city, BBM, YKMA, and MMB are consistent with those in Figure 1.
4 Three-dimensional inversion
Among the 101 survey points obtained along the BL-MM-P profile and the Beiliu earthquake region, the effective frequency band of most of the survey points was 320 Hz to 5,500 s. The outliers, or disturbed data, of each survey point were added with errors to reduce their weight in the inversion. The ModEM (Egbert and Kelbert, 2012) three-dimensional electromagnetic imaging system was employed for the inversion. The apparent resistivity and impedance phase data were utilized, and the error floor was 10% and 5% (2.84°), respectively.
The three-dimensional inversion was carried out in two steps. First, the BL-MM-P profile and 92 survey point data in the Beiliu earthquake region were integrated at an interval of 2 km to perform a three-dimensional inversion. The size of the SN and EW horizontal grid in the central area of the dataset was 2 km × 2 km, and the number of grids was 40 × 58. There were ten expanded grids with a scale factor of 1.5 in each of the four directions outside the central area, and the final number of grids was 60 × 74. The thickness of the first layer of the vertical grid was 20 m, and the grid thickness increased in different proportions in downward segments. The growth factors within 0.5, 0.5–1, 1–15, 15–150, and 150–500 km were 1.2, 1.1, 1.05, 1.1, and 1.2, respectively. Finally, a total of 87 layers were divided (Figure 6). A uniform half space of 500 Ω·m was employed as the initial model. The automatically updated regularization factor was adopted. The initial value of the regularization factor was 5,000. When the inversion was no longer convergent, the regularization factor was updated to one-tenth of the initial value to continue the inversion. After 90 iterations of inversion, the root mean square error (RMS) of the model was 2.51 (Supplementary Figure S2.1). The responses obtained by the three-dimensional inversion were well consistent with the measured apparent resistivity and impedance phase data (Supplementary Figure S2.2).
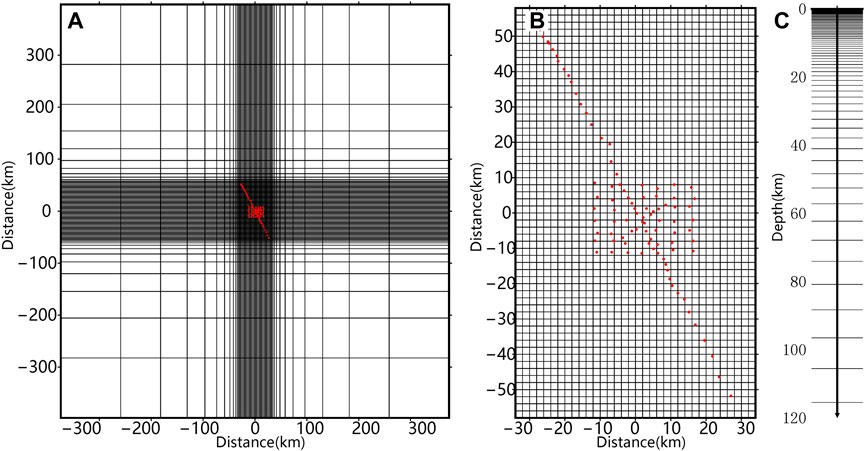
FIGURE 6. Grid used for the 3D inversion in the first step; (A) Horizontal grid; (B) Horizontal grid of central part; (C) Vertical grid; The red dotes denote MT stations.
Second, the inversion of the electromagnetic array in the Beiliu earthquake region was performed. The area contained 76 survey points with a spacing of about 1 km. The size of the SN and EW horizontal grid in the central area of the dataset was 0.6 km × 0.6 km, and the number of grids was 40 × 58. There were 10 expanded grids with a scale factor of 1.5 in each of the four directions outside the central area. The final number of grids was 60 × 74. The vertical grid division was consistent with the large area (Figure 7). Using the model obtained in the first step as the initial model, after 90 iterations of inversion, the RMS of the model was 1.79 (Supplementary Figure S3.1). The responses obtained by the three-dimensional inversion were well consistent with the measured apparent resistivity and impedance phase data (Supplementary Figure S3.2). To assess the robustness of the major model features, sensitivity tests of C1 and C2 were carried out (Supplementary Figure S4).
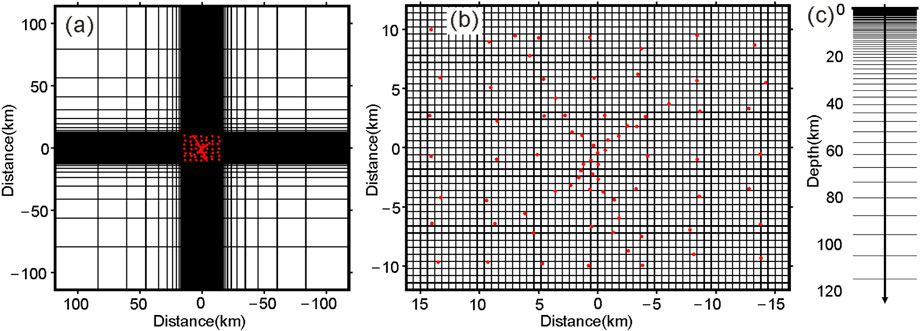
FIGURE 7. Grid used for the 3D inversion in the second step; (A) Horizontal grid; (B) Horizontal grid of central part; (C) Vertical grid; The red dotes denote MT stations.
5 Deep electrical structure of YKMA and Beiliu earthquake region
The deep electrical structure along the BL-MM-P profile is depicted in Figure 8. The depth of Moho near the profile is about 29.5 km (Shen et al., 2013). The geological profile along the BL-MM-P profile was obtained based on the 1:500 000 geological map (China Regional Geology Guangxi Chronicle, 2016), and it was displayed above the electrical structure profile (Figure 8A). The profile crossed BBM, YKMA, and MMB from northwest to southeast, and the main faults included HBf1, HBf2, LXf2, and MMf. Combined with the surface geological outcrops, the electrical structure of the tectonic unit and the deep extension of the main faults are explained in the following.
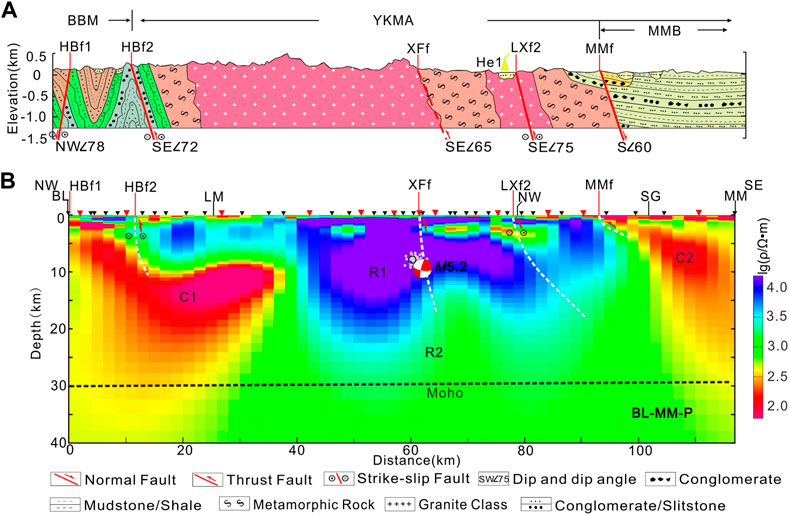
FIGURE 8. (A) Geological cross-section along the BL-MM-P; (B) Electrical structure obtained from 3D inversion of the BL-MM-P. The white dotted lines indicate the inferred extension pattern of the faults in the crust, and the black dotted line indicates the buried depth of the Moho surface along the MT profile. The names of faults, city, BBM, YKMA, and MMB are consistent with those in Figure 1.
Figure 8 shows that there are differential zones with high and low resistances in the lower parts of HBf2 and MMf, representing the main tectonic boundary. The electrical difference zone extends shallowly below LXf2. Accordingly, the deep and shallow electrical structures along the profile can be divided into three segments bounded by HBf2 and MMf. In the northwest of HBf2 in the BBM in the northwest section of the BL-MM-P profile, a high-resistance layer is covered at a depth of 1 km, corresponding to the Paleozoic glutenite, sandstone, and shale. The downward zone is a low-resistance zone (C1) inclined to SE with a resistivity of 100–300 Ω·m, which gradually deepens to below 10 km and is buried under the high resistivity body (R1) in the upper crust of YKMA. The YKMA in the middle section of the BL-MM-P profile is dominated by Precambrian shallow metamorphic folded basement and multistage granitoids. From the shallow surface to the depth of about 20 km, there is a high-resistance body (R1) with a resistivity of thousands or even ten thousands of Ω·m. It covers a wide area in the NW-SE direction between HBf2 and MMf. From the depth of 20 km to the Moho surface, the resistivity decreases to about 1,000 Ω·m (R2). The high-sub-high-resistance structure (R1 and R2) is like a “mushroom” that is wide at the top and narrow at the bottom. The upper high-resistance body (R1) and the lower sub-high-resistance body (R2) are intertwined. The top surface of R2 is undulating like a “hump.” The XFf is located near the “hump”-shaped uplift, where the top surface of the sub-high resistance body (R2) is uplifted to a shallow depth of 13 km. The epicenter of the 2019 Beiliu M5.2 earthquake was located near the high- and low-resistance boundary in the high-resistance area towards the northwest. In the MMB of the southeast section of the BL-MM-P profile, within a depth of about 1 km, there is a low-resistance layer with a resistivity of several hundreds of Ω·m, corresponding to the Quaternary and Cretaceous sandstone and siltstone. The 1–3 km depth is dominated by a medium resistivity layer with a resistivity of about 1,000 Ω·m. The resistivity decreases to several hundreds of Ω·m below 3 km.
To observe the more detailed characteristics of the deep resistivity structure in the Beiliu earthquake region, the cross sections at six depths and the deep electrical structure profile in the NE and NW directions were drawn (Figure 9). According to the cross sections, the ultra-high-resistance block (R1) is located to the west of XFf at the depth of less than 3 km, and its resistivity reaches ten thousands of Ω·m, which is attributed to the widely distributed intrusive rocks in the earthquake region. The northeast and southwest corners of the study area displayed sub-high resistivity, which may be related to the sandstone and siltstone existing in small basins along LXf2 and SMTf. At the depth of 4–10 km, the ultra-high resistivity structure almost covers the whole study area. At the depth of 10–14 km, the ultra-high resistivity body (R1) still exists in the Beiliu earthquake region and the northwest side, while the southeast side of the earthquake region shows a sub-high resistivity structure (R2), with a resistivity close to 1,000 Ω·m. From the NW- and NE-trending profiles, it can be seen more clearly that R1 is deeper in the northwest of the Beiliu earthquake region and shallower in the southeast. The NW-trending profile suggests that R1 is deeply buried in the northwest of the epicenter, and the top interface of R2 in the southeast is convex, just like the “hump” shape in Figure 8B. In the NW- and NE-trending profiles, there is no significant difference between the deep electrical structure of MSF and XFf. The area where MSF and XFf meet but do not intersect in the upper crust is a completely rigid high-resistance body, but the middle and lower crustal materials below XFf show obvious upward convexity.
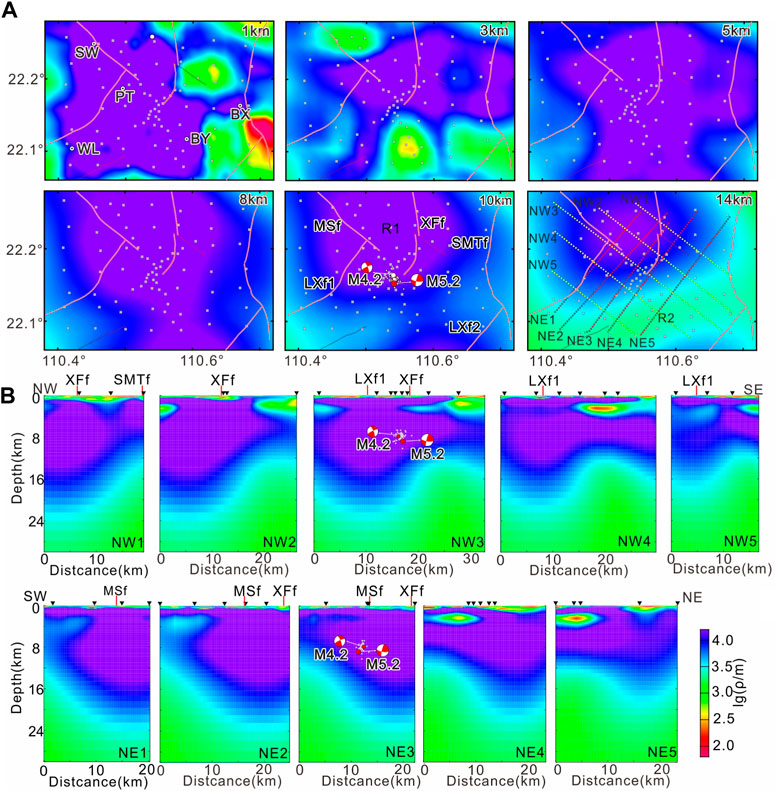
FIGURE 9. Mapview (A) and cross sections (B) of the electrical structure beneath the Beiliu earthquake region. The names of faults, city, BBM, YKMA, and MMB are consistent with those in Figure 1.
6 Discussion
The large brittle-ductile shear zones near paleo-orogenic belts and the boundaries of active plates or blocks are generally the products of the oblique convergence of plates or blocks, and they play a significant role in regulating the tectonic deformation between plates or blocks (Means, 1995; Jiang et al., 2001; Zhu et al., 2004). Based on geological surveys and geochemical studies, the Wuchuan-Sihui fault zone (WSf) and Hepu-Beiliu fault zone (HBf) on the East and west sides of YKMA are is large subduction and collision zones originating from amalgamation, splitting, and multistage orogeny of the Yangtze and Cathaysia blocks (Peng and Wu, 1994; Huang, 2000). In addition, mylonite belts with different degrees of ductile deformation emerged along the two fault zones, and caused the Indosinian strata and geological bodies to be involved in deformation (Liu et al., 2005; China Regional Geology Guangxi Chronicle, 2016; Guo et al., 2020). These indicate that the two fault zones have experienced large-scale brittle-ductile shear deformation since Indosinian orogeny. The MT exploration results show that the Lithosphere brittle-ductile shear zone corresponds to the variation zone of deep electrical structure or the low resistivity zone, which cuts the Moho surface (Yoshimura, et al., 2008; Yu et al., 2017; Cai et al., 2018; Martí et al., 2020). At the depth below 5 km in BBM, there is a low-resistance zone (C1) that slopes toward SE and extends below the Moho surface. C1 may be a broad brittle-ductile shear zone with low rheological strength and viscosity. The shallow part of the zone corresponds to the morphology of HBf which extends in the upper crust. Although the BL-MM-P profile does not cross WSf (the southeast survey point of the profile is about 18 km away from WSf), there is also a low-resistance zone (C2) below the depth of 5 km under MMB. By comparing with the relatively wide lateral distribution characteristics of the Hepu-Beiliu brittle-ductile shear zone in the middle to lower crust, it is inferred that C2 is the horizontal extension of the Wuchuan-Sihui brittle-ductile shear zone on the southeast side in the middle to lower crust. WSf and HBf are not only the concentrated areas of hot springs but also the NE-trending high thermal abnormal belts with a beaded distribution (Yuan et al., 2006; China Regional Geology Guangxi Chronicle, 2016). Hot springs and high thermal anomalies may be related to the melting of deep crustal materials. Before the Beiliu M5.2 earthquake, Zhao et al. (2021) conducted a survey of helium and carbon isotopes of hot spring gas in the Leiqiong area and YKMA. They found that mantle-derived helium constituted the largest percentage (15.23%, He5 in Figure 1C) in Jiatang Hot Spring located in HBf, and helium anomalies were also present in Wentang Hot Spring (10.01%), Xijiang Hot Spring (2.05%), Reshuiwo Hot Spring (3.17%), and Xinshidai Hot Spring (0.97%) near the Beiliu M5.2 earthquake area in the hinterland of YKMA (He1-He4 in Figure 1C). These results indicated that there was mantle-derived magmatic activity below YKMA, and its boundary fault zone played an important role in the upwelling and intrusion of mantle-derived magma. Since the late Cenozoic, the Leiqiong area in the south of YKMA has undergone multi-cycle volcanic eruptions (Zhou and Armstrong, 1982; Flower et al., 1992; Zou and Fan., 2010). According to rock geochemical studies and seismological studies, the magmatism in the Leiqiong area originated from the mantle transition zone or even the core-mantle boundary, and the upwelling of mantle-derived magma was the deep driving force in Leiqiong and its adjacent areas (Lebedev and Nolet, 2003; Lei et al., 2009; Wang and Huang, 2012; Yan et al., 2014; Huang et al., 2015; Wei and Chen, 2016; Xia et al., 2016; Yan et al., 2018; Ge et al., 2022). The low-resistance zone extending deep from the boundary of YKMA, the “hump”-shaped sub-high-resistance body (R2) in the middle and lower crust of YKMA, and the strong earthquake activities in YKMA and its southern Leiqiong area, may all be related to the mantle-derived magmatic activities in the Leiqiong area. The brittle-ductile shearing of the boundary fault zone and the deep thermodynamic action provide the deep dynamic source for the activation of fault structures and seismic activities in YKMA.
The studies on focal mechanism solution (Jiang et al., 1992; Wan, 2010), GPS (Wang and Shen, 2020), and water system statistics (Ai et al., 1982) have indicated that the principal compressive stress direction in the southwest of the South China Block is generally NW-SE, and the dip angle is close to horizontal. Such a tectonic environment is favorable for the sinistral strike-slip movement of the NW-trending faults and the dextral strike-slip movement of NE-trending faults. This is also confirmed by the occurrence of destructive earthquakes since the regional seismic monitoring network was established in 1970, such as the 1977 Guangxi Pingguo M5.0 earthquake, 1994 Beibuwan M6.1 and M6.2 earthquakes, and 2016 Guangxi Cangwu M5.4 earthquake (Zhao, 1983; Yin et al., 1996; Zhou et al., 2019). The focal mechanism solution of the Beiliu M5.2 earthquake suggests that the NWW- and NNE-trending nodal planes are characterized by dextral strike-slip and sinistral strike-slip (Yan et al., 2019; Figure 1C), respectively. This is opposite to the sinistral strike-slip movement of NW-trending faults and dextral strike-slip movement of NE-trending faults in the southwest of the South China Block. Seismologists have been puzzled by the inconsistency between the mode of fault movement and deformation behavior. As mentioned above, the geothermal flow, seismological, and geochemical studies show that the upwelling of deep mantle-derived magma in the Leiqiong area may have reached YKMA. The HBf and WSf at the boundary of YKMA have become the preferred channel and the most significantly affected zone for the upwelling of deep mantle-derived magma. Therefore, the strength of the rocks is reduced, the rheology is enhanced, and the local strain rate is increased. Under the coupling effect of deep thermal and regional tectonic stress, the two boundary faults regulated the tectonic deformation in YKMA in the form of brittle-ductile shear. Moreover, the deep mantle-derived magma in the Leiqiong area upwelled obliquely from south to north, reaching the deep part of YKMA, which led to the transformation of YKMA. They gradually evolved in the upper and middle crust to form the intertwined interface of the sub-high-resistance body (R2) and the high-resistance body (R1). Local stress and strain accumulations were easy to occur in the brittle high-resistance body (R1). When the conditions for rock fracture and instability were reached, the pre-existing or newly formed NW-trending faults would exhibit dextral strike-slip dislocation, and the near SN-trending faults would show sinistral strike-slip dislocation (Figure 10). The Beiliu M5.2 earthquake occurred in the area where the NW-trending MSF and the NE-trending XFf meet but do not intersect. No fault outcrop and seismic surface fracture zone were found during the surface geological survey. We speculated that the earthquake was induced by the new fracture in the conjugate tectonic area.
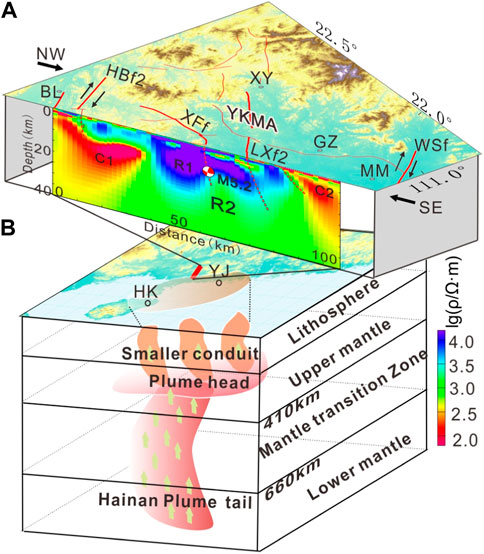
FIGURE 10. (A) Three-dimensional structure of BL-MM-P; (B) Hainan mantle plume modified from Wei and Chen (2016). HK, Haikou; YJ, Yangjiang. Other names of faults, city, BBM, YKMA, and MMB are consistent with those in Figure 1.
The seismogenic structure and environment of the Beiliu earthquake are similar to those of the 1998 Zhangbei M6.2 earthquake in the Zhangbo seismic belt of North China. The Zhangbei earthquake occurred in the Hannuoba high-resistance basalts (Peng et al., 2022). The surging of deep thermal materials resulted in the activity of conjugate faults, which triggered the earthquake. The 2019 Mw6.4-7.1 Ridgecrest earthquake sequence in eastern California of the USA occurred in the distribution area of immature orthogonal strike-slip faults with a low deformation rate. It was caused by the joint rupture of multiple faults under the action of regional tectonic stress (Goldberg et al., 2020; Jia et al., 2020; Fialko and Jin, 2021). These earthquakes indicate that the region with existing conjugate faults is more prone to moderate and strong earthquakes when the stable block is subjected to deep dynamic and/or regional tectonic stress. The occurrence of moderate and strong earthquakes in YKMA may be attributed to the brittle-ductile shear of the boundary fault zone as well as the mantle-derived magmatic activity. This is of great significance for the understanding of the genesis of intraplate earthquakes in South China.
7 Conclusion
According to the data of 101 broadband MT survey points in the hinterland of YKMA in South China and based on the 2019 Guangxi Beiliu M5.2 earthquake area, the deep electrical structure images were obtained by three-dimensional electromagnetic inversion imaging. The results indicated that there are low-resistance zones on the East and West sides of YKMA, corresponding to the deep extension of the Wuchuan-Sihui and Hepu-Beiliu brittle-ductile shear zones, respectively. The deep part of the hinterland of YKMA is characterized by a mushroom-shaped electrical structure composed of ultra-high resistance (R1) and sub-high resistance (R2) bodies. We speculated that this has likely resulted from the brittle-ductile shearing of the boundary zone and the oblique upwelling of the mantle-derived materials in the Leiqiong area. The top interface of R2 is undulating like a “hump.” The 2019 Beiliu M5.2 earthquake occurred near the boundary between high resistance and low resistance in the sub-high resistance uplift and was inclined to the northwest high-resistance body.
The brittle-ductile shearing of the boundary fault zone of YKMA and the deep mantle-derived magmatic action provide the dynamic source for the activation of fault structures and seismic activities in YKMA. Local stress and strain accumulations are easy to occur in the brittle high-resistance body (R1). When the conditions for rock fracture and instability were reached, the pre-existing or newly formed NW-trending faults would exhibit dextral strike-slip dislocation, and the near SN-trending faults would show sinistral strike-slip dislocation. No fault outcrop was found near the epicenter of the Beiliu M5.2 earthquake, thus, we speculated that the earthquake was caused by the new fracture in the conjugate tectonic area. The occurrence of moderate and strong earthquakes in YKMA may be attributed to the brittle-ductile shear of the boundary fault zone as well as the deep mantle-derived magmatic activity, which is of great significance for the understanding of the genesis of intraplate earthquakes in South China.
Data availability statement
The original contributions presented in the study are included in the article/Supplementary Material, further inquiries can be directed to the corresponding authors.
Author contributions
CY, SL, BZ, YZ, XS, XL, and SS completed the field data acquisition, and the data analyses, and wrote the article. BZ, CY, and SL provided funding for the study. XL, FL, and LZ assisted in data acquisition. All authors contributed to the manuscript revision and discussion and approved the submitted version.
Funding
This paper was supported by the Guangxi Scientific Research and Technology Development Plan Project (1377002, 14124004-4-8), Earthquake Prediction Open Fund Project (2021EF0F02), and Science for Earthquake Resilience (XH22004YA) of China Earthquake Administration.
Acknowledgments
We appreciate the access to the computing resources of the Computer Network Information Center at the Institute of Geology, China Earthquake Administration. Some figures were prepared using GMT (Wessel et al., 2013).
Conflict of interest
The authors declare that the research was conducted in the absence of any commercial or financial relationships that could be construed as a potential conflict of interest.
Publisher’s note
All claims expressed in this article are solely those of the authors and do not necessarily represent those of their affiliated organizations, or those of the publisher, the editors and the reviewers. Any product that may be evaluated in this article, or claim that may be made by its manufacturer, is not guaranteed or endorsed by the publisher.
Supplementary material
The Supplementary Material for this article can be found online at: https://www.frontiersin.org/articles/10.3389/feart.2023.1078796/full#supplementary-material
References
Ai, N., Liang, G., and Scheidegger, A. (1982). The valley trends and neotectonic stress field of Southeast China. Acta Geogr. Sin. 37 (2), 111–122. (in Chinese).
Aizawa, K., Asaue, H., Koike, K., Takakura, S., Utsugi, M., Inoue, H., et al. (2017). Seismicity controlled by resistivity structure: The 2016 kumamoto earthquakes, kyushu island, Japan. Earth Planets Space 69, 4. doi:10.1186/s40623-016-0590-2
Arora, B., Bansal, B., Prajapati, S., Sutar, A., and Nayak, S. (2017). Seismotectonics and seismogenesis of Mw7.8 Gorkha earthquake and its aftershocks. J. Asian Earth Sci. 133, 2–11. doi:10.1016/j.jseaes.2016.07.018
Becken, M., Ritter, O., Bedrosian, P., and Weckmann, U. (2011). Correlation between deep fluids, tremor and creep along the central San Andreas fault. Nature 480, 87–90. doi:10.1038/nature10609
Bibby, H., Caldwell, T., and Brown, C. (2005). Determinable and non-determinable parameters of galvanic distortion in magnetotellurics. Geophys. J. Int. 163, 915–930. doi:10.1111/j.1365-246X.2005.02779.x
Booker, J. (2014). The magnetotelluric phase tensor: A critical review. Surv. Geophys 35, 7–40. doi:10.1007/s10712-013-9234-2
Bürgmann, R. (2018). The geophysics, geology and mechanics of slow fault slip. Earth Planet. Sci. Lett. 495, 112–134. doi:10.1016/j.epsl.2018.04.062
Cai, J., Chen, X., Xu, X., Tang, J., Wang, L., Guo, C., et al. (2017). Rupture mechanism and seismotectonics of the Ms6.5 Ludian earthquake inferred from three-dimensional magnetotelluric imaging. Geophys. Res. Lett. 44, 1275–1285. doi:10.1002/2016GL071855
Cai, X., Cao, J., Zhu, J., and Cheng, X. (2018). System of crust-mantle ductile shear zone in the continental lithosphere in China. Earth Sci. Front. 15 (3), 36–54. (in Chinese). doi:10.1016/s1872-5791(08)60061-5
Caldwell, T., Bibby, H., and Brown, C. (2004). The magnetotelluric phase tensor. Geophys. J. Int. 158, 457–469. doi:10.1111/j.1365-246X.2004.02281.x
China Regional Geology Guangxi Chronicle (2016). Guangxi regional geological survey area summary and service product development (“China regional geology · Guangxi Chronicle”) project. Geological Publishing House. (in Chinese).
Egbert, G., and Booker, J. (1986). Robust estimation of geomagnetic transfer functions. Geophys. J. R. Astr. Soc. 87, 173–194. doi:10.1111/j.1365-246X.1986.tb04552.x
Egbert, G., and Kelbert, A. (2012). Computational recipes for electromagnetic inverse problems. Geophys. J. Int. 189, 251–267. doi:10.1111/j.1365-246X.2011.05347.x
Fan, P., Shen, X., and Huang, Q. (2022). Crust structures beneath Ms5.2 Beiliu earthquake focal region in Guangxi province constrained by receiver functions and surface wave dispersion. Geotect. Metallogenia 46 (3), 633–644. (in Chinese). doi:10.16539/j.ddgzyckx.2022.03.016
Fialko, Y., and Jin, Z. (2021). Simple shear origin of the cross-faults ruptured in the 2019 Ridgecrest earthquake sequence. Nat. Geosci. 14, 513–518. doi:10.1038/s41561-021-00758-5
Flower, M., Zhang, M., Chen, C., Tu, K., and Xie, G. (1992). Magmatism in the South China basin. Chem. Geol. 97, 65–87. doi:10.1016/0009-2541(92)90136-S
Gamble, T., Goubau, W., and Clarke, J. (1979). Error analysis for remote reference magnetotellurics. Geophysics 44 (5), 959–968. doi:10.1190/1.1440988
Ge, T., Chen, Y., and Zhang, C. (2022). Study of hainan mantle plume based on shear wave splitting method. Acta Sci. Nat. Univ. Pekin. 58 (2), 261–270. (in Chinese). doi:10.13209/j.0479-8023.2022.014
Goldberg, D., Melgar, D., Sahakian, V., Thomas, A., Xu, X., Crowell, B., et al. (2020). Complex rupture of an immature fault zone: A simultaneous kinematic model of the 2019 ridgecrest, ca earthquakes. Geophys. Res. Lett. 47, e2019GL086382. doi:10.1029/2019GL086382
Guo, S., Huang, X., Nong, J., He, Z., Sun, M., Li, W., et al. (2020). Deformation characteristics and 40Ar-39Ar age of the sanbao ductile shear zone on the northwestern margin of Yunkai block, south China. Geotect. Metallogenia 44 (3), 357–366. (in Chinese). doi:10.16539/j.ddgzyckx.2020.03.003
Hall, R. (2002). Cenozoic geological and plate tectonic evolution of SE Asia and the SW pacific: Computer-based reconstructions, model and animations. J. Asian Earth Sci. 20 (4), 353–431. doi:10.1016/S1367-9120(01)00069-4
Han, J., Zhan, Y., Sun, X., Zhao, G., Liu, X., Bao, Y., et al. (2022). Characteristics and processing of magnetotelluric data under strong electromagnetic interference environment. Seismol. Geol. 44 (3), 736–752. (in Chinese). doi:10.3969/j.issn.0253–4967.2022.03.011
He, X., Liang, H., Zhang, P., and Wang, Y. (2021). The 2019 Ms4.2 and 5.2 Beiliu earthquake sequence in South China: Complex conjugate strike-slip faulting revealed by rupture directivity analysis. Seismol. Res.Lett. 92 (6), 3327–3338. doi:10.1785/0220210008
Heise, W., Caldwell, T., Bibby, H., and Bannister, S. (2008). Three-dimensional modelling of magnetotelluric data from the Rotokawa geothermal field, Taupo Volcanic Zone, New Zealand. Geophys. J. Int. 173, 740–750. doi:10.1111/j.1365-246X.2008.03737.x
Hu, X., Lin, W., Yang, W., and Yang, B. (2020). A review on developments in the electrical structure of craton lithosphere. Sci. China Earth Sci. 63 (11), 1661–1677. (in Chinese). doi:10.1007/s11430-019-9653-2
Huang, H., Tosi, N., Chang, S., Xia, S., and Qiu, X. (2015). Receiver function imaging of the mantle transition zone beneath the South China B lock. Geochem, Geophys, Geosyst 16, 3666–3678. doi:10.1002/2015GC005978
Huang, Q., Shen, X., Wang, W., Xu, X., Zhou, Q., Huang, H., et al. (2022). Short-period dense array ambient noise imaging in the source area of the Guangxi Beiliu earthquake. Chin. J. Geophys. 65 (8), 2917–2930. (in Chinese). doi:10.6038/cjg2022P0221
Huang, Q. (2000). The characteristics of some important basic geology in Guangxi. Guangxi Geol. 13 (3), 3–12. (in Chinese).
Jia, Z., Wang, X., and Zhan, Z. (2020). Multifault models of the 2019 Ridgecrest sequence highlight complementary slip and fault junction instability. Geophys. Res. Lett. 47, e2020GL089802. doi:10.1029/2020GL089802
Jiang, D., Lin, S., and Williams, P. (2001). Deformation path in high-strain zones, with reference to slip partitioning in transpressional plate-boundary regions. J. Struct. Geol. 23, 991–1005. doi:10.1016/S0191-8141(00)00170-X
Jiang, W., Lin, J., and Zhao, Y. (1992). Focal mechanism of small earthquakes and characteristics of tectonic stress field in South China. Earth. Res. China. 8 (1), 36–42. (in Chinese).
Lebedev, S., and Nolet, G. (2003). Upper mantle beneath Southeast Asia from S velocity tomography. J. Geophys. Res. 108 (B1), 2048. doi:10.1029/2000JB000073
Lei, J., Zhao, D., Steinberger, B., Wu, B., Shen, F., and Li, Z. (2009). New seismic constraints on the upper mantle structure of the Hainan plume. Earth Planet. Sci. Lett. 173, 33–50. doi:10.1016/j.pepi.2008.10.013
Li, B., Li, X., Nie, G., Zhao, X., Wei, W., Zhong, D., et al. (2019). Seismogenic structure of the Beiliu Ms5.2 earthquake in Guangxi. North. earth. scie. 37 (S), 17–23. (in Chinese). doi:10.3969/j.issn.1003-1375.2019.S.004
Liu, H., Guo, L., and Hong, Y. (2005). Showing of continental ductile strike slipping: An attempt on Genesis of gneissosity of plutonic rocks in Yunkai area, Western Guangdong. Mineral Resour. Geol. 5, 533–536. (in Chinese).
Mao, X., Ye, G., Zhang, Y., Jin, S., and Wei, W. (2021). Electric structure of the southern section of the Jiangnan orogenic belt and its tectonic implications. Chin. J. Geophys. 64 (11), 4043–4059. (in Chinese). doi:10.6038/cjg2021O0424
Martí, A., Queralt, P., Marcuello, A., Ledo, J., Rodríguez-Escudero, E., Martínez-Díaz, J., et al. (2020). Magnetotelluric characterization of the Alhama de Murcia Fault (Eastern Betics, Spain) and study of magnetotelluric interstation impedance inversion. Earth Planets Space 72, 16. doi:10.1186/s40623-020-1143-2
Means, W. (1995). Shear zones and rock history. Tectonophysics 247 (1-4), 157–160. doi:10.1016/0148-9062(96)89824-x
Mohan, K., Rastogi, B., and Chaudhary, P. (2015). Magnetotelluric studies in the epicenter zone of 2001, Bhuj earthquake. J. Asian Earth Sci. 98, 75–84. doi:10.1016/j.jseaes.2014.10.019
Pan, G., Xiao, Q., Lu, S., Deng, J., Feng, Y., Zhang, K., et al. (2009). Subdivision of tectonicunits in China. Chin. Geol. 36 (1), 1–28. (in Chinese).
Peng, S., and Wu, G. (1994). Tectonic evolution of wuchuan-sihui fault zone and its relationship with gold mineralization. J. Shenyang Inst. Gold Technol. 13 (2), 109–115. (in Chinese).
Peng, Y., Sun, X., Zhan, Y., Zhao, L., Luo, Q., Liu, X., et al. (2022). 3D deep electrical structure and seismogenic environment in the Western section of the Zhangjiakou-Bohai fault zone. Front. Earth Sci. 10, 966192. doi:10.3389/feart.2022.966192
Qin, X., Li, J., Li, R., et al. (2008). Formation and evolution of the Bobai-Cenxi orogenic belt in the northern margin of the Yunkai block. Beijing: China Land Press. (in Chinese).
Qin, X., Wang, Z., Gong, J., Zhao, G., Shi, H., Zhan, J., et al. (2017). The confirmation of caledonian intermediate-mafic volcanic rocks in northern margin of Yunkai block: Evidence for early paleozoic paleo-ocean basin in southwestern segment of qinzhou-hangzhou joint belt. Acta. Pet. Sin. 33 (3), 791–809. (in Chinese).
Qiu, Y., and Liang, X. (2006). Evolution of basin-range coupling in the Yunkai dashan-shiwan dashan area, Guangdong and Guangxi: With a discussion of several tectonic problems of south China. Geol. Bull. China. 25 (3), 340–347. (in Chinese).
Shen, Y., Kang, Y., and Xu, G. (2013). The crustal thickness and Poisson’s ratio distribution in Guangdong and its adjacent areas. Earth. Res. China. 29 (2), 210–218. (in Chinese).
Shu, L. (2006). Pre-devonian tectonic evolution of South China: From cathaysian block to caledonian foled orogenic belt. Geol. J. China Univ. 12, 418–431. (in Chinese).
Sun, X., Zhan, Y., Unsworth, M., Egbert, G., Zhang, H., Chen, X., et al. (2020). 3-D Magnetotelluric imaging of the easternmost Kunlun fault: Insights into strain partitioning and the seismotectonics of the Jiuzhaigou Ms7.0 earthquake. J. Geophys. Res. 125, e2020JB019731. doi:10.1029/2020JB019731
Sun, X., Zhan, Y., Zhao, L., Chen, X., Sun, J., Li, C., et al. (2019). Electrical structure of the Kunlun–Qinling fault system, northeastern Tibetan Plateau, inferred from 3-D inversion of magnetotelluric data. J. Asian Earth Sci. 181, 103910. doi:10.1016/j.jseaes.2019.103910
Unsworth, M., and Bedrosian, P. (2004). On the geoelectric structure of major strike-slip faults and shear zones. Earth Planets Space 56, 1177–1184. doi:10.1186/bf03353337
Wan, Y. (2010). Contemporary tectonic stress field in China. Earthq. Sci. 23, 377–386. doi:10.1007/s11589-010-0735-5
Wang, C., and Huang, J. (2012). Mantle transition zone structure around Hainan by receiver function analysis. Chin. J. Geophys. 55 (4), 1161–1167. (in Chinese). doi:10.6038/j.issn.0001-5733.2012.04.012
Wang, M., and Shen, Z. (2020). Present-day crustal deformation of continental China derived from GPS and its tectonic implications. J. Geophys. Res. Solid Earth. 125 (2), e2019JB018774. doi:10.1029/2019JB018774
Wang, X., Xu, D., Wang, L., Zhou, D., Hu, J., and Ke, X. (2020). Reworking of indosinian tectono-thermal events in the Yunkai massif:gneissic multi-mineral U-Pb geochronological evidence. Earth Sci. 45 (5), 1653–1675. (in Chinese). doi:10.3799/dqkx.2019.151
Wang, X., Zhang, G., Zhou, J., Li, D., Luo, W., Hu, Y., et al. (2018). Crust and upper mantle electrical resistivity structure in the Longmenshan tectonic belt and its relationship with Wenchuan and Lushan earthquake. Chin. J. Geophys. 61 (5), 1984–1985. (in Chinese). doi:10.6038/cjg2018M0233
Wang, Z., Zhou, Y., Zhang, H., and Zhou, H. (1998). The basement evolution and mineralization of Yunkai Massif, South China. Prog. Precam Res. 21 (1), 45–53. (in Chinese).
Wei, S., and Chen, Y. (2016). Seismic evidence of the Hainan mantle plume by receiver function analysis in southern China. Geophys. Res. Lett. 43, 8978–8985. doi:10.1002/2016GL069513
Wen, X., Shen, X., and Zhou, Q. (2022). Study on the characters of the aftershocks of Beiliu 5.2 earthquake using machine learning method and dense nodal seismic array. Chin. J. Geophys. 65 (9), 3297–3308. (in Chinese). doi:10.6038/cjg2022P0430
Wessel, P., Smith, W., Scharroo, R., Luis, J., and Wobbe, F. (2013). Generic mapping tools: Improved version released. Eos Trans. AGU. 94, 409–410. doi:10.1002/2013eo450001
Xia, S., Zhao, D., Sun, J., and Huang, H. (2016). Teleseismic imaging of the mantle beneath southernmost China: New insights into the Hainan plume. Gondwana Res. 36, 46–56. doi:10.1016/j.gr.2016.05.003
Xu, S., Unsworth, M., Hu, X., and Mooney, W. (2019). Magnetotelluric evidence for asymmetric simple shear extension and lithospheric thinning in south China. J. Geophys. Res. Solid Earth. 124, 104–124. doi:10.1029/2018JB016505
Yan, C., Xiang, W., Su, S., Zhou, B., Huang, H., Pan, Y., et al. (2019). Consistency analysis of seismic records and strong motion records in Guangxi taking the Guangxi Beiliu Ms5.2 earthquake as an example. North. earth. scie. 37 (S), 12–16. (in Chinese). doi:10.3969/j.issn.1003-1375.2019.S.003
Yan, D., Zhou, M., Song, H., and Malpas, J. (2002). Where was South China located in the reconstruction of Rodinia? Earth Sci. Front. 9 (4), 249–256. (in Chinese).
Yan, J., Lü, Q., Luo, F., Chen, A., Ye, G., Zhang, Y., et al. (2019). Where is qinzhou-hangzhou juncture belt? Evidence from integrated geophysical exploration. Chin. Geol. 46 (4), 690–703. (in Chinese). doi:10.12029/gc20190402
Yan, Q., Shi, X., and Castillo, P. (2014). The late mesozoic- cenozoic tectonic evolution of the South China Sea: A petrologic perspective. J. Asian Earth Sci. 85, 178–201. doi:10.1016/j.jseaes.2014.02.005
Yan, Q., Shi, X., Metcalfe, L., Liu, S., Xu, T., Kornkanitnan, N., et al. (2018). Hainan mantle plume produced late Cenozoic basaltic rocks in Thailand, Southeast Asia. Sci. Rep. 8, 2640–2714. doi:10.1038/s41598-018-20712-7
Ye, G. (2008). Discussion on the formation mechanism of Maoming Basin in Guangdong province. West-china Explor. Eng. 2008(7), 141–144. (in Chinese).
Ye, T., Chen, X., Huang, Q., and Cui, T. (2021). Three-dimensional electrical resistivity structure in focal area of the 2021 Yangbi Ms6.4 Earthquake and its implication for the seismogenic mechanism. Chin. J. Geophys. 64 (7), 2267–2277. (in Chinese). doi:10.6038/cjg2021O0523
Ye, T., Chen, X., Huang, Q., Zhao, L., Zhang, Y., and Uyeshima, M. (2020). Bifurcated crustal channel flow and seismogenic structures of intraplate earthquakes in Western Yunnan, China as revealed by three-dimensional magnetotelluricimaging. J. Geophys. Res. 125, e2019JB018991. doi:10.1029/2019JB018991
Ye, T., Huang, Q., Chen, X., Zhang, H., Chen, Y. J., Zhao, L., et al. (2018). Magma chamber and crustal channel flow structures in the Tengchong volcano area from 3-D MT inversion at the intracontinental block boundary southeast of the Tibetan Plateau. J. Geophys. Res. 123, 11112–11126. doi:10.1029/2018JB015936
Yin, K., Wu, S., and Wang, L. (1996). Focal mechanism and seismic geologic conditions of the Beibuwan earthquakes. South China J. Seismol. 16 (3), 77–81. (in Chinese).
Yoshimura, R., Oshiman, N., Uyeshima, M., Ogawa, Y., Mishina, M., Toh, H., et al. (2008). Magnetotelluric observations around the focal region of the 2007 noto hanto earthquake (Mj6.9), central Japan. Earth Planet Sp. 60, 117–122. doi:10.1186/BF03352771
Yu, C., Zhang, G., Wang, X., Luo, W., Li, D., Cai, X., et al. (2017). Deep electrical resistivity structure of Sanjiang Area of west Yunnan and its significance. Chin. J. Geophys. 60 (6), 2385–2396. (in Chinese). doi:10.6038/cjg20170628
Yu, J., Wei, Z., Wang, L., Shu, L., and Sun, T. (2006). Cathaysia block: A young continent composed of ancient materials. Geol. J. China Univ. 12 (4), 440–447. (in Chinese).
Yu, N., Wang, X., Li, D., Li, X., Wang, E., Kong, W., et al. (2022). The mechanism of deep material transport and seismogenic environment of the Xiaojiang fault system revealed by 3-D magnetotelluric study. Sci. China Earth Sci. 65 (6), 1128–1145. doi:10.1007/s11430-021-9914-3
Yuan, Y., Ma, Y., Hu, S., Guo, D., and Fu, X. (2006). Present-day geothermal characteristics in South China. Chin. J. Geophys. 49 (4), 1005–1014. (in Chinese). doi:10.1002/cjg2.922
Zhan, Y., Liang, M., Sun, X., Huang, F., Zhao, L., Gong, Y., et al. (2021). Deep structure and seismogenic pattern of the 2021.5. 22 Madoi (Qinghai) Ms7.4 earthquake. Chin. J. Geophys. 64 (7), 2232–2252. (in Chinese). doi:10.6038/cjg2021O0521
Zhan, Y., Yang, H., Zhao, G., Zhao, L., and Sun, X. (2017). Deep electrical structure of crust beneath the Madongshan step area at the Haiyuan fault in the northeastern margin of the Tibetan plateau and tectonic implications. Chin. J. Geophys. 60 (6), 2371–2384. (in Chinese). doi:10.6038/cjg20170627
Zhan, Y., Zhao, G., Unsworth, M., Wang, L., Chen, X., Li, T., et al. (2013). Deep structure beneath the southwestern section of the Longmenshan fault zone and seimogenetic context of the 4.20 Lushan Ms7.0 earthquake. Chin. Sci. Bull. 58 (28), 3467–3474. doi:10.1007/s11434-013-6013-x
Zhang, G., Guo, A., Wang, Y., Li, S., Dong, Y., Liu, S., et al. (2013). a1Tectonics of South China continent and its implications. Sci. China Earth Sci. 56, 1804–1828. (in Chinese). doi:10.1007/s11430-013-4679-1
Zhang, H., Huang, Q., Zhao, G., Guo, Z., and Chen, Y. (2016). Three-dimensional conductivity model of crust and uppermost mantle at the northern Trans North China Orogen: Evidence for a mantle source of Datong volcanoes. Earth Planet. Sci. Lett. 453, 182–192. doi:10.1016/j.epsl.2016.08.025
Zhao, C., Hu, J., Zhou, Y., and Guo, M. (2021). The deep seismogenic environment of Beiliu Ms5.2 earthquake in yulin, Guangxi on october 12, 2019. Sei. Geo. Obser. Resarch. 42 (2), 116–118. (in Chinese). doi:10.3969/j.issn.1003-3246.2021.02.022
Zhao, G., Unsworth, M. J., Zhan, Y., Wang, L., Chen, X., Jones, A. G., et al. (2012). Crustal structure and rheology of the Longmenshan and Wenchuan Mw7.9 earthquake epicentral area from magnetotelluric data. Geology 40 (12), 1139–1142. doi:10.1130/G33703.1
Zhao, L., Sun, X., Zhan, Y., Yang, H., Wang, Q., Hao, M., et al. (2022). The seismogenic model of the Menyuan Ms6.9 earthquake on January 8, 2022, Qinghai Province and segmented extensional characteristics of the Lenglongling fault. Chin. J. Geophys. 65 (4), 1536–1546. (in Chinese). doi:10.6038/cjg2022Q0051
Zhao, L., Zhan, Y., Sun, X., Hao, M., Zhu, Y., Chen, X., et al. (2019). The hidden seismogenic structure and dynamic environment of the 21 January Menyuan, Qinghai, Ms6.4 earthquake derived from magnetotelluric imaging. Chin. J. Geophys. 62 (6), 2088–2100. (in Chinese). doi:10.6038/cjg2019M0204
Zhao, Y. (1983). Focal mechanism of Pingguo M5.0 earthquake 19 october 1977. South China J. Seismol. 3 (S1), 78–80. (in Chinese). doi:10.13512/j.hndz.1983.s1.012
Zhong, Z., You, Z., Zhou, H., and Han, Y. (1996). Composition, evolution and basic structural framework of basement of Yunkai uplift between Guangxi and Guangdong Provinces. Regional Geol. China 14 (1), 36–43. (in Chinese).
Zhou, X. H., and Armstrong, R. (1982). Cenozoic volcanic rocks of eastern China-secular and geographic trends in chemistry and strontium isotopic composition. Earth Planet. Sci. Lett. 58 (3), 301–329. doi:10.1016/0012-821X(82)90083-8
Zhou, Y., Yan, C., Xiang, W., Zhou, B., and Wen, X. (2019). Source parameter of the Cangwu Ms5.4 earthquake’ 31 july’ 2016. Seismol. Geol. 41 (1), 150–161. (in Chinese). doi:10.3969/j.issn.0253-4967.2019.01.010
Zhou, Z., Lv, J., and Zhou, B. (2021). Earthquake prediction index system in SouthSouth China. Beijing: Seismological Press. (in Chinese).
Zhu, G., Liu, G., Dunlap, W., Teyssier, C., Wang, Y., and Nie, M. (2004). 40Ar/39Ar chronological evidence of synorogenic strike-slip movement in the Zhenglu Fault Zone. Chin. Sci. Bull. 49 (2), 191–198. (in Chinese).
Keywords: Yunkai magmatic arc in South China, three-dimensional magnetotelluric imaging, resistivity structure, 2019 Beiliu earthquake, deep seismogenic environment
Citation: Yan C, Li S, Zhou B, Zhan Y, Sun X, Liu X, Su S, Liang F and Zhao L (2023) Deep electrical structure of the hinterland of Yunkai magmatic arc in South China and the seismogenic environment of the 2019 Beiliu earthquake. Front. Earth Sci. 11:1078796. doi: 10.3389/feart.2023.1078796
Received: 24 October 2022; Accepted: 10 January 2023;
Published: 26 January 2023.
Edited by:
Giovanni Martinelli, National Institute of Geophysics and Volcanology, ItalyReviewed by:
Vlad Constantin Manea, National Autonomous University of Mexico, MexicoRolando Carbonari, Hebrew University of Jerusalem, Israel
Copyright © 2023 Yan, Li, Zhou, Zhan, Sun, Liu, Su, Liang and Zhao. This is an open-access article distributed under the terms of the Creative Commons Attribution License (CC BY). The use, distribution or reproduction in other forums is permitted, provided the original author(s) and the copyright owner(s) are credited and that the original publication in this journal is cited, in accordance with accepted academic practice. No use, distribution or reproduction is permitted which does not comply with these terms.
*Correspondence: Bin Zhou, ZHp0emJAMTYzLmNvbQ==; Yan Zhan, emhhbnlhbjY2QHZpcC5zaW5hLmNvbQ==
†These authors have contributed equally to this work and share first authorship