 Jiahui Gu1,2
 Liang Chen1,2
 Yu Wan1,2*
 Yaozong Teng1,2
 Shufa Yan1,2Liang Hu1,2Jiahao Wang1,2Hanxuan Luo1,2
- 1School of Civil Engineering and Transportation, Hohai University, Nanjing, China
- 2Key Laboratory of Geomechanics and Embankment Engineering, Hohai University, Nanjing, China
Obtaining geometric parameters, especially depth, and describing the morphological characteristics of cracks are of great significance to control engineering disasters and accidents caused by cracks. The electric resistance method is based on the principle of differences in electrical properties between cracks and soil, which could be used to measure the single crack depth at project sites. There exists an Rmin value corresponding to a specific electrode distance d value at each Rf-d value obtained by laboratory experiments. Furthermore, a two-dimensional finite element model of soil with a single crack is established to carry out numerical simulation analysis considering the crack width W, crack depth D and complex crack conditions. The results reveal dynamic variation rules of soil resistance after crack development, and for each Rf-d value, the electrode distance d value corresponding to the Rmin value is approximately equal to the crack depth D. In the range of the electric field, the offset and rotation of the crack have little effect, while the measurement results have a strong dependence on relocation movement. The regulation gives guidance to the inversion analysis of crack depth D at project sites and has been applied in crack depth measurements of an expansive soil slope. The electric resistance method as a proposed integrated approach is of great significance and brings new perspectives into the study of crack depth measurements for field applications.
1 Introduction
Due to global climate changes, continuous extreme aridity has increased substantially in East and South Asia, Africa, southern Europe and eastern Australia (Dai, 2011), imposing detrimental impacts on the regional environment, infrastructure construction and people’s livelihoods. Influenced by aridity and desiccation, a large amount of water evaporates from the soil, resulting in soil shrinkage (Lakshmikantha, et al., 2012), crack development and changes in the soil physical and mechanical properties (Albrecht and Benson, 2001; Dyer, 2005; Hallett and Newson, 2011; Costa et al., 2013; Kodikara and Costa, 2013; Kong et al., 2017). The existence of cracks destroys the soil integrity and contributes to attenuation of the soil strength (Lozada et al., 2015; Kong et al., 2018). At the same time, the large crack networks provide many seepage channels for the migration of water (Yuan and Yin, 2004; Krisnanto et al., 2014; Li et al., 2017), leading to the deterioration of soil physical and mechanical properties (Chaduvula et al., 2017; Trabelsi et al., 2018). Therefore, cracks are a direct or indirect incentive for many kinds of geotechnical, geological and geo-environmental problems. For instance, the formation of cracks leads to a decline in expansive soil slope stability and accelerates rainwater infiltration, which is prone to cause landslides (Yin et al., 2012; Xie et al., 2020; Zhang et al., 2021). Crack development may bring about a decrease in the foundation bearing capacity or an increase in the foundation soil compressibility, causing the inclination or even collapse of the construction (Ramana, 1993; Lozada et al., 2015). Cracks in dams are likely to generate dam bursts (Dyer et al., 2009; Khandelwal et al., 2013). In waste disposal storage, the cracks in the soil layer of the isolation zone contribute to the leakage of pollutants (Hewitt and Philip, 1999; Rayhani et al., 2007; Baram et al., 2013).
In recent years, increasing attention has been given to the problem of cracks in geotechnical and geological engineering (Baer et al., 2009; Shin and Santamarina, 2011; Hirobe and Oguni, 2016; Tollenaar et al., 2017; Vo et al., 2017; Wang et al., 2017; Pouya et al., 2018; Tang et al., 2018; Vo et al., 2018; Wang et al., 2018; Li et al., 2019; Ruan et al., 2021). Obtaining the geometrical parameters of the primary crack after development, especially the depth, can be used to control engineering disasters in a more accurate, efficient and economical way. For example, to control expansive soil slope landslide disasters by replacing cement-based materials or other treatment methods, it is urgent to determine the depth of slope failure. Otherwise, it will cause huge economic waste, and the treatment effect cannot be guaranteed (Cai and Li, 2018).
Scholars worldwide have used a series of direct and indirect methods to obtain the geometric parameters of cracks. Lu et al. (2002) defined crack damage variables based on CT data and analyzed the variation rule of crack damage variables with cumulative dry shrinkage. X-ray CT, as a non-destructive, non-invasive, real-time and 3D visualization method of the inner microstructures, has provided a promising way to observe the geometry of cracks in test specimens in real time and explore the mechanical behaviors and damage mechanism of geomaterials (Li et al., 2015; Yang et al., 2015; Cala et al., 2016; Kim et al., 2016; Yu et al., 2016; Zhao and Zhou, 2020). Stewart et al. (2012) used a horizontal recorder connected to a crack to record the water level in the pipe corresponding to volumetric changes in the crack. The methods above are capable of describing the crack geometric parameters dynamically, quantitatively and non-destructively, but the machines are expensive and demand high-quality operation confined to the laboratory. Moreover, scholars worldwide have carried out theoretical algorithm methods and established crack depth calculation models based on the mechanism of crack development and various mechanics, such as linear elastic mechanics and fracture mechanics (Morris et al., 1992; Chertkov, 2000; Zhen et al., 2006; Taghavi et al., 2010; Zhu et al., 2020). However, the predicted value of the crack depth obtained by theoretical calculations is the initial development crack depth, not the final development depth in the stable state. Meanwhile, theoretical calculations contain various assumptions, and there exists a large deviation between the predicted value and the actual value.
Compared with the methods above, the electrical resistivity method as a non-destructive technique has strong operability. Based on differences in the electrical properties between cracks and the soil, a series of tests in the laboratory and in situ measurements have been conducted with the electrical resistivity method to perform tomography scans, which proved the applicability of using electrical properties to express crack development and the geometrical shape (Samouëlian et al., 2003; Samouëlian et al., 2004; Ackerson et al., 2014; Jones et al., 2014; Gunn et al., 2015; Tang et al., 2018; An et al., 2019). Various approaches to invert 1D, 2D and 3D resistivity data have been published (Sultan et al., 2006; Pidlisecky et al., 2007; Park et al., 2009; Jones et al., 2012; Damavandi et al., 2022). Inversion of 2D resistivity data has been used to interpret geoelectrical resistivity data and construct 2D images of subsurface structures. The electrical resistivity imaging technique can be used to recognize underground structures by observing contrasts in the subsurface resistivity distribution (Sungkono et al., 2014; Neyamadpour, 2018; Fma et al., 2022). This method provides a new viewpoint for crack quantitative studies, and the operation requirements are relatively easy to satisfy, but the study is limited to laboratory experiments. Although the electrical resistivity imaging technique has been used to describe the crack distribution underground in situ, there still exists a problem of deviation, which cannot be ignored, owing to simplification in the complex inversion process.
Focusing on the primary crack, which is rather long and plays a decisive role in engineering safety, the study reported herein proposes a new method to carry out crack depth measurements for better field applications, i.e., the electric resistance method based on the theory that the soil resistance after the test current passes through the soil could reflect the internal structure of the soil mass indirectly. Laboratory experiments are conducted, and a two-dimensional finite element model of soil with a single crack is established to carry out numerical simulation analysis considering the measurement soil resistance Rf under the influence of the crack width W, crack depth D and complex crack conditions. Based on the study above, the quantitative relationship between crack depth and the electrode distances is obtained, which is applied to measure the crack depth of an expansive soil slope and verified.
2 Experimental analysis
2.1 Electrical resistance method
The resistance of soil is usually tested by a four-electrode measurement system. According to Ohm’s law, the resistance of soil with a single crack can be expressed as (Figure 1):
where I is the injected current (A); ∆U is the electric potential difference between M and N; MA, MB, NA and NB represent the relative spacing (m) between the electrodes M and A, M and B, N and A, and N and B, respectively; K is the electrode coefficient, which represents the geometry and the spatial position of the electrodes and comprehensive influence on the results caused by the electrodes; F is the crack influence function, which is related to the crack width W, crack depth D and crack length L; and ρ is the resistivity function, the value of which is mainly related to the moisture capacity w, the temperature T and the crack influence function F for the same soil sample.
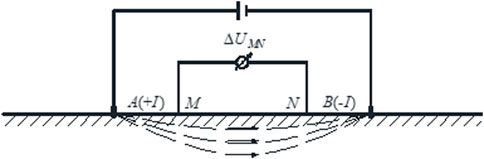
FIGURE 1. Schematic view of the four-electrode method: dashed lines indicate the current flow through the medium (An et al., 2019).
The resistance of soil with a single crack is related to the electrode spatial position and electrical resistivity, the two variables of which are analyzed as follows. The soil resistivity is impacted by basic soil physical properties, which include the mineral composition, arrangement, size and shape of soil particles, pore structure and external environmental factors. The environmental factors are made up of many aspects, such as moisture capacity w and temperature T. To explore the regularity between crack development and the resistivity measurement value and decrease the influence of external factors as much as possible, the parameter logarithm of the resistance ratio Nr is defined, and Nr = ln(Rf∕R0), where Rf is the resistance value of soil with a single crack under certain external conditions and R0 is the resistance value of the identical soil sample with no fissure under the same external conditions. In the site measurement process, when the moisture capacity w and temperature T are controlled at certain values, R0 is a constant value, and the value of Nr is only related to the crack influence function F. During the study, the test electrode pair is almost symmetrically distributed perpendicular to the crack, which means that the spatial position of the electrodes only has a correlation with distances between two electrodes d. The problem is transformed to studying the ascending trend of the Nr value with the development of the crack and under the same crack development condition and the effect of different distances between two electrodes d on the Rf value.
2.2 Material
The mineral composition and physical properties of the expansive soil collected from the Central Line Project of South-to-North Water Diversion are summarized in Table 1. According to the USCS classification, it is a fat clay (CH) (ASTM, 2011). To ensure that there are no impurities in the soil sample that could lead to some disturbances, the coarse particles in the soil sample should be eliminated after retrieval of the soil sample.
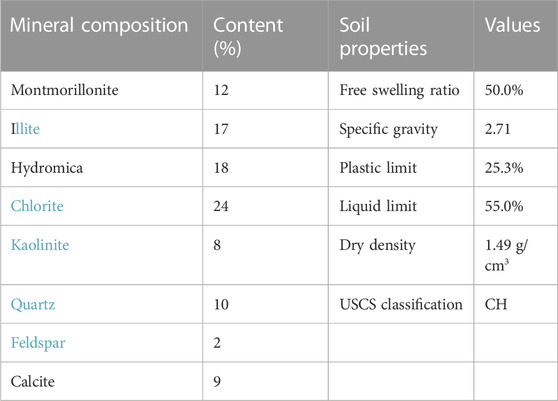
TABLE 1. Mineral composition and physical properties of the clay.
2.3 Specimen preparation
The natural soil retrieved from the field was oven-dried, crushed and sieved in the laboratory. The soil powder was homogeneously mixed with water to reach an initial water content of 20%, and then a soil square mold with an internal size of 400 mm in both the length and width and 200 mm in height was made for specimen preparation in this study. The soil mold was placed in a special Plexiglas mold and then sealed in an air-proof plastic bag for 72 h to allow a uniform distribution of moisture within the soil in the underground room at a temperature of 20 °C. The test electrodes with a length of 17.0 mm and a diameter of 1.5 mm were fabricated by plating platinum black. The part of the electrode embedded in the soil is approximately 2 mm, which is much less than the value of the soil sickness to minimize the influence of the electrode size on the measurement resistance Rf. To reduce the disturbance of the electrode arrangement on the measurement resistance Rf, the current electrodes and the test electrodes are located on the same measurement points. The electrodes were symmetrically arranged perpendicular to the crack development plane.
2.4 Experimental method
The integrated experimental setup used in this study consists of a specially designed sample mold and three monitoring systems, as shown in Figure 2: an electrical resistance acquisition (ERA) system (electrical resistance measuring equipment (EMA) and connective electrodes), a temperature and relative humidity (RH) monitoring (T/RHM) system (TES-1370, with an accuracy of±0.1°C for temperature and ±3% for RH) and a data analysis (DA) system (monitoring system). The details of the equipment are shown in Figure 2. The electrical resistance measuring equipment has the function of power supply, control, transmission, storage and display. Meanwhile, the integrated experimental equipment could be used in the engineering field because of the use of anti-interference means such as configuration of the stabilized filter chip. The T/RHM system was installed close to the soil sample to monitor the variations in ambient temperature and relative humidity (RH) during the test. All data and images were automatically recorded and displayed by a computer connected to these systems. The DA system was employed to postprocess the data and draw the initial data curve.
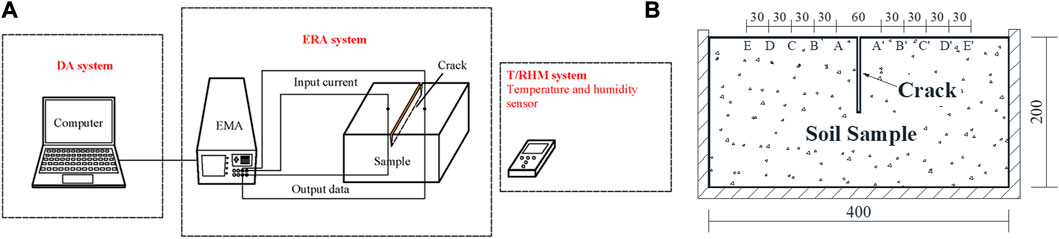
FIGURE 2. (A) Schematic diagram of the experimental setup, including the soil samples, ERA system, T/RHM system and DA system; (B) Schematic view of the experimental mold (unit: mm).
In the experiments, seven different crack depth D values and five pairs of measuring points were designed to study the variation rules of the logarithm of the resistance ratio Nr values when the crack developed along the depth direction at each electrode distance d and the influence of electrode distance d change on soil resistance measurement Rf at each crack depth D. During the experimental procedure, the development of the crack was simulated by cutting the crack in the center of the sample with a soil adjusting knife. To restore the whole crack development process as much as possible, the crack development depth D values were selected as 0 cm, 2 cm, 3 cm, 4 cm, 6 cm, 8 cm and 10 cm. By changing the position of the measuring points, the electrode distance d was changed to simulate different electrode placement positions. The electrode distance d values were 6 cm (AA’), 12 cm (BB’), 18 cm (CC’), 24 cm (DD’) and 36 cm (EE’). The arrangement of the measuring points is shown in Figure 2B.
The soil particles and water in the soil are both polarizable materials. During the experimental procedure, the resistance measurement file of the multimeter was employed to discover the variation rules of the resistance measurement Rf value of different soils with time under the circumstances of direct current regulated voltage (DC regulated voltage) and alternating current constant current (AC constant current), which is shown in Figure 3. The soil resistance measurement Rf values exhibited irregular changes under DC regulated power supply mode, while the values were relatively stable over time under AC constant current power supply mode. To ensure the repeatability of the experiments, the AC constant current power supply mode was adopted. Although the measurement resistance Rf values tested by this method tended to be influenced by the soil capacitance and inductive impedance, the results were relatively stable and had little effect on the analysis of the measurement resistance Rf under the development of the soil crack.
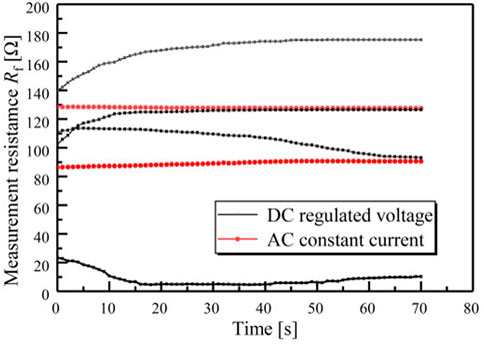
FIGURE 3. Changes in soil resistance Rf values with time.
After selection of the power supply, the test electrode pair was arranged at the AA’ measurement point to test the resistance Rf value of the soil with no crack. During the experimental procedure, a soil knife was used to cut a crack running through the soil, the depth of which was 2 cm. Then, the location of the electrode pair was changed from BB testing points to EE testing points to obtain the measurement resistance Rf values under different electrode distances d when the crack depth D was 2 cm. A soil knife was employed to change the crack depth D to test the measurement resistance Rf values under the circumstances of every crack depth D and five groups of electrode distances d.
2.5 Results and discussion
During the experimental procedure, the measurement resistance Rf values of different crack development depths D and different measurement points were recorded by the DA system. The curve of the logarithm of the resistance ratio Nr and crack depth D and the curve of measurement resistance Rf values and electrode distances d are drawn in accordance with data from the experiments. The experimental results are shown in Table 2, and the curves are presented in Figure 4.
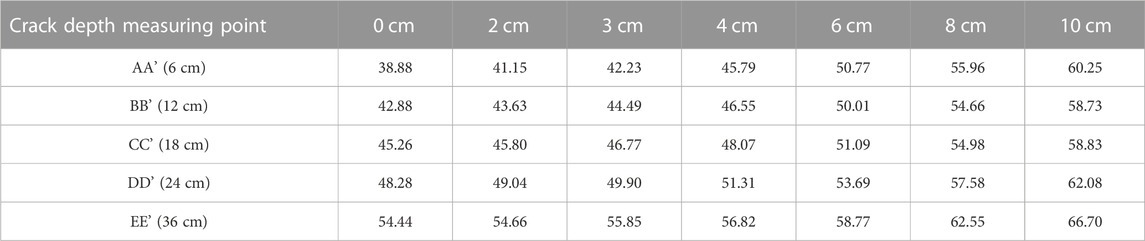
TABLE 2. Record sheet of measurement resistance Rf values (Ω).
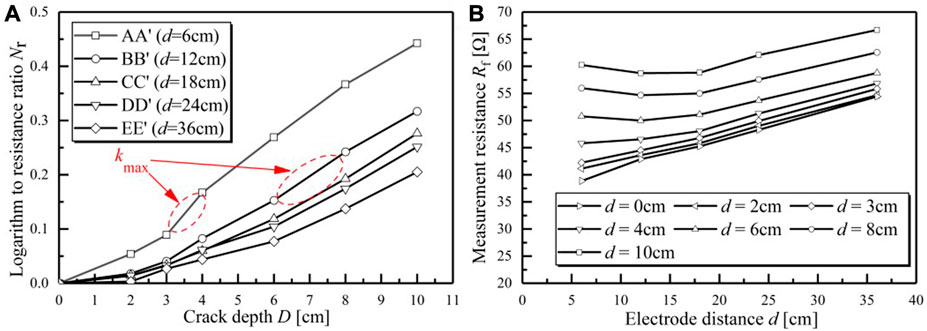
FIGURE 4. (A) Variation in Nr values with changes in crack depth D; (B) Variation of measurement resistance Rf values with changes in the electrode distance d.
It is known from the variation of Nr values with changes of crack depth D (Figure 4A) that the development of the crack results in partial partition of the soil. Due to the high resistance of air, the resistance of partial soil surges and the measurement resistance values present a noticeable change. The resistance of soil with a single crack increases as the crack develops along the depth direction. Moreover, according to the variation amplitude of the curve in Figure 4A, it is demonstrated that the curves of AA’ and BB’ are in the shape of an S overall, and the variation amplitude of Nr values rises and then slows with crack development along the depth direction. When the crack depth D is approximately half of the electrode distance d, the corresponding variation amplitude of the AA’ and BB’ curves reaches the maximum. In detail, the corresponding variation amplitude of the AA’ and BB’ curves reaches the maximum (kmax) when the crack depth is approximately 3–4 cm for the AA’ curve and the crack is in the depth range of 6–8 cm for the BB’ curve. The curves of CC’, DD’ and EE’ show an upward trend, and there is a growing increase in the variation amplitude.
Figure 4B illustrates the variation in the resistance Rf values with changes in the electrode distance d. It is demonstrated that the soil resistance increases constantly as the crack develops along the depth direction. There is a linear relationship between the electrode distance d and the measurement resistance Rf values with no crack. When the crack develops, the curves are in the shape of a U overall. Each curve has the lowest point where each Rmin value corresponds to a specific d value.
This phenomenon is due to the existence of an inhomogeneous medium, which results in distortion of the electric field. The specific degree of distortion impact depends on the influence range of the electric field. The current between electrode pairs is conducted through the soil. When the crack impedes current conduction between electric pairs, the measurement resistance Rf values of the electric pair decrease. The measurement resistance Rf values of the electric pair would not be affected if there is no block of the crack. It could be speculated that the Nr value depends on the morphological characteristics of the crack. There exists a regular variation in the Nr value with the crack developing along the depth direction. Meanwhile, there is an underlying regulation of the electrode distance d corresponding to the Rmin value in each Rf-d curve. The quantitative relationship is further explored by numerical simulation.
3 Numerical simulations
3.1 Numerical models and boundary conditions
There are inherent drawbacks for laboratory tests in regard to the influence of the crack width W, crack depth D, crack length L and complex crack conditions on the measurement resistance Rf values. Owing to the limitation of the model sample size and discontinuity of the crack depth D values in laboratory tests, it is difficult to explore the specific crack depth D value when the slope of the Nr-D curve reaches the peak and the specific electrode distance d corresponding to the Rmin value in the Rf-d curve. To further study the quantitative relation and probe into the possibility of crack depth D inversion, numerical analysis is conducted below.
The influence range of the electric field is spherical and has the obvious characteristic of symmetry. For the primary crack at the site, more than one pair of electrodes is arranged from end to end of the surface crack to portray a general view of the crack underground, owing to the effective range of the electric field. Therefore, the two-dimensional profile with crack width W and crack depth D is taken to conduct further study.
The two-dimensional finite element model of soil with a single crack is established by the software COMSOL Multiphysics, and the interface of static electricity is conducted to perform the numerical calculation.
Because the actual geological conditions of simulated soil with a single crack are complicated, appropriate assumptions are made according to geological conditions to ensure the reliability of numerical analysis: (a) The simulated soil area is a semi-infinite space. (b) Soil is a continuous homogeneous medium, and the physical parameters of the soil are regarded as constants. The change in the electric field has no effect on the physical properties of the soil. (c) In the process of crack development, the soil does not deform in any direction.
The calculation region of the two-dimensional finite element model of soil with a single crack is 200 m × 100 m. The power supply electrodes and the measuring electrodes are arranged at the same measuring point. The pair of electrodes contains a constant current input source and a constant current output source. The surface current density is set to ±0.1 C/m2. The crack resistivity is 100,000 Ω m, and the soil resistivity is 100 Ω m. The Earth surface is set as an insulation boundary and the ground boundaries along with the infinite ground to the Earth.
The calculation must meet the following conditions.
Constant current equation:
Constitutive relation for linear materials:
Electric potential equation:
Combining Eqs 3 and 4, 5 and 6, the following can be obtained:
Electrostatic quasi-static equation:
In the equations,
The regular patterns of influence on the electric field of soil containing a single crack considering the crack width W, crack depth D and the complex crack conditions are discussed as follows. The study is carried out from qualitative and quantitative angles, i.e., qualitatively observing the electric field distribution under the development of the crack and quantitatively exploring the change in the Nr value under the development of the crack and the Rf value with different electrode distances d under the same crack depth.
3.2 Crack width W
Considering the practical crack conditions, the study explores the changes in Nr values when the crack width W ranges from 0.001 m to 0.5 m at different crack depth D values. The profile of the geoelectric model of soil with a single crack is obtained to carry out analysis of the numerical simulation results under the change in W.
The equipotential surface schematic views of planforms with the change in the crack width W are shown in Figure 5. According to the electric field distribution diagrams (Figure 5), the change in the crack width W has no obvious influence on the electric field distribution when the W value changes from 0.001 m to 0.1 m.
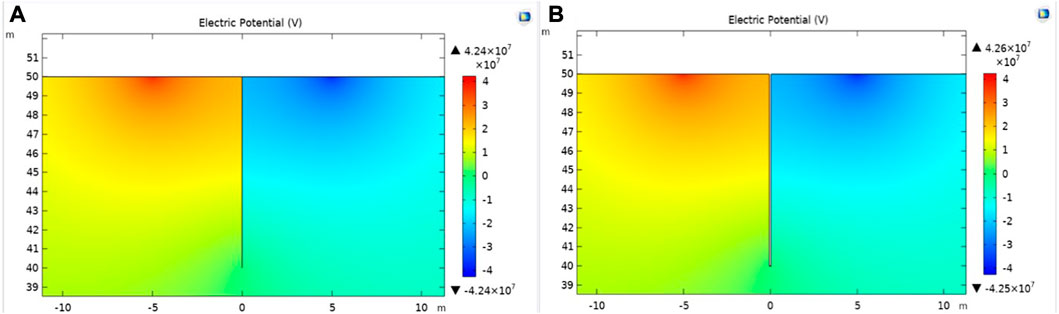
FIGURE 5. Electric potential iso-surface schematic views with changes in the crack width (D=10 m): (A) W = 0.001 m; (B) W = 0.1 m.
Taking crack depths of 0.1 m, 1 m, and 10 m as examples, the soil electrical parameters could be adopted with the change in the crack width W ranging from 0.001 m to 0.5. Based on the soil electrical parameters, the quantitative relationship of the logarithm of the resistance ratio Nr and the crack width W will be explored.
Figure 6 shows the Nr-W curve with the change in the crack depth D. The Nr value has a remarkable increase with the crack developing along the crack depth direction. Compared to the change in the Nr value caused by the crack developing along the depth direction, the Nr value barely changes with the crack developing along the width direction. Based on the basic theory of electric fields, it is speculated that the trend of the crack width is consistent with the trend of the electric field lines, which are unable to impede the conduction of current between two electrodes. In the following calculation and analysis, the crack width W is set to 0.05 m.
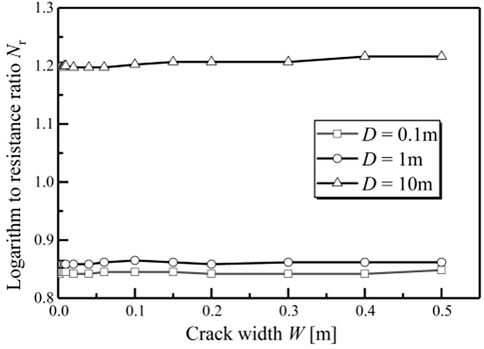
FIGURE 6. Nr-W curve with the change in the crack depth D.
3.3 Crack depth D
Keeping the crack width constant at W=0.05 m, the profiles of soil with a single crack are obtained to conduct an analysis of two-dimensional numerical simulation with the change in the crack depth D.
Figure 7 demonstrates the equipotential surface schematic views with changes in the crack depth D. The electric field distribution diagrams above illustrate the regulations that with regard to the semi-infinite uniform layer, current is transmitted homogeneously through the soil when the crack is not developed (a). When the crack develops from the ground along the crack depth direction and the depth of the crack is shallow, the distribution of the electric field in the soil changes slightly (b). When the crack depth D exceeds the electrode distance d, the electric field distribution generates obvious distortion, and the field presents an overt distribution along the crack depth direction at the crack location, owing to the impediment of current transfer by the crack (c and d).
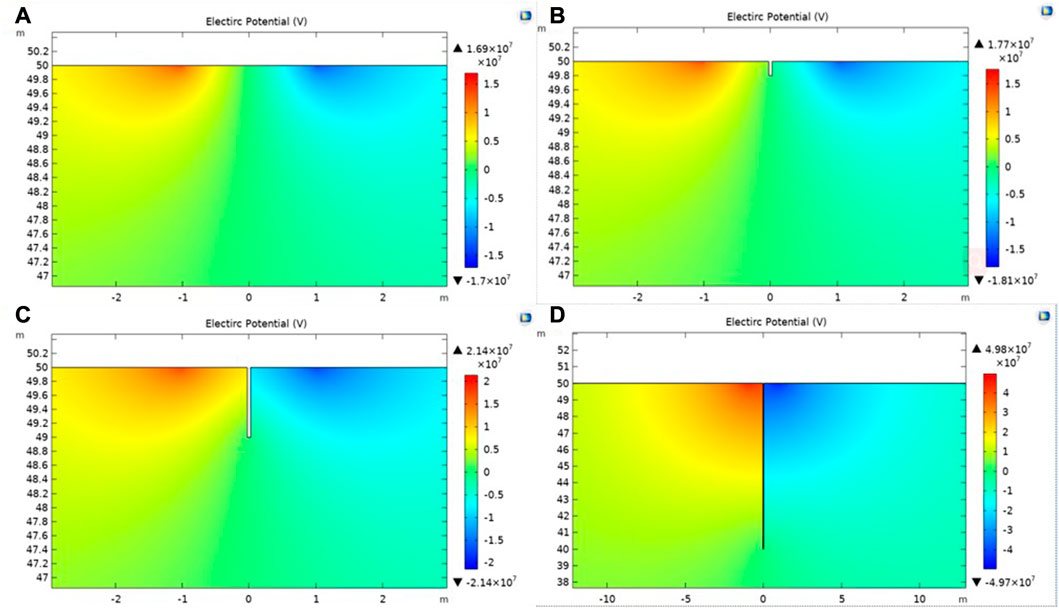
FIGURE 7. Electric potential iso-surface schematic views with changes in the crack depth D (d=2 m): (A) D= 0 m; (B) D= 0.2 m; (C) D = 2 m; (D) D = 10 m.
From a quantitative perspective, the study is divided into two aspects: the ascending trend of the Nr value with the development of the crack and the effect of different electrode distances d on the Rf value at the same crack depth D. In regard to the study of Nr values, the electrode distances d are set to constant values. To facilitate the analysis and comparison of data, the study defines a parameter crack depth ratio Dr, which means the crack depth D is divided by the electrode distance d. In the process of numerical simulation, the test electrode pair is symmetrically distributed almost perpendicular to the crack. The electrode distance d values are set to 1 m, 2 m, 3 m, 4 m, and 5 m. The Dr values range from 0 to 10, and the crack width W is set to 0.05 m. The Nr-Dr curve is drawn to explore the dynamic variation regulations.
The crack width W value is set to 0.05 m, and the crack depth D values are set to 1 m, 2 m, 3 m, 4 m, and 5 m. The test electrode pair is symmetrically distributed almost perpendicular to the crack, and the electrode distance d values range from 0.1 m to 10 m. The curve of Rf-d is drawn to explore the quantitative relation of the parameters D and d.
It is demonstrated that the Nr-Dr curve of the crack is in the shape of an S overall (Figure 8). The slope of the curve is defined as k, and the value of k shows an increasing and decreasing trend. The change in the curve manifests obvious periodic characteristics. In the first period, when the depth of the developing crack is shallow, the increase in the amplitude of the Nr value is relatively slow, and the k value is small. In the second period, the increase amplitude of the Nr value is great. There exists an explosion for the k value, which reaches the peak when Dr is approximately equal to 0.5. In the third period, when Dr surpasses 1, the Nr value does not grow substantially and only increases slightly. The k value begins to wane.
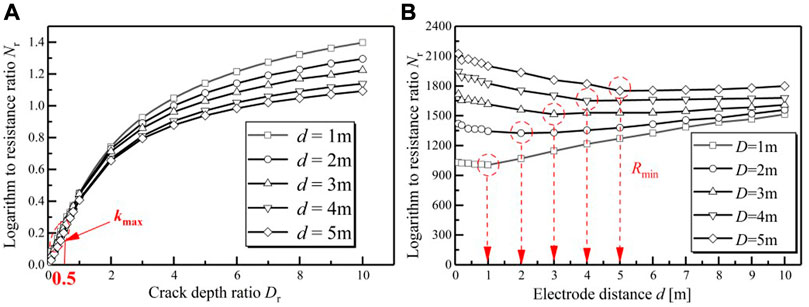
FIGURE 8. (A) Nr- Dr curve with changes in the electrode distance d; (B) Rf-d curve with changes in the crack depth D.
Figure 8 demonstrates that the Rf-d curve is in the shape of a U. The value of the resistance value of the soil with the single crack Rf starts from the maximum value and gradually decreases to the minimum value Rmin. Subsequently, the Rf value presents the tendency of a moderate increase. Thus, for estimating the unknown crack depth D, the operators could change the value d in the vicinity of the crack to measure the relative change in the Rf value. The variation curve Rf-d is drawn to determine the value d corresponding to the Rmin value. At this point, the crack depth D is approximately equal to the electrode distance d, that is, D ≈ d.
The findings could be drawn as a new method, i.e., the electrical resistance method, which could be employed to conduct crack depth measurements in engineering projects. Regarding the primary crack, electrode pairs are arranged from end to end of the surface crack in accordance with the measurement points. Rf-d curves could be drawn by changing the electrode distance d values. The crack depth D value in each measurement point pair is approximately equal to the electrode distance d corresponding to Rmin. Combining every crack depth D value could obtain the general view of the underground crack by this method. However, the method requires the electrode pair to be symmetrically distributed perpendicular to the crack. which is difficult to realize in situ. Therefore, the influence of asymmetry measurements on the results is studied below.
3.4 Complex crack conditions
Symmetry electrodes and the ideal crack location are quite hard to realize in actual measurements, so it is of great necessity to analyze the influence of asymmetry measurements on the results of the soil resistance test and the crack depth measurement method. The profile of a two-dimensional finite element model of soil with a single crack is carried out to conduct the study. The study considers the conditions, including the relocation, the offset and the rotation of the crack, and changes in the relative position to explore the electric field change rule of soil with a single crack model (Figures 9, 12, 13).
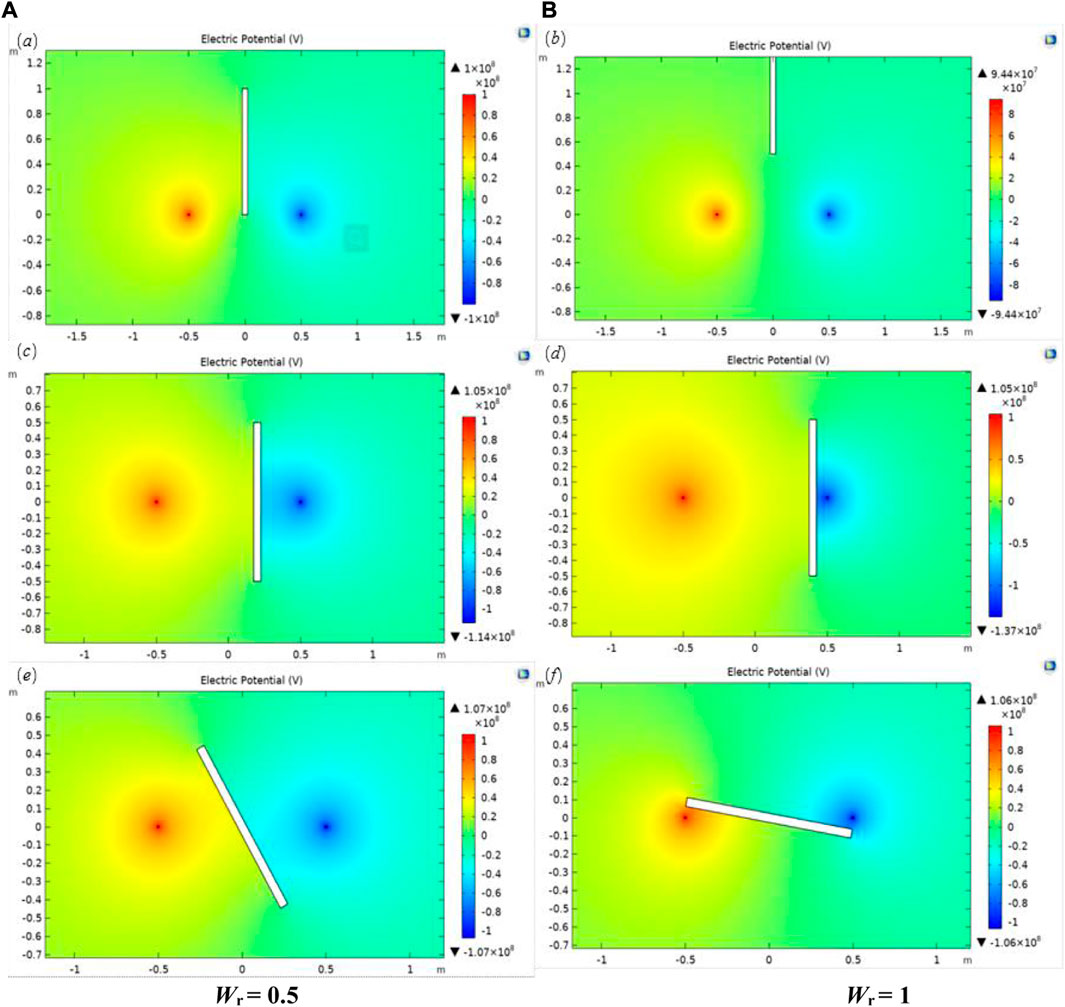
FIGURE 9. Electric potential iso-surface schematic view with changes in the relocation, offset and rotation of the crack: (A) Pr = 0.2; (B) Pr = 0.4; (C) Wr = 0.5; (D) Wr = 1; (E) θ = 30°; (F) θ = 80°.
The crack depth D is set to 1 m, the crack width W is set to 0.05 m and the electrode distance d is set to 1 m. To represent the relative position relationship of the crack, the parameters of the relocation distance ratio of the crack Wr, the offset distance ratio of the crack Pr and the rotation angle of the crack θ are defined. The Wr value stands for the ratio of the crack outward displacements along the crack length direction to the crack depth D. The Pr value means the ratio of the crack offset displacements between the electrode pair to the electrode distance d. When deliberating θ, it is stipulated that the rotation angle of the crack perpendicular to the electrode line is 0° and 0°≤θ≤90°.
The Wr value ranges from 0 to 5, which means that the crack outward displacements along the crack length direction range from 0 m to 5 m. The Nr-Wr curve is drawn in the process of crack out-shift. The Pr value ranges from −0.4 to 0.4, which means that the crack offset displacements between the electrode pair range from −0.4 m to 0.4 m. The Nr-Pr curve is drawn in the process of crack offset. In the study process, the rotation angle of the crack perpendicular to the electrode line is 0°, and the θ value ranges from 0° to 90°. The Nr-θ curve is drawn in the process of crack rotation. To make a comparison, one Nr-Dr curve is set as the standard situation.
In terms of the Nr-Wr curve (Figure 10), the Nr value continues to decrease as Wr changes from 0 to 5. When Wr is equal to 0.5, the Nr value is half of that of the crack in the middle of the electrodes (the standard situation in Figure 10). According to the Nr-Pr curve (Figure 10), the curve presents a downward trend, but compared to the increase in the Nr value caused by crack development along the crack depth, the curve declines slowly in Figure 10. In other words, in the actual measurement process, there is some asymmetry when the electrodes are embedded, which has little influence on the measurement results. In light of the Nr-θ curve, the curve shows an upward trend, but compared to the increase in the Nr value caused by crack development along the crack depth (the standard situation in Figure 10), the curve rises slowly in Figure 10. In particular, when θ is less than or equal to 40°, the Nr value barely changes.
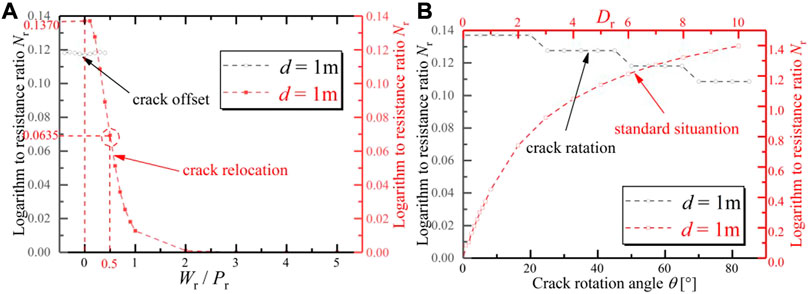
FIGURE 10. (A) Nr-Wr curve and Nr-Pr; (B) Nr-θ curve.
In the actual measurement process, the electrodes have some asymmetry with the crack when buried, which has little influence on the measurement results. When the crack exists within the influence range of the electric field, it could impede current conduction between electrodes, but the measurement results have little correlation with the specific position of the crack in the electric field.
4 Practical engineering
4.1 Engineering situation
An expansive soil slope in Jiangsu Province in China is typical of slope instability in landscape areas. The landslide still creeped when it rained. Obvious landslide features such as crack phenomenon, collapse, and hump emerge in the landscape area. Different types of cracks appear in the upper part, both sides and the lower part of the landslide. Under the influence of rain, the landslide continued from time to time, posing a serious threat to traffic and life safety. The landslide has a maximum elevation of 27.0 m at the back edge and 10.0 m at the front edge with a slope of 11°. Generally, the slope is relatively slow.
The physical and geological phenomena of landslides are relatively well developed, including cracks and collapses. The width of the cracks is between 5 cm and 15 cm. The depth is approximately 2.0 m, and shallow cracks are approximately 0.5 m. The wider cracks are mostly oriented in the east‒west direction and mostly arcuate. There are three main cracks on both sides of the landslide body, which are often accompanied by small feather-like cracks parallel to the sliding direction. The lower part of the landslide is obviously swollen, forming a typical slide tongue of the landslide. The main crack of the landslide is taken as an example to conduct crack depth measurements by means of the soil resistance method.
4.2 Measurement procedure
For the measurement of the depth of the main crack in expansive soil, 13 measurement sections, i.e., #0–12, were selected along the vertical direction of the crack (Figure 11). The sections were not parallel and were approximately 1 m apart. A metal rod was used as the measuring electrode. The metal rod was inserted into the soil up to 10 cm to ensure good contact with the soil and no shaking of the metal rod. The electrode layout was perpendicular to the fracture profile and symmetrically distributed along the crack. The electrode distance d ranged from 1 m to 11 m. Data were recorded and analyzed by the DA system. It must be guaranteed that there was no rain during the measurement procedure, which began 1 week after rain. During the process of water absorption and loss of the expansive soil slope, the expansion and contraction cracks developed and closed along the depth direction.
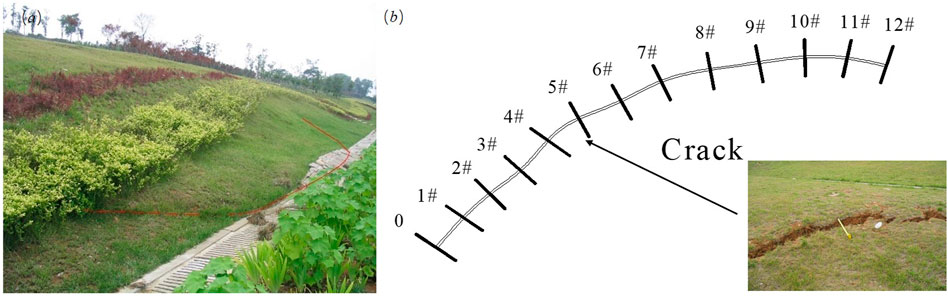
FIGURE 11. (A) Expansive slope landslide; (B) Survey profile diagram.
4.3 Results
The central profile (#6) was selected for analysis, and the curves of resistance measurement Rf and electrode distance d on the second day after rain, the third day after rain and 1 week after rain were drawn, which were denoted T2, T3 and T7, respectively. The resistance 1 week after rain was measured repeatedly (Figure 12).
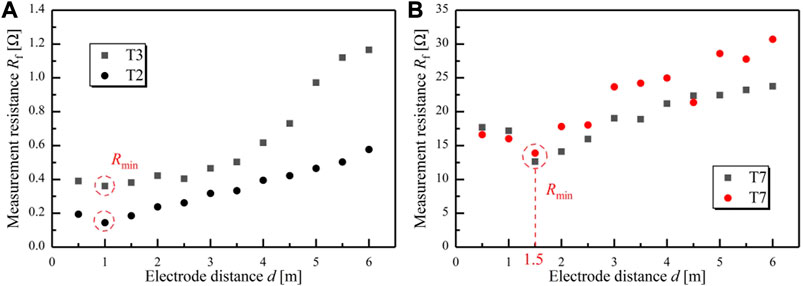
FIGURE 12. (A) Diagram of measurement resistance Rf after rainfall; (B) Measurement resistance Rf after a week without rain.
The data showed (Figure 12) that as time progressed, the soil cracks developed along the depth direction due to the drying shrinkage, resulting in an increase in the resistance measured between electrodes. The electrode distance d values corresponding to the lowest point of the T1, T2 and T7 curves are approximately 1 m, 1 m and 1.5 m, respectively. According to the above rules of crack depth D and electrode distance d, the crack depths of T1, T2 and T7 are 1 m, 1 m and 1.5 m, respectively. Similarly, 11 profiles were measured on the same day to detect the development depth of fractures at different profiles, and a schematic diagram of the depth and shape of fractures in the longitudinal profile was drawn (Figure 13). To verify the probe results, a test pit survey was conducted, and the results are shown in Figure 13. The crack depth measured by the electric resistance method is consistent with the drilling results.
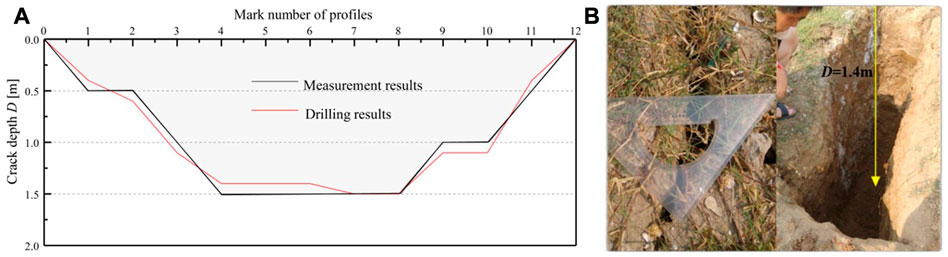
FIGURE 13. (A) Crack depth distribution map; (B) Drilling result of #6.
5 Conclusion
This study explores a new method to conduct crack depth measurements in engineering projects by means of combining laboratory tests and numerical modeling analysis. The following conclusions can be drawn:
(1) The laboratory tests determined that there exists a regular variation in the Nr value with the crack developing along the depth direction. Meanwhile, there is an underlying regulation of the electrode distance d corresponding to the Rmin value in each Rf-d curve.
(2) The numerical modeling analysis further shows that the Nr-Dr curve is in the shape of an S. The slope of the curve reaches the peak when Dr is approximately equal to 0.5. The Rf-d curve is in the shape of a U. The d value corresponding to the minimum value Rmin is approximately equal to the crack depth D. The Nr value barely changes with the change in crack width. In the range of the electric field, the offset and rotation of the crack have little effect, while the measurement results have a strong dependence on relocation movement.
(3) Regarding the primary crack, electrode pairs are arranged from end to end of the surface crack in accordance with the measurement points. Rf-d curves could be drawn by changing the electrode distance d values. The crack depth D value in each measurement point pair is approximately equal to the electrode distance d corresponding to Rmin. By means of this electrical resistance method, a general view of the crack underground could be portrayed. This method was employed to measure the crack depth of an expansive soil slope and verified by comparing the measurement results and drilling results.
In this paper, the quantitative relationship between crack development and electrical parameter changes is confirmed from the point of view of experiments and numerical simulations. However, it should be pointed out that the development and evolution of soil cracks exist in three-dimensional space, so it is inevitable that the geometric parameters of cracks cannot be accurately measured in two-dimensional studies, and there is some deviation from the actual situation. However, for the prevention and control of expansive soil slope engineering, the deviation is within the allowable range. In the future, the application of the electric resistance method in the development of three-dimensional soil cracks will be further explored.
Data availability statement
The raw data supporting the conclusion of this article will be made available by the authors, without undue reservation.
Author contributions
All authors listed have made a substantial, direct, and intellectual contribution to the work and approved it for publication.Conceptualization, JG and LC; methodology, JG, YW and SY; validation, LC; formal analysis, LH; investigation, JG, LH, YW, and YT; resources, LC; data curation, JW and HL; writing-original draft preparation, JG and YW; writing-review and editing, JG; funding acquisition, LC.
Funding
This work was supported by the National Key Research and Development Program (No. 2019YFC1510802), the National Natural Science Foundation of China (Grant No. U2243244), the major science and technology project of the Ministry of Water Resources (SKR-2022072).
Conflict of interest
The authors declare that the research was conducted in the absence of any commercial or financial relationships that could be construed as a potential conflict of interest.
Publisher’s note
All claims expressed in this article are solely those of the authors and do not necessarily represent those of their affiliated organizations, or those of the publisher, the editors and the reviewers. Any product that may be evaluated in this article, or claim that may be made by its manufacturer, is not guaranteed or endorsed by the publisher.
References
Ackerson, J. P., Morgan, C. L. S., Everett, M. E., and McInnes, K. J. (2014). The role of water content in electrical resistivity tomography of a vertisol. Soil Sci. Soc. Am. J. 78, 1552–1562. doi:10.2136/sssaj2014.01.0032
Albrecht, B. A., and Benson, C. H. (2001). Effect of desiccation on compacted natural clays. J. Geotechnical Geoenvironmental Eng. 128 (1), 67–75. doi:10.1061/(asce)1090-0241(2001)127:1(67)
An, N., Tang, C. S., Cheng, Q., Wang, D. Y., and Shi, B. (2019). Application of electrical resistivity method in the characterization of 2d desiccation cracking process of clayey soil. Eng. Geol. 265, 105416. doi:10.1016/j.enggeo.2019.105416
Baer, J. U., Kent, T. F., and Anderson, S. H. (2009). Image analysis and fractal geometry to characterize soil desiccation cracks. Geoderma 154 (1-2), 153–163. doi:10.1016/j.geoderma.2009.10.008
Baram, S., Ronen, Z., Kurtzman, D., Külls, C., and Dahan, O. (2013). Desiccation-crack-induced salinization in deep clay sediment. Hydrology Earth Syst. Sci. 17 (4), 1533–1545. doi:10.5194/hess-17-1533-2013
Cai, Y. J., and Li, L. (2018). “Engineering characteristics of expansive soil in the middle line of south-to-north Water Transfer project and failure mechanism of slope sliding,” in Proceedings of 2018 national annual conference on engineering geology.
Cała, M., Cyran, K., Stopkowicz, A., Kolano, M., and Szczygielski, M. (2016). Preliminary application of X-ray computed tomograph on characterisation of polish gas shale mechanical properties. Rock Mech. Rock Eng. 49, 4935–4943. doi:10.1007/s00603-016-1045-6
Chaduvula, U., Viswanadham, B. V. S., and Kodikara, J. (2017). A study on desiccation cracking behavior of polyester fiber-reinforced expansive clay. Appl. Clay Sci. 142, 163–172. doi:10.1016/j.clay.2017.02.008
Chertkov, V. Y. (2000). Using surface crack spacing to predict crack network geometry in swelling soils. Soil Sci. Soc. Am. J. 64 (6), 1918–1921. doi:10.2136/sssaj2000.6461918x
Costa, S., Kodikara, J., and Shannon, B. (2013). Salient factors controlling desiccation cracking of clay in laboratory experiments. Geotechnique 63 (1), 18–29. doi:10.1680/geot.9.P.105
Dai, A. (2011). Drought under global warming: A review. Wiley Interdiscip. Rev. Clim. Change 2, 45–65. doi:10.1002/wcc.81
Damavandi, K., Abedi, M., Norouzi, G. H., and Mojarab, M. (2022). Geoelectrical modelling of a landslide surface through an unstructured mesh. Bollettino di Geofisica Teorica ed Applicata 63 (2), 337–356. doi:10.4430/bgo00384
Dyer, M. (2005). Performance of flood embankments in England and wales. Water Manag. 157 (4), 177–186. doi:10.1680/wama.2004.157.4.177
Dyer, M., Utili, S., and Zielinski, M. (2009). Field survey of desiccation fissuring of flood embankments. Water Manag. 162 (3), 221–232. doi:10.1680/wama.2009.162.3.221
Fma, A., Meng, H., Mn, C., Ka, C., Ay, D., and Aa, E. (2022). Utilizing nwcr optimized arrays for 2d ert survey to identify subsurface structures at penang island, Malaysia. J. Appl. Geophys. 196, 104518. doi:10.1016/j.jappgeo.2021.104518
Gunn, D. A., Chambers, J. E., Uhlemann, S., Wilkinson, P. B., Meldrum, P. I., Dijkstra, T. A., et al. (2015). Moisture monitoring in clay embankments using electrical resistivity tomography. Constr. Build. Mat. 92, 82–94. doi:10.1016/j.conbuildmat.2014.06.007
Hallett, P. D., and Newson, T. A. (2011). Desiccation of a sensitive clay: Application of the model crack: Discussion. Can. Geotechnical J. 35 (6), 1109–1110. doi:10.1139/t99-003
Hewitt, P. J., and Philip, L. K. (1999). Problems of clay desiccation in composite lining systems. Eng. Geol. 53 (2), 107–113. doi:10.1016/S0013-7952(99)00023-X
Hirobe, S., and Oguni, K. (2016). Coupling analysis of pattern formation in desiccation cracks. Comput. Methods Appl. Mech. Eng. 307, 470–488. doi:10.1016/j.cma.2016.04.029
Jones, G., Zielinski, M., and Sentenac, P. (2012). Mapping desiccation fissures using 3-d electrical resistivity tomography. J. Appl. Geophys. 84, 39–51. doi:10.1016/j.jappgeo.2012.06.002
Jones, G., Sentenac, P., and Zielinski, M. (2014). Desiccation cracking detection using 2-D and 3-D electrical resistivity tomography: Validation on a flood embankment. J. Appl. Geophys. 106, 196–211. doi:10.1016/j.jappgeo.2014.04.018
Khandelwal, S., Sanchez, M., and Medina-Cetina, Z. (2013). Effect of depth of desiccation cracks on earth embankments. Geo-Congress, 800–803. doi:10.1061/9780784412787.080
Kim, K. Y., Zhuang, L., Yang, H., Kim, H., and Min, K. B. (2016). Strength anisotropy of berea sandstone: Results of x-ray computed tomography, compression tests, and discrete modeling. Rock Mech. Rock Eng. 49 (4), 1201–1210. doi:10.1007/s00603-015-0820-0
Kodikara, J., and Costa, S. (2013). Desiccation cracking in clayey soils: Mechanisms and modelling. Springer Berlin Heidelberg, 21–32. doi:10.1007/978-3-642-32492-5_2
Kong, L. W., Wang, M., Guo, A. G., and Wang, Y. (2017). Effect of drying environment on engineering properties of an expansive soil and its microstructure. J. Mt. Sci. 14 (06), 1194–1201. doi:10.1007/s11629-017-4430-z
Kong, L. W., Zeng, Z. X., Bai, W., and Wang, M. (2018). Engineering geological properties of weathered swelling mudstones and their effects on the landslides occurrence in the yanji section of the jilin-hunchun high-speed railway. Bull. Eng. Geol. Environ. 77 (77), 1491–1503. doi:10.1007/s10064-017-1096-2
Krisnanto, S., Rahardjo, H., Fredlund, D. G., and Leong, E. C. (2014). Mapping of cracked soils and lateral water flow characteristics through a network of cracks. Eng. Geol. 172, 12–25. doi:10.1016/j.enggeo.2014.01.002
Lakshmikantha, M. R., Prat, P. C., and Ledesma, A. (2012). Experimental evidence of size effect in soil cracking. Can. Geotechnical J. 49 (3), 264–284. doi:10.1139/t11-102
Li, L., Larsen, I., and Holt, R. M. (2015). Laboratory observation and micromechanics-based modelling of sandstone on different scales. Rock Mech. Rock Eng. 48 (4), 1407–1422. doi:10.1007/s00603-014-0642-5
Li, J. H., Lu, Z., Guo, L. B., and Zhang, L. M. (2017). Experimental study on soil-water characteristic curve for silty clay with desiccation cracks. Eng. Geol. 218, 70–76. doi:10.1016/j.enggeo.2017.01.004
Li, H. D., Tang, C. S., Cheng, Q., Li, S. J., Gong, X. P., and Shi, B. (2019). Tensile strength of clayey soil and the strain analysis based on image processing techniques. Eng. Geol. 253, 137–148. doi:10.1016/j.enggeo.2019.03.017
Lozada, C., Caicedo, B., and Thorel, L. (2015). Effects of cracks and desiccation on the bearing capacity of soil deposits. Géotechnique Lett. 5 (3), 112–117. doi:10.1680/jgele.15.00021
Lu, Z. H., Chen, Z. H., and Pu, Y. B. (2002). A CT study on the cracks evolution. Rock Soil Mech. 23 (4), 417–422. doi:10.3969/j.issn.1000-7598.2002.04.005
Morris, P. H., Graham, J., and Williams, D. J. (1992). Cracking in drying soils. Can. Geotechnical J. 29 (2), 263–277. doi:10.1139/t92-030
Neyamadpour, A. (2018). Detection of subsurface cracking depth using electrical resistivity tomography: A case study in masjed-soleiman, Iran. Constr. Build. Mater. 191, 1103–1108. doi:10.1016/j.conbuildmat.2018.10.027
Park, Y., You, Y. J., and Kim, H. J. (2009). Electrical resistivity surveys for gold-bearing veins in the yongjang mine, Korea. J. Geophys. Eng. 6 (1), 73–81. doi:10.1088/1742-2132/6/1/008
Pidlisecky, A., Haber, E., and Knight, R. (2007). Resinvm3d: A 3d resistivity inversion package. Geophysics 72 (2), 1–10. doi:10.1190/1.2402499
Pouya, A., Vo, T. D., Hemmati, S., and Tang, A. M. (2018). Modeling soil desiccation cracking by analytical and numerical approaches. Int. J. Numer. Anal. Methods Geomechanics 43 (3), 738–763. doi:10.1002/nag.2887
Ramana, K. V. (1993). Expansive soils: Problems and practice in foundation and pavement engineering. Eng. Geol. 35, 136–138. doi:10.1016/0013-7952(93)90076-o
Rayhani, M. H., Yanful, E. K., and Fakher, A. (2007). Desiccation-induced cracking and its effect on the hydraulic conductivity of clayey soils from Iran. Can. Geotechnical J. 44 (3), 276–283. doi:10.1139/t06-125
Ruan, L., Luo, R., Wang, B., and Yu, X. H. (2021). Morphological characteristics of crack branching in asphalt mixtures under compression. Eng. Fract. Mech. 253, 107884. doi:10.1016/j.engfracmech.2021.107884
Samouëlian, A., Cousin, I., Richard, G., Tabbagh, A., and Bruand, A. (2003). Electrical resistivity imaging for detecting soil cracking at the centimetric scale. Soil Sci. Soc. Am. J. 67 (5), 1319–1326. doi:10.2136/sssaj2003.1319
Samouëlian, A., Richard, G., Cousin, I., Guérin, R., Bruand, A., and Tabbagh, A. (2004). Three-dimensional crack monitoring by electrical resistivity measurement. Eur. J. Soil Sci. 55, 751–762. doi:10.1111/j.1365-2389.2004.00632.x
Shin, H., and Santamarina, J. C. (2011). Desiccation cracks in saturated fine-grained soils: Particle-level phenomena and effective-stress analysis. Géotechnique 61 (11), 961–972. doi:10.1680/geot.8.p.012
Stewart, R. D., Majdi, R., Najm, A., David, E., and Selker, J. S. (2012). Measurement tool for dynamics of soil cracks. Vadose Zone J. 11 (2). doi:10.2136/vzj2011.0048
Sultan, S. A., Santos, F. A. M., and Helal, A. (2006). A study of the groundwater seepage at hibis temple using geoelectrical data, kharga oasis, Egypt. Near Surf. Geophys. 4 (6), 347–354. doi:10.3997/1873-0604.2006008
Sungkono, S., Husein, A., Prasetyo, H., Bahri, A. S., and Santosa, B. J. (2014). The vlf-em imaging of potential collapse on the lusi embankment. J. Appl. Geophys. 109, 218–232. doi:10.1016/j.jappgeo.2014.08.004
Tabbagh, J., Samouëlian, A., Tabbagh, A., and Cousin, I. (2007). Numerical modelling of direct current electrical resistivity for the characterisation of cracks in soils. J. Appl. Geophys. 62 (4), 313–323. doi:10.1016/j.jappgeo.2007.01.004
Taghavi, M., Dovoudi, M. H., Amiri-Tokaldany, E., and Darby, S. E. (2010). An analytical method to estimate failure plane angle and tension crack depth for use in riverbank stability analyses. Geomorphology 123 (1-2), 74–83. doi:10.1016/j.geomorph.2010.06.017
Tang, C. S., Wang, D. Y., Zhu, C., Zhou, Q. Y., Xu, S. K., and Shi, B. (2018). Characterizing drying-induced clayey soil desiccation cracking process using electrical resistivity method. Appl. Clay Sci. 152, 101–112. doi:10.1016/j.clay.2017.11.001
Tollenaar, R. N., Paassen, L., and Jommi, C. (2017). Observations on the desiccation and cracking of clay layers. Eng. Geol. 230, 23–31. doi:10.1016/j.enggeo.2017.08.022
Trabelsi, H., Hadrich, B., and Guiras, H. (2018). Evaporation, shrinkage and intrinsic permeability of unsaturated clayey soil: Analytical modelling versus experimental data. Arabian J. Geosciences 11 (8), 184. doi:10.1007/s12517-018-3507-5
Vo, T. D., Pouya, A., Hemmati, S., and Tang, A. M. (2017). Numerical modelling of desiccation cracking of clayey soil using a cohesive fracture method. Comput. Geotechnics 85, 15–27. doi:10.1016/j.compgeo.2016.12.010
Vo, T. D., Pouya, A., Hemmati, S., and Tang, A. M. (2018). Modelling desiccation crack geometry evolution in clayey soils by analytical and numerical approaches. Can. Geotechnical J. 56 (5), 720–729. doi:10.1139/cgj-2018-0105
Wang, C., Zhang, Z. Y., Liu, Y., and Fan, S. M. (2017). Geometric and fractal analysis of dynamic cracking patterns subjected to wetting-drying cycles. Soil Tillage Res. 170, 1–13. doi:10.1016/j.still.2017.02.005
Wang, L. L., Tang, C. S., Shi, B., Cui, Y. J., Zhang, G. Q., and Hilary, I. (2018). Nucleation and propagation mechanisms of soil desiccation cracks. Eng. Geol. 238, 27–35. doi:10.1016/j.enggeo.2018.03.004
Xie, C., Ni, P., Xu, M., Mei, G., and Zhao, Y. (2020). Combined measure of geometry optimization and vegetation for expansive soil slopes. Comput. Geotechnics 123, 103588. doi:10.1016/j.compgeo.2020.103588
Yang, S. Q., Ranjith, P. G., and Gui, Y. L. (2015). Experimental study of mechanical behavior and X-ray micro CT observations of sandstone under conventional triaxial compression. Geotechnical Test. J. 38 (2), 179–197. doi:10.1520/GTJ20140209
Yin, Z. Z., Yuan, J. P., Wei, J., Cao, X. S., Liu, H. Q., and Xu, B. (2012). Study on the effects of cracks to the stability of expansive soil slope. Chin. J. Geotechnical Eng. 34 (012), 2155–2161. doi:10.3969/j.issn.1008-3383.2014.03.012
Yu, Q. L., Yang, S. Q., Ranjith, P. G., Zhu, W. C., and Yang, T. H. (2016). Numerical modeling of jointed rock under compressive loading using x-ray computerized tomography. Rock Mech. Rock Eng. 49 (3), 877–891. doi:10.1007/s00603-015-0800-4
Yuan, J. P., and Yin, Z. Z. (2004). Quantitative index of fissure and strength characteristics of fissured expansive soils. J. Hydraulic Eng. (6), 108–113. doi:10.3321/j.issn:0559-9350.2004.06.019
Zhang, J. M., Luo, Y., Zhou, Z., Chong, L., Victor, C., and Zhang, Y. F. (2021). Effects of preferential flow induced by desiccation cracks on slope stability. Eng. Geol. 288, 106164. doi:10.1016/j.enggeo.2021.106164
Zhao, Z., and Zhou, X. P. (2020). Establishment of numerical cracking constitutive models using 3d reconstruction and x-ray ct images of geomaterials. Int. J. Mech. Sci. 183 (22), 105814. doi:10.1016/j.ijmecsci.2020.105814
Zhen, S. H., Jin, J. L., Yao, H. L., and Ge, X. R. (2006). Analysis of initial cracking behavior of expansive soil due to evaporation. Rock Soil Mech. 27 (12), 2229–2233. doi:10.3969/j.issn.1000-7598.2006.12.027
Keywords: crack depth, electric resistance method, numerical Simulation, field application, finite element analysis
Citation: Gu J, Chen L, Wan Y, Teng Y, Yan S, Hu L, Wang J and Luo H (2023) Study on the electric resistance method in crack depth measurements. Front. Earth Sci. 11:1082854. doi: 10.3389/feart.2023.1082854
Received: 28 October 2022; Accepted: 13 February 2023;
Published: 24 February 2023.
Edited by:
Lixin Wu, Central South University, ChinaReviewed by:
Wei Shan, Northeast Forestry University, ChinaPengpeng Ni, Sun Yat-sen University, China
Copyright © 2023 Gu, Chen, Wan, Teng, Yan, Hu, Wang and Luo. This is an open-access article distributed under the terms of the Creative Commons Attribution License (CC BY). The use, distribution or reproduction in other forums is permitted, provided the original author(s) and the copyright owner(s) are credited and that the original publication in this journal is cited, in accordance with accepted academic practice. No use, distribution or reproduction is permitted which does not comply with these terms.
*Correspondence: Yu Wan, d3kwMjA5QGhodS5lZHUuY24=