 Baofeng Tian1,2
 Yue-Der Lin
 Haoyu Duan
 Hui Luan
- 1Key Laboratory of Geophysical Exploration Equipment, Ministry of Education (Jilin University), Changchun, China
- 2College of Instrumentation and Electrical Engineering, Jilin University, Changchun, China
- 3Department of Automatic Control Engineering, Feng Chia University, Taichung, Taiwan
Magnetic resonance sounding (MRS) is a geophysical method that can determine groundwater content directly and quantitatively. However, as MRS uses the Earth’s magnetic field as the background field, MRS signals are weak and cannot be shielded. Reliably extracting MRS signals in a strong noise environment is difficult. In this study, a data processing scheme using the adaptive local iterative filtering (ALIF) algorithm is proposed to extract MRS signal envelopes accurately. Based on the uncertainty of the initial amplitude and relaxation time, the decomposition order and mask coefficient of the ALIF algorithm are selected via traversal. Simulation results show that in the case of Gaussian noise and power frequency harmonic noise, the ALIF algorithm can reliably extract the MRS signal envelopes, and the correlation coefficient between the extracted and noiseless envelopes is 0.97. Under various noise types, amplitudes, and relaxation times, the average SNR increases by 30 dB∼42 dB. The ALIF algorithm is also suitable for extracting multi-exponential MRS signal envelopes. A comparative analysis between harmonic modeling cancellation and ensemble empirical mode decomposition shows the superiority of the ALIF algorithm, and the processing of the field data further verifies the effectiveness and practicability of the algorithm.
1 Introduction
Shortage and uneven regional distribution of freshwater resources are global problems. As part of freshwater resources, groundwater is an indispensable and important resource for ensuring human life and production (Pan et al., 2021). In Western China and many mountainous areas, shortage of water resources can seriously restrict economic development. At the same time, with the advancement of industrialization and modernization, geological disasters caused by groundwater, such as ground collapse, landslides, mine water inrush, and tunnel water inflow, emerged (Lin et al., 2020a). Therefore, the high-precision and high-efficiency exploration of groundwater has become a primary issue in the field of water resource research.
As an advanced geophysical method, magnetic resonance sounding (MRS), which is based on the nuclear magnetic resonance phenomenon of hydrogen protons, is used to realize the direct quantitative detection of groundwater (Legchenko and Valla, 2002). Compared with conventional drilling methods, MRS can yield hydrogeological information such as water content, location, and the reservoir medium without damage (Hertrich, 2008). Therefore, in recent years, MRS was widely used in groundwater detection, evaluation, and monitoring and for early warning of potential geological hazards (Qin et al., 2019; Legchenko et al., 2020; Wang et al., 2020). Although MRS has the above advantages, in practical applications, MRS signals are weak and can be detected only at the nanovolt level owing to its use of the Earth’s magnetic field as the background field. Moreover, shielding measures cannot be taken. Random noise, power line harmonics, and occasional spikes in the environment can also affect MRS signals, thereby making the reliable extraction of MRS signals difficult (Larsen and Behroozmand, 2016; Lin et al., 2020b; Grombacher et al., 2021).
To solve the aforementioned problems, the classic processing flow involves the following steps. First, a non-linear energy operator or statistical staking is used to remove the spikes (Dalgaard et al., 2012). Second, the harmonic modeling cancellation (HMC) method based on the principle of least squares is used to remove the power line harmonics (Larsen et al., 2014). Third, the multiple collected data are stacked to suppress the random noise (Jiang et al., 2011). Finally, envelope extraction and the gate integration processing of the stacked data are conducted to invert the underground hydrogeological information (Müller-Petke et al., 2016). Recently, a method based on synchroextracting transform is used to eliminate the harmonics in a strong noise environment and improve the processing efficiency (Jiang et al., 2021). For the special case of co-frequency harmonics (the Larmor frequency is equal to one of the power line harmonics, or the difference is less than 3 Hz), the reference coupling and non-linear fitting methods can be adopted (Liu et al., 2018; Wang et al., 2018). For varying harmonic noise in magnetic resonance sounding signals, A frame-based denoising method is proposed based on multi-channel Wiener filtering in the frequency domain to achieve the removal of noise. (Li et al., 2020a). An approach for intensive sampling sparse reconstruction (ISSR) and kernel regression estimation (KRE) is proposed to suppress random noise (Yao et al., 2019). The statistical method of maximum likelihood estimation (MLE) is used to estimate nuclear magnetic resonance parameters and suppress random noise in MRS (Li et al., 2020b). The use of a modified short-time Fourier transform (MSTFT) method to eliminate MRS random noise when in a high-level noise surrounding (Lin et al., 2021). In view of the peak noise contained in the acquisition signal in practice, a method is proposed to calculate the filtering coefficient by using the transformation coefficient of non-peak noise data and filter the coefficient of data containing peak noise (Diao et al., 2022).
In addition, the use of bi-phase pulse (BPP) method to shorten the dead time of the instrument, thereby reducing the loss of MRS signal, but also to suppress noise (Li et al., 2014; Du et al., 2019). Remote reference coils and denoising method based on adaptive noise cancellation (Dalgaard et al., 2012; Müller-Petke and Costabel, 2014; Zhang et al., 2019) can also be employed to suppress correlation noise in MRS signals. The above data processing methods involve two steps: first, noise is removed or suppressed using various strategies, and second, MRS signal envelopes are extracted. However, the two steps restrict each other and affect the MRS signal extraction accuracy.
Another type of data processing method can be used for MRS signal envelope extraction. Empirical mode decomposition (EMD) and ensemble EMD (EEMD) can directly extract MRS signal envelopes while removing noise (Ghanati et al., 2016, 2014). However, both methods experience the problem of mode aliasing, and satisfactory results can be obtained only when the signal-to-noise ratio (SNR) is high. In addition, REF. (Liu et al., 2019). proposed the use of a sliding window based on spectral analysis to recover complex MRS signal envelopes; however, this method is unsuitable for extracting multi-exponential MRS signal envelopes. At present, most methods for extracting MRS Parameters require prior knowledge of precise Larmor frequency to detect signal envelope, and are susceptible to residual noise after de-noising. Lin et al. (2022) proposed to use the orthopedic regularization Prony method to extract MRS Signals from high-frequency oscillation data, and to retain complete signal information by estimating signal parameters.
Adaptive local iterative filtering (ALIF) is an adaptive signal processing method proposed by Ref. (Cicone et al., 2016). This method adopts the idea of iterative filters (Lin et al., 2009) and constructs a filter function with adaptive characteristics using the basic solution system of the Fokker–Planck (FP) differential equation. Compared with the EMD method (Zhao and Su, 2019; Li et al., 2021), ALIF can obtain more accurate intrinsic mode function (IMF) components and has better capabilities to suppress mode aliasing. Therefore, the use of the ALIF algorithm to process MRS signals is proposed in this study. Moreover, the decomposition order and selection criteria of filter coefficients are analyzed to realize the effective extraction of MRS signal envelopes.
2 Principles and methods
2.1 Principle and characteristics of MRS signals
The basic principle of MRS is to supply an alternating current with a Larmor frequency to a coil laid on the ground to form an alternating magnetic field underground. Hydrogen protons in groundwater are excited, thereby losing their equilibrium state. After a certain period of time, the power supply current is removed, and the hydrogen protons return to their equilibrium state. At the same time, MRS signals are generated and picked up by the coil on the ground for obtaining groundwater distribution information (Behroozmand et al., 2015).
The expression of MRS signals can be represented by the following formula.
where E0 represents the initial amplitude, which is proportional to the water content;
2.2 Principle of ALIF algorithm
The ALIF method is an improvement of the IF method. The basic principle of the IF algorithm is similar to that of the EMD algorithm (Zhou et al., 2019), which obtains IMF components through the screening process (Huang, 1998). However, the IF method uses a sliding operator instead of the EMD envelope mean to solve the problem (Lin et al., 2009).
For a given signal f(x) to be decomposed, the sliding operator Γ(f)(x) is obtained by calculating the convolution with f(x) and the filter function ω(x).
where ω(t) represents the filter function, and ln represents the filter interval, and its calculation formula is as follows:
where N represents the number of sampling points of signal f(x), k represents the number of extreme points of the signal to be decomposed, λ is a scalar parameter,
Next, the wave operator is obtained by subtracting the sliding operator from the signal to be decomposed, as follows:
The specific steps of the IF algorithm are as follows:
Step 1: The filtering interval ln is calculated using Eq. 3.
Step 2: The sliding operator
Step 3: The fluctuation operator
Step 4: The fluctuation operator
Step 5:
Moreover,
In the IF algorithm, the
where
The diffusion effect will occur in
At this time, the equation has a non-zero solution
1) For any
2) For any
This outcome means that the solution set of the equation is on interval
Other filtering steps are the same as those of the IF algorithm. The ALIF algorithm contains two nested loops: an Inner Loop, to compute each single IMF, and an Outer Loop, to derive all the IMFs.
Algorithm 1. ALIF Algorithm IMF=ALIF(f)
IMF={}
while the number of extrema of f ≥2 do
f1 = f
while the stopping criterion is not satisfied do
compute the filter length ln(x) for fn(x)
n = n + 1
end while
IMF=IMF ⋃ {fn}
f = f − fn
end while
IMF=IMF ⋃ {f}
In the process of algorithm implementation, in Ref. (Crank and Nicolson, 1996), the FP equation solution h(x) can be given by a numerical solution. In the case of a = −b, it is a type I linear phase system in the discrete time domain (Oppenheim, 1999).
3 Results and discussion
3.1 Implementation of ALIF algorithm
An MRS signal with an initial amplitude of 100 nV, an lateral relaxation time of 200 ms, a Larmor frequency of 2,325 Hz, and an initial phase of π/4 rad is constructed. Gaussian noise with a noise level (standard deviation) of 100 nV and power frequency harmonics in the 80th order are added to the MRS signal. The fundamental frequency of the power frequency harmonics is in range of
Figure 1 shows the time domain and frequency domain results before and after envelope extraction by the ALIF algorithm as well as the decomposed IMF components. The decomposition order n selected for the experiment is 9, and the mask coefficient λ is 1.4. As shown in Figure 1, the ALIF algorithm realizes the reliable extraction of MRS signal envelopes. The extracted envelope is in good agreement with the noiseless envelope, and the correlation coefficient is 0.97. It can also be seen in Figure 1 that the envelope extraction process realizes the effective removal of noise, and the extracted envelope retains the characteristics of MRS signals.
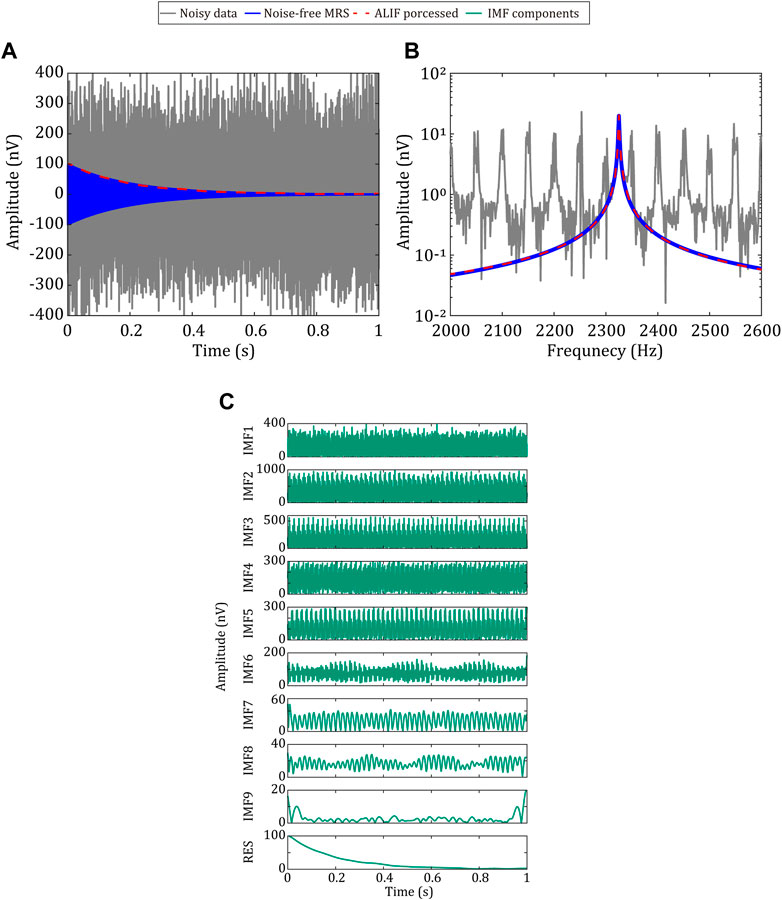
FIGURE 1. Results of MRS signal processing with the ALIF algorithm; (A) and (B) are the time domain diagram and frequency domain diagram, respectively, of the noisy MRS data (gray), noise-free MRS signal (blue), and signal envelope extraction by the ALIF algorithm (red); (C) from top to bottom, nine IMF components and residual signals decomposed by the ALIF algorithm.
In the implementation of the ALIF algorithm, the selected decomposition order n and mask coefficient λ are crucial. To obtain optimal parameters, experimental research on parameter selection is conducted by taking the parameter estimation uncertainty of E0 and
Figure 2 presents the results of the uncertainty of E0 extracted by non-linear fitting when each mask coefficient is matched with different decomposition orders n, and the MRS signal envelope is extracted by the ALIF algorithm. As the mask coefficient changes from small to large, the corresponding optimal decomposition order changes from large to small. Corresponding to different mask coefficients, the matching decomposition order can obtain the small fitting parameter uncertainty of the initial amplitude and relaxation time. In this study, the mask coefficient λ=1.4 and decomposition order n=9 are selected as the optimal ALIF algorithm combination.
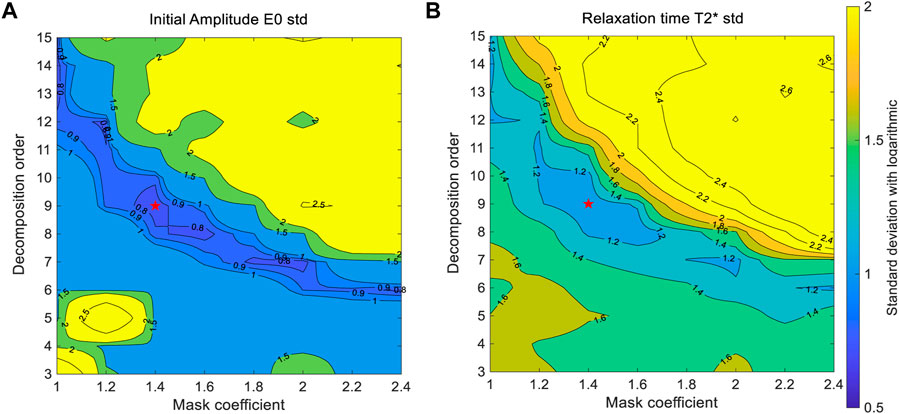
FIGURE 2. Uncertainty of fitting parameters corresponding to different mask coefficients and decomposition orders; (A) uncertainty of initial amplitude; (B) uncertainty of relaxation time; the darker the blue color, the smaller the uncertainty of the processed data.
3.2 Stability analysis of algorithm
To verify the stability of the ALIF algorithm, simulation experiments are conducted under different noise types and noise amplitudes and
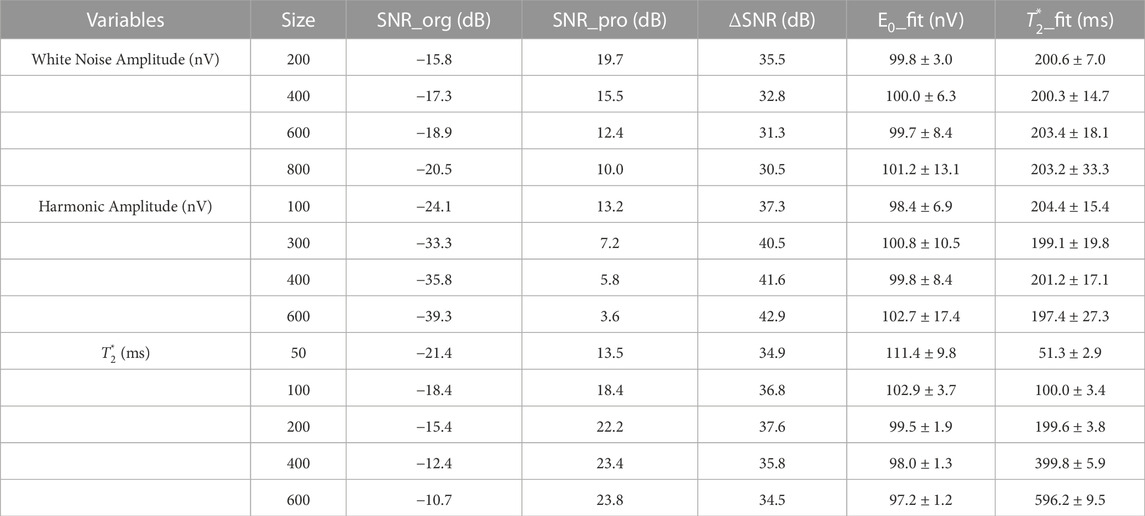
TABLE 1. Processing results of ALIF algorithm under different noise types and noise amplitudes and
Table 1 shows that when the white noise amplitude changes from small to large, the average value of the original SNR gradually decreases. The SNR increases up to 35 dB after processing, but the fitting uncertainty of the initial amplitude and relaxation time also increases gradually. For the power frequency harmonics, when the amplitude changes from small to large, nearly the same variation law as the above random white noise is presented, the SNR increases up to 42 dB after processing. When the white noise amplitude (100 nV) and power frequency noise amplitude (150 nV) remain unchanged and relaxation time
In order to discuss the stability of the algorithm in depth, box plots of the initial amplitude and average relaxation time uncertainties obtained by processing with the ALIF algorithm at different white noise amplitudes, powerline harmonic amplitudes, different
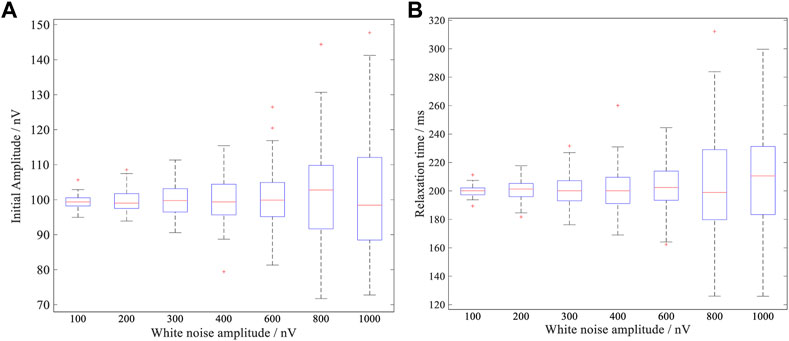
FIGURE 3. The fitting errors of related parameters under different power frequency harmonic amplitudes; (A) Boxplot of initial amplitude fitting values at different power frequency harmonic amplitudes; (B) Boxplot of relaxation time fitting values at different power frequency harmonic amplitude.
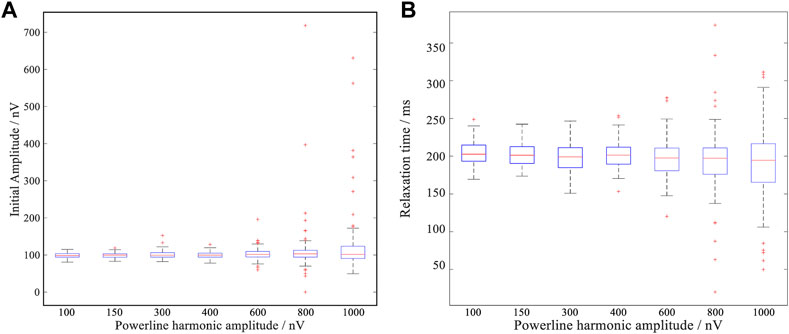
FIGURE 4. The fitting errors of related parameters under different power frequency harmonic amplitudes; (A) Box diagram of initial amplitude fitting values at different power frequency harmonic amplitudes; (B) Box plots of the fitting values of the mean relaxation time at different power frequency harmonic amplitudes.
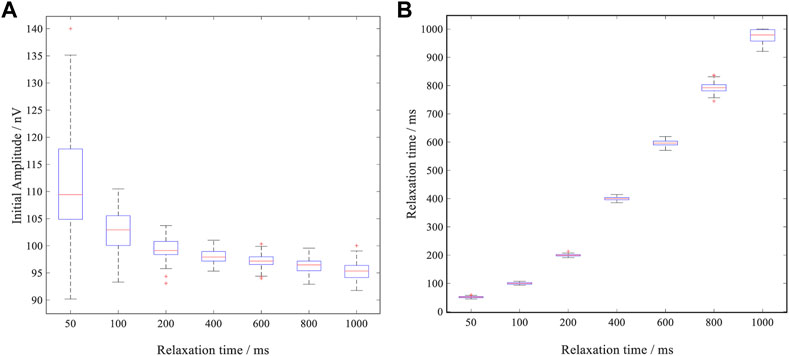
FIGURE 5. The fitting errors of related parameters under different relaxation times; (A) Boxplot of initial amplitude fitting values at different relaxation times; (B) Boxplot of relaxation time fitting values for different relaxation times.
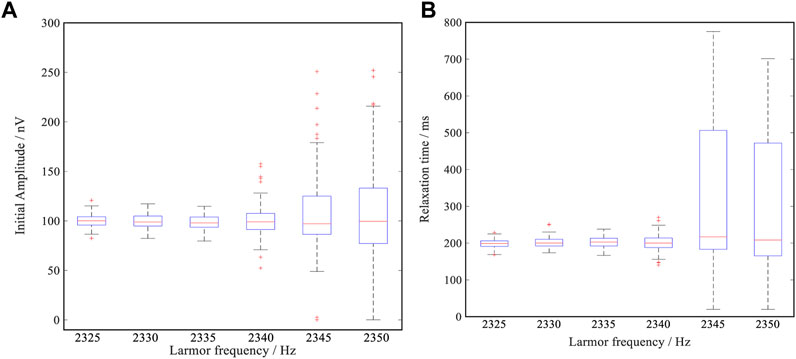
FIGURE 6. The fitting errors of relevant parameters at different Larmor frequencies; (A) Boxplot of initial amplitude fitting values at different Larmor frequencies; (B) Boxplot of fitted relaxation time values at different Larmor frequencies.
As can be seen from Figure 5, when the average relaxation time
When Larmor frequency approaches the frequency of the co-frequency harmonics, that is, when the difference between Larmor frequency and the co-frequency harmonics gradually decreases, it can be seen from Figure 6 that the 25%–75% range frame and the maximum and minimum range of the initial amplitude E0 and relaxation time
The results of the above statistical analysis can give information on the uncertainty of the parameters extracted after processing the MRS signal for the ALIF algorithm with a selected mask factor of 1.4 and decomposition order of 9 under different noise types, noise amplitudes,
3.3 Comparative analysis with other algorithms
To further illustrate the performance of the proposed algorithm, a comparative analysis is conducted between the ALIF algorithm, EEMD algorithm, and HMC. The parameter setting in the experiment is the same as that in Section 3.1. Figure 7 depicts the time domain and frequency domain diagrams of the real part, imaginary part, and mode amplitude of the MRS envelope processed by the three algorithms. The original SNR of the noisy MRS data is −15.1 dB. After processing by the HMC algorithm, the SNR increases by 17.7 dB–2.6 dB. After processing by the ALIF algorithm and EEMD algorithm, the SNR increases to approximately 41 dB. Figure 7 shows that the shape of the extracted envelope after ALIF and EEMD algorithm processing is smooth, and the power frequency harmonics and random noise are successfully removed while extracting the envelope. However, the HMC can remove only the power frequency harmonics and cannot effectively suppress the random white noise. The initial amplitudes obtained via fitting after ALIF and EEMD algorithm processing are 100.2 nV and 98.6 nV, and the relative errors are 0.2% and 1.4%, respectively. The obtained relaxation times are 200.1 ms and 208.0 ms, and the relative errors are 0.1% and 4.0%, respectively. From the data analysis results, it can be seen that the performance of the ALIF algorithm is better than that of the EEMD algorithm. In addition, the EEMD algorithm constantly tries to select some IMF components and residuals to extract the effective envelope information, whereas the ALIF algorithm only needs to combine the residual signals to synthesize the effective MRS signal envelope. Moreover, the ALIF algorithm is more efficient than the EEMD algorithm. A total of 16 data processing groups are taken as an example. For a computer with a 3.4 GHz Intel Core i7 processor and 32 GB of memory, the EEMD algorithm takes approximately 2.8 h, whereas the ALIF algorithm takes only approximately 1.5 min. Based on the above analysis, the ALIF algorithm has more advantages than the EEMD algorithm in extracting MRS signal envelopes.
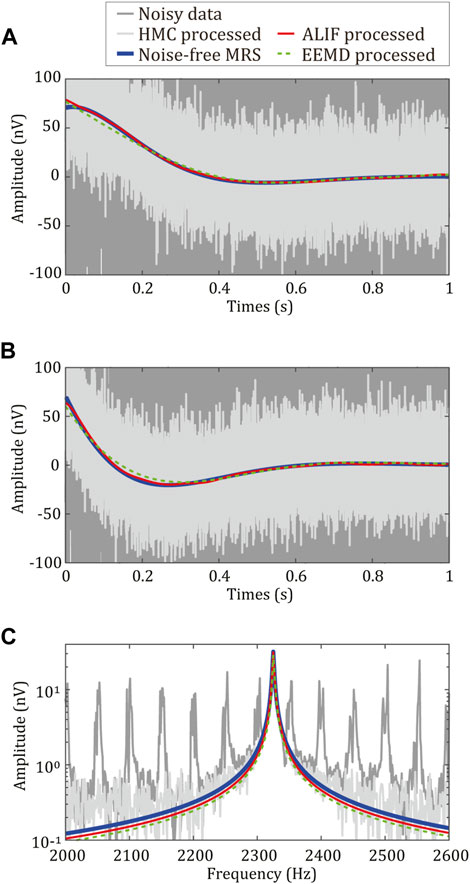
FIGURE 7. Comparison of signal extraction results by ALIF, HMC and EEMD algorithms. (A) ALIF, HMC and EEMD algorithms extract the time-domain image of the real part of the signal; (B) Time domain image extracted by ALIF, HMC and EEMD algorithms; (C) Frequency domain images extracted by ALIF, HMC and EEMD algorithms.
3.4 Multi-exponential MRS signal processing
In actual geological conditions, groundwater typically exists in a water storage medium mixed with a variety of lithologic facies; thus, the MRS signal may need to be modeled in a multi-exponential way. The multi-exponential MRS signal can be expressed as follows:
Eq. 10 is used to construct two groups of multi-exponential MRS signal data. In the first group,
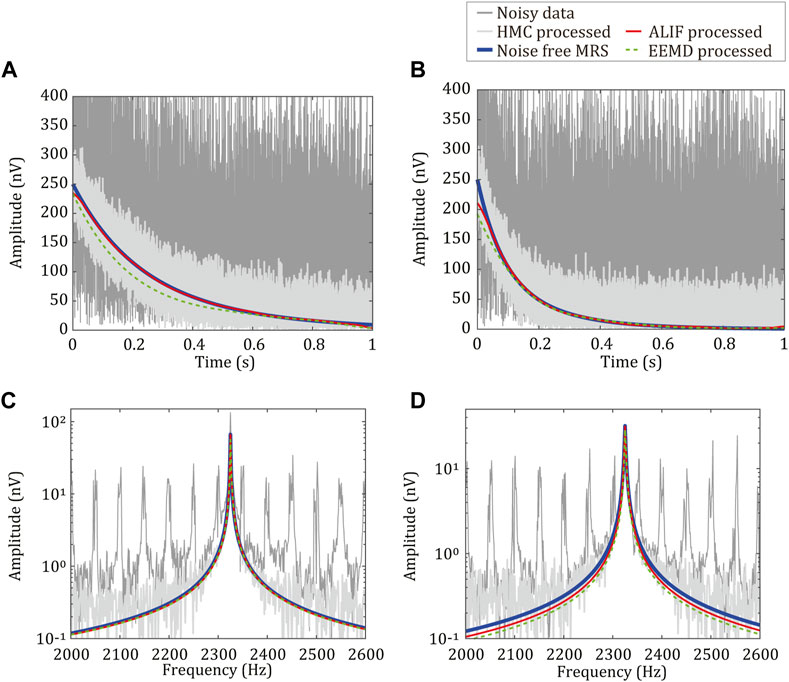
FIGURE 8. Time domain and frequency domain diagrams of multi-exponential noisy MRS datas processed by ALIF algorithm, EEMD algorithm, and HMC. In (A) and (C),
3.5 Processing of field data
The field data experiment is conducted in the Changchun Culture Square. In this experiment, the MRS signal is generated by an arbitrary signal generator, and the JLMRS instrument developed independently by Jilin University is used for the data acquisition. The instrument collects the MRS signal coupled by the receiving coil and complex noise from the environment to form the measured MRS data. The data processed in this experiment are single acquisition data records. Figures 9A, C presents the time domain and frequency domain diagrams of the envelope extracted by the three algorithms (i.e., HMC, EEMD, and ALIF) when the Larmor frequency of the MRS signal is 2,360 Hz and the relaxation time is 200 ms. Figure 9B, D depicts the time domain and frequency domain diagrams of the extracted envelope before and after processing by the three algorithms when the Larmor frequency of the MRS signal is 2,351 Hz and the relaxation time is 200 ms.
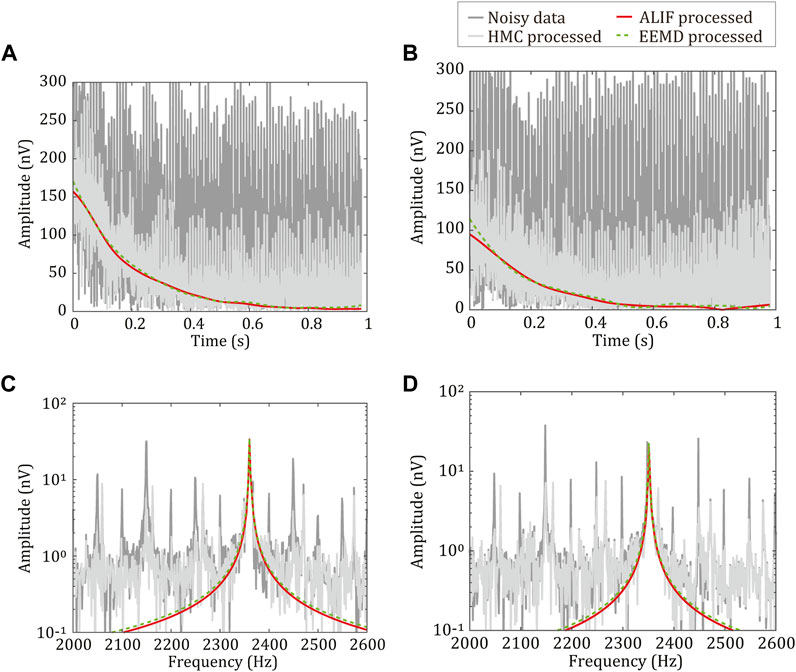
FIGURE 9. Results of field data before and after processing. In (A) and (C), Larmor frequency is 2,360 Hz and relaxation time is 200 ms. In (B) and (D), Larmor frequency is 2,351 Hz and relaxation time is 200 ms. Dark gray lines represent the original signal envelope, light gray lines represent the signal envelope after HMC processing, green lines represent the signal envelope after EEMD algorithm processing, and red lines represent the signal envelope after ALIF algorithm processing.
Table 2 reports the analysis of the results processed by the three algorithms. The ground truth of the relaxation time in Table 2 is 200 m, the initial amplitude of the first group of data is 168 nV, and the initial amplitude of the second group of data is 102 nV. The value of the initial amplitude is calibrated and calculated according to the comprehensive factors of the experimental environment and experimental device, δE0 and
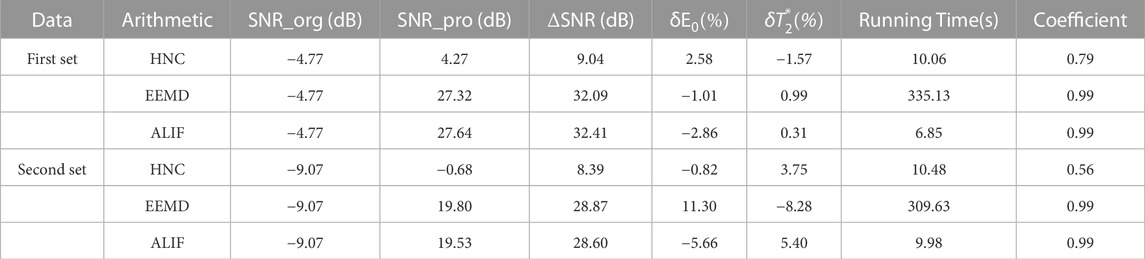
TABLE 2. Analysis results of field data processed by the three algorithms.
Compared with the data processing results in Figure 9, Table 2, in the first group of data, the deviation between the Larmor frequency and power frequency harmonics of the MRS signal is larger (10 Hz), and the three algorithms obtain satisfactory processing results in the fitting errors of the initial amplitude and relaxation time. However, owing to the single acquisition of data, the HMC exerts no inhibitory effect on the random noise; thus, the SNR improvement is only 9 dB, whereas the SNR improvement of the ALIF and EEMD algorithms is more than 32 dB. From the time–frequency domain diagram in Figure 9, it can be seen that after HMC processing, the signal still contains considerable random noise, thereby resulting in the correlation between the extracted envelope and ideal signal of only 0.79, which is significantly lower than 0.99 from the ALIF and EEMD algorithms.
In the second set of data, the deviation between the Larmor frequency of the MRS signal and power frequency harmonics is small (1 Hz), and the original SNR is lower than that in the first set of data. At this time, the HMC and ALIF algorithms obtain improved processing results in the fitting errors of the initial amplitude and relaxation time, and the fitting error of the EEMD algorithm is obviously larger than that in the first set of data. Therefore, by combining the processing results and program execution efficiency of the three algorithms under the above two SNRs and frequency deviations, it can be seen that the comprehensive performance of the ALIF algorithm is better than that of the HMC and EEMD algorithms.
4 Conclusion
Focusing on the problem of complicated environmental noise and difficult-to-realize reliable MRS signal envelope extraction in the practical application of MRS signal detection instruments, this study proposes an MRS signal envelope extraction algorithm based on the ALIF algorithm, which can effectively extract the signal envelope while removing the noise. The uncertainty of the initial amplitude and lateral relaxation time is used as the evaluation criterion to determine the two key parameters of mask coefficient and decomposition order in the ALIF algorithm. MRS signal envelope extraction statistical experiments are conducted under different noise types, noise amplitudes, and relaxation times, and the results show that the SNR can be improved by 30 ∼42 dB after ALIF algorithm processing. Through a comparative analysis between the ALIF algorithm, classical HMC method, and EEMD envelope extraction algorithm, the ALIF algorithm is proven to demonstrate superior performance and high computational efficiency and to be suitable for multi-exponential MRS signals. The field data processing experiment reveals that for the field data with a frequency deviation of 1 Hz, a satisfactory data processing effect is obtained. However, for the envelope extraction of MRS signals with the same frequency harmonics, the ALIF algorithm must be examined and solved further.
Data availability statement
The raw data supporting the conclusion of this article will be made available by the authors, without undue reservation.
Author contributions
Conceptualization, BT and HL; methodology, CS and LL; software, CS and LL; validation, CS and LL; formal analysis, CS; investigation, HD; resources, CS and LL; data curation, HD; writing—original draft preparation, LL, Y-DL, and BT; writing—review and editing, Y-DL, C-CC, and BT; visualization, CS and LL; supervision, HL; project administration, BT; funding acquisition, BT. All authors have read and agreed to the published version of the manuscript.
Funding
Research on observation technology of airborne magnetic vector gradients of low temperature superconductors has received funding from the National key research and development program under grant agreement 2021YFB3900201. This work was supported in part by the Education Department Project of Jilin Province (Grant Nos. JJKH20211087KJ and JJKH20211052KJ), the Natural Science Foundation of Jilin Province (Grant Nos. 20190201111JC) and the Fundamental Research Funds for the Central Universities.
Conflict of interest
The authors declare that the research was conducted in the absence of any commercial or financial relationships that could be construed as a potential conflict of interest.
Publisher’s note
All claims expressed in this article are solely those of the authors and do not necessarily represent those of their affiliated organizations, or those of the publisher, the editors and the reviewers. Any product that may be evaluated in this article, or claim that may be made by its manufacturer, is not guaranteed or endorsed by the publisher.
References
Behroozmand, A. A., Keating, K., and Auken, E. (2015). A review of the principles and applications of the nmr technique for near-surface characterization. Surv. Geophys. 36, 27–85. doi:10.1007/s10712-014-9304-0
Cicone, A., Liu, J., and Zhou, H. (2016). Adaptive local iterative filtering for signal decomposition and instantaneous frequency analysis. Appl. Comput. Harmon. Analysis 41, 384–411. doi:10.1016/j.acha.2016.03.001
Crank, J., and Nicolson, P. A. (1996). A practical method for numerical evaluation of solutions of partial differential equations of the heat-conduction type. Adv. Comput. Math. 6, 207–226. doi:10.1007/bf02127704
Dalgaard, E., Auken, E., and Larsen, J. J. (2012). Adaptive noise cancelling of multichannel magnetic resonance sounding signals. Geophys. J. Int. 191, 88–100. doi:10.1111/j.1365-246X.2012.05618.x
Diao, S., Shi, B., and Xu, A. (2022). Research on extraction method of tunnel magnetic resonance detection signal based on collaborative filtering. AIP Adv. 12, 115307. doi:10.1063/5.0102375
Du, G., Lin, J., Zhang, J., Yi, X., and Jiang, C. (2019). Study on shortening the dead time of surface nuclear magnetic resonance instrument using bipolar phase pulses. IEEE Trans. Instrum. Meas. 69, 1268–1274. doi:10.1109/tim.2019.2911755
Ghanati, R., Fallahsafari, M., and Hafizi, M. K. (2014). Joint application of a statistical optimization process and empirical mode decomposition to magnetic resonance sounding noise cancelation. J. Appl. Geophys. 111, 110–120. doi:10.1016/j.jappgeo.2014.09.023
Ghanati, R., Hafizi, M. K., and Fallahsafari, M. (2016). Surface nuclear magnetic resonance signals recovery by integration of a non-linear decomposition method with statistical analysis. Geophys. Prospect. 64, 489–504. doi:10.1111/1365-2478.12296
Grombacher, D., Liu, L., Osterman, G. K., and Larsen, J. J. (2021). Mitigating narrowband noise sources close to the larmor frequency in surface nmr. IEEE Geoscience Remote Sens. Lett. 18, 1376–1380. doi:10.1109/lgrs.2020.3000639
Hertrich, M. (2008). Imaging of groundwater with nuclear magnetic resonance. Prog. Nucl. Magnetic Reson. Spectrosc. 53, 227–248. doi:10.1016/j.pnmrs.2008.01.002
Huang, N. E., Shen, Z., Long, S. R., Wu, M. C., Shih, H. H., Zheng, Q., et al. (1998). The empirical mode decomposition and the hilbert spectrum for nonlinear and non-stationary time series analysis. Proc. R. Soc. Lond. 454, 903–995. doi:10.1098/rspa.1998.0193
Jiang, C., Lin, J., Duan, Q., Sun, S., and Tian, B. (2011). Statistical stacking and adaptive notch filter to remove high-level electromagnetic noise from MRS measurements. Near Surf. Geophys. 9, 459–468. doi:10.3997/1873-0604.2011026
Jiang, C., Zhou, Y., Wang, Y., Duan, Q., and Tian, B. (2021). Harmonic noise-elimination method based on the synchroextracting transform for magnetic-resonance sounding data. IEEE Trans. Instrum. Meas. 70, 1–11. doi:10.1109/tim.2021.3102689
Larsen, J. J., and Behroozmand, A. A. (2016). Processing of surface-nuclear magnetic resonance data from sites with high noise levels. Geophysics 81, WB75–WB83. doi:10.1190/geo2015-0441.1
Larsen, J. J., Dalgaard, E., and Auken, E. (2014). Noise cancelling of MRS signals combining model-based removal of powerline harmonics and multichannel Wiener filtering. Geophys. J. Int. 196, 828–836. doi:10.1093/gji/ggt422
Legchenko, A., Baltassat, J. M., Duwig, C., Boucher, M., Avilés, G., Soruco, A., et al. (2020). Time-lapse magnetic resonance sounding measurements for numerical modeling of water flow in variably saturated media. J. Appl. Geophys. 175, 103984. doi:10.1016/j.jappgeo.2020.103984
Legchenko, A., and Valla, P. (2002). A review of the basic principles for proton magnetic resonance sounding measurements. J. Appl. Geophys. 50, 3–19. doi:10.1016/S0926-9851(02)00127-1
Li, F., tian Li, K., Lu, K., and Li, Z.-Y. (2020a). Cancellation of varying harmonic noise in magnetic resonance sounding signals. J. Appl. Geophys. 177, 104047. doi:10.1016/j.jappgeo.2020.104047
Li, F., tian Li, K., Lu, K., and yu Li, Z. (2020b). Random noise suppression and parameter estimation for magnetic resonance sounding signal based on maximum likelihood estimation. J. Appl. Geophys. 176, 104007. doi:10.1016/j.jappgeo.2020.104007
Li, T., Feng, L.-B., Duan, Q.-M., Lin, J., Yi, X.-F., Jiang, C.-D., et al. (2014). Research and realization of short dead-time surface nuclear magnetic resonance for groundwater exploration. IEEE Trans. Instrum. Meas. 64, 278–287.
Li, W., Cai, N., Ning, Z., Dong, Y., and Wang, H. (2021). Error compensation for optical encoder via local-sinusoidal-assisted empirical mode decomposition with an optimization scheme. IEEE Trans. Industrial Electron. 69, 9596–9604. doi:10.1109/tie.2021.3112968
Lin, L., Wang, Y., and Zhou, H. (2009). Iterative filtering as an alternative algorithm for empirical mode decomposition. Adv. Adapt. Data Analysis 1, 543–560. doi:10.1142/s179353690900028x
Lin, T., Zhu, J., Wang, H., Teng, F., and Zhang, Y. (2020a). A review on the progress of the underground nuclear magnetic resonance method for groundwater disaster forecasting detection of tunnels and mines. J. Appl. Geophys. 177, 104041. doi:10.1016/j.jappgeo.2020.104041
Lin, T.-T., Li, Y., Gao, X., and Wan, L. (2021). Random noise suppression of magnetic resonance sounding signal based on modified short-time Fourier transform. Acta Phys. Sin. 70, 163303. doi:10.7498/aps.70.20202044
Lin, T., Li, Y., Lin, Y., Chen, J., and Wan, L. (2022). Magnetic resonance sounding signal extraction using the shaping-regularized Prony method. Geophys. J. Int. 231, 2127–2143. doi:10.1093/gji/ggac317
Lin, T., Yao, X., Yu, S., and Zhang, Y. (2020b). Electromagnetic noise suppression of magnetic resonance sounding combined with data acquisition and multi-frame spectral subtraction in the frequency domain. Electronics 9, 1254. doi:10.3390/electronics9081254
Liu, L., Grombacher, D., Auken, E., and Larsen, J. J. (2019). Complex envelope retrieval for surface nuclear magnetic resonance data using spectral analysis. Geophys. J. Int. 217, 894–905. doi:10.1093/gji/ggz068
Liu, L., Grombacher, D., Auken, E., and Larsen, J. J. (2018). Low noise, multichannel surface nmr receiver system with wireless connections to receiver coils. ASEG Ext. Abstr. 2018, 1–4. doi:10.1071/aseg2018abt7_1h
Müller-Petke, M., Braun, M., Hertrich, M., Costabel, S., and Walbrecker, J. (2016). MRSmatlab — a software tool for processing, modeling, and inversion of magnetic resonance sounding data. Geophysics 81, WB9–WB21. WB9–WB21. doi:10.1190/geo2015-0461.1
Müller-Petke, M., and Costabel, S. (2014). Comparison and optimal parameter settings of reference-based harmonic noise cancellation in time and frequency domains for surface-NMR. Near Surf. Geophys. 12, 199–210. doi:10.3997/1873-0604.2013033
Pan, J., Lu, K., Wang, Z., Li, K., and Li, Z. (2021). Advantages of the optimum pulse moment in surface nmr and application in groundwater exploration. Groundwater 59, 199–213. doi:10.1111/gwat.13046
Qin, S., Ma, Z., Jiang, C., Lin, J., Bai, M., Lin, T., et al. (2019). Application of magnetic resonance sounding to tunnels for advanced detection of water-related disasters: A case study in the dadushan tunnel, guizhou, China. Tunn. Undergr. Space Technol. 84, 364–372. doi:10.1016/j.tust.2018.11.032
Wang, Q., Jiang, C., and Luo, K. (2020). Tunnel magnetic resonance tomography for 2-d water-bearing structures using rotating coil with separated loop configuration. IEEE Trans. Geoscience Remote Sens. 59, 843–853. doi:10.1109/tgrs.2020.2995995
Wang, Q., Jiang, C., and Mullerpetke, M. (2018). An alternative approach to handling co-frequency harmonics in surface nuclear magnetic resonance data. Geophys. J. Int. 215, 1962–1973. doi:10.1093/gji/ggy389
Yao, X., Zhang, J., Yu, Z., Zhao, F., and Sun, Y. (2019). Random noise suppression of magnetic resonance sounding data with intensive sampling sparse reconstruction and kernel regression estimation. Remote Sens. 11, 1829. doi:10.3390/rs11151829
Zhang, J., Du, G., Lin, J., Yi, X., and Chuandong, J. (2019). Improving the signal-to-noise ratio of underground nuclear magnetic resonance data based on the nearby reference noise cancellation method. IEEE Access 7, 75265–75275. doi:10.1109/access.2019.2920845
Zhao, Y., and Su, Y. (2019). The extraction of micro-Doppler signal with emd algorithm for radar-based small uavs’ detection. IEEE Trans. Instrum. Meas. 69, 929–940. doi:10.1109/tim.2019.2905751
Keywords: magnetic resonance sounding, groundwater, adaptive local iterative filtering, SNR, envelope extraction
Citation: Tian B, Sun C, Liu L, Lin Y-D, Chiu C-C, Duan H and Luan H (2023) Envelope extraction algorithm for magnetic resonance sounding signals based on adaptive local iterative filtering. Front. Earth Sci. 11:1088290. doi: 10.3389/feart.2023.1088290
Received: 03 November 2022; Accepted: 27 March 2023;
Published: 18 April 2023.
Edited by:
Morten Smelror, Geological Survey of Norway, NorwayReviewed by:
Peng Zhenming, University of Electronic Science and Technology of China, ChinaXiaoyue Cao, Yangtze University, China
Copyright © 2023 Tian, Sun, Liu, Lin, Chiu, Duan and Luan. This is an open-access article distributed under the terms of the Creative Commons Attribution License (CC BY). The use, distribution or reproduction in other forums is permitted, provided the original author(s) and the copyright owner(s) are credited and that the original publication in this journal is cited, in accordance with accepted academic practice. No use, distribution or reproduction is permitted which does not comply with these terms.
*Correspondence: Hui Luan, bHVhbmh1aUBqbHUuZWR1LmNu