 Zhong Fu Wang
 Xu Sheng Zhang1†
- 1North China University of Water Resources and Electric Power, Zhengzhou, China
- 2Beijing Engineering Corporation Limited, Beijing, China
- 3Huadong Engineering Corporation Limited, Hangzhou, China
The debris flows in the Taihang Mountain region in North China are basically triggered by rainstorms. Firstly, the debris flow susceptibility of the Shaling Gully, Lingshou County, Hebei Province, China was analyzed in this paper to evaluate its hazard and effect on the downstream proposed structures. Secondly, the maximum flow depth and velocity of the potential debris flow in Shaling Gully were numerically simulated based on the FLO-2D model, and the simulation results indicate that the flow depths under the 50-year and 100-year rainstorms will have some effect on the downstream proposed structures. With debris flow intensity classification, the hazard of potential debris flow in Shaling Gully was classified. According to the flow depths and velocities simulated by FLO-2D model, the ARCGIS10.8 software was adopted to optimize the hazard zones, and therefore the hazard zonation map was established. With consideration of simulation results under natural conditions and other factors such as gully feature, a 4 m high and 40 m wide retaining dam was designed. The numerical simulation results show that the retaining dam may decrease the debris flow hazard to a negligible level, which offers some beneficial reference to the subsequent engineering design for Shaling Gully.
1 Introduction
Debris flows are considered to be very dangerous mass movement in the world (Lee and Widjaja, 2013). In China, the debris flows basically occur in the Loess Plateau region and northern and southwestern mountains, and those in the northern mountains generally result from rainstorm. Therefore, the research in the debris flow hazard is important to the hazard mitigation and prevention due to the wide distribution and severe damage of debris flow.
Researchers in different countries have established various numerical models to interpret, simulate and predict the debris flow events (Zegers et al., 2020). FLO-2D model based on the non-Newtonian fluid and central finite difference (O'Brien et al., 1993), and this model was proven to be effective in terms of Omega parameter (Chang et al., 2017). FLO-2D model as used to numerically simulate the discharges of debris flow in Huaxi Gully under operational and dam-failure conditions, respectively (Fang et al., 2019). FLO-2D model was also applied to precisely simulate the movement and deposition processes (Stancanelli et al., 2017) and estimate the maximum depth of moving debris flow on the base of NAM model (Wei et al., 2017). FLO-2D model is also used to simulate terrain changes caused by debris flow caused by rainstorm during typhoon period (Chen and Wang, 2017). The FLO-2D PRO model is used to analyze the sedimentation, velocity, impact force and influence area of debris flow based on SCS-CN method (Zhang et al., 2014). In addition, the sediment yield of debris flow in Sulin Town, Hualian County, China was estimated with the FLO-2D model (Hsu et al., 2012). Many scholars also evaluated the debris flow hazard by the FLO-2D model. For example, the numerical simulation on the Chengbei Gully in Shanxi Province, China was carried out with FLO-2D model, and then the hazard zonation was conducted (Tang et al., 2022). Numerically estimated the depth and scope of debris flow of Boshui Gully with FLO-2D model under the 100-year and 50-year rainfall conditions, and provided a method to assess the debris flow hazard with consideration of solid source and water (Zhang et al., 2022). Estimated the debris flow hazard with FLO-2D model, and then classified the debris flow hazard in Anzhou City, Sichuan Province, China (Deng et al., 2021). The FLO-2D model was also applied to simulate the movement process of debris flow of Hou Gully in Shimian County, Yaan City, China under different cycles, and then the intensity classification of slag debris flow was established (Deng et al., 2021). Additionally, the FLO-2D model was used to determine the intensity of Zhouqu debris flow (Zhang et al., 2018) and obtain the hazard zonation map of debris flow in Songhe Stream region (Lin et al., 2011).
The hazard of debris flow in Shaling Gully was assessed in this paper. Firstly, the susceptibility of debris flow was analyzed according to the field survey data. Secondly, the debris flow was numerically simulated with FLO-2D model. Thirdly, the hazard zonation at various rainstorm frequencies was determined by ARCGIS10.8 software. Finally, the retaining dam for debris flow mitigation was evaluaged by numerical simualtion, which provided technical support for the safety of downstream structures.
2 Study area
The Shaling Gully is located in Lingshou County, Shijiazhuang City, Hebei Province, China, with 18 dendritic branch gullies on two banks. The main gully is 3.876 km long, and the catchment area is approximately 4.91 km2. Abundant alluvial, colluvial and man-made deposits are found in these gullies, and a little residual deposit in some gullies. Some structures of the lower reservoir of Lingshou pumped-storage station are just located in the study area, as shown in Figure 1.
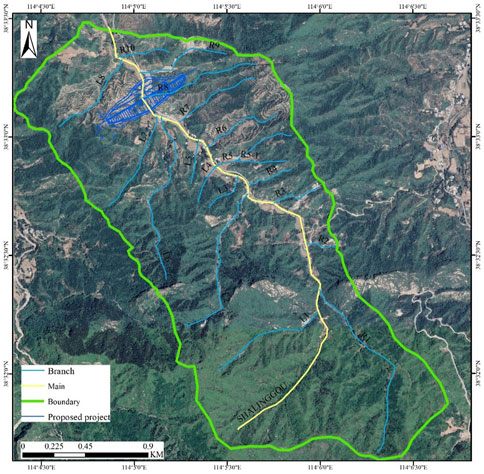
FIGURE 1. Drainage pattern of potential debris flow and location of engineering structures in Shaling Gully.
The study area is situated in the Taihang Mountain uplift zone, and 25 pre-Quaternary faults are found within 25 km of the study area. These faults mostly have NE- and NW-strike, partly with NS and EW strike.
The lithology in the study area consists mainly of the Archean biotite plagioclase-feldspar gneiss of Fangli Formation (Fgn), plagioclase-feldspar amphibolite of Chejiangou Formation (Ca), and Archean granite gneiss of Gangnan Formation (Ggn). The Quaternary strata consist basically of the 1 m–2 m thick residual (Q4edl) gravel soil on the mountain peak and slope, 1 m–3 m thick alluvial (Q4pal) sandy gravel on the gully bottom, 1 m–5 m thick diluvial (Q4pl) 0.2 m–0.5 m-diameter gravel soil on the gully banks, and 1 m–3 m thick (partially about 5 m thick) man-made (Q4ml) gravel soil on the upper terrace and gully bottom. The well developed gneissoid structures are widely found on the gully banks, generally with attitude of NE60°-80°, SE∠60°–80°.
The warm continental monsoon dominates the study area, with distinct wet and dry seasons. The average annual precipitation is 497 mm, 64% of which occurs during the period from June to August, and the average annual evaporation is 1,685.3 mm.
The human activities in the study area involve the abandoned open mining and artificial deposit on the gully bottom. The mining activities result in not only some colluvium due to rock cracking but also abundant slag. The terraces, which are generally located in the midstream and downstream Shaling Gully, have large scale and loose structure, providing abundant source for triggering the debris flow during flood season.
3 Methodology
Firstly, the susceptibility of debris flow was analyzed according to the field survey data and remote sensing interpretation. Secondly, the FLO-2D model was applied to evaluate the maximum flow depths and velocities at various rainstorm frequencies. Thirdly, the hazard zonation at various rainstorm frequencies was determined based on the debris flow intensity classification, and the effect of debris flow on the downstream proposed structures was estimated. Finally, the retaining dam for debris flow mitigation was designed, and the operational effect of the dam was numerically simulated with FLO-2D model. The flowchart of hazard assessment is shown in Figure 2.
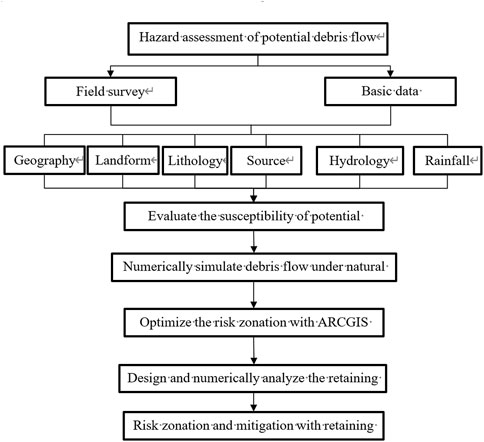
FIGURE 2. Flowchart of Hazard assessment of potential debris flow.
3.1 Data acquisition
The sophisticated UAV oblique photography is frequently applied to obtain the data about contour line (Li et al., 2021b, 2021c; Almalki and Angelides, 2022; Trepekli et al., 2022; Zan et al., 2022). High definition photos about the region concerned can be taken by high resolution cameras attached to the UAV, and then the real terrain and landform about the study area will be achieved by image processing and information extraction. The UAV behaves better in field survey due to its high definition, wide survey range, easy operation, few site limitations and good suitability. In this paper, the 1:5,000 contour lines obtained by UAV was imported into ARCGIS10.8 to create and process the DEM data. The distribution and volume of debris flow source in Shaling Gully were determined by field survey and UAV technique.
3.2 Susceptibility evaluation
The susceptibility of debris flow is commonly referred to as the occurrence probability of a debris flow. Currently, the susceptibility is basically evaluated by the direct index evaluation method, which is a subjective judgement, or indirect index evaluation method, which is widely used by most scholars (Li et al., 2020; Sujatha, 2020; Mehmood et al., 2021; Jingbo et al., 2021). In this paper, the indirect index evaluation method was selected to estimate the susceptibility of debris flow in Shaling Gully.
3.3 FLO-2D simulation
FLO-2D, evolved from the diffusive hydrodynamic model, is a two-dimensional finite difference model that numerically simulates flood and debris flow (O'Brien et al., 1993). The model discretizes the surface topography into uniform square-grid elements in terms of central finite difference routing scheme, and the each grid has corresponding elevation and Manning’s coefficient. The continuity equation and motion equations govern the conservation of mass and momentum, which are expressed as
where
Besides, the solid particles in the debris flow may collide against each other during movement, increasing the inertial stresses, and therefore the effect of particle collision on debris flow movement should be considered by the following equation:
where
4 Susceptibility assessment of potential debris flow in Shaling Gully
The indirect index evaluation method always selects the terrain, source and rainfall as evaluation factors, and then the selected factors are normalized and weighted (Jun et al., 2017; Li et al., 2021a). In this paper, the AHP (Analytic Hierarchy Process) method was used to evaluate these factors (Mehmood et al., 2021).
4.1 Selection of evaluation factors
The occurrence of debris flow are greatly affected by the terrain, source and rainfall, and the selected factors should be representative and easily quantified. According to the gully characteristics in the study area and other scholars’ achievements (Lin et al., 2012; Niu et al., 2015; Cao et al., 2017; Xiao et al., 2020; Gu et al., 2021), the susceptibility of debris flow in Shaling Gully was evaluated by eight factors, namely, catchment area S1, main gully length S2, maximum elevation difference S3, ravine density S4, average longitudinal slope ratio S5, loose material length supply ratio S6, loose material volume S7, and maximum daily (24 h) rainfall S8.
4.2 AHP model
The AHP model for susceptibility assessment of potential debris flow in Shaling Gully is shown in Figure 3.
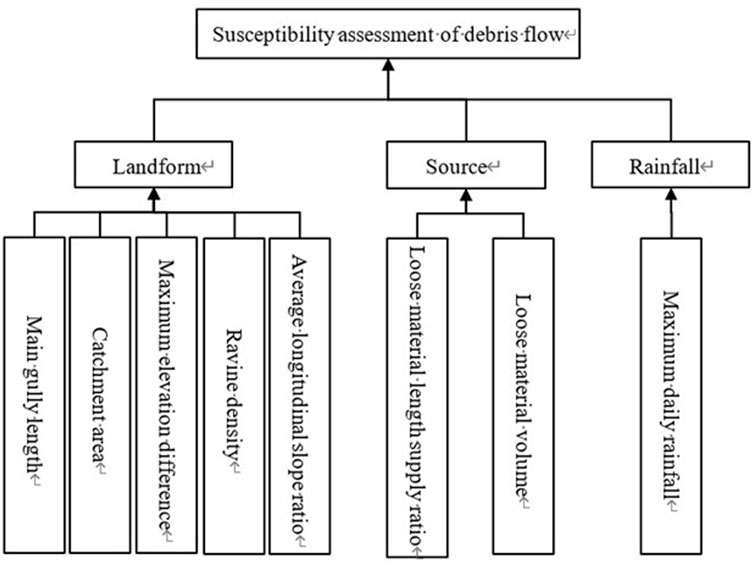
FIGURE 3. AHP model for susceptibility assessment of potential debris flow in Shaling Gully.
The weight of each factor was determine by the importance to its parent layer, with S1 = 0.0145, S2 = 0.0258, S3 = 0.0487, S4 = 0.0258, S5 = 0.0487, S6 = 0.3597, S7 = 0.1799, and S8 = 0.3070.
5 Hazard assessment of debris flow under natural conditions
5.1 Parameter determination
The contour lines measured in the field were converted into DEM format and then into ASCII format with ARCGIS10.8. The ASCII format data were imported into FLO-2D, and then the simulation domain and grid sizes were appropriately determined. In this paper, the grid size is 20 m × 20 m, and the calculation region was subsequently determined and assigned with elevation values.
5.1.1 Resistance parameter for laminar flow and Manning’s coefficient
The Manning’s coefficient was applied to represent the effect of ground roughness on debris flow in FLO-2D, and this coefficient is greatly influenced by the terrain and vegetation. The Manning’s coefficient was determined jointly by the field survey results, Eq. 5 proposed by Wang Yuyi et al., and some research achievements (Chen et al., 2021; Deng et al., 2021; Zhang et al., 2022). Finally, the Manning’s coefficient is 0.1 and the resistance parameter for laminar flow is 2,285.
5.1.2 Volumetric sediment concentration
The volumetric sediment concentration was calculated with Eq. 6.
where
Here the calculated CV is 0.35.
5.1.3 Viscosity coefficient
In terms of

TABLE 1. Parameters for FLO-2D.
5.2 Inflow node and peak discharge
It is very important to select appropriate inflow nodes for FLO-2D simulation (Genevois et al., 2022). The zone with abundant loose deposit was defined as the inflow node according to the field survey and rainfall data. Because the capturing and erosion of debris flow was not considered in the FLO-2D simulation, the bulking factor (BF) was introduced for compensation (Elci et al., 2017). BF is frequently calculated with Eq. 7. Before numerical simulation, the peak discharge - time curves at various rainstorm frequencies were optimized according to peak discharges, BF and generalized pentagon method, as shown in Figure 4.
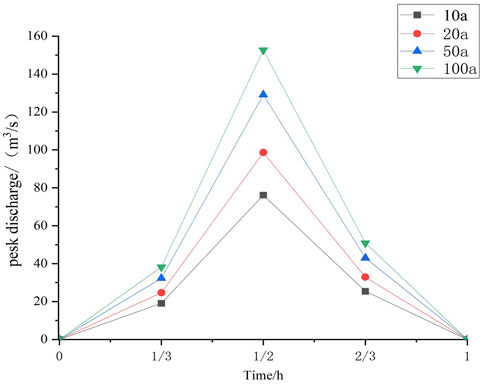
FIGURE 4. Variations of peak discharge of debris flow with time in Shaling Gully.
5.3 Simulation results
For the method of using FLO-2D to assess the hazard of debris flow, many scholars have verified and achieved good results (Zhang et al., 2018; Chang et al., 2020; Tang et al., 2022). As this paper is a potential debris flow, the numerical simulation results are mainly based on the field investigation, combined with the gully terrain and material source conditions, through the comparison of theoretical calculation and numerical simulation results, to determine the numerical simulation model.
The debris flow is numerically simulated immediately after the related parameters were input into FLO-2D. The simulation results are shown in Figure 5, indicating that the maximum flow depths and velocities have positive correlation to the rainfall. Under the 10-year and 20-year rainfall conditions, the velocities and flow depths are generally small, which has minor effect on downstream structures, and more than 90% of flow depths are less than 1 m, with velocities of 0.5 m/s–1 m/s. Under the 50-year and 100-year rainfall conditions, the velocities and flow depths increase, and 18.4% of 50-year flow depths and 26.7% of 100-year flow depths are greater than 1 m, with most velocities larger than 1 m/s.
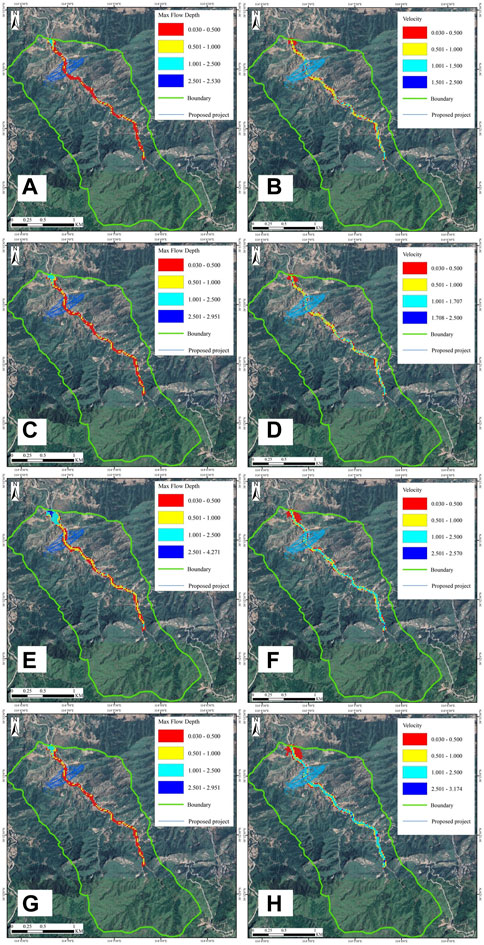
FIGURE 5. Maximum flow depths and velocities at various rainfall frequencies. (A)(a) Distribution of 10-year maximum flow depth (m) (B)(b) Distribution of 10-year velocity (m/s), (C)(c) Distribution of 20-year maximum flow depth (m), (D)(d) Distribution of 20-year velocity (m/s), (E)(e) Distribution of 50-year maximum flow depth (m), (F)(f) Distribution of 50-year velocity (m/s), (G)(g) Distribution of 100-year maximum flow depth (m), (H)(h) Distribution of 100-year velocity (m/s).
5.4 Hazard assessment of debris flow in Shaling Gully under natural conditions
The hazard of potential debris flow was assessed according to the maximum flow depths and maximum velocities simulated by FLO-2D, and then the effect of debris flow on the downstream structures is estimated. The classification standard of debris flow intensity in terms of maximum flow depth and maximum velocity has good suitability (Lin et al., 2011; Chang et al., 2017; Zhang et al., 2018; Chang et al., 2020). Table 2 lists the classification standard of debris flow intensity in Shaling Gully according to the influence on downstream proposed structures, site terrain and engineering design data.

TABLE 2. Classification standard of debris flow.
The hazard of potential debris flow and its effect on the downstream proposed structures were evaluated in terms of rainstorm frequencies. For quantitative analysis, the Vh value of each grid was calculated by the Spatial Join tool of ARCGIS, and the zones whose parameters are not listed in Table 2 were marked by special signs. If the hazard zones by ARCGIS were not identical to those by Hazard plug-in of FLO-2D, those zones were reasonably evaluated in a qualitative way according to site conditions, empirical methods and rainfall frequency. The final hazard zonation map of debris flow in Shaling Gully at vario is obtained. According to the intensity classification of debris flow and the qualitative and quantitative classification standards, the hazard zoning of debris flow under different rainfall frequencies is obtained. The maximum flow depth in high-hazard zones is more than 2.5 m. Low hazard zones are all with velocities less than 0.5 m/s or maximum flow depth less than 0.5 m. The Hv value of the medium hazard zones are between 0.5 m/s2 and 2.5 m/s2.
The simulation results indicate that, under 10-year rainfall condition, the high, medium and low hazard zones account for 2.9%, 9.4%, and 87.7%, respectively. All the engineering structures are in the low hazard zones, and thus are safety.
Under 20-year rainfall condition, the high, medium and low hazard zones account for 4.9%, 12.9%, and 82.8%, respectively. Most engineering structures are in the low hazard zones, but few in medium hazard zones. According to qualitative analysis, the medium hazard zones have relatively larger deposition depth and small velocity, and therefore have generally low hazard to the structures.
Under 50-year rainfall condition, the high, medium and low hazard zones account for 18.9%, 21.2%, and 59.9%, respectively. Most engineering structures are in the low hazard zones, partially in medium hazard zones, and few in high hazard zones. According to qualitative analysis, the maximum flow depths increase, and therefore have some hazard to the structures.
Under 100-year rainfall condition, the high, medium and low hazard zones account for 26.2%, 22.1%, and 51.7%, respectively. A few engineering structures in gully outlet are in high hazard zones, and may be highly threatened by potential debris flow according to qualitative analysis. Under 100-year rainfall condition, the high, medium and low hazard zones account for 26.2%, 22.1%, and 51.7%, respectively. A few engineering structures in gully outlet are in high hazard zones, and may be highly threatened by potential debris flow according to qualitative analysis.
Generally, the proposed structures may be generally subject to low hazard under 10-, 20- and 50-year rainfall conditions, but to high hazard under 100-year rainfall condition. Therefore, some retaining measures should be taken under 100-year rainfall condition. As frequencies is shown in Figure 6.
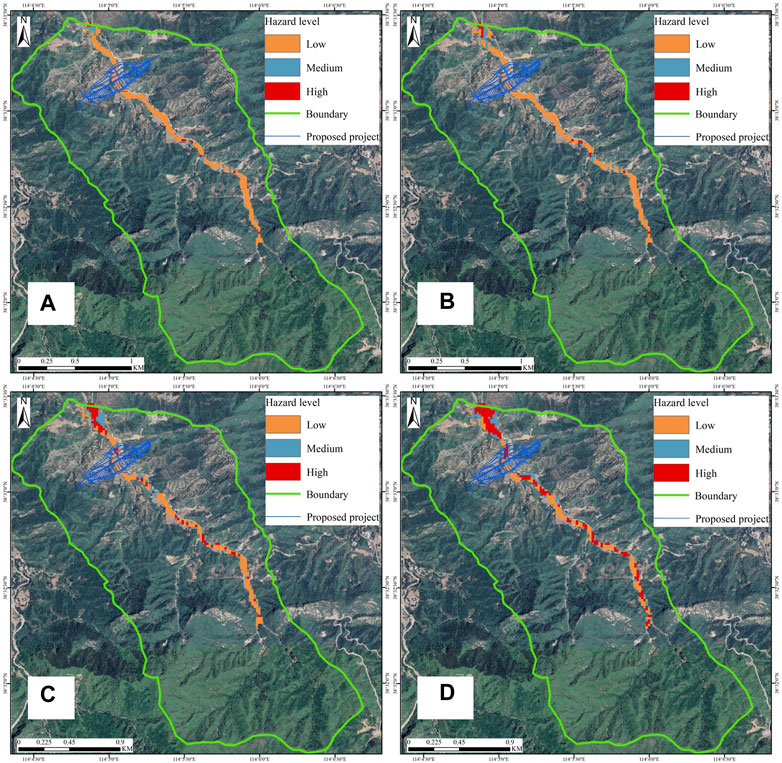
FIGURE 6. Hazard zonation of debris flow at various rainfall frequencies. (A)(a)Hazard zonation under 10-year rainfall, (B)(b)Hazard zonation under 20-year rainfall, (C)(c)Hazard zonation under 50-year rainfall, (D)(d)Hazard zonation under 100-year rainfall.
6 Design of retaining structures
6.1 Type and location
The research on the prevention and mitigation of debris flow is conducted many year ago. In China, the integrated technique is frequently applied for hazard mitigation by combinations of prevention, treatment, engineering measures, biological structures, and resource utilization (Gao and Tian, 2020; Zhang et al., 2020), and the retaining structures are predominately used to control the debris flow in mountains (Lee et al., 2014; Zhang et al., 2021).
The retaining dam scheme was taken to control the debris flow in Shaling Gully in terms of construction feasibility and cost by deeply analyzing the its profile, activity and effect according to on-site survey and simulation results. The retaining dam is located in the straight gully section with a rural road, which is suitable for construction. Furthermore, it can prevent the downstream structures from debris flow because most unstable soil source is in the midstream and upstream gully. The retaining dam was designed to be 4 m high and 50 m wide because the effective sediment retaining volume depends greatly on the dam height, width and upstream terrain.
6.2 Numerical simulation under retaining structures conditions
Firstly, the dam location was determined and imported into FLO-2D. Secondly, the dam model was established with Levee module (Wang, 2019). Thirdly, the maximum flow depths were calculated by appropriately setting relative parameters, as shown in Figure 7.
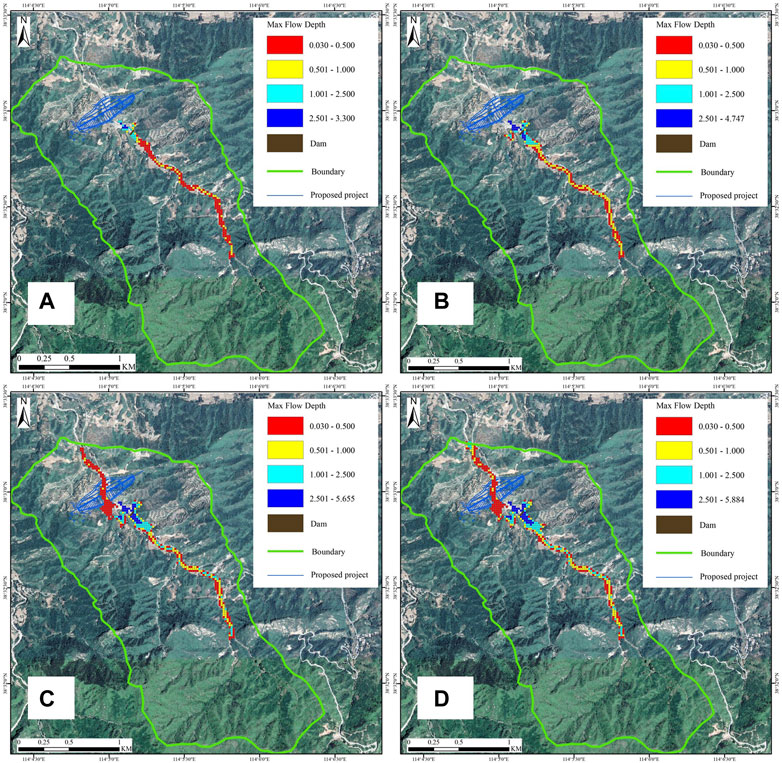
FIGURE 7. Distribution of maximum flow depths (m) with retaining dam at various rainfall frequencies (A)Hazard zonation with dam under 10-year rainfall, (B)Hazard zonation with dam under 20-year rainfall, (C)Hazard zonation with dam under 50-year rainfall, (D)Hazard zonation with dam under 100-year rainfall.
The simulation results show that almost 100% potential debris flow is blocked by the retaining dam under 10-year and 20-year rainfall conditions, but small amount of debris flow discharges under 50-year and 100-year rainfall conditions, posing a little threat to downstream structures. Due to the dam blockage and riverbed silting, the flow depths and ranges increase in the upstream of dam and obviously decrease in the downstream of dam.
Table 3 indicates that the percents of flow depths greater than 1 m increase remarkably at the back of dam due to riverbed silting. The dam completely blocks the debris flow under 10-year and 20-year frequencies and no debris flow occurs at the front of the dam, which has no threat to the downstream structures. In addition, the percents of flow depths less than 0.5 m increase obviously. Furthermore, the flow depths are almost less than 1 m at the front of the dam, indicating that the dam can effectively block the debris flow. Due to the existence of retaining dam, the debris flow has little hazard to the downstream structures. The hazard zonations with retaining dam at various rainfall frequencies are shown in Figure 8.
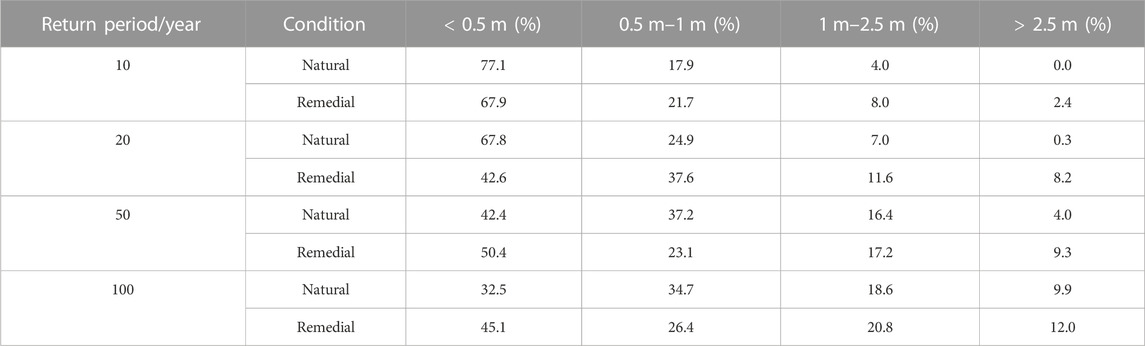
TABLE 3. Percent of flow depth before and after retaining dam.
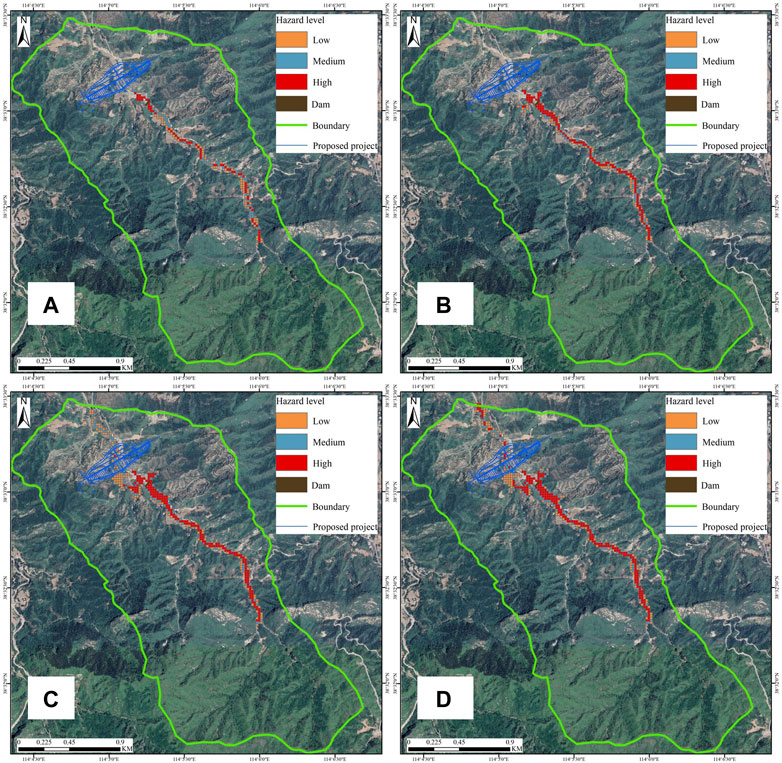
FIGURE 8. Hazard zonations with retaining dam at various rainfall frequencies. (A)(a)Hazard zonation with dam under 10-year rainfall, (B)(b)Hazard zonation with dam under 20-year rainfall, (C)(c)Hazard zonation with dam under 50-year rainfall, (D)(d)Hazard zonation with dam under 100-year rainfall.
7 Discussion
Based on FLO-2D model, the hazard zoning of potential debris flow is obtained by simulating the maximum flow depth and velocity of potential debris flow. In recent years, as a two-dimensional dynamic simulation model, FLO-2D has been widely used in the hazard quantification of debris flow disasters, and has shown satisfactory results (Deng et al., 2021; Tang et al., 2022). In the study of regional debris flow hazard, FLO-2D simulation program can determine the temporal and spatial distribution of debris flow fluid depth and velocity. However, in the study of potential debris flow, although the reasonable velocity and flow depth can be simulated, there is no debris flow, so the simulation of potential debris flow cannot be verified in reality. For FLO-2D numerical simulation, ARCGIS10.8 can be used for correction in hazard zoning. But in the simulation of FLO-2D, the following assumptions needs to be done.
(1) Assume that the water pressure distribution is hydrostatic;
(2) The debris flow is stable in the time interval of difference calculation;
(3) The debris flow satisfies the steady flow retardation equation;
(4) Assume that each grid point has a unique elevation value and Manning coefficient;
(5) It is assumed that the roughness of debris flow movement surface in the grid is an average value.
Therefore, grid selection is also very important in FLO-2D simulation. Based on the existing computer tools and considering the accuracy requirements of this paper, choose 20 m × 20 m grid size. If the computer conditions permit, you can also choose a finer grid size of 20 m. In addition, the erosion and entrainment of debris flow cannot be considered due to the assumption problem, which is worth further studying.
8 Conclusion
The debris flow may be triggered in Shaling Gully under rainstorm due to abundant loose sediment, and its hazard was assessed in this paper. The maximum flow depths and velocities under 10-year, 20-year, 50-year, and 100-year rainfall conditions were numerically simulated, and then the hazard zonations at various rainfall frequencies were determined according to the intensity classification standard. Some conclusions are as follows:
(1) Abundant residual, alluvial and diluvial gravel soil as well as artificial deposit of mining slag and terraces, which provides solid material source for triggering debris flow.
(2) The susceptibility of debris flow was estimated to be medium by direct and indirect methods. Additionally, the maximum flow depths and velocities were numerically simulated with FLO-2D.
(3) The hazard of debris flow at various rainfall frequencies were assessed according to the intensity classification standard of debris flow. Furthermore, the hazard zonation maps at various rainfall frequencies were completed by ARCGIS and Hazard module of FLO-2D, which is beneficial for the design and construction of downstream structures.
(4) The retaining dam was designed to be 4 m high and 40 m wide according to the simulation results under natural conditions and gully features. The numerical simulation by FLO-2D indicates that the potential debris flow may pose little hazard to downstream structures under the existence of retaining dam.
Data availability statement
The original contributions presented in the study are included in the article/Supplementary Material, further inquiries can be directed to the corresponding author.
Author contributions
All authors contributed to the study conception and design. Material preparation, data collection and analysis were performed by ZW, SZ, and ZZ. The pictures and tables were performed by MW and BW. The first draft of the manuscript was written by SZ and ZW and all authors commented on previous versions of the manuscript. All authors read and approved the final manuscript.
Funding
The authors would like to acknowledge the National Key Research and Development Program (Grant No. 2019YFC1509704), National Natural Science Foundation of China (Grant No. U1704243), High-level Talent Project of North China University of Water Resource and Electric Power (Grant No. 201518), and Levee Safety and Disaster Prevention Engineering Research Center of Ministry of Water Resources.
Conflict of interest
XZZ was employed by Beijing Engineering Corporation Limited. MW was employed by Huadong Engineering Corporation Limited.
The remaining authors declare that the research was conducted in the absence of any commercial or financial relationships that could be construed as a potential conflict of interest.
Publisher’s note
All claims expressed in this article are solely those of the authors and do not necessarily represent those of their affiliated organizations, or those of the publisher, the editors and the reviewers. Any product that may be evaluated in this article, or claim that may be made by its manufacturer, is not guaranteed or endorsed by the publisher.
References
Almalki, F. A., and Angelides, M. C. (2022). Autonomous flying IoT: A synergy of machine learning, digital elevation, and 3D structure change detection. Comput. Commun. 190 (1), 154–165. doi:10.1016/j.comcom.2022.03.022
Cao, C., Xu, P., Chen, J., Zheng, L., and Niu, C. (2017). Hazard assessment of debris-flow along the baicha river in heshigten banner, inner Mongolia, China. Int. J. Env. Res. Pub He 14, 30. doi:10.3390/ijerph14010030
Chang, M., Liu, Y., Zhou, C., and Che, H. X. (2020). Hazard assessment of a catastrophic mine waste debris flow of Hou Gully, Shimian, China. Eng. Geol. 275, 105733. doi:10.1016/j.enggeo.2020.105733
Chang, M., Tang, C., Van Asch, T., and Cai, F. (2017). Hazard assessment of debris flows in the Wenchuan earthquake-stricken area, South West China. Landslides 14 (17), 1783–1792. doi:10.1007/s10346-017-0824-9
Chen, C. Y., and Wang, Q. (2017). Debris flow-induced topographic changes: Effects of recurrent debris flow initiation. Environ. Monit. Assess. 189 (9), 449–511. doi:10.1007/s10661-017-6169-y
Chen, M., Tang, C. A., Zhang, X. Z., Xiong, J., Chang, M., Shi, Q. Y., et al. (2021). Quantitative assessment of physical fragility of buildings to the debris flow on 20 August 2019 in the Cutou gully, Wenchuan, southwestern China. Eng. Geol. 293, 106319. doi:10.1016/j.enggeo.2021.106319
Deng, Z. F., Liu, J. F., Guo, L. L., Li, J. Y., Li, J. M., and Jia, Y. R. (2021). Pure risk premium rating of debris flows based on a dynamic run-out model: A case study in Anzhou, China. Nat. Hazards 106 (23), 235–253. doi:10.1007/s11069-020-04459-x
Elci, S., Tayfur, G., Haltas, I., and Kocaman, B. (2017). Numerical modeling of two dimensional flood wave propagation in residential areas after the dambreak. Tek. Dergi 28 (79), 55–75. doi:10.18400/tekderg.307456
Fang, Q. S., Tang, C., Chen, Z. H., Wang, S. Y., and Yang, T. (2019). A calculation method for predicting the runout volume of dam-break and non-dam-break debris flows in the Wenchuan earthquake area. Geomorphology 327 (20), 201–214. doi:10.1016/j.geomorph.2018.10.023
Gao, F., and Tian, W. (2020). Dynamic response analysis of blocks-combined dam under impact load. J. Mt. Sci. 17 (11), 2827–2839. doi:10.1007/s11629-019-5619-0
Genevois, R., Tecca, P. R., and Genevois, C. (2022). Mitigation measures of debris flow and landslide risk carried out in two mountain areas of North-Eastern Italy. J. Mt. Sci-Engl 19 (18), 1808–1822. doi:10.1007/s11629-021-7212-6
Gu, X. B., Wu, S. T., Ji, X. J., and Zhu, Y. H. (2021). The risk assessment of debris flow hazards in banshanmen gully based on the entropy weight-normal cloud method. Adv. Civ. Eng. 20 (21), 1–11. doi:10.1155/2021/8841310
Hsu, S. M., Wen, H. Y., Chen, N. C., Hsu, S. Y., and Chi, S. Y. (2012). Using an integrated method to estimate watershed sediment yield during heavy rain period: A case study in hualien county, taiwan. Nat. Hazard Earth Sys 12 (19), 1949–1960. doi:10.5194/nhess-12-1949-2012
Jingbo, S., Shengwu, Q., Shuangshuang, Q., Yang, C., Gang, S., Qiushi, C., et al. (2021). Exploring the impact of introducing a physical model into statistical methods on the evaluation of regional scale debris flow susceptibility. Nat. Hazards 106 (1), 881–912. doi:10.1007/s11069-020-04498-4
Jun, X., Xianfeng, C., Qianrui, H., Yu, C., Wufu, Q., Jia, Y., et al. (2017). Susceptibility evaluation of debris flow based on experience weight method combined with “3S” technology: A case study from dongchuan in yunnan Province, China. IOP Conf. Ser. Earth Environ. Sci. 95, 022051. doi:10.1088/1755-1315/95/2/022051
Lee, K., Kim, S. W., and Kim, J. M. (2014). Simulation of inundation zone triggered by dam failure using FLO-2D. America: (American Geophysical Union) AGU Fall Meeting Abstracts.
Lee, S., and Widjaja, B. (2013). Phase concept for mudflow based on the influence of viscosity. Soils Found. 53, 77–90. doi:10.1016/j.sandf.2012.12.005
Li, B. Y., Hou, J. M., Li, D. L., Yang, D., Han, H., Bi, X., et al. (2021c). Application of LiDAR UAV for high-resolution flood modelling. Water Resour. Manag. 35, 1433–1447. doi:10.1007/s11269-021-02783-w
Li, Y., Chen, J., Tan, C., Gu, F., and Zhang, Y. (2021b). Application of the borderline-SMOTE method in susceptibility assessments of debris flows in Pinggu District, Beijing, China. Nat. Hazards 105 (3), 2499–2522. doi:10.1007/s11069-020-04409-7
Li, Y., Chen, J., Zhang, Y., Song, S., Han, X., and Ammar, M. (2020). Debris flow susceptibility assessment and runout prediction: A case study in shiyang gully, beijing, China. Int. J. Environ. Res. 14 (3), 365–383. doi:10.1007/s41742-020-00263-4
Li, Z., Chen, J., Tan, C., Zhou, X., Li, Y., and Han, M. (2021a). Debris flow susceptibility assessment based on topo-hydrological factors at different unit scales: A case study of mentougou district, beijing. Environ. Earth Sci. 80 (9), 365–419. doi:10.1007/s12665-021-09665-9
Lin, J. W., Chen, C. W., and Peng, C. Y. (2012). Potential hazard analysis and risk assessment of debris flow by fuzzy modeling. Nat. Hazards 64 (2), 273–282. doi:10.1007/s11069-012-0236-z
Lin, J. Y., Yang, M. D., Lin, B. R., and Lin, P. S. (2011). Risk assessment of debris flows in Songhe Stream, taiwan. Eng. Geol. 123 (1), 100–112. doi:10.1016/j.enggeo.2011.07.003
Mehmood, Q., Qing, W., Chen, J., Yan, J., Ammar, M., Rahman, G., et al. (2021). Susceptibility assessment of single gully debris flow based on AHP and extension method. Civ. Eng. JOURNAL-TEHRAN 7, 953–973. doi:10.28991/cej-2021-03091702
Niu, C. C., Wang, Q., Chen, J. P., Zhang, W., Xu, L. M., and Wang, K. (2015). Hazard assessment of debris flows in the reservoir region of wudongde hydropower station in China. Sustainability-Basel 7, 15099–15118. doi:10.3390/su71115099
O'Brien, J. S., Julien, P. Y., and Fullerton, W. T. (1993). Two-dimensional water flood and mudflow simulation. J. hydraulic Eng. (New York, N.Y.) 119, 244–261. doi:10.1061/(asce)0733-9429(1993)119:2(244)
Stancanelli, L. M., Peres, D. J., Cancelliere, A., and Foti, E. (2017). A combined triggering-propagation modeling approach for the assessment of rainfall induced debris flow susceptibility. J. Hydrol. 550, 130–143. doi:10.1016/j.jhydrol.2017.04.038
Sujatha, E. R. (2020). A spatial model for the assessment of debris flow susceptibility along the Kodaikkanal-Palani traffic corridor. Front. Earth Sci. 14 (2), 326–343. doi:10.1007/s11707-019-0775-7
Tang, Y. M., Guo, Z. Z., Wu, L., Hong, B., Feng, W., Su, X. H., et al. (2022). Assessing debris flow risk at a catchment scale for an economic decision based on the LiDAR DEM and numerical simulation. Front. EARTH Sci. 10, 821735. doi:10.3389/feart.2022.821735
Trepekli, K., Balstrom, T., Friborg, T., Fog, B., Allotey, A. N., Kofie, R. Y., et al. (2022). UAV-Borne, LiDAR-based elevation modelling: A method for improving local-scale urban flood risk assessment. Nat. Hazards23 51, 423–451. doi:10.1007/s11069-022-05308-9
Wang, Y. (2019). Analysis of engineering treatment effect of debris flow based on numerical simulation. Master's thesis (China: Lanzhou University).
Wang, Y. Y., Hu, K. H., Wei, F. Q., and Chen, J. (2007). Relationship between rheology/erosion-deposit properties of debris flow and its hazard degree. J. Nat. disasters 119, 17–22. doi:10.3969/j.issn.1004-4574.2007.01.004
Wei, Z. L., Shang, Y. Q., Lu, Q., Yu, Z., and Pan, P. (2017). Application and design of an efficient siphon dewatering system for debris flow mitigation: A case study of a small catchment in zhejiang Province, China. Eng. Geol. 226, 146–160. doi:10.1016/j.enggeo.2017.06.004
Xiao, H., Tang, X., and Zhang, H. (2020). Risk assessment of debris flow in longchi area of dujiangyan based on GIS and AHP. IOP Conf. Ser. Earth Environ. Sci. 474, 042010. doi:10.1088/1755-1315/474/4/042010
Zan, W. B., Zhang, W. J., Wang, N., Zhao, C. C., Yang, Q., and Li, H. (2022). Stability analysis of complex terrain slope based on multi-source point cloud fusion. J. Mt. Sci-Engl. 19, 2703–2714. doi:10.1007/s11629-022-7307-8
Zegers, G., Mendoza, P. A., Garces, A., and Montserrat, S. (2020). Sensitivity and identifiability of rheological parameters in debris flow modeling. Nat. Hazard Earth Sys 20, 1919–1930. doi:10.5194/nhess-20-1919-2020
Zhang, P., Ma, J., Shu, H., Han, T., and Zhang, Y. (2014). Simulating debris flow deposition using a two-dimensional finite model and Soil Conservation Service-curve number approach for Hanlin gully of southern Gansu (China). Environ. Earth Sci. 73 (10), 6417–6426. doi:10.1007/s12665-014-3865-6
Zhang, S., Sun, P., Zhang, Y. L., Ren, J., and Wang, H. J. (2022). Hazard zonation and risk assessment of a debris flow under different rainfall condition in wudu district, gansu Province, northwest China. Water-Sui 14, 2680. doi:10.3390/w14172680
Zhang, S., Zhang, L. M., Li, X. Y., and Xu, Q. (2018). Physical vulnerability models for assessing building damage by debris flows. Eng. Geol. 247, 145–158. doi:10.1016/j.enggeo.2018.10.017
Zhang, W. T., Liu, J. F., You, Y., Sun, H., Yang, H. Q., and Lu, M. (2021). Analysis and evaluation of the treatment effect of the geotechnical engineering of debris flow: Case of xingfu gully in wolong. J. Catastrophology 36 (3), 208–214. doi:10.3969/j.issn.1000-811X.2021.03.036
Zhang, Y., Chen, J., Yue, W., and Liu, D. (2020). “Development characteristics and prevention measures of debris flow disaster in bajiao Town, Shifang City, Sichuan Province,” in Conference proceedings of the 8th international symposium on Project managemnt (China, Beijing: Aussino Academic Publishing House), 667–676.
Keywords: hazard of potential debris flow, FLO-2D, ArcGIS, retaining dam, numerical simulation
Citation: Wang ZF, Zhang XS, Zhang XZ, Wu MT and Wu B (2023) Hazard assessment of potential debris flow: A case study of Shaling Gully, Lingshou County, Hebei Province, China. Front. Earth Sci. 11:1089510. doi: 10.3389/feart.2023.1089510
Received: 04 November 2022; Accepted: 27 January 2023;
Published: 16 February 2023.
Edited by:
Sandipan Das, Symbiosis International University, IndiaCopyright © 2023 Wang, Zhang, Zhang, Wu and Wu. This is an open-access article distributed under the terms of the Creative Commons Attribution License (CC BY). The use, distribution or reproduction in other forums is permitted, provided the original author(s) and the copyright owner(s) are credited and that the original publication in this journal is cited, in accordance with accepted academic practice. No use, distribution or reproduction is permitted which does not comply with these terms.
*Correspondence: Zhong Fu Wang, eGZqdHd6ZkAxNjMuY29t
†These authors have contributed equally to this work and share first authorship