 Wahyu Triyoso
- Faculty of Mining and Petroleum Engineering, Institut Teknologi Bandung, Bandung, Indonesia
The probabilistic seismic hazard function (PSHF) before large earthquake events based on the hypothesis earthquake forecast algorithm using the Akaike information criterion (AIC) is performed in this study. The motivation for using the AIC is to better understand the reliability model used to construct the PSHF. The PSHF as the function of the b-value is calculated based on a 5-year window length with a 1-year moving window (instantaneous PSHF) before a large earthquake event. The AIC is calculated based on the likelihood of success and failure using shallow earthquake catalog data around the west coast of Sumatra Island. The probability of occurrence defines the success criteria as more significant than the average probability of greater than or equal to the given magnitude; otherwise, it is defined as failure. Seismic potency has been determined based on the likelihood of an earthquake occurring in several decades or a hundred years. The seismicity rate model is developed based on the integrated data of pre-seismic shallow crustal movement data and the shallow crustal earthquake catalog data. Furthermore, the AIC is calculated based on the likelihood of success and failure as a function of b(t). The b(t) is the change in the b-value as a time function estimated based on shallow earthquake data from 1963 to 2016. In addition, the AIC before M7.9 of 2000, M8.5 of 2007, and M7.8 of 2010 is assessed. The δAIC is then introduced as a function of (AICmodel–AICreference) during the observation time. The positive δAIC implies that the likelihood of having a large earthquake is more significant; otherwise, it is smaller. By plotting the time of observation versus δAIC and the PSHF estimated as the function of b(t), we could identify a large positive gradient and increase the PSHF at each certain probability exceedance (PE) level before the great earthquake event. It consistently happened for the three events that were evaluated. It suggested that the results of this study might be very beneficial for probabilistic seismic hazard analysis (PSHA) and seismic mitigation realization.
1 Introduction
The island of Sumatra moved separately between segments, which was caused by the convergence of the Indo-Australian Plate, which was subducting toward the Eurasian plate (Fitch, 1972; Jarrard, 1986). Sieh and Natawidjaja (2000) and Bradley et al. (2017) clarified that the subduction plate movement is along the Sunda Trench in the southwest part of Sumatra Island with low-obliquity subduction and right-lateral shear fault, near the southwest coast of Sumatra Island, parallel to the trough. It is called the Sumatran fault zone (SFZ) (Sieh and Natawidjaja, 2000). The orientation and magnitude of the relative plate movement velocity vectors vary along plate boundaries (Sieh and Natawidjaja, 2000). They are 52 mm/yr in the northern, 57 mm/yr in the middle, and 60 mm/yr in the southern part, and they are caused by the curved shape of the plate boundary (Sieh and Natawidjaja, 2000). The oblique subduction and Sumatran shear faults produced the complexity of Sumatra’s stress, strain, and deformation patterns. According to Zachariasen et al. (2000), relatively high convergent plate movement of about 49 mm/year causes a relatively very high annual rate of earthquakes. For the last 250 years, Megawati and Pan (2009) clarified that five major earthquakes (Mw ≥ 8.0) have occurred along the Sumatran megathrust. McClosky et al. (2005) noted that subsequent earthquakes often follow earthquakes that occur in subduction zones. It implies that the stress interaction can affect the forearc area’s seismicity, as Pollitz et al. (2006) and Triyoso and Sahara (2021) suggested. An obvious example is that the 2004 Sumatra–Andaman earthquake caused changes in seismic activity in the Andaman Sea (Sevilgen et al., 2012) and produced earthquakes in 2005 in Nias and the northern part of the Sumatra fault zone (McClosky et al., 2005; Pollitz et al., 2006; Rafie et al., 2021; Triyoso and Sahara, 2021).
The change in the b-value in time and space can be related to stress levels before a large earthquake in a seismotectonic area (Hirata, 1989; Öncel et al., 1995; Caneva and Smirnov, 2004; Roy et al., 2011). Thus, the b-value as the function of space and time could be used to better understand the possible existence of the stress interaction that can affect the potential future seismicity. Other workers have proposed some suggestions. For example, a decrease in the b-value is interpreted as an increase in stress before a seismic event (Scholz, 1968; Wyss et al., 2004). Therefore, lower b-values can be expected near the area of possible future earthquakes.
The correspondence between low b-values and the evidence of large earthquakes around the Sumatra subduction zone has been noted by Nuannin and Kulhánek (2012) and Nuannin et al. (2012). Their study focuses on determining the b-value as a function of time and space for events in the Andaman–Sumatra region and assessing its potential as a seismic precursor. The results showed that large earthquakes occur when b-values decrease before a large earthquake. The phenomenon is clear enough, as they showed in the diagrams for each catalog data they used. The most critical of their finding (Nuannin et al., 2012) shows that about fifteen largest earthquakes, Mw ≥ 7, occurred between 2000 and 2010 in the Andaman–Sumatra region; all events occurred within areas of low b and were preceded by significant decrease in b-values—about 15 most considerable observed correspondence between low b before the occurrence of large earthquakes. The temporal variations revealed significant decreases in the b-value, which happened before the time of occurrence of the two large earthquakes (Ms ≥ 7) in 2002 and the Mw = 9.2 event in 2004 (Nuannin et al., 2012). The spatial distribution exhibits low b around the epicenters of the 2002 and 2004 events. This finding implies that the b-value as a function of time could be employed for the PSHA study and seismic mitigation of future earthquake potency (Triyoso et al., 2021; 2022).
Pailoplee and Choowong (2014) evaluated the a and b values of the magnitude–frequency distribution and fractal dimension (DC) simultaneously for the 13 recognized seismic source zones in mainland Southeast Asia, including northern Sumatra, using a complete earthquake dataset. They found a relationship between DC-b and DC-(a/b) and suggested that the Sumatra–Andaman interplate and intraslab, Andaman Basin, and Sumatra fault zones are areas of high tectonic stress that may risk producing major future earthquakes. Triyoso et al. (2022) evaluated the possible correlation between DC and seismic moment rate based on GPS and late-quarter active fault and shallow earthquake data on the island of Sumatra. The result can characterize a reasonable correlation between two seismotectonic parameters: DC—b. The most important finding is that relatively high DC coincides with high seismic hazard function (SHF) curves and high seismic moment rates derived from pre-seismic GPS data (Triyoso et al., 2022). Their findings align with Pailoplee and Choowong (2014) results. Therefore, it is reasonable to conclude that regions with relatively high DC or low b-values overlap with high seismic moment loading rates, implying high tectonic stress loading, which could risk generating significant future earthquake hazards.
Two earthquakes happened on 12 September 2007 around the Mentawai region, where large earthquakes of Mw 8.8 occurred in 1797 and Mw 9.0 in 1833. Konca et al. (2008) studied them and concluded that earthquakes with Mw 8.4 and Mw 7.9 were only a small part of the fracture area in 1833 and other patches of megathrust that remained locked in the interseismic period. According to Konca et al. (2008), the same section of a megathrust may rupture in different patterns depending on whether the asperities rupture as isolated seismic events or work together to produce a more significant collapse.
Triyoso and Shimazaki (2012) noted that an earthquake potential model plays a crucial role in seismic hazard analysis. Moreover, it has long been realized that evaluating a potential source model is essential to accurate earthquake forecasting. Still, learning this technique has required many decades—until data on an adequate number of large earthquakes were available for evaluation.
Vere-Jones (1995) clarified that very small volumes of earthquakes in space could be considered completely random. As a result, earthquake events can be considered a point process and can be regarded as a realization of a point process by applying the Poisson distribution. Console (1998) introduced an algorithm to test the earthquake forecasting hypothesis by formulating the probability of realization of success and failure. Finally, Triyoso and Shimazaki (2012) noted that when the study area is gridded into cells. In each cell, the expected number of events is known, and we know that at least one event (event) or no event (no event) occurred based on the historical earthquake catalog. Thus, using historical catalog data as a reference, Triyoso and Shimazaki (2012) adopted the formulation of the probability of the realization of success and failure and gridded the study area. Since the number of expected events is known in each cell or grid, at least one event (event) or no event (no event) occurs in every cell. Then, considering the seismicity level, Triyoso and Shimazaki (2012) introduced an adjustment factor of k. The factor k is constant, and the expected rate of occurrence can be multiplied by k to maximize the logarithm of the probability function. Maximizing the logarithm likelihood function with respect to k, we can adjust the level of seismic activity. Thus, the factor k in this study is the variable used to maximize the likelihood function. With this optimizing factor k, we need to use the AIC (Akaike, 1974). We select the most reliable seismicity rate and pattern based on the comparison of the AIC values of each of them. The model that gives the minimum AIC is chosen as the most reliable. Usually, a difference more prominent than 2 in the AIC is considered statistically very significant. By replacing the historical earthquake catalog of Triyoso and Shimazaki (2012) as a reference with the probability of occurrence above the mean value, we then adopt the algorithm to evaluate the AIC versus the time before a significant earthquake event addressed for probabilistic seismic hazard and mitigation.
The aim of this study is to evaluate the PSHF before large earthquake events based on the hypothesis earthquake forecast algorithm using the AIC. The AIC is used to better understand the reliability model used to realize the seismic hazard analysis from the viewpoint of probability. In addition, the purpose is to better understand the reliability of the 5-year window of the PSHF as a function of the b-value calculated based on a 5-year window length with a 1-year moving window (instantaneous PSHF) before a large earthquake event. The area of the study is chosen by following the suggestion of Natawidjaja et al. (2006), Konca et al. (2008), Shamim et al. (2019), and Álvarez et al. (2021). It is around the west coast of Sumatra Island.
2 Data and method
2.1 Data
This study’s shallow crustal earthquake data are based on PuSGeN 2017 (The 2017 PuSGen, 2017). The selected area is around the west coast of Sumatra Island, with the selected data of Mw ≥ 4.7 with a maximum depth of 50 km from 1963 to 2016. The pre-seismic surface displacement data are based on Triyoso et al. (2022). Figure 1A shows the distribution of shallow earthquakes with depths less than 50 km from 1963 to 2016 (The PuSGen, 2017) and the cross-sections using a width of 10 km (B). They are cross-sections P1–P2, P3–P4, and P5–P6. Figure 2 shows that the pre-seismic GPS model was derived based on Triyoso et al. (2020) and Triyoso et al. (2022).
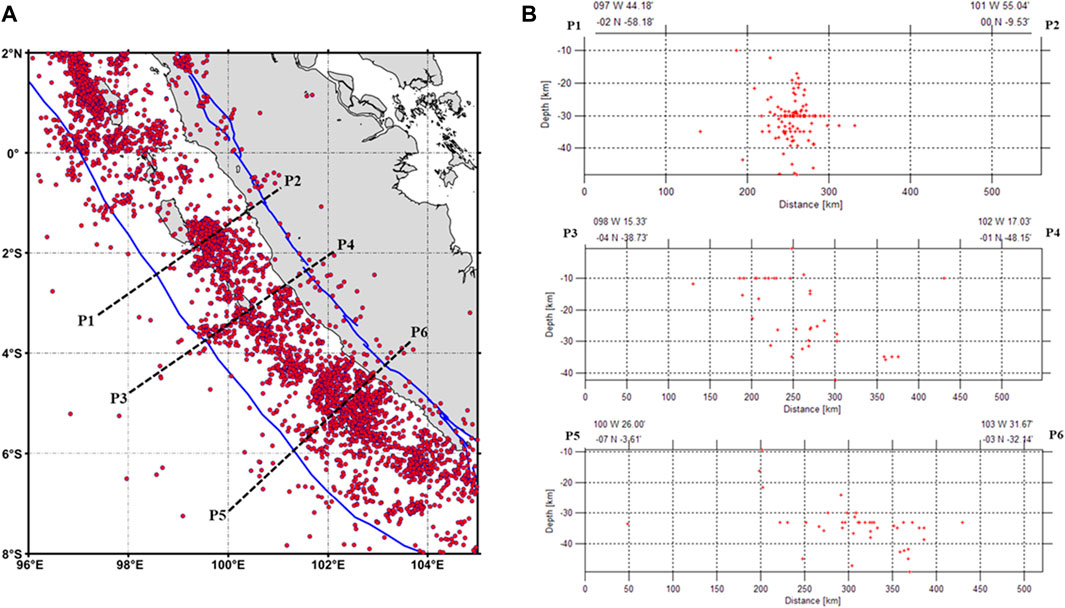
FIGURE 1. Distribution of shallow earthquakes with depths less than 50 km from 1963 to 2016 (The 2017 PuSGen, 2017) and the cross-sections using a width of 10 km (B). They are cross-sections P1–P2, P3–P4, and P5–P6.

FIGURE 2. The pre-seismic GPS data model was derived based on Triyoso et al. (2020) and Triyoso et al. (2022).
2.2 The b-value
The b-value of the Gutenberg–Richter equation (Gutenberg and Richter, 1944) is an important parameter, and it correlates with the possible size of the scaling properties of earthquake seismicity. According to Frohlich and Davis (1993), the average b-value on a regional scale is usually ∼ 1. In estimating the b-value, the maximum likelihood is the most robust method for calculating the b-value (Aki, 1965). Following Utsu (1978), the formula for the b-value could be written as follows:
where
2.3 Geodetic modeling: SHmax rate estimation
In this study, to obtain the geodetic modeling data, the horizontal displacement field of each observation point over the entire seismogenic depth is assumed to be homogeneous and isotropic. Furthermore, the horizontal displacement in E–W and N–S direction components is denoted by u and v, respectively. Referring to El-fiky et al. (1999), an assumption is needed to determine which signals u and v are not correlated. The study area was gridded into 10 × 10 km cell sizes, and the surface strain rate was estimated. First, we calculated each cell’s horizontal crustal strain rate using previous studies’ procedures (Triyoso et al., 2020; Triyoso et al., 2021; 2022; Triyoso and Sahara, 2021; Triyoso and Suwondo, 2022) and the least square collocation (LSC) method. Then, the local covariance functions based on the horizontal surface displacement data are used to estimate the horizontal surface displacement of each grid or cell in the study area. Finally, the horizontal crustal strain was used as the input to estimate the maximum shear strain over the entire study area. Following El-fiky et al. (1999), the formula used in this study to calculate the maximum shear strain (SHmax) is as follows:
where SHmax is the maximum shear strain and ɛij is the strain component.
Based on the corrected displacement data, this study’s pre-seismic GPS data were used after large earthquakes. It means that the post-seismic effect of the previous large earthquake events is removed. Therefore, the GPS data before the large earthquakes are based on Triyoso et al. (2020), and after the large earthquakes, they are based on Yusfania et al. (2014), Khaerani et al. (2018), and Triyoso et al. (2022). They are addressed to estimate the strain rate over a more extended period.
2.4 Statistical background
2.4.1 Likelihood function
If the occurrence of an event is described as a uniform random process and λ is the expected number of events in the realization of a test that could be conducted as many times as we could imagine, the probability that in a single realization, the number of events is n is given by the Poisson distribution is as follows:
From Eq. 3, the probability of no event is
The probability of at least one event is
For the combination of events, there are the rules of the probability theory. Thus, the probability that a series of n tests come out with a pre-determined realization of at least one event (n′ times) and no event (n" times) is given by the following product, with n = n′ + n":
Eq. 6 is the likelihood of the realization of the tests. The values for Eq. 6 depend on the test results and are a function of the parameters used to determine probabilities. Accordingly, the term likelihood function emerges. The likelihood functions may assume very small values, especially when the number of single tests is large and the probabilities connected with them are small. For this reason, it is practical to use the logarithm of this function (log-likelihood); thus, by referring to Triyoso and Shimazaki (2012), we may write the equation as follows (Kagan and Jackson, 1995; Jackson and Kagan, 1999):
where n is the total number of cells, pi is the occurrence rate at cell i, and ci is equal to 1 when a historically large earthquake used as a reference occurred in cell i and 0 when not (Kagan and Jackson, 1995; Jackson, 1996).
2.4.2 Akaike information criterion
Referring to Triyoso and Shimazaki (2012), in which the historical catalog is used to evaluate the reliability of the earthquake potential model, the adjustment factor k is introduced. The purpose is to consider the possibility that the historical data are incomplete. However, Triyoso and Shimazaki (2012) focused on the spatial distribution of the occurrence rate, not the absolute value of the rate. In other words, we cannot perform an “N-test” (the number test) (Kagan and Jackson, 1995) because the observed earthquake frequency may be underestimated due to historically missing events. Thus, the probability pi is not used directly, but its relative magnitude kpi is used by introducing a scaling factor k. Therefore, Eq. 7 could be written as follows:
Maximizing the log-likelihood function with respect to k, we may write the AIC (Akaike, 1974) as follows:
where p is the number of parameters used to maximize the log-likelihood function. p equals 1 as the factor k is the only parameter, and Lmax is the maximized log-likelihood. It should be noted that the minus sign in the aforementioned equation means that the better model has a smaller AIC value. For the purpose of model comparison, Triyoso and Shimazaki (2012) introduced δAIC as
AICmodel is the AIC of the specific model, and AICreference is calculated based on the uniform background seismicity model. In this study, the success cell based on the historical earthquake catalog of Triyoso and Shimazaki (2012) as a reference is replaced by cells with the probability of occurrence above the mean value over the entire 150 km radius of the large earthquake event that is evaluated. Because the place of the success cell is treated as at least one earthquake is expected, adjustment factor k and maximizing Lmax with respect to k is then applied. The 150 km radius refers to the radius of the b-value calculation. Thus, the AICmodel is calculated based on the cell with the probability of occurrence above the mean value. The positive δAIC implies that the likelihood of having a large earthquake is more significant, and otherwise, it is smaller.
3 Probabilistic seismic hazard function estimation
3.1 Seismicity rate modeling: Potential source area and rate formulation
As this study is intended to evaluate the PSHF before large earthquake events based on the hypothesis earthquake forecast algorithm using the AIC, the primary purpose is to better understand the reliability of the instantaneous PSHF as the function of the b-value with time before a large earthquake event. Then, the modified seismicity rate model of Triyoso et al. (2020) by the following formulation is proposed. The potential earthquake occurrence rate above or equal to magnitude completeness as a reference (Mref) in the particular grid i is modeled by using the uniform background seismicity rate (Abackground) weighted by the normalized maximum shear strain rate (SHmax-rate). The formulation could be written as follows:
where Abackground is uniform background seismicity with magnitude ≥ Mref in grid i, the SHmax-rate is the maximum shear strain rate estimated at the grid of i, and the maximum (SHmax-rate) is the maximum value of the SHmax-rate over the entire study area. vi represents the likelihood estimation seismicity rate (annual of the 10a) with a magnitude greater than or equal to a given earthquake magnitude reference (Mref).
Furthermore, by substituting 10a of Eq. 11 in the frequency–magnitude of the Guttenberg–Richter equation (Guttenberg and Richter, 1944), we may write the following equation:
ASHmax-rate is the estimated seismicity rate above or equal to Mref, a magnitude greater than or equal to magnitude completeness (Mc). The b is the b-value.
3.2 Probabilistic seismic hazard function estimation: Ground motion prediction equation (GMPE) and probability exceedance (PE)
The SHF is constructed by cross-plotting between the probability of exceedance (PE) and peak ground acceleration (PGA) of a given magnitude reference (Mref) and a distance between the source and a site of observation. The PE formulation of the annual earthquake rate with a magnitude greater than or equal to Mref, which is the estimated maximum ground acceleration denoted by a, is calculated using GMPE at an observation point because the earthquake source on the grid k can be written as
where Pk (m ≥ m (ao, Rk)) is the annual PE of earthquakes in the kth grid or cell, m(ao, Rk) is the magnitude in the ith source grid that would produce a PGA estimated of ao or larger at the site, and Rk is the distance between the site and the source grid. The PSHF parameter calculation is based on Triyoso and Suwondo (2022), where the starting locking depth at the top is 5 km (The 2017 PuSGen, 2017). Following Triyoso and Suwondo (2022), the focal depth value is estimated from half the seismogenic thickness of about 10 km; thus, the focal depth used is 15 km. The function m(ao, Rk) is the GMPE relation. The following equation determined the total PE distribution of PGA at the site:
Thus, by substituting the GMPE in Eq. 16, we could calculate the annual PE of the particular PGA as follows:
For a given specified time of observation of T, the PE could be calculated as follows:
The annual PE of each grid or cell of specified ground motion is calculated using Eq. 15. For a time duration of T, the PE of specified ground motions is computed using Eq. 16.
4 Results and discussion
This study is motivated to evaluate the PSHF before large earthquake events based on the hypothesis earthquake forecast algorithm using the AIC. The primary purpose is to better understand the 5-year window length’s reliability to estimate PE of the SHF with a 1-year moving window (instantaneous PSHF) as the function of the b-value with time before a large earthquake. The shallow earthquake catalog data are based on PusGen 2017 (The 2017 PuSGen, 2017) around the west coast of Sumatra Island. The area has become the main area of interest as Konca et al. (2008) clarified that the potential megathrust events in the Mentawai area, as suggested by Natawidjaja et al. (2006), remain significant. Thus, the likelihood of the remaining earthquake potency around the Mentawai area needs to be understood more deeply. For earthquake mitigation purposes, the reliability of the spatiotemporal of the b-value and correlation dimension (DC) as the precursor to forecast the possible future large earthquake needs to be evaluated.
The declustering process is used to apply the earthquake catalog to develop the model. First, the seismicity rate model is constructed based on the uniform background of the declustered shallow earthquake data from 1963 to 2016 and then weighted by the normalized maximum shear strain rate deduced by the pre-seismic GPS data model (Triyoso et al., 2020; 2022). The purpose of declustering is to get the independent earthquake events with approximate to constant rates using ZMAP software (Wiemer, 2001). Figure 3 shows the proposed workflow used in this study.

FIGURE 3. The proposed workflow is used in this study.
Triyoso and Shimazaki (2012) proposed using the historical catalog as the reference used to define the success cell to select the most reliable model based on the AIC that will be used to estimate hazards. In this study, the probability of occurrence defines the success criteria if the probability occurrence of the earthquake with a magnitude larger than or equal to a given magnitude reference (Mref) is larger than the average probability; otherwise, it is defined as failure. In addition, the seismic potency has been determined based on the likelihood of an earthquake occurring in several decades or a hundred years.
As clarified by the previous study, the correspondence between low b before the evidence of large earthquakes has been noted (Nuannin et al., 2012; Nuannin and Kulhánek, 2012; Triyoso and Yuninda, 2022). Moreover, the b-value as a function of time and space before large earthquake events has been used as a seismic precursor. Since the earthquake potency and the PSHF are functions of the b-values, applying the proposed method, we could measure how reliable the b-value is as the precursor before a large earthquake from the viewpoint of PSHA.
The previous studies have suggested that we can characterize a reasonable correlation between two seismotectonic parameters, DC–b (Pailoplee and Choowong, 2014; Triyoso et al., 2022). The critical finding is that relatively high DC coincides with high SHF curves (Triyoso et al., 2022). The finding aligns with Pailoplee and Choowong (2014) results. As we may find the relationship of the Dc with the b-value and it can be used to estimate the possible future earthquake hazards, thus applying the proposed method, we could measure the reliability of DC and the b-value before a large earthquake for the PSHA.
Figure 4 shows this study’s seismicity rate model and the three-point observation. The seismic potency has been determined based on the likelihood of an earthquake occurring in over two hundred years. The probability of occurrence of the cells defines the success criteria as larger than the average probability of greater than or equal to the given magnitude; otherwise, it is defined as failure cells.
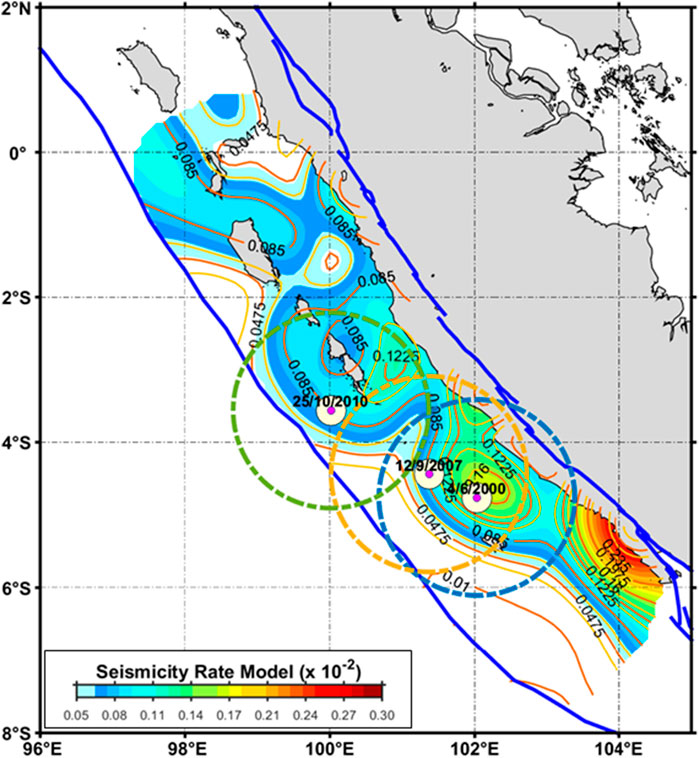
FIGURE 4. Seismicity rate model overlaid with earthquakes of M7.9 in 2000, M8.5 in 2007, M7.8 in 2010, and the three-point observation placed in the position epicenter. The seismicity rate model is constructed based on the uniform background of the declustered shallow earthquake data from 1963 to 2016 and then weighted by the normalized maximum shear strain rate deduced by the pre-seismic GPS data model that was derived based on (Triyoso et al., 2020; Triyoso et al., 2022).
Furthermore, the AIC is calculated based on the likelihood of success and failure as a function of b(t) using a constant number with a radius of 150 km, referring to the point of observation. The event number of at least approximately 25 events is used in this study. The reason is that the event number is at least 25 events (Triyoso and Yuninda, 2022) due to comparing the b-value of the various events, at least 25, 50, 75, and 100 events. Therefore, comparison with the mean shows that at least 25 events or more tend to be reliable enough. The b5(t) is the change in the b-value as a time function estimated using 5-year time windows, with the 1-year moving window using the shallow earthquake data from 1963 to 2016 as the input. Furthermore, the AIC before M7.9 of 2000, M8.5 of 2007, and M7.8 of 2010 is assessed. The δAIC is then introduced as a function of (AICmodel–AICreference) during the observation time. The positive δAIC implies that the likelihood of having a large earthquake is more significant; otherwise, it is smaller. By plotting the observation time versus δAIC, we could identify the gradient before the large earthquake event. The difference of δAIC ≥ 2 is supposed to be significant.
Figure 5 shows the plotting of the time of observation versus δAIC with Mref of 6.5 and 7.0, and we could identify a large positive gradient before the large earthquake. Furthermore, it consistently happened for the three events that were evaluated. A large positive δAIC could be found before the large earthquake with Mw8.5 compared to Mw7 class. δAIC before Mw 7.8 and Mw 7.9 were almost similar. The result showed a quantity of δAIC with respect to Mw size or class. Therefore, it implies that we can probably use the δAIC to evaluate the reliability of using spatiotemporal b-value and DC as a precursor before a large earthquake.
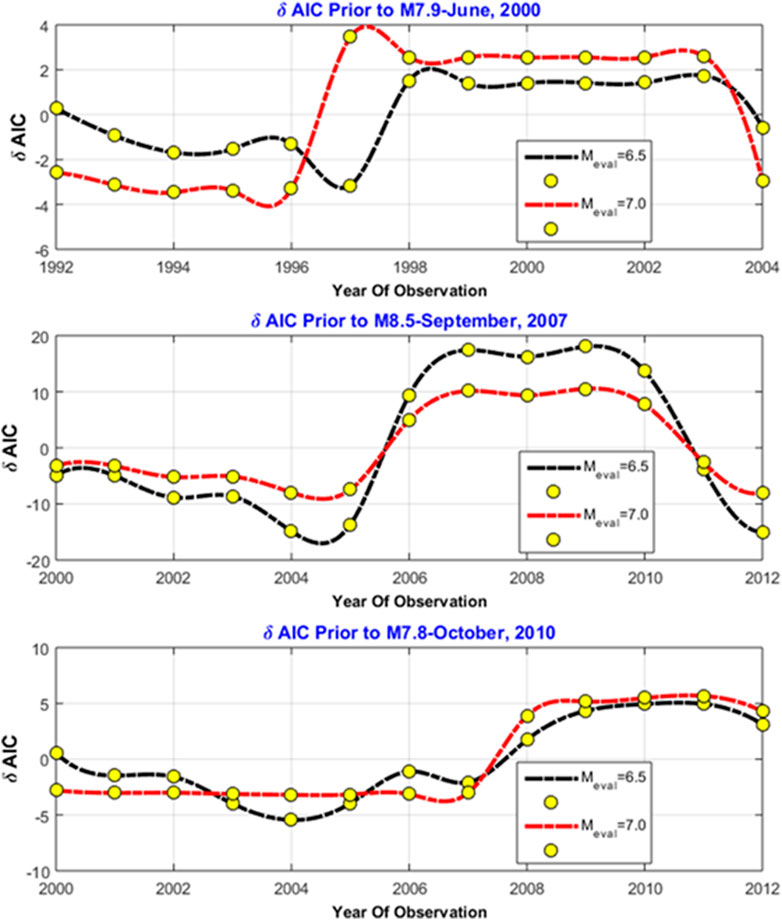
FIGURE 5. Plot of the time of observation versus δAIC with Mref of 6.5 and 7.0. The δAIC was calculated before the large earthquake of M7.9 in 2000, M8.5 in 2007, and M7.8 in 2010. The result shows a significant positive gradient before the large earthquake event. It consistently happened for the three events that were evaluated.
Furthermore, the PSHF before large earthquake events is estimated at the three-point observation as a function of b(t). The PSHF parameter calculation is based on Triyoso and Suwondo (2022), where the starting locking depth at the top is 5 km (The 2017 PuSGen, 2017). In this study, the probabilistic seismic hazard is calculated by referring to the GMPE recommendation results of Triyoso and Suwondo (2022) in which, based on our present knowledge, the GMPE Zhao et al. (2006) tends to fit better, especially for the Sumatra subduction zone; thus, we refer to it. Referring to Triyoso and Suwondo (2022), the maximum radius distance of about 100 km with a magnitude range of 6.0–9.0 is used in PSHF estimation. The instantaneous PSHF is estimated based on the time windows, the same as the b(t) time length estimation, which is approximately 5 years.
Figure 6 shows the PSHF before M7.9 of 2000 (A), M8.5 of 2007 (B), and M7.8 of 2010 (C) as a function of b(t). It shows the consistency between a large positive gradient of δAIC and an increase in the PSHF at each certain probability exceedance (PE) level before the great earthquake event. It consistently happened for the three events that were evaluated. The results are consistent with the high reliability of the spatiotemporal b-value to estimate the PSHF around the study area. A different large δAIC has been shown before a large earthquake compared to the δAIC of starting observation time. In this study, we can find a similar behavior of the PSHF and the δAIC. The result showed that the SHF changed drastically with respect to Mw size or class. Therefore, it implies that using spatiotemporal b-value before a large earthquake for instantaneous PSHF seems to be reliable enough. Based on the finding, it is suggested that the result of this study might be very beneficial for PSHA and seismic mitigation realization.
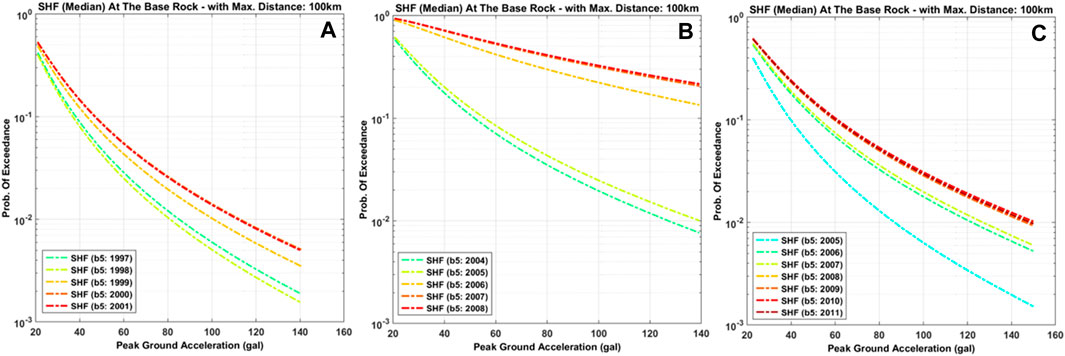
FIGURE 6. PSHF before M7.9 of 2000 (A), M8.5 of 2007 (B), and M7.8 of 2010 (C) as a function of b(t). It shows the consistency between a large positive gradient of δAIC and an increase in the PSHF at each certain probability exceedance (PE) level before the great earthquake event. It consistently happened for the three events that were evaluated.
5 Conclusion
An algorithm to better understand the reliability of the PSHF before large earthquake events has been proposed. The algorithm is based on the hypothesis earthquake forecast that is based on the AIC. This study found that the reliability of the use of b-value (DC) as a function of time and space before large earthquake events has been used as a seismic precursor could be evaluated. Furthermore, this study showed a quantity of δAIC with respect to Mw size or class. Therefore, a drastic change in the PSHF is found when δAIC is large enough. Furthermore, as the earthquake potency and PSHF are functions of the b-values (DC), applying the proposed method, we could measure how reliable the b-value (DC) is as the precursor before a large earthquake from the viewpoint of PSHA. The result of this study might be very beneficial for PSHA and seismic mitigation realization.
Data availability statement
The datasets presented in this study can be found in online repositories. The names of the repository/repositories and accession number(s) can be found in the article/supplementary material.
Author contributions
WT developed the main idea and algorithm and analyzed and prepared the figures and the manuscript.
Funding
This research was partly supported by the Riset P3MI ITB 2022 grant funded by the Research and Community Services program (LPPM), Institute of Technology, Bandung (ITB), Indonesia.
Acknowledgments
The author thanks the Global Geophysics Group, the Faculty of Mining and Petroleum Engineering, and the Bandung Institute of Technology for their support in producing this paper.
Conflict of interest
The authors declare that the research was conducted in the absence of any commercial or financial relationships that could be construed as a potential conflict of interest.
Publisher’s note
All claims expressed in this article are solely those of the authors and do not necessarily represent those of their affiliated organizations or those of the publisher, the editors, and the reviewers. Any product that may be evaluated in this article, or claim that may be made by its manufacturer, is not guaranteed or endorsed by the publisher.
References
Akaike, H. (1974). A new look at the statistical model identification. IEEE Trans. Autom. Control 19, 716–723. doi:10.1109/tac.1974.1100705
Aki, K. (1965). Maximum likelihood estimate of b in the formula log N = a bM and its confidence limits-. Bull. Earthq. Res. Inst. Tokyo Univ. 43, 237–239.
Álvarez, O., Pechuan Canet, S., Gimenez, M., and Folguera, A. (2021). Megathrust slip behavior for great earthquakes along the Sumatra- andaman subduction zone mapped from satellite GOCE gravity field derivatives. Front. Earth Sci. 8, 581396. doi:10.3389/feart.2020.581396
Bradley, K. E., Feng, L., Hill, E. M., Natawidjaja, D. H., and Sieh, K. (2017). Implications of the diffuse deformation of the Indian Ocean lithosphere for slip partitioning of oblique plate convergence in Sumatra. J. Geophys Res. Solid Earth 122, 572–591. doi:10.1002/2016jb013549
Caneva, A., and Smirnov, V. (2004). Using the fractal dimension of earthquake distributions and slope of the recurrence curve to forecast earthquakes in Colombia. Earth Sci. Res. J. 8, 3–9.
Console, R. (1998). Computer algorithms for testing earthquake forecasting hypotheses, ERI. The University of Tokyo.
El-fiky, G. S. A., Kato, T., and Oware, E. N. (1999). Crustal deformation and interplate coupling in the Shikoku district, Japan, as seen from continuous GPS observation. Tectonophysics 314 (1999), 387–399. doi:10.1016/s0040-1951(99)00226-7
Fitch, T. J. (1972). Plate convergence, transcurrent faults, and internal deformation adjacent to southeast Asia and the Western Pacific. J. Geophys. Res. 77, 4432–4460. doi:10.1029/jb077i023p04432
Frohlich, C., and Davis, S. (1993). Teleseismic b-values: Or, much ado about 1.0-. J. Geophys. Res. 98 (B1), 631–644. doi:10.1029/92jb01891
Gutenberg, B., and Richter, C. F. (1944). Frequency of earthquakes in California*. Bull. Seismol. Soc. Am. 34, 185–188. doi:10.1785/bssa0340040185
Hirata, T. (1989). Correlation between the b-value and the fractal dimension of earthquakes. J. Geophys. Res. 94, 7507–7514.
Jackson, D. D., and Kagan, Y. Y. (1999). Testable earthquake forecasts for 1999. SRL 70 (4), 393–403. doi:10.1785/gssrl.70.4.393
Jarrard, R. D. (1986). Terrane motion by strike-slip faulting of forearc slivers. Geology 14, 780–783. doi:10.1130/0091-7613(1986)14<780:tmbsfo>2.0.co;2
Kagan, Y. Y., and Jackson, D. D. (1995). New seismic gap hypothesis: Five years after. J. Geoph. Res. 100, 3943–3959. doi:10.1029/94jb03014
Khaerani, D., Meilano, I., Sarsito, D. A., and Susilo, D. (2018). “Deformation of West Sumatra due to the 2016 earthquake (M7.8) based on continuous GPS data,” in Proceedings of the 2018 IEEE Asia-Pacific Conference on Geoscience, Electronics and Remote Sensing Technology (AGERS), Jakarta, Indonesia, September 18–19, 2018.
Konca, A. O., Avouac, J. P., Sladen, A., Meltzner, A. J., Sieh, K., Fang, P., et al. (2008). Partial rupture of a locked patch of the Sumatra megathrust during the 2007 earthquake sequence. Nature 456 (7222), 631–635. doi:10.1038/nature07572
McClosky, J., Nalbant, S., and Steacy, S. (2005). Indonesian earthquake: Earthquake risk from co-seismic stress. Nature 434, 291. doi:10.1038/434291a
Megawati, K., and Pan, T. (2009). Regional seismic hazard posed by the mentawai segment of the sumatran megathrust. Bull. Seismol. Soc. Am. 99, 566–584. doi:10.1785/0120080109
Natawidjaja, D. H., Sieh, K., Chlieh, M., Galetzka, J., Suwargadi, B. W., Cheng, H., et al. (2006). Source parameters of the great Sumatran megathrust earthquakes of 1797 and 1833 inferred from coral microatolls. J. Geophys. Res. Solid Earth 111 (B6). doi:10.1029/2005jb004025
Nuannin, P., and Kulhánek, O. (2012). A study of b-value precursors applied to the andaman-sumatra region. J. Earth Sci. Eng. 2 (2012), 166–188.
Nuannin, P., Kulhánek, O., and Persson, L. (2012). Variations of b-values preceding large earthquakes in the Andaman–Sumatra subduction zone. J. Asian Earth Sci. 61, 237–242. doi:10.1016/j.jseaes.2012.10.013
Öncel, A. O., Alptekin, Ö., and Main, I. (1995). Temporal variations of the fractal properties of seismicity in the Western part of the North Anatolian fault zone: Possible artifacts due to improvements in station coverage. Nonlinear Process. Geophys. 2, 147–157.
Pailoplee, S., and Choowong, M. (2014). Earthquake frequency-magnitude distribution and fractal dimension in mainland Southeast Asia. Earth. Planets. Space. 66, 8.
Rafie, M. T., Cummins, P. R., Sahara, D. P., Widiyantoro, S., Triyoso, W., and Nugraha, A. D. (2021). Variations in forearc stress and changes in principle stress orientations caused by the 2004–2005 megathrust earthquakes in Sumatra, Indonesia. Front. Earth Sci. 9, 712144. doi:10.3389/feart.2021.712144
Roy, S., Ghosh, U., Hazra, S., and Kayal, J. R. (2011). Fractal dimension and b-value mapping in the Andaman-Sumatra subduction zone. Nat. Hazards. 57, 27–37.
Scholz, C. H. (1968). The frequency-magnitude relation of microfracturing in rock and its relation to earthquakes. Bull. Seism. Soc. Am. 58, 399–415. doi:10.1785/bssa0580010399
Sevilgen, V., Stein, R. S., and Pollitz, F. F. (2012). Stress imparted by the great 2004 Sumatra earthquake shut down transforms and activated rifts up to 400 km away in the Andaman Sea. Proc. Natl. Acad. Sci. 109 (38), 15152–15156. doi:10.1073/pnas.1208799109
Shamim, S. K., Khana, P. K., and Mohanty, S. P. (2019). Stress reconstruction and lithosphere dynamics along the Sumatra subduction margin. J. Asian Earth Sci. 170 (2019), 174–187. doi:10.1016/j.jseaes.2018.11.008
Sieh, K., and Natawidjaja, D. H. (2000). Neotectonics of the Sumatran Fault, Indonesia. J. Geophys. Res. 105, 28295–28326. doi:10.1029/2000jb900120
Tim Pusat Studi Gempa Nasional-2017 (The 2017 PuSGen) (2017). Peta sumber dan bahaya gempa Indonesia tahun 2017. Jakarta: Kementrian Pekerjaan Umum dan Perumahan Rakyat. (In Indonesian).
Triyoso, W., and Sahara, D. P. (2021). Seismic hazard function mapping using estimated horizontal crustal strain off West Coast Northern Sumatra, Front. Earth Sci. 28. doi:10.3389/feart.2021.558923
Triyoso, W., Sahara, D. P., Sarsito, D. A., Natawidjaja, D. H., and Sukmono, S. (2022). Correlation dimension in Sumatra island based on active fault, earthquake data, and estimated horizontal crustal strain to evaluate seismic hazard functions (SHF). GeoHazards, MDPI, 3, 227–241. doi:10.3390/geohazards3020012
Triyoso, W., and Shimazaki, K. (2012). Testing various seismic potential models for hazard estimation against a historical earthquake catalog in Japan. Earth Planets Space 64, 673–681. doi:10.5047/eps.2011.02.003
Triyoso, W., and Suwondo, A. (2022). From the geodynamic aspect to earthquake potential hazard analysis of Liwa city and its surrounding. Nat. Hazards 116, 1329–1344. doi:10.1007/s11069-022-05705-0
Triyoso, W., Suwondo, A., Sahara, D. P., and Sarsito, D. A. (2021). Earthquake potential hazard around off coast the West sumatra-bengkulu: Application spatial correlation between estimated SHmax and correlation dimension. Proceedings of the 18th Annual Meeting of the Asia Oceania Geosciences Society (AOGS 2021), August 1-6, 2021, Singapore.
Triyoso, W., Suwondo, A., Yudistira, T., and Sahara, D. P. (2020). Seismic hazard function (SHF) study of coastal sources of Sumatra island: SHF evaluation of padang and bengkulu cities, Geosci. Lett. 7:2. doi:10.1186/s40562-020-00151-x
Triyoso, W., and Yuninda, O. (2022) Seismic hazard function (SHF) study prior to large earthquake event of the year 1994 and 2006 off coast of the java island: The SHF analysis based on the change of the b-value. Proceedings of the 19th Annual Meeting of the Asia Oceania Geosciences Society (AOGS 2021), August 1-5, 2022, Singapore.
Utsu, T. (1978). Estimation of parameters in formulas for frequency-magnitude relation of earthquake occurrence. Zisin 31, 367–382. doi:10.4294/zisin1948.31.4_367
Vere-Jones, D. (1995). Forecasting earthquakes and earthquake risk, Int. J. Forecast., 11, 503–538. doi:10.1016/0169-2070(95)00621-4
Wiemer, S. (2001). A software package to analyze seismicity: Zmap. Seismol. Res. Lett. 72 (2), 373–382. doi:10.1785/gssrl.72.3.373
Wyss, M., Sammis, C. G., Nadeau, R. M., and Wiemer, S. (2004). Fractal dimension and b-value on creeping and locked patches of the san andreas fault near parkfield, californiafield, California. Bull. Seism. Soc. Am. 94, 410–421. doi:10.1785/0120030054
Yusfania, M., Meilano, I., and Sarsito, D. A. (2014). “The utilization of spatial filtering for tectonic strain study based on SUGAR (SUMATRAN GPS ARRAY) data 2006–2008 study case: The September 2007 Bengkulu earthquake, (7226),” in FIG Congress 2014 Engaging the Challenges—Enhancing the Relevance.
Zachariasen, J., Sieh, K., Taylor, F. W., and Hantoro, W. S. (2000). Modern vertical deformation above the sumatran subduction zone: Paleogeodetic insights from coral microatolls. Bull. Seismol. Soc. Am. 90, 897–913. doi:10.1785/0119980016
Keywords: AIC, likelihood of success and failure, seismic potency, b-value, PSHF
Citation: Triyoso W (2023) Probabilistic seismic hazard function based on spatiotemporal earthquake likelihood simulation and Akaike information criterion: The PSHF study around off the west coast of Sumatra Island before large earthquake events. Front. Earth Sci. 11:1104717. doi: 10.3389/feart.2023.1104717
Received: 21 November 2022; Accepted: 27 March 2023;
Published: 12 April 2023.
Edited by:
Fuqiong Huang, China Earthquake Networks Center, ChinaReviewed by:
Paresh Nath Singha Roy, Indian School of Mines, IndiaXiaoqing Wang, Institute of Earthquake Forecasting, China Earthquake Administration, China
Copyright © 2023 Triyoso. This is an open-access article distributed under the terms of the Creative Commons Attribution License (CC BY). The use, distribution or reproduction in other forums is permitted, provided the original author(s) and the copyright owner(s) are credited and that the original publication in this journal is cited, in accordance with accepted academic practice. No use, distribution or reproduction is permitted which does not comply with these terms.
*Correspondence: Wahyu Triyoso, d3RyaXlvc29AZ21haWwuY29t