 Calvin Shackleton1,2
 Henry Patton2*
 Monica Winsborrow2
 Mariana Esteves2
 Lilja Bjarnadóttir3
 Karin Andreassen2
- 1Norwegian Polar Institute, Tromsø, Norway
- 2CAGE—Centre for Arctic Gas Hydrate, Environment and Climate, Department of Geosciences, UiT the Arctic University of Norway, Tromsø, Norway
- 3Geological Survey of Norway (NGU), Trondheim, Norway
The flow of glacial ice is impacted by basal meltwater drainage systems that fluctuate on a continuum from distributed, high-pressure environments to channelized, lower pressure networks. Understanding the long-term development of dominant drainage modes and impacts on ice flow and landform development is a crucial step in predicting palaeo and contemporary ice-mass response to changes in climate. The spatial and temporal scales at which different drainage modes operate are largely unknown, and the geomorphological legacy of subglacial meltwater networks that evolve over a glaciation provide composite records of drainage system development. Here, we use high-resolution bathymetric data from shallow banks in the central Barents Sea to map the geomorphological imprint of meltwater drainage beneath the collapsing marine-based Barents Sea Ice Sheet (BSIS). We observe a succession of distinct meltwater landforms that provide relative timing constraints for subglacial drainage modes, indicating that extensive networks of channelized drainage were in operation during deglaciation. Interlinked basins and channels suggest that meltwater availability and drainage system development was influenced by filling and draining cycles in subglacial lakes. Networks of eskers also indicate near-margin meltwater conduits incised into basal ice during late-stage deglaciation, and we suggest that these systems were supplemented by increased inputs from supraglacial melting. The abundance of meltwater during the late stages of BSIS deglaciation likely contributed to elevated erosion of the sedimentary substrate and the mobilisation of subglacial sediments, providing a sediment source for the relatively abundant eskers found deposited across bank areas. A newly discovered beaded esker system over 67 km long in Hopendjupet constrains a fluctuating, but generally decelerating, pace of ice retreat from ∼1,600 m a−1 to ∼620 m a−1 over central Barents Sea bank areas during a 91-year timespan.
1 Introduction
Water pressures at the beds of glaciers and ice sheets exert a crucial control on ice-flow dynamics (Iken, 1981; Bartholomew et al., 2010; Sole et al., 2011) by modulating the lubrication of the ice-bed interface and subglacial sediment shear strengths (Alley, 1989). Two end-member modes of meltwater drainage are typically envisaged at the ice-bed iterface: channelised flow incised into the bed and/or overlying ice, and distributed drainage systems consisting of linked networks of cavities (Anderson et al., 1982; Walder, 1986) or water films/sheets (Alley, 1989; Creyts and Schoof, 2009). Fluctuations between subglacial drainage modes are driven by processes operating at diurnal, seasonal and decadal timescales (Shepherd et al., 2009; Cowton et al., 2013; Andrews et al., 2014; Tedstone et al., 2015) and beyond (Alley et al., 2006), making the underlying causes for variability difficult to differentiate. Adding to this uncertainty are episodic events such as subglacial lake drainage and re-filling, controlled by meltwater supply and shifting ice dynamics and geometry (Wingham et al., 2006; Stearns et al., 2008; Fricker and Scambos, 2009; Smith et al., 2017), which has been hypothesised to initiate and sustain fast ice flow (Bell et al., 2007; Fricker et al., 2007; Stearns et al., 2008). Conversely, sudden large-volume water injections have also been observed to have little to no influence on ice flow speed (e.g., Smith et al., 2017), indicative of low-impact basal hydrological systems.
Geomorphological records preserved on deglaciated beds offer valuable insights into the long-term evolution of ice sheets and their subglacial hydrological systems (e.g., Clark and Walder, 1994; Huus and Lykke-Andersen, 2000; Greenwood and Clark, 2009; Nitsche et al., 2013; Storrar et al., 2014; Livingstone et al., 2015; Simkins et al., 2017; Dewald et al., 2021; Hogan et al., 2022; Kirkham et al., 2022). The importance of subglacial water in facilitating late-stage deglaciation of the Arctic- and marine-based Barents Sea Ice Sheet (BSIS) is becoming increasingly apparent, with an abundance of subglacial meltwater features including meltwater channels, tunnel valleys (up to several kilometres wide, hundreds of metres deep valleys often containing quasi-parallel channels), subglacial lakes, and eskers recently documented in the central Barents Sea (Bjarnadóttir et al., 2014; Esteves et al., 2017; Newton and Huuse, 2017; Dowdeswell et al., 2021). The Barents Sea region has relatively thin glacial sediment cover (typically <100 m) (Solheim and Kristoffersen, 1984), and generally low present-day sedimentation rates around 2–5 cm ka-1 (Elverhøi et al., 1989), making it an ideal location for geomorphological study with relatively little post-glacial landscape modification. Where sediments are present, a common feature of the Barents seafloor are the numerous pockmark fields (Rise et al., 2015), including in our study areas, with individual features generally 20–50 m wide and 2–5 m deep. They are commonly associated with focused fluid flow, either from current or past migration of hydrocarbons from an underlying reservoir (Hovland et al., 2010) or during hydrate dissociation following the last deglaciation (Pau et al., 2014).
Here, we use high-resolution multibeam bathymetry data to map nearly 90 km of previously undocumented eskers and expand existing mapping of meltwater drainage landforms in the central Barents Sea (Figure 1). We focus on two regions: 1) Thor Iversen-banken - a shallow (<190 m deep) bank which formed the eastern catchment boundary for the Sentralbankrenna Ice Stream; and 2) Hopendjupet—a <350 m-deep trough approximately 150 km further North. Both regions formed part of the onset zone for the Bjørnøyrenna Ice Stream during the Last Glacial Maximum (LGM; 24-19 ka BP), whilst Thor Iversen-banken also contributed ice to the Sentralbankrenna Ice Stream, which during peak glaciation was a major tributary feeding the Bjørnøyrenna Ice Stream to the west (Figure 1) and remained a distinct ice stream during the later stages of ice retreat through the central Barents Sea (Bjarnadóttir et al., 2014; Esteves et al., 2017; Newton and Huuse, 2017). Combining new and previously documented glacial and meltwater landforms (Bjarnadóttir et al., 2017; Esteves et al., 2017; Newton and Huuse, 2017) we reconstruct the dominant subglacial drainage modes during early-stage and late-stage deglacial phases, then discuss the potential impacts of evolving subglacial drainage systems on the marine-based ice sheet during retreat after the LGM period. Finally, we analyse a newly discovered, extensive beaded-esker system to quantitatively infer interannual rates of ice-sheet collapse through the central Barents Sea.
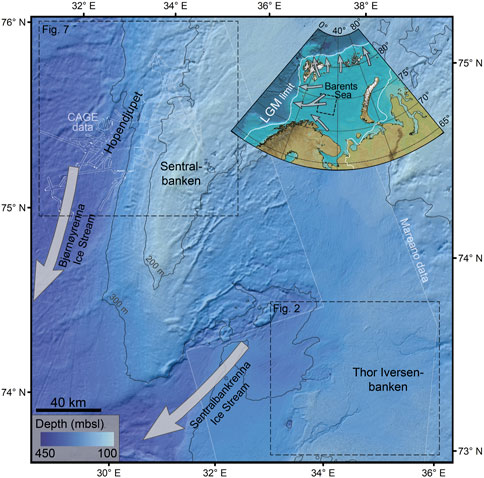
FIGURE 1. Regional bathymetry (IBCAO v4.2: Jakobsson et al., 2020) of Sentralbankrenna and Sentralbanken with multibeam swath bathymetric data extents collected by the Centre for Arctic Gas Hydrates, Environment and Climate (CAGE) and provided by the MAREANO Programme overlain in white. White arrows show the flow direction of former ice streams. Inset map highlights the glacial setting within the wider Barents Sea system, with arrows showing the flow direction of major palaeo-ice streams and the white line indicating maximum ice margin extents during the Last Glacial Maximum (LGM).
2 Methods and data
Geophysical surveys of Thor Iversen-banken and parts of Sentralbankrenna were undertaken using Kongsberg EM170 and EM2040 echosounders on-board the R/V G.O. Sars, and bathymetric maps with horizontal resolution of 5 m were acquired by the MAREANO programme (www.mareano.no) and provided by the Norwegian Hydrographic Service. Multibeam echosounder data over Hopendjupet were collected during Centre for Arctic Gas Hydrates, Environment and Climate (CAGE) cruises CAGE_17–2 (Panieri et al., 2023), CAGE_20–2 (Patton et al., 2022a), CAGE_21–4 (Winsborrow et al., 2022), CAGE_21–6 (Winsborrow and Knies, 2022), and CAGE 22-6 (Serov et al., 2022) on-board R/V Helmer Hanssen and R/V G.O. Sars. Data were collected using a hull-mounted Kongsberg Simrad EM302 system at a ping rate of ∼0.7 Hz and processed in QPS Qimera software v2.4 to remove erroneous pings and interpolate an 8 m horizontal resolution grid. Sound-velocity profiles regularly collected using a SBE 911plus CTD during surveying were used to depth convert the multibeam pings. Regional bathymetry is based on the International Bathymetric Chart of the Arctic Ocean (IBCAO V4.2; Jakobsson et al., 2020). Mapping and geospatial analysis of the geomorphology was carried out using ESRI ArcMap v10.1, QGIS v3.28, and QPS Fledermaus software v7.8.
3 Results and interpretation
We present new geomorphological evidence for subglacial drainage including nearly 90 km of previously undocumented esker ridges across five sites in the central Barents Sea. Newly mapped geomorphology from Thor Iversen-banken includes sinuous to linear, and beaded ridges of sediments that are interpreted as eskers which occur across a range of ice-dynamic and bathymetric settings (Sections 3.1 and 3.2). We also expand previously documented meltwater channel and tunnel valley systems with new mapping and analysis (Section 3.3). All features in Hopendjupet are mapped from high-resolution multibeam data for the first time. Water depths cited in the landform descriptions reflect the present-day bathymetry and sea-level. Based on reconstructions made from previously interpreted glacial landforms in this region (Bjarnadóttir et al., 2014; 2017; Esteves et al., 2017; Newton and Huus, 2017), and numerical modelling (Patton et al., 2017), we follow the assumption that grounded ice over the mapped areas described here on Thor Iversen-banken and Sentralbanken generally flowed west/southwest, feeding the larger ice streams of Sentralbankrenna and Bjørnøyrenna, respectively.
3.1. Continuous eskers
Sinuous to linear elongated ridges observed on the seafloor are interpreted as eskers based on their similarity to reported esker dimensions, morphologies and relationships to other glacial and meltwater landforms (Clark and Walder, 1994; Boulton et al., 2009; Storrar et al., 2013; 2015). Four sites containing eskers on Thor Iversen-banken and one esker site in Hopendjupet are described and interpreted (Figure 2). All 7 esker systems on Thor Iversen-banken are located between 220 m and 305 m water depth, and are found overprinting, leading into, or located within the floors of meltwater channels and tunnel valleys (Section 3.3) (Bjarnadóttir et al., 2017; Esteves et al., 2017; Newton and Huuse, 2017). Eskers are distinguished from other ridge features on the seafloor such as retreat moraines (e.g., Ottesen and Dowdeswell, 2006) and crevasse-squeeze ridges (e.g., Evans et al., 2016) based on their arrangement into dendritic or anabranching networks, undulating ridge crests, distinct sinuosity reflecting drainage conduit topology, and occurrence along the banks, floors and leading into meltwater channels, tunnel valleys and palaeo-subglacial lake basins (Hebrand and Åmark, 1989; Clark et al., 2004; Margold and Jansson, 2012; Storrar et al., 2013; 2015; Livingstone et al., 2016; Perkins et al., 2016; Stroeven et al., 2016).
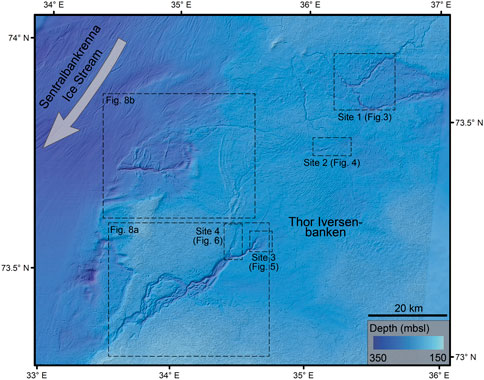
FIGURE 2. Shaded relief map created from the MAREANO bathymetric data over Thor Iversen-banken and Sentralbankrenna, with the locations of study sites (Sites 1-4).
Site 1 (Figure 3) contains two esker segments, both closely associated with a dendritic tunnel valley system and meltwater channel network on northern Thor Iversen-banken (Newton and Huuse, 2017). The esker ridges are in places oriented parallel to the tunnel valley, running along the banks as well as cutting across the channel obliquely. The esker in the eastern part of site 1 (Figure 3B) is consistently 4 m high (b-b’) and is traced for 9 km but is disconnected in places, with some anabranching. It has a smooth surface and variable width, mostly between 50 and 70 m, extending along the banks of the tunnel valley and crossing obliquely at three locations. The esker in the western part of site 1 (Figure 3C) has a rough surface, and is 4.5 km long, terminating on the banks of the tunnel valley. The main trunk of the esker is at least 10 m high (a-a’), and is slightly wider to the north, with an average width of 150 m.
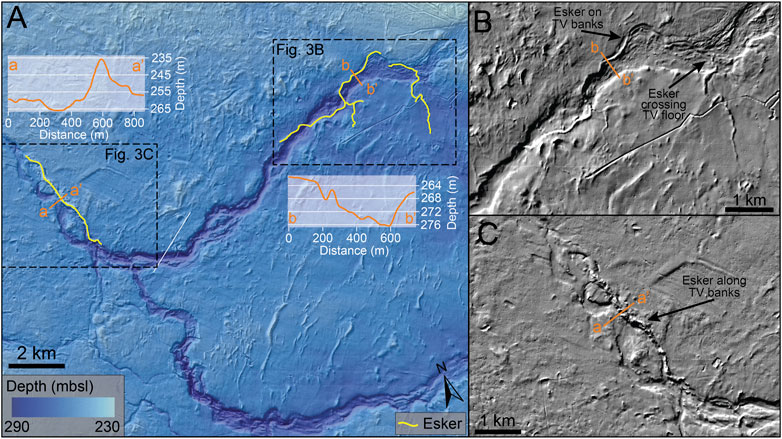
FIGURE 3. Site 1: (A) Shaded relief map with two eskers and profiles (a-a’, b-b’) on the north of Thor Iversen-banken within an east-west draining tunnel valley (Newton and Huuse, 2017). (B) Hillshade map of an esker ridge crossing the tunnel valley floor and situated along its banks. (C) Hillshade map of an esker ridge extending parallel to the banks of the tunnel valley.
Site 2 (Figure 4) is located on northern Thor Iversen-banken between 240 and 270 m water depth. The eastern end of the esker system is anabranching and lies on a complex network of smaller ridges, making it difficult to distinguish between the two landforms. The northern branch of the esker ridge is up to 60 m wide, 8 m high, and oriented approximately east-west, extending towards one of the smaller meltwater channel tributaries which extends north-westwards towards the dendritic tunnel valley network. The southern branch of the esker ridge is 50–70 m wide, 4 to 6 m high, and has a 90° shift in orientation, SSW to WNW, terminating 4 km to the west. The western end of this esker runs alongside a short (3 km) channel, and forms a complex, overlapping network of ridges 1 km in length, with a ridge up to 14 m high and 230 m wide (Figure 4) at the western extent.
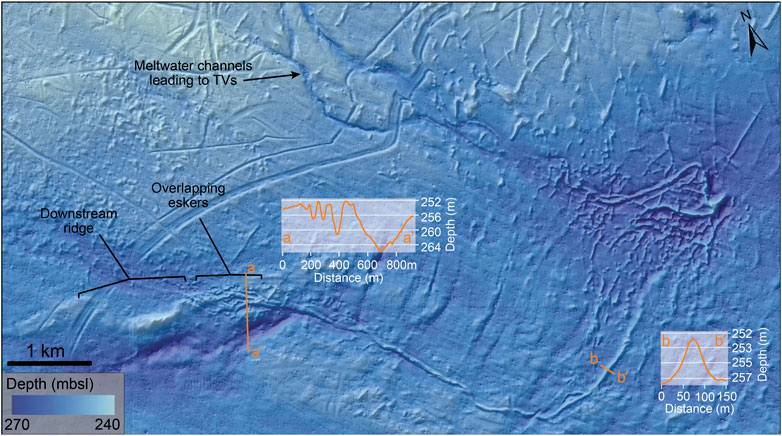
FIGURE 4. Site 2: Shaded relief map and profiles (a-a’, b-b’) of complex esker ridges on northern Thor Iversen-banken.
Sites 3 and 4 (Figures 5, 6) are located at 250–290 m water depth in an area of relatively smooth seafloor upstream of a braided tunnel valley, oriented NE-SW (Section 3.3) that terminates at the lateral margin of fast flowing ice in Sentralbankrenna (Esteves et al., 2017). Singular and overlapping ridges lead directly into downstream meltwater channels (Site 4; Figures 5A, 6) rather than along their banks, as observed at site 1 (Figure 3). To the southwest, several isolated ridges, and one system of overlapping ridges are observed in a tunnel valley floor (Figure 5A), some of which were described previously by Bjarnadóttir et al. (2017).
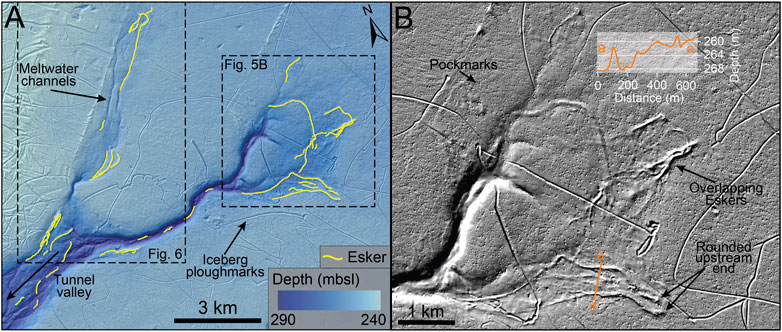
FIGURE 5. Site 3: (A) Singular and multiple overlapping esker ridges on a relatively smooth sector of the seafloor upstream of the tunnel valley. The multi-ridged esker to the southwest of the site was identified by Bjarnadóttir et al. (2017). (B) Hillshade map and cross profile (a-a’) of eskers, highlighting the rounded upstream ends of some features.
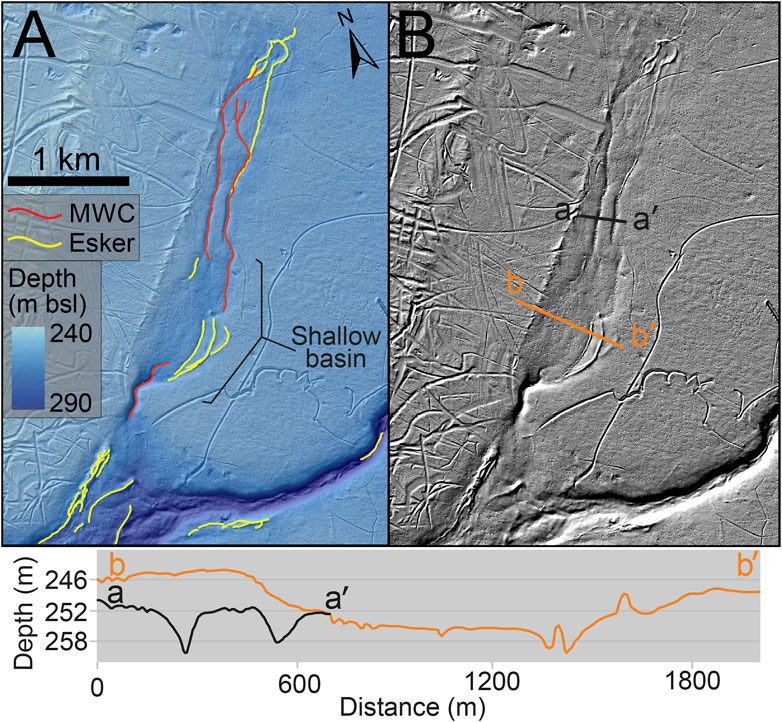
FIGURE 6. Site 4: (A) Meltwater landforms at the upstream end of a tunnel valley. (B) Hillshade map and profiles across two parallel channels (a-a´) and a shallow basin with esker ridges along the eastern bank (b-b´). MWC = meltwater channels.
Site 3 (Figure 5B) contains numerous interlinked esker ridges that range mostly from sinuous to arcuate but are occasionally linear. The overlapping system of ridges to the north-east is a maximum of 130 m wide and 10 m high. The ridge to the north initiates (presuming an east-to-west flow direction) as a rounded mound up to 7 m high and 100 m wide, and tapers to a uniform ridge 40 m wide, leading directly into a downstream channel. The upstream ends of eskers to the South of the shallow basin are also characterised by rounded mounds approximately 100 m wide and 4 m high, that taper downstream towards the tunnel valley (Figure 5B). These two esker ridges are approximately parallel, and initiate 200 m apart, consistently <1 km apart as they extend downstream towards the tunnel valley.
Site 4 (Figure 6) is also located upstream of the braided tunnel valley, although in a different tributary to observations described at site 3. To the north, sinuous ridges 3 to 5 m high and 50 m wide are also interpreted as eskers based on their similar form and connectivity to meltwater channels. Two of the ridges are near-parallel for 800 m and the western ridge dissipates at the start of a 3.3 km long sinuous channel (cf. Section 3.3). The upstream end of this esker also has an 8 m high, 90 m wide rounded mound which tapers to 50 m downstream. The eastern esker ridge extends for a total of 2.8 km, with a similar sharp boundary between the end of the ridge and a channel 90 m wide and 6 m deep. Between the two previously described eskers, a single, arcuate ridge branches from the western esker, which terminates 400 m downstream at the start of the channel. Further downstream, along the edges of a relatively featureless basin (Figure 6B; cf. Section 3.3) are two arcuate esker ridges up to 1.5 km long and a maximum of 60 m wide, with an 8 m high, <100 m diameter mound to the north and smaller arcuate ridge to the east.
Two sets of continuous eskers are found at Site 5 in Hopendjupet (Figure 7). The first is a 20 km long ridge that can be traced along the base of the tunnel valley contouring the edge of Sentralbanken at around 300 m below sea level, continuing beyond available multibeam data. Its dimensions are 2–5 m high and <50 m wide. Where the tunnel valley bifurcates, the sediment ridge also splits. A second ridge is observed continuing from the termination of the main tunnel valley draining off northern Sentralbanken. This ridge is significantly larger, reaching maximum dimensions of 20 m high and 500 m wide, and extends 45 km downstream into Hopendjupet down to 380 m below present sea level. Along the majority of its length its morphology is that of a singular ridge, though for 11 km it transitions into an anabranching form (Figure 7A).
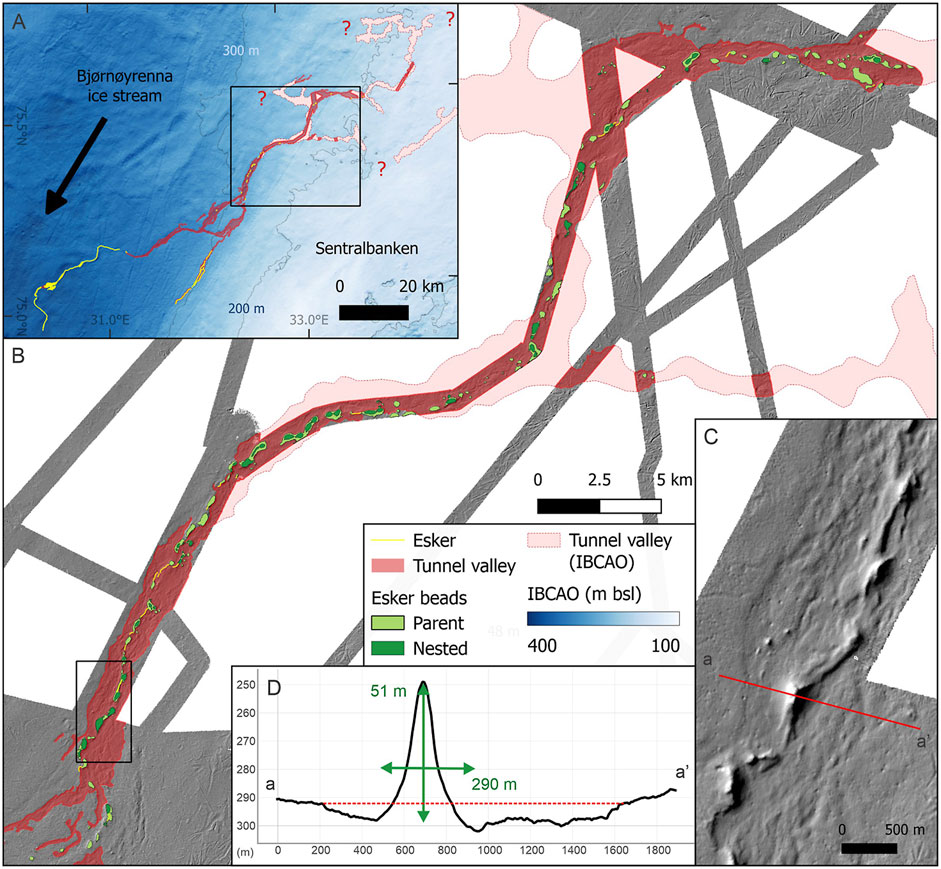
FIGURE 7. (A-B) The Hopendjupet tunnel valley and beaded-esker system, extending upstream onto Sentralbanken. (C) A closer view of beads towards the southern end of the esker chain. (D) Dimensions of individual beads reach up to ∼50 m in height, and ∼300 m in width. Dimensions of the tunnel valley (red dashed line) vary from 8 to 12 m deep and 300–1500 m wide.
3.2 Beaded eskers
In Hopendjupet, a sinuous chain of 144 well-organised elongated and aligned ridges, visible over a transect spanning >67 km, is interpreted as a beaded esker (Figure 7B). Individual beads range in height from 10 to 50 m and extend up to 600 m in length, with morphology generally reducing in volume upstream, down to c. 200 m in length to the northeast. Often beads appear cojoined with their downstream neighbours by a streamlined sediment accumulation. Such composite features are differentiated as “parent” beads, with multiple mounds contained within identified as “nested” beads. The esker system drapes and follows the base and flanks of a major tunnel valley draining southwest out of Hopendjupet, in water depths today between 200 and 315 m. In a few localities smaller beads are found beyond the principal chain, and further swaths of multibeam data indicate the upstream end of the beaded chain continues further onto the bank into un-surveyed seafloor. Apart from the main tunnel valley, the esker beads are not associated with any other landforms such as ice-contact fans or De Geer moraines.
3.3 Meltwater channels, tunnel valleys and subglacial lake basins
Previous work has documented meltwater channels, tunnel valleys, and interconnected basins in Thor Iversen-banken (Bjarnadóttir et al., 2017; Esteves et al., 2017; 2022; Newton and Huuse, 2017). Using new bathymetry data provided by the Norwegian Hydrographic Service through the MAREANO programme, we build on this previous work to map hitherto undocumented meltwater channels and tunnel valleys (Figures 6, 8, 9). These landforms are distinguishable from other linear to sinuous seafloor incisions such as iceberg ploughmarks (e.g., Ó Cofaigh et al., 2012; Dowdeswell and Hogan, 2016) by their undulating long profile, often wide, flat valley floors, and their dendritic, braided or anastomosing topology (Piotrowski, 1994; Ó Cofaigh, 1996; Hooke and Jennings, 2006; Kehew et al., 2012; Livingstone and Clark, 2016). Although many iceberg ploughmarks have similar depths, widths and sinuosity as meltwater channels, they are readily distinguishable by their sudden changes in orientation, cross cutting relationships with other features, and the presence of flanking berms (Figure 6B).
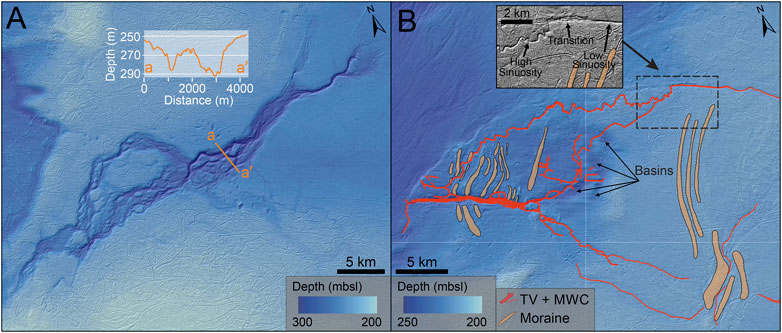
FIGURE 8. (A) A braided tunnel valley terminating to the west in Sentralbankrenna (Bjarnadóttir et al. (2017) (B) Interlinked basins, downstream tunnel valley, and moraine ridges, first described by Bjarnadóttir et al. (2017). Moraine ridges and meltwater channel mapping in B is adapted from previously published work (Esteves et al., 2017; Newton and Huuse, 2017).
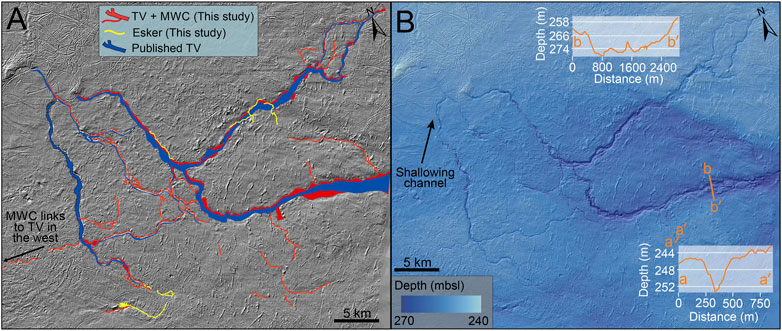
FIGURE 9. (A) Dendritic network of tunnel valleys and meltwater channels on northern Thor Iversen-banken, including those published in previous studies (Newton and Huuse, 2017) and additional landforms presented and mapped in this study. (B) Shaded relief map and profiles showing dimensions of the tunnel valley system and meltwater channels mapped in (A).
Many of the eskers documented in this study (Sections 3.1 and Section 3.2) are located along the banks or channel-floor of erosional meltwater landforms (Figures 3–6). A braided tunnel valley on Thor Iversen-banken (Figure 8A) consists of wide-floored channels, up to 5 km wide and 40 m deep, that contain braided or anastomosing meltwater channels (Bjarnadóttir et al., 2017). To the north of this lies an assemblage of subglacial drainage landforms comprised of a complex network of interlinked basins and downstream tunnel valleys that breach marginal moraines (Figure 8B). This system is fully described in previous work (Bjarnadóttir et al., 2017; Esteves et al., 2017; Newton and Huuse, 2017), though we note a previously undescribed transition between meltwater channels of low sinuosity and high sinuosity, which coincides with the location of arcuate retreat moraines. We also observe a smooth basin at the edge of Sentralbankrenna (Figure 8A), 9 km2 in extent and up to 60 m deeper than the surrounding seafloor. To the northeast of this, Esteves et al. (2017) describe a sinuous meltwater channel stretching along the sharp boundary between Thor Iversen-banken and the deeper Sentralbankrenna (Figure 10).
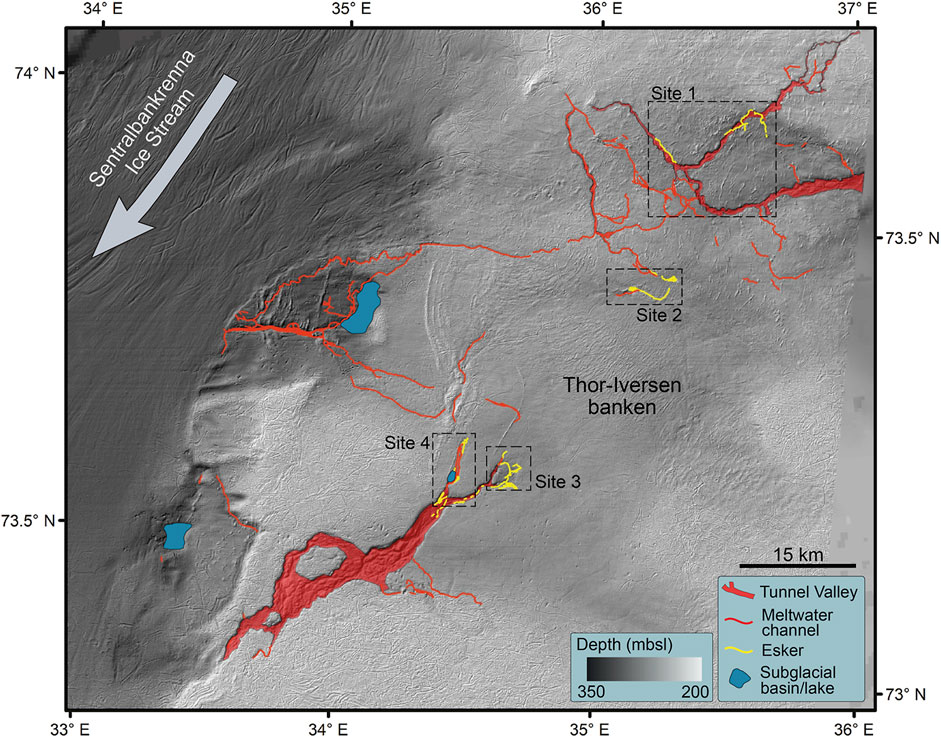
FIGURE 10. Mapped subglacial drainage features over Thor Iversen-banken, with landforms presented and mapped in this study merged with those from previous studies (Bjarnadóttir et al., 2017; Esteves et al., 2017; Newton and Huuse, 2017).
On northeast Thor Iversen-banken meltwater channels and tunnel valleys (Figure 9), first described by Newton and Huuse (2017), can be traced up to 50 km, extending beyond available bathymetry data to the east. The northwest sector of this tunnel valley system becomes shallower and locally smoother seafloor (apart from post-retreat iceberg ploughmarks) suggests a draping of seafloor sediment (Figure 9B), although this could also originate from less erosive drainage. We present previously undocumented tributary channels associated with this tunnel valley, with widths varying from <10 m to hundreds of metres (Figure 9B). We interpret these to be subglacially formed meltwater channels based on a higher sinuosity and lack of flanking berms compared to surrounding iceberg ploughmarks, as well as the dendritic branching in channels and their connectivity to surrounding meltwater features. These channels add to the previously published record of subglacial drainage over northern Thor Iversen-banken, and we expand previously mapped tunnel valley extents using our high-resolution bathymetry data and cross-channel profiles to reveal tunnel valley widths. Compared to a global inventory compiled by Kirkham et al. (2020), these tunnel valleys on Thor Iversen-banken are relatively wide, but shallow; the largest tunnel valleys in our study areas are at the upper end of the global range in terms of width (over 5 km at the widest point) but on the lower end of the scale in terms of channel depths (mostly <100 m).
At Site 4 several small eskers (Section 3.1; Figures 5, 6) lead into ∼6 m deep, 50 to 100 m-wide quasi-parallel channels, interpreted as meltwater channels similar to those previously described. These channels extend up to 3 km, and terminate in a relatively featureless basin, 2.3 km long, 1.3 km wide and 10 m deep (Figure 6A). The eastern banks of the basin contain arcuate ridges that we interpret to be eskers (Section 3.1), and the downstream end of the basin funnels into a deep, narrow meltwater channel with a system of overlapping esker ridges immediately downstream, which feeds into a braided tunnel valley (Bjarnadóttir et al., 2017). This basin is similar in form (i.e., several km-scale patches of smooth terrain relative to its surroundings) and has similar surrounding geomorphology (short meltwater channels leading into an esker) to flat spots interpreted to be the site of shallow subglacial lakes in Canada (Livingstone et al., 2016). Repeated filling and draining of a subglacial lake at Site 4 could be a potential mechanism and water source for the erosion of meltwater channels and contributions to the braided tunnel valley system downstream. Furthermore, late-deglacial stage lake drainage events close to a retreating ice margin have been suggested to form downstream eskers (Livingstone et al., 2016), providing a plausible mechanism for incising channels into ice and depositing the esker complex that lies 1.3 km downstream on the floor of the tunnel valley (Figure 6B).
At Site 5, a 125 km-long tunnel valley system first identified from the Olex (www.olex.no) bathymetric database (Bjarnadóttir et al., 2017) and mapped here from high-resolution multibeam echosounder data for the first time, can be traced from Sentralbanken into the adjacent Hopendjupet (Figure 7). Its dimensions vary between 8 and 12 m deep and 300–1500 m wide, and spans water depths ranging from 190 to 360 m. The tunnel valley network follows a more braided pattern on the shallower bank areas, while the downstream water flow was confined to two major branches—one that contours the base of Sentralbanken flank and another that trends southwest into the deeper waters of Hopendjupet. In multiple locations adjacent to the main tunnel valley trunk, shallow (<5 m) basins can be found, sometimes with smaller tributary channels leading into and away from, or in some cases on the bank area, within the basin too. At its downstream end in Hopendjupet, the tunnel valley transitions into a continuous and variously anabranching esker system that can be traced into water depths today of 385 m.
4 Discussion
4.1 Subglacial drainage in the central Barents Sea
Our geomorphological mapping expands the documentation of vast meltwater drainage networks over Thor Iversen-banken (Figure 10) and outlines a new subglacial drainage system within Hopendjupet (Figure 7). This compilation of meltwater landforms, mapped across a ∼275 km-wide domain of the central Barents Sea, forms the basis for reconstructing the dominant modes of water drainage while ice was still flowing in Sentralbankrenna and during later stages of retreat when ice was retreating over Thor Iversen-banken. We use the Thor Iversen-banken study area to conceptually illustrate this evolution of the central BSIS subglacial-hydrological system through deglaciation (Figure 11).
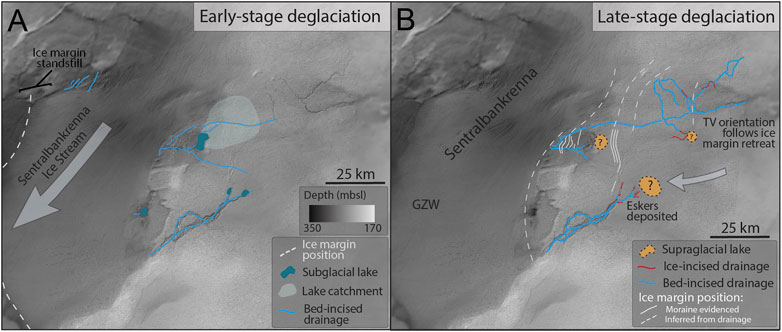
FIGURE 11. Reconstruction of subglacial meltwater drainage during deglaciation (A) Early-stage deglaciation while ice was still flowing in Sentralbankrenna and (B) towards the later stages of deglaciation and ice retreat over Thor Iversen-banken. Substrate-incised channels in the north-west are included from previously published mapping of meltwater channels and tunnel valleys (Bjarnadóttir et al., 2017; Esteves et al., 2017). A conservative catchment for the interlinked basins is estimated to provide lake fill rates (Supplementary Figure 1). GZW=Grounding Zone Wedge.
Subglacial drainage system development is influenced by lake filling and drainage cycles, seasonal fluctuations in meltwater supply where ice surface to bed connections are established, and on longer timescales associated with ice-sheet fluctuations. Also, distributed drainage systems have a low capacity for erosion and deposition, and evidence for these systems is generally absent from the landform record (cf. Greenwood et al., 2016). Reconstructions of subglacial drainage based on meltwater landforms therefore generally reflect the dominant, most geomorphically effective mode of drainage. Water drainage also likely utilizes existing depressions (e.g., channels and tunnel valleys) that formed either during previous seasons, at different phases of ice advance/retreat, or throughout multiple glacial cycles. However, based on the surrounding glacial landforms, knowledge of the conditions required to form geomorphological features, and the relative timing of events based on cross-cutting relationships, it is possible to establish the ice sheet evolution phase in which various subglacial drainage modes were active.
4.2 Drainage during early-stage deglaciation
Chronological data and contemporaneous margin positions for the onset and development of deglaciation northwards through Bjørnøyrenna towards Hopendjupet, and through the Central Barents Sea, are very poorly constrained (Hughes et al., 2016). The nearest radiocarbon-dated information from a Grounding Zone Wedge (GZW) in outer Bjørnøyrenna provides a maximum age for this stage ranging from 16.6-14.7 ka BP, depending on the choice of calibration curve used (Ruther, 2011; Brendryen, 2020).
As deglaciation proceeded across the central Barents Sea (Figure 11A), the Sentralbankrenna and Bjørnøyrenna ice streams remained active (Figure 1; Bjarnadóttir et al., 2014; Esteves et al., 2017). Meltwater flow through the channels bordering Sentralbankrenna and Hopendjupet was towards the trough and channels terminate abruptly at the trough edge (Figure 10), suggesting that they were truncated by this fast-flowing ice, or were buried as ice retreated. The vast size and braiding of the tunnel valley system (Figure 8A) suggests a large catchment with varying meltwater input, which could be explained by additional charging of the subglacial drainage system from increasing surface-to-bed connections during the deglaciation, but also by longer term shifts in meltwater availability associated to variations in overlying ice geometry and shifting drainage boundaries. Based on the deflection of the meltwater channel outletting into Sentralbankrenna by 90° to align with ice stream flow direction we suggest that at least the tunnel valley downstream of the interlinked basins (Figure 8B) was in operation already while the Sentralbankrenna Ice Stream was active, supplying meltwater to the ice stream bed and facilitating fast ice-flow.
Farther north in Hopendjupet, the transition from a tunnel valley (bed-incised) to esker (ice-incised) system at the shear margin of the Bjørnøyrenna ice stream demonstrates analogous subglacial drainage conditions during this phase of active ice streaming. Further, relatively thin sediment coverage over this region implies that many of the drainage features are incised into the sedimentary bedrock (Sigmond, 2002; Bjarnadóttir et al., 2017). Across the Barents Sea shelf today an upper regional unconformity separates variously dipping Mesozoic sedimentary rocks, including shales and sandstones, from an overlying sequence of glacigenic sediments. Predicted glacial erosion of this relatively soft substrate at rates of between 1 and 2 mm a-1 during the last glacial cycle (Patton et al., 2022b) indicates that the relatively shallow tunnel valleys visible today were unlikely to have survived repeated glaciations without continual use.
Filling and drainage cycles of shallow subglacial lakes upstream of the two tunnel valley systems adjacent to Sentralbankrenna (Figures 6B, 8B) also provide a potential pressurised water source that could have contributed to the erosion and development of large drainage conduits within the relatively small catchment of Thor Iversen-banken. Hydraulic potential modelling also indicates the possibility for water storage in this region (Shackleton et al., 2018), and subglacial lakes are predicted at the interlinked basin site (Esteves et al., 2017) at the edge of Sentralbankrenna, and at the downstream end of the braided tunnel valley. Based on the distribution of tunnel valleys on Thor Iversen-banken we infer a minimum drainage catchment area for the basins directly west of the moraine system (Figure 8B) of ∼530 km2 (Figure 11) to provide a conservative estimate of lake recharge rates. If we assume that basal melt from across the whole catchment reached these basins, the potential lake-refill time spans from annual to decadal timescales even under very conservative basal melt rates <1 mm a-1 (Supplementary Figure S1). Although the combined volume of these basins is relatively small (0.031 km3), the rapidity by which they could regularly refill through basal melt fluxes alone provides a viable mechanism for the initial development of this tunnel valley during deglaciation. For comparison, basal melt rates of up to 10–60 mm a-1 are predicted beneath the fast-flowing ice streams that drained the North Sea during the LGM (Kirkham et al., 2022).
4.3 Drainage during late-stage deglaciation
Regional geomorphology documents the retreating ice sheet through Hopendjupet and Sentralbankrenna and onto topographic highs. Again, chronological data from this timeframe and sector is extremely sparse, though ice-free conditions in Sentralbankrenna by ∼14.5 ka BP and during the Bølling Warming is probable (Brendryen et al., 2020). Several GZWs in Sentralbankrenna to the west of Thor Iversen-banken (Figure 11B) indicate ice margin stillstands within the trough (Bjarnadóttir et al., 2014; Esteves et al., 2017), which elsewhere are typically inferred to last from decades to centuries (Anandakrishnan et al., 2007; Dowdeswell et al., 2008; Bart et al., 2018). The deposition of GZWs in Bjørnøyrenna and Hopendjupet reveal a similar pattern of stillstand, and minor readvances of the Bjørnøyrenna ice stream during its non-linear retreat northwards, possibly indicative of ice-stream surging behaviour (Andreassen et al., 2014; Bjarnadóttir et al., 2014). Marginal moraines deposited on Thor Iversen-banken show that slow-flowing and relatively stable ice on the bank subsequently retreated eastwards (Bjarnadóttir et al., 2014; 2017; Esteves et al., 2017; Newton and Huuse, 2017). Marginal moraines have been breached by meltwater channels (Bjarnadóttir et al., 2017; Esteves et al., 2017), indicating that at least east-west meltwater drainage networks were utilised throughout ice retreat, and during ice margin re-advance (Figure 11B). Furthermore, a transition from straight to sinuous meltwater channel geometry (Figure 8B) coincides with the location of large arcuate retreat moraines, suggesting a shift in drainage system topology coeval with the retreating ice margin.
Eskers form close to the ice margin and are generally oriented parallel to the ice-flow direction when averaged over their entire length, despite individual segments deviating up to 90° (Hebrand and Åmark, 1989; Brennand, 2000; Mäkinen, 2003; Storrar et al., 2015). During the later stages of deglaciation, thinner marginal ice retreating over Thor Iversen-banken provide more favourable conditions for meltwater incising into the overlying ice rather than the bed substrate, leading to esker deposition during terminal drainage events (Boulton et al., 2009; Livingstone et al., 2015). The observation of some esker enlargements in our data (Figure 4), thought to result from conduit collapse along high-discharge drainage routes at thinning marginal locations (Dewald et al., 2021), corroborates this interpretation.
The deposition of the beaded esker-system over the tunnel valley in Hopendjupet and Sentralbanken likely marks a similar transition to thin-ice conditions during late-stage deglaciation. Over successive melt-seasons, and where subglacial water routes and ice flow are constrained by bed heterogeneities, subglacial meltwater is more likely to exploit existing drainage routes and channels already incised into the bed (cf. Lelandais et al., 2018), which may explain esker formation along the banks and beds of existing meltwater channels and tunnel valleys (Figures 3, 5). This supply of meltwater at the bed, however, likely fluctuated sharply between successive years, reflected by the irregular spacing of the esker beads in Hopendjupet over relatively short distances, and in their varied morphology between composite and discrete forms demonstrating a variable mobilisation of sediments at the ice-bed interface.
While eskers are more extensively found on hard substrates via deposition in R-channels (ice-incised), their appearance on soft substrates via water flow in R-, N-(bed incised) and N-R-channels is not uncommon (e.g., Clark and Walder, 1994; Storrar et al., 2014; Frydrych, 2022). However, these soft-substrate eskers are generally more chaotic and shorter, likely reflecting a lack of stable R-channel formation (Storrar, 2014). The deposition of such an extensive esker system in Hopendjupet, where abundant pockmarks and iceberg ploughmarks indicate a soft substrate environment (Figures 7C, 12B), is thus a rarity. In this instance the earlier erosion of a bedrock-incised tunnel valley, providing a stable location for meltwater outflow through deglaciation, was likely a necessary prerequisite for the continued development of the esker beads during ice retreat across the bank margin.
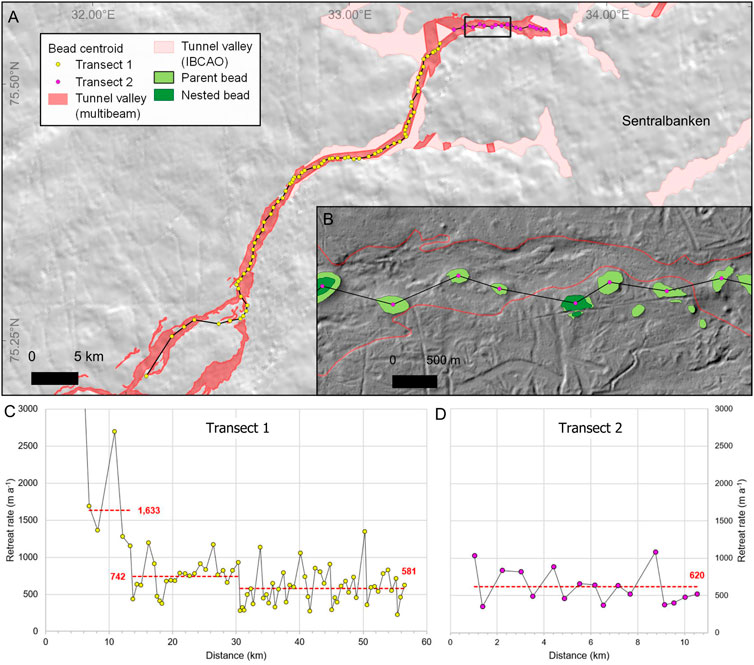
FIGURE 12. (A) Transects along the Hopendjupet beaded-esker system (separated by a gap in multibeam bathymetry data coverage), used to constrain annual retreat rates of the collapsing Barents Sea ice sheet (Supplementary Material S1). (B) Closer view of esker beads in Transect 2, highlighting their placement within and adjacent to the tunnel valley. (C) Ice-retreat rates through transect 1, with mean values indicating a general deceleration upstream. (D) Ice-retreat rates through transect 2, highlighting continued deceleration.
In addition to basally sourced meltwater, drainage systems close to the ice margin during ice retreat are likely to have had input from supraglacial and englacial sources, particularly during the collapse of the central Barents Sea and the elevated atmospheric warming of the Bølling Interstadial. The final tunnel valley morphometry of a wide cross section imprinted with multiple smaller channels (e.g., Figure 8A) fits well with a proposed steady-state mechanism linked to regular surface drainage inputs (e.g., Kirkham, 2022). Eskers originating in circular mounds (Figure 5) also suggest the potential for supraglacial input of meltwater to the bed via moulins or crevasses, providing a point source which could rapidly initiate R-Channels within a limited distance of the ice margin (Rampton, 2000; Burke et al., 2012). Surface lakes repeatedly form at the same locations over successive melt seasons (Box and Ski, 2007), and moulins are shown to persistently form at the same position in Greenland, controlled by bed topography (Catania and Neumann, 2010). We propose that surface lake drainage during deglaciation led to the high density of eskers and occurrence of parallel eskers less than 1 km apart at sites 3 and 4 (Figures 5, 6), and associated closure and reopening of subglacial conduits might also explain the diverging morphology and complex ridges observed within esker systems at site 2 (Figure 4).
Under this scenario with surface-to-bed meltwater processes in operation, an alternative (or additional) interpretation of these shallow basins across Thor Iversen-banken is that they are the remnant expression of water-filled ‘blisters’, where meltwater is transiently stored following rapid supraglacial lake-drainage events and which can hydraulically jack the overlying ice sheet (Tsai and Rice, 2010; Doyle et al., 2013; Lai and Anders, 2021). The subsequent rate of relaxation of this surface uplift following a lake drainage event is explained by the transfer of water from this blister into the subglacial drainage system, either through distributed (Dow et al., 2015) or channelised (Sole et al., 2011; Cowton et al., 2013) water flow. In all instances found in our study area the basins connect to a channelised drainage system downstream, indicating high-transmissivity systems were in operation, possibly under high hydraulic potential gradients (i.e., in proximity to the ice margin) or prolonged surface water inputs through the melt season. This repeated closure and reopening of subglacial conduits might also explain the diverging morphology of the eastern extent of the esker ridge at site 2 (Figure 4).
4.4 Transitions between subglacial drainage modes
Major shifts in subglacial drainage mode occur in response to processes operating at three timescales: Short-term (days/weeks/months), for example, driven by subglacial lake fill/drain cycles, surface-to-bed connections, or conduit blockage and water redirection; Annual cycles, in response to fluctuating summer/winter seasons and surface meltwater supply; Long-term (decadal to millennial), during different phases of ice sheet development, through ice advance and retreat and associated thickness and surface slope changes. The range of meltwater landforms in the central Barents Sea indicate wide-ranging subglacial drainage systems, and the geomorphological record is a composite of multiple spatial and temporal shifts in subglacial drainage mode. Wide tunnel valleys channelling vast volumes of meltwater are evidenced by dendritic (Figure 9) and braided (Figure 8A) tunnel valley networks outletting into or just short of the Sentralbankrenna Ice Stream trough (Figure 10). Focussed water flow through smaller, variably active meltwater conduits eroding into the bed are evidenced by meltwater channels and tributaries converging to join the main trunk of all three tunnel valley systems (Figures 6, 8, 9). Narrow meltwater conduits incised into the deforming base of the ice sheet proximal to the ice sheet margin (Figures 3–6) are evidenced by eskers along the banks and floors of tunnel valleys (Figures 5, 9) and within basins feeding into downstream meltwater channels (Figures 5, 6).
The shift from large channels incised into the bed substrate towards smaller channels incised into basal ice over Thor Iversen-banken and Hopendjupet reflects changing ice conditions and fluctuating meltwater supply as the ice sheet deglaciated. Tunnel valleys and meltwater channels eroded into the bed require stability in water routing as they develop over centennial to millennial time periods (Kehew et al., 2012; Kirkham et al., 2021; 2022). These landforms record relatively long-term routing of meltwater, sourced from episodic high-discharge drainage events or steady-state drainage of subglacial meltwater. Variable meltwater supply under this scenario of relatively stable overlying ice leads to creep-closure of meltwater conduits and glacial erosion of conduit walls (e.g., Jørgensen and Sandersen, 2006). The transition to thinner, stagnating ice on the bank, coupled with a fluctuating meltwater supply, and variable basal and supraglacial meltwater sources likely stimulated the overall shift towards meltwater incision into ice. Eskers are deposited within meltwater conduits relatively rapidly, following a lowering of conduit water velocity or discharge. Eskers, therefore, represent a snapshot of the drainage conduit immediately prior to partial or full shut-down. Although some eskers form time-transgressively, in segments following gradual ice margin retreat (e.g., Canada and North America: Storrar et al., 2013), individual esker segments are non-etheless a snapshot of the drainage conduit immediately prior to becoming inactive. In the case of the beaded esker in Hopendjupet, these individual segments are taken to reflect a quasi-annual record of drainage activity (Livingstone et al., 2020).
4.5 Subglacial drainage and potential impacts on ice dynamics
Subglacial lakes are linked to fluctuating ice dynamics in the upper catchments and onset zones of fast flowing ice streams in Antarctica (Siegert and Bamber, 2000; Bell et al., 2007). Active systems of connected subglacial lakes are also observed closer to ice-margins (Fricker et al., 2007; Smith et al., 2009), and subglacial lake drainage events have been directly linked to ice flow speed-ups (Stearns et al., 2008; Siegfried et al., 2016). We suggest that interconnected subglacial lakes actively exchanging, storing, and releasing meltwater had the potential to influence ice dynamics over Sentralbanken, Thor Iversen-banken, and downstream Sentralbankrenna through modulation of fast-flowing ice in the Sentralbankrenna tributary ice stream. Furthermore, tunnel valley breaching of retreat moraines (Figure 8B) suggests that subglacial conduits remained active through deglaciation and during ice margin readvances, continuing to influence drainage system development and ice flow through the later stages of ice margin retreat onto Thor Iversen-banken (Esteves et al., 2022). Connected systems of subglacial lakes are also observed at comparable short distances (∼20 km) from the grounding line beneath the Whillans and Mercer Ice Streams in Antarctica (Fricker and Scambos, 2009), and with increasing abundance beneath the Greenland ice sheet (Livingstone et al., 2022). A recent survey based off radio-echo sounding data highlights a third of the total subglacial lake inventory occurs in regions of low relief (≤10% bedrock gradient) and are generally concentrated toward the ice margin where ice surface speeds are typically higher and surface-to-bed hydraulic connectivity more likely (Bowling et al., 2019).
Ice streaming in Sentralbankrenna during early deglaciation was conducive to stable water routing, and margin standstills during retreat through the trough are evidenced by the GZW deposits. Meltwater drainage deflected in the direction of former ice stream flow (Figure 8B) suggests that while ice was still flowing in Sentralbankrenna, drainage over Thor Iversen-banken supplied meltwater to the bed of the ice stream (Section 4.1; Figure 11A). Drainage could also have developed seasonally in response to ice surface meltwater supply, and sporadically in response to episodic discharges from upstream subglacial lake drainage events, resulting in variable meltwater availability, and regulating effective pressure at the bed of the downstream Sentralbankrenna Ice Stream.
As ice cover over the central Barents Sea reduced and thinned, ice flow became progressively influenced by the underlying topography (Patton et al., 2016; Piasecka et al., 2016). Yet, with a relatively subdued relief of these bank areas, the evolving positions of nearby ice divides, separating general ice flow west and east in this sector, were unlikely to have remained static. It is thus likely that the relative dominance of the mapped tunnel valley systems, which directly fed meltwater to the beds of the adjacent Bjørnøyrenna and Sentralbankrenna ice streams to the west, varied through time. Such processes of water piracy and rerouting between subglacial catchments are observed in Antarctica and Greenland and have led to complete shut-down and re-activation of fast flow (Anandakrishnan and Alley, 1997; Vaughan, 2008; Carter et al., 2013; Lindbäck et al., 2015). Numerous switches in ice stream flow and pauses in ice-margin retreat during deglaciation are evidenced by subglacially created and overlapping landforms indicative of fast flow, and ice-marginal GZWs and moraines at the deglaciated beds of the Bjørnøyrenna and Sentralbankrenna Ice Streams (Andreassen et al., 2014; Bjarnadóttir et al., 2014; Piasecka et al., 2016; Esteves et al., 2017).
These high-temporal fluctuations within the subglacial drainage network, and its potential to regulate the overlying ice cover, is exemplified in our study area by the evolving deposition of the Hopendjupet beaded-esker system. Segmented or beaded eskers are interpreted as time-transgressive landform assemblages deposited close to glacier margins during deglaciation; where they have been deposited in association with De Geer moraines they have thus been interpreted as quasi-annual deposits (Livingstone et al., 2020). A second hypothesis suggests an entirely subglacial deposition with synchronous formation during separation of the glacier from its bed leading to the sediment infill of subglacial cavities (Gorrell and Shaw, 1991). Although no other ice-marginal landforms are visible in Hopendjupet, the deposition of the esker system within a tunnel valley (10 m x 1500 m; depth/width) implies that channelised subglacial drainage in this area was in operation throughout the deglaciation of Sentralbanken, favouring a time-transgressive formation.
Under the assumption that the interpreted beaded esker system in Hopendjupet represents a quasi-annual record of the ice margin, it is possible to infer from their horizontal spacing a high-resolution record of ice-sheet collapse over c. 91 years and 67 km (Figure 12). Our analysis indicates that deglaciation through Hopendjupet was rapid but decelerating, transitioning from an initial rate of >1,600 m a-1 within Hopendjupet and stabilising ∼581–742 m a-1 across the shallower bank areas found at depths of <300 m today. A modelled relative sea-level change of 248.5 m in Hopendjupet at 15 ka BP (Gowan et al., 2021) indicate water depths in this region were significantly deeper than present around the time of deglaciation, largely the result of isostatic loading. The irregular architecture and high degree of fluctuation in the spacing between adjacent esker beads, ranging between 300-1,100 m separation, potentially points towards a high-degree of interannual variation in the volumes of meltwater and sediment passing through this channelised system each year, and thus on the ability of the subglacial drainage system to regulate the flow of overlying ice. Such strongly correlated modulation of glacier motion by water pressure variations in response to surface melt inputs has been observed over annual timescales (Sugiyama et al., 2011; Moon et al., 2014), though such variability in the terminus position likely reflects a more nuanced response to other factors too, including variable submarine melt rates in response to net oceanic heat transport to the ice front (Inall et al., 2014; Cowton et al., 2018).
The inferred rate of ice retreat over Sentralbanken at >500 m a-1, persistent for almost a century, is extremely fast, especially when compared to tidewater glacier retreat in present-day Greenland (Murray et al., 2015) or inferred from other coastal sectors of the last EIS (Stokes et al., 2014; Bradwell et al., 2019). However, these rates do align with grounding-line retreat at rates of between 500 and >2,100 m a-1 inferred (Graham et al., 2022), measured (Rignot et al., 2014) and modelled (Seroussi et al., 2017) from the marine-based Amundsen Sea sector of West Antarctica. Furthermore, a new chronological framework recently proposed for the last deglaciation of the Barents Sea suggests the EIS collapsed over centennial timescales, losing a volume of 6.2 (4.5-7.9) m SLE (sea-level equivalent) during the Bølling warming (Brendryen et al., 2020). With this chronology extrapolated across the entire 750 km length of Bjørnøyrenna, it is inferred that collapse of this ice-stream system took only 810 years after 14.71 ka BP, proceeding at a mean rate of 1,080 m a-1 and resonating with our own inferred mean rates over shallower bank areas.
5 Conclusion
High-resolution multibeam bathymetry data from the central Barents Sea reveal assemblages of meltwater landforms on Thor Iversen-banken, Sentralbanken, and Hopendjupet, indicating active subglacial drainage through this sector during the last deglaciation. We present evidence for hitherto undocumented esker systems and meltwater channels that represent a range of subglacial hydrologic environments. Singular and interconnected basins, inferred to be the site of palaeo-subglacial lakes, are observed upstream of large tunnel-valley networks, and we suggest that the periodic storage and drainage of meltwater held within these lakes impacted drainage system development and modulated ice flow through fill/drain cycles.
A composite map of subglacial drainage features over Thor Iversen-banken facilitates reconstruction of geomorphically dominant subglacial drainage modes during an early deglacial phase when ice was still flowing in Sentralbankrenna and through the later phase of deglaciation when thinning ice cover remained on the shallow banks. Cross-cutting relationships between meltwater landforms reveal the relative timing and operational timescales of different drainage systems, indicating that subglacial lakes and tunnel valleys were operational throughout deglaciation over the central Barents Sea. Eskers deposited along the banks and floors of tunnel valleys and meltwater channels indicate late-stage incision of meltwater into basal ice, highlighting persistent drainage routing through the region during the latter stages of ice-margin retreat.
We attribute the shift in drainage character between deglaciation phases over the central Barents Sea to changes in ice conditions from thicker ice feeding the nearby Sentralbankrenna ice Streams, to thinner, stagnant ice at the retreating ice margin over Thor Iversen-banken. Additionally, changes in drainage characteristics were likely driven by a shift from basal meltwater sourced from a large catchment during early deglaciation, to a combination of subglacial and supraglacial meltwater sources of fluctuating magnitude during the latter stages of deglaciation. A newly discovered beaded esker system in Hopendjupet, interpreted as a time-transgressive and quasi-annual ice-marginal deposit, provides quantitative context for the rapid collapse of the ice sheet through the central Barents Sea, inferred to have proceeded at rates of between 580 m a-1 and 1,600 m a−1.
Data availability statement
The original contributions presented in the study are included in the article/Supplementary Material, further inquiries can be directed to the corresponding author.
Author contributions
CS wrote the original manuscript and with ME carried out geomorphological mapping of the MAREANO bathymetry dataset and the data analysis. HP and MW led the research expeditions collecting multibeam datasets from Hopendjupet, mapped the glacial geomorphology from this sector, and analysed the dataset to constrain rates of deglaciation. MW, LB, and KA aided with geomorphological mapping and data interpretations. CS and HP prepared the figures, and all authors contributed to developing the text.
Funding
This research was supported by the Centre for Arctic Gas Hydrate, Environment and Climate (CAGE), which is funded by the Research Council of Norway through its Centre of Excellence funding scheme Grant No. 223259. A part of CS’s work was conducted at the Norwegian Polar Institute, supported by another Research Council of Norway grant (FRINATEK 315246).
Acknowledgments
We acknowledge Kartverket (Norwegian Hydrographic Service), the Geological Survey of Norway and the MAREANO Programme for providing the multibeam bathymetry data used in this study, under a CC by 4.0 license (Creative Commons—Navngivelse 4.0 Internasjonal—CC BY 4.0). We thank the crews of R/V Helmer Hanssen and R/V G.O. Sars for providing invaluable support with additional data acquisition, and Prof. Giuliana Panieri for providing multibeam data from the CAGE_17-2 research cruise. HP also acknowledges support via the Akademia Programme at Equinor. We are also grateful to Kelly Hogan and Iestyn Barr for reviewing this work and providing thorough and constructive feedback.
Conflict of interest
The authors declare that the research was conducted in the absence of any commercial or financial relationships that could be construed as a potential conflict of interest.
Publisher’s note
All claims expressed in this article are solely those of the authors and do not necessarily represent those of their affiliated organizations, or those of the publisher, the editors and the reviewers. Any product that may be evaluated in this article, or claim that may be made by its manufacturer, is not guaranteed or endorsed by the publisher.
Supplementary material
The Supplementary Material for this article can be found online at: https://www.frontiersin.org/articles/10.3389/feart.2023.1111396/full#supplementary-material
References
Alley, R. B., Dupont, T. K., Parizek, B. R., Anandakrishnan, S., Lawson, D. E., and Larson, G. J., (2006). Outburst flooding and the initiation of ice-stream surges in response to climatic cooling: A hypothesis. Geomorphology 75 (1-2), 76–89. doi:10.1016/j.geomorph.2004.01.011
Alley, R. B. (1989). Water-pressure coupling of sliding and bed deformation: I. Water system. J. Glaciol. 35, 108–118. doi:10.3189/002214389793701527
Anandakrishnan, S., and Alley, R. B. (1997). Stagnation of ice stream C, west Antarctica by water piracy. Geophys. Res. Lett. 24, 265–268. doi:10.1029/96GL04016
Anandakrishnan, S., Catania, G. A., Alley, R. B., and Horgan, H. J. (2007). Discovery of till deposition at the grounding line of Whillans ice stream. Science 315, 1835–1838. doi:10.1126/science.1138393
Anderson, R. S., Hallet, B., Walder, J., and Aubry, B. F. (1982). Observations in a cavity beneath grinnell glacier. Earth Surf. Process. Landf. 7, 63–70. doi:10.1002/esp.3290070108
Andreassen, K., Winsborrow, M. C. M., Bjarnadóttir, L. R., and Rüther, D. C. (2014). Ice stream retreat dynamics inferred from an assemblage of landforms in the northern Barents Sea. Quat. Sci. Rev. 92, 246–257. doi:10.1016/j.quascirev.2013.09.015
Andrews, L. C., Catania, G. A., Hoffman, M. J., Gulley, J. D., Lüthi, M. P., and Ryser, C. (2014). Direct observations of evolving subglacial drainage beneath the Greenland Ice Sheet. Nature 514, 80–83. doi:10.1038/nature13796
Bart, P. J., DeCesare, M., Rosenheim, B. E., Majewski, W., and McGlannan, A. (2018). A centuries-long delay between a paleo-ice-shelf collapse and grounding-line retreat in the Whales Deep Basin, eastern Ross Sea, Antarctica. Sci. Rep. 8 (1), 12392. doi:10.1038/s41598-018-29911-8
Bartholomew, I., Nienow, P., Mair, D., Hubbard, A., King, M. A., and Sole, A. (2010). Seasonal evolution of subglacial drainage and acceleration in a Greenland outlet glacier. Nat. Geosci. 3, 408–411. doi:10.1038/ngeo863
Bell, R. E., Studinger, M., Shuman, C. A., Fahnestock, M. A., and Joughin, I. (2007). Large subglacial lakes in East Antarctica at the onset of fast-flowing ice streams. Nature 445, 904–907. doi:10.1038/nature05554
Bjarnadóttir, L. R., Winsborrow, M. C. M., and Andreassen, K. (2014). Deglaciation of the central Barents Sea. Quat. Sci. Rev. 92, 208–226. doi:10.1016/j.quascirev.2013.09.012
Bjarnadóttir, L. R., Winsborrow, M. C. M., and Andreassen, K. (2017). Large subglacial meltwater features in the central Barents Sea. Geology 45, 159–162. doi:10.1130/G38195.1
Boulton, G. S., Hagdorn, M., Maillot, P. B., and Zatsepin, S. (2009). Drainage beneath ice sheets: Groundwater–channel coupling, and the origin of esker systems from former ice sheets. Quat. Sci. Rev. 28, 621–638. doi:10.1016/j.quascirev.2008.05.009
Bowling, J. S., Livingstone, S. J., Sole, A. J., and Chu, W. (2019). Distribution and dynamics of Greenland subglacial lakes. Nat. Commun. 10 (1), 2810. doi:10.1038/s41467-019-10821-w
Box, J. E., and Ski, K. (2007). Remote sounding of Greenland supraglacial melt lakes: Implications for subglacial hydraulics. J. Glaciol. 53, 257–265. doi:10.3189/172756507782202883
Brendryen, J., Haflidason, H., Yokoyama, Y., Haaga, K. A., and Hannisdal, B. (2020). Eurasian Ice Sheet collapse was a major source of Meltwater Pulse 1A 14,600 years ago. Nat. Geosci. 13, 363–368. doi:10.1038/s41561-020-0567-4
Brennand, T. A. (2000). Deglacial meltwater drainage and glaciodynamics: Inferences from laurentide eskers, Canada. Geomorphology 32, 263–293. doi:10.1016/S0169-555X(99)00100-2
Burke, M. J., Brennand, T. A., and Perkins, A. J. (2012). Transient subglacial hydrology of a thin ice sheet: Insights from the chasm esker, British columbia, Canada. Quat. Sci. Rev. 58, 30–55. doi:10.1016/j.quascirev.2012.09.004
Carter, S. P., Fricker, H. A., and Siegfried, M. R. (2013). Evidence of rapid subglacial water piracy under Whillans ice stream, west Antarctica. J. Glaciol. 59, 1147–1162. doi:10.3189/2013JoG13J085
Catania, G. A., and Neumann, T. A. (2010). Persistent englacial drainage features in the Greenland Ice Sheet. Geophys. Res. Lett. 37. doi:10.1029/2009GL041108
Clark, C. D., Evans, D. J. A., Khatwa, A., Bradwell, T., Jordan, C. J., and Marsh, S. H. (2004). Map and GIS database of glacial landforms and features related to the last British Ice Sheet. Boreas 33, 359–375. doi:10.1080/03009480410001983
Clark, P. U., and Walder, J. S. (1994). Subglacial drainage, eskers, and deforming beds beneath the Laurentide and Eurasian ice sheets. GSA Bull. 106, 304–314. doi:10.1130/0016-7606(1994)106<0304:SDEADB>2.3
Cowton, T., Nienow, P., Sole, A., Wadham, J., Lis, G., and Bartholomew, I. (2013). Evolution of drainage system morphology at a land-terminating Greenlandic outlet glacier. J. Geophys. Res. Earth Surf. 118, 29–41. doi:10.1029/2012JF002540
Cowton, T. R., Sole, A. J., Nienow, P. W., Slater, D. A., and Christoffersen, P. (2018). Linear response of east Greenland’s tidewater glaciers to ocean/atmosphere warming. Proc. Natl. Acad. Sci. 115, 7907–7912. doi:10.1073/pnas.1801769115
Creyts, T. T., and Schoof, C. G. (2009). Drainage through subglacial water sheets. J. Geophys. Res. Earth Surf. 114, F04008. doi:10.1029/2008JF001215
Dewald, N., Lewington, E. L. M., Livingstone, S. J., Clark, C. D., and Storrar, R. D. (2021). Distribution, characteristics and formation of esker enlargements. Geomorphology 392, 107919. doi:10.1016/j.geomorph.2021.107919
Dow, C. F., Kulessa, B., Rutt, I. C., Tsai, V. C., Pimentel, S., and Doyle, S. H. (2015). Modeling of subglacial hydrological development following rapid supraglacial lake drainage: Modeling lake drainage hydrology. J. Geophys. Res. Earth Surf. 120 (6), 1127–1147. doi:10.1002/2014JF003333
Dowdeswell, J. A., and Hogan, K. A. (2016). Huge iceberg ploughmarks and associated corrugation ridges on the northern Svalbard shelf. Geol. Soc. Lond. Mem. 46, 269–270. doi:10.1144/M46.4
Dowdeswell, J. A., Montelli, A., Akhmanov, G., Solovyeva, M., Terekhina, Y., and Mironyuk, S. (2021). Late Weichselian ice-sheet flow directions in the Russian northern Barents Sea from high-resolution imagery of submarine glacial landforms. Geology 49, 1484–1488. doi:10.1130/G49252.1
Dowdeswell, J. A., Ottesen, D., Evans, J., Cofaigh, C. Ó., and Anderson, J. B. (2008). Submarine glacial landforms and rates of ice-stream collapse. Geology 36 (10), 819–822. doi:10.1130/G24808A.1
Doyle, S. H., Hubbard, A. L., Dow, C. F., Jones, G. A., Fitzpatrick, A., Gusmeroli, A., et al. (2013). Ice tectonic deformation during the rapid in situ drainage of a supraglacial lake on the Greenland Ice Sheet. Cryosphere 7, 129–140. doi:10.5194/tc-7-129-2013
Elverhøi, A., Pfirman, S. L., Solheim, A., and Larssen, B. B. (1989). Glaciomarine sedimentation in epicontinental seas exemplified by the northern Barents Sea. Mar. Geol. 85, 225–250. doi:10.1016/0025-3227(89)90155-2
Esteves, M., Bjarnadóttir, L. R., Winsborrow, M. C. M., Shackleton, C. S., and Andreassen, K. (2017). Retreat patterns and dynamics of the Sentralbankrenna glacial system, central Barents Sea. Quat. Sci. Rev. 169, 131–147. doi:10.1016/j.quascirev.2017.06.004
Esteves, M., Rüther, D., Winsborrow, M. C. M., Livingstone, S. J., Shackleton, C. S., and Andreassen, K. (2022). An interconnected palaeo-subglacial lake system in the central Barents Sea. EarthArxiv [ArXiv pre-print]. doi:10.31223/X58934
Evans, D. J. A., Storrar, R. D., and Rea, B. R. (2016). Crevasse-squeeze ridge corridors: Diagnostic features of late-stage palaeo-ice stream activity. Geomorphology 258, 40–50. doi:10.1016/j.geomorph.2016.01.017
Fricker, H. A., Scambos, T., Bindschadler, R., and Padman, L. (2007). An active subglacial water system in west Antarctica mapped from space. Science 315, 1544–1548. doi:10.1126/science.1136897
Fricker, H. A., and Scambos, T. (2009). Connected subglacial lake activity on lower mercer and Whillans ice streams, west Antarctica, 2003–2008. J. Glaciol. 55, 303–315. doi:10.3189/002214309788608813
Frydrych, M. (2022). Classification of esker morphology on soft beds in the area of the Saalian and Elsterian Glaciations in Poland. Acta Geogr. Lodz. 112, 45–60. doi:10.26485/AGL/2022/112/4
Gorrell, G., and Shaw, J. (1991). Deposition in an esker, bead and fan complex, Lanark, Ontario, Canada. Sediment. Geol. 72, 285–314. doi:10.1016/0037-0738(91)90016-7
Gowan, E. J., Zhang, X., Khosravi, S., Rovere, A., Stocchi, P., Hughes, A. L., et al. (2021). A new global ice sheet reconstruction for the past 80 000 years. Nat. Commun. 12 (1), 1199. doi:10.1038/s41467-021-21469-w
Graham, A. G. C., Wåhlin, A., Hogan, K. A., Nitsche, F. O., Heywood, K. J., and Totten, R. L. (2022). Rapid retreat of Thwaites Glacier in the pre-satellite era. Nat. Geosci. 15, 706–713. doi:10.1038/s41561-022-01019-9
Greenwood, S. L., and Clark, C. D. (2009). Reconstructing the last Irish ice sheet 1: Changing flow geometries and ice flow dynamics deciphered from the glacial landform record. Quat. Sci. Rev. 28, 3085–3100. doi:10.1016/j.quascirev.2009.09.008
Greenwood, S. L., Clason, C. C., Helanow, C., and Margold, M. (2016). Theoretical, contemporary observational and palaeo-perspectives on ice sheet hydrology: Processes and products. Earth-Sci. Rev. 155, 1–27. doi:10.1016/j.earscirev.2016.01.010
Hebrand, M., and Åmark, M. (1989). Esker formation and glacier dynamics in eastern Skane and adjacent areas, southern Sweden. Boreas 18, 67–81. doi:10.1111/j.1502-3885.1989.tb00372.x
Hogan, K. A., Arnold, N. S., Larter, R. D., Kirkham, J. D., Noormets, R., Ó Cofaigh, C., et al. (2022). Subglacial water flow over an antarctic palaeo-ice stream bed. J. Geophys. Res. Earth Surf. 127 (2), e2021JF006442. doi:10.1029/2021jf006442
Hooke, R. LeB., and Jennings, C. E. (2006). On the formation of the tunnel valleys of the southern Laurentide ice sheet. Quat. Sci. Rev. 25, 1364–1372. doi:10.1016/j.quascirev.2006.01.018
Hovland, M., Heggland, R., De Vries, M. H., and Tjelta, T. I. (2010). Unit-pockmarks and their potential significance for predicting fluid flow. Mar. Petroleum Geol. 27 (6), 1190–1199. doi:10.1016/j.marpetgeo.2010.02.005
Hughes, A. L. C., Gyllencreutz, R., Lohne, Ø. S., Mangerud, J., and Svendsen, J. I. (2016). The last eurasian ice sheets – A chronological database and time-slice reconstruction, DATED-1. Boreas 45 (1), 1–45. doi:10.1111/bor.12142
Huuse, M., and Lykke-Andersen, H. (2000). Overdeepened quaternary valleys in the eastern Danish north Sea: Morphology and origin. Quat. Sci. Rev. 19, 1233–1253. doi:10.1016/S0277-3791(99)00103-1
Iken, A. (1981). The effect of the subglacial water pressure on the sliding velocity of a glacier in an idealized numerical model. J. Glaciol. 27, 407–421. doi:10.3189/S0022143000011448
Inall, M. E., Murray, T., Cottier, F. R., Scharrer, K., Boyd, T. J., and Heywood, K. J. (2014). Oceanic heat delivery via Kangerdlugssuaq Fjord to the south-east Greenland ice sheet. J. Geophys. Res. Oceans 119, 631–645. doi:10.1002/2013JC009295
Jakobsson, M., Mayer, L. A., Bringensparr, C., Castro, C. F., Mohammad, R., and Johnson, P. (2020). The international bathymetric Chart of the Arctic Ocean version 4.0. Sci. Data 7 (1), 176. doi:10.1038/s41597-020-0520-9
Jørgensen, F., and Sandersen, P. B. E. (2006). Buried and open tunnel valleys in Denmark—Erosion beneath multiple ice sheets. Quat. Sci. Rev. 25, 1339–1363. doi:10.1016/j.quascirev.2005.11.006
Kehew, A. E., Piotrowski, J. A., and Jørgensen, F. (2012). Tunnel valleys: Concepts and controversies — a review. Earth-Sci. Rev. 113, 33–58. doi:10.1016/j.earscirev.2012.02.002
Kirkham, J. D., Hogan, K. A., Larter, R. D., Arnold, N. S., Ely, J. C., and Clark, C. D. (2022). Tunnel valley formation beneath deglaciating mid-latitude ice sheets: Observations and modelling. Quat. Sci. Rev., 107680. doi:10.1016/j.quascirev.2022.107680
Kirkham, J. D., Hogan, K. A., Larter, R. D., Arnold, N. S., Nitsche, F. O., Kuhn, G., et al. (2020). Morphometry of bedrock meltwater channels on Antarctic inner continental shelves: Implications for channel development and subglacial hydrology. Geomorphology 370, 107369. doi:10.1016/j.geomorph.2020.107369
Kirkham, J. D., Hogan, K. A., Larter, R. D., Self, E., Games, K., and Huuse, M. (2021). Tunnel valley infill and Genesis revealed by high-resolution 3-D seismic data. Geology 49, 1516–1520. doi:10.1130/G49048.1
Lai, J., and Anders, A. M. (2021). Climatic controls on mountain glacier basal thermal regimes dictate spatial patterns of glacial erosion. Earth Surf. Dyn. 9 (4), 845–859. doi:10.5194/esurf-9-845-2021
Lelandais, T., Ravier, É., Pochat, S., Bourgeois, O., Clark, C., Mourgues, R., et al. (2018). Modelled subglacial floods and tunnel valleys control the life cycle of transitory ice streams. Cryosphere 12 (8), 2759–2772. doi:10.5194/tc-12-2759-2018
Lindbäck, K., Pettersson, R., Hubbard, A. L., Doyle, S. H., Van As, D., and Mikkelsen, A. B. (2015). Subglacial water drainage, storage, and piracy beneath the Greenland ice sheet. Geophys. Res. Lett. 42, 7606–7614. doi:10.1002/2015GL065393
Livingstone, S. J. (2022). Trapped meltwater affects mass loss of Greenland ice sheet. Nature 607 (7920), 659–660. doi:10.1038/d41586-022-01986-4
Livingstone, S. J., and Clark, C. D. (2016). Morphological properties of tunnel valleys of the southern sector of the Laurentide Ice Sheet and implications for their formation. Earth Surf. Dyn. 4, 567–589. doi:10.5194/esurf-4-567-2016
Livingstone, S. J., Lewington, E. L. M., Clark, C. D., Storrar, R. D., Sole, A. J., and McMartin, I. (2020). A quasi-annual record of time-transgressive esker formation: Implications for ice-sheet reconstruction and subglacial hydrology. Cryosphere 14, 1989–2004. doi:10.5194/tc-14-1989-2020
Livingstone, S. J., Storrar, R. D., Hillier, J. K., Stokes, C. R., Clark, C. D., and Tarasov, L. (2015). An ice-sheet scale comparison of eskers with modelled subglacial drainage routes. Geomorphology 246, 104–112. doi:10.1016/j.geomorph.2015.06.016
Livingstone, S. J., Utting, D. J., Ruffell, A., Clark, C. D., Pawley, S., and Atkinson, N. (2016). Discovery of relict subglacial lakes and their geometry and mechanism of drainage. Nat. Commun. 7, 11767. doi:10.1038/ncomms11767
Mäkinen, J. (2003). Time-transgressive deposits of repeated depositional sequences within interlobate glaciofluvial (esker) sediments in Köyliö, SW Finland. Sedimentology 50, 327–360. doi:10.1046/j.1365-3091.2003.00557.x
Margold, M., and Jansson, K. N. (2012). Evaluation of data sources for mapping glacial meltwater features. Int. J. Remote Sens. 33, 2355–2377. doi:10.1080/01431161.2011.608738
Moon, T., Joughin, I., Smith, B., van den Broeke, M. R., van de Berg, W. J., and Noël, B. (2014). Distinct patterns of seasonal Greenland glacier velocity. Geophys. Res. Lett. 41, 7209–7216. doi:10.1002/2014GL061836
Newton, A. M. W., and Huuse, M. (2017). Glacial geomorphology of the central Barents Sea: Implications for the dynamic deglaciation of the Barents Sea ice sheet. Mar. Geol. 387, 114–131. doi:10.1016/j.margeo.2017.04.001
Nitsche, F. O., Gohl, K., Larter, R. D., Hillenbrand, C.-D., Kuhn, G., and Smith, J. A. (2013). Paleo ice flow and subglacial meltwater dynamics in Pine Island Bay, West Antarctica. Cryosphere 7, 249–262. doi:10.5194/tc-7-249-2013
Ó Cofaigh, C., Dunlop, P., and Benetti, S. (2012). Marine geophysical evidence for Late Pleistocene ice sheet extent and recession off northwest Ireland. Quat. Sci. Rev. 44, 147–159. doi:10.1016/j.quascirev.2010.02.005
Ócofaigh, C. (1996). Tunnel valley Genesis. Prog. Phys. Geogr. 20, 1–19. doi:10.1177/030913339602000101
Ottesen, D., and Dowdeswell, J. A. (2006). Assemblages of submarine landforms produced by tidewater glaciers in Svalbard. J. Geophys. Res. 111, F01016. doi:10.1029/2005JF000330
Panieri, G., Alexandropoulou, N., Bruvik, K. L., Carrier, V., Dessandier, P.-A., Dølven, K. O., et al. (2023). CAGE17-2 Cruise Report: Gas hydrate deposits and methane seepages in Storfjordrenna, Northern Flank of Olga Basin, and West Sentralbanken (Barents Sea): Biogeochemical and biological investigations. CAGE – Centre Arct. Gas Hydrate, Environ. Clim. Rep. Ser. 5. doi:10.7557/cage.6955
Patton, H., Hubbard, A., Andreassen, K., Auriac, A., Whitehouse, P., and Stroeven, A. P. (2017). Deglaciation of the Eurasian ice sheet complex. Quat. Sci. Rev. 169, 148–172. doi:10.1016/j.quascirev.2017.05.019
Patton, H., Hubbard, A., Andreassen, K., Winsborrow, M., and Stroeven, A. P. (2016). The build-up, configuration, and dynamical sensitivity of the Eurasian ice-sheet complex to Late Weichselian climatic and oceanic forcing. Quat. Sci. Rev. 153, 97–121. doi:10.1016/j.quascirev.2016.10.009
Patton, H., Hubbard, A., Heyman, J., Alexandropoulou, N., Lasabuda, A. P. E., Stroeven, A. P., et al. (2022b). The extreme yet transient nature of glacial erosion. Nat. Commun. 13, 7377. doi:10.1038/s41467-022-35072-0
Patton, H., Mattingsdal, R., Pavel, S., Cooke, F. A., and Alexandropoulou, N. (2022a). CAGE20-2 Cruise Report: Hunting flares in Hopendjupet and glacigenic sediments in Sentralbankrenna. CAGE – Centre Arct. Gas Hydrate, Environ. Clim. Rep. Ser. 8. doi:10.7557/cage.6745
Pau, M., Hammer, Ø., and Chand, S. (2014). Constraints on the dynamics of pockmarks in the SW Barents Sea: evidence from gravity coring and high-resolution, shallow seismic profiles. Mar. Geol. 355, 330–345. doi:10.1016/j.margeo.2014.06.009
Perkins, A. J., Brennand, T. A., and Burke, M. J. (2016). Towards a morphogenetic classification of eskers: Implications for modelling ice sheet hydrology. Quat. Sci. Rev. 134, 19–38. doi:10.1016/j.quascirev.2015.12.015
Piasecka, E. D., Winsborrow, M. C. M., Andreassen, K., and Stokes, C. R. (2016). Reconstructing the retreat dynamics of the Bjørnøyrenna Ice Stream based on new 3D seismic data from the central Barents Sea. Quat. Sci. Rev. 151, 212–227. doi:10.1016/j.quascirev.2016.09.003
Piotrowski, J. A. (1994). Tunnel-valley formation in northwest Germany—geology, mechanisms of formation and subglacial bed conditions for the Bornhöved tunnel valley. Sediment. Geol. 89, 107–141. doi:10.1016/0037-0738(94)90086-8
Rampton, V. N. (2000). Large-scale effects of subglacial meltwater flow in the southern Slave Province, Northwest Territories, Canada. Can. J. Earth Sci. 37, 81–93. doi:10.1139/e99-110
Rignot, E., Mouginot, J., Morlighem, M., Seroussi, H., and Scheuchl, B. (2014). Widespread, rapid grounding line retreat of Pine Island, Thwaites, Smith, and Kohler glaciers, West Antarctica, from 1992 to 2011. Geophys. Res. Lett. 41, 3502–3509. doi:10.1002/2014GL060140
Rise, L., Bellec, V. K., Chand, S., and Bøe, R. (2014). Pockmarks in the southwestern Barents Sea and Finnmark fjords. Nor. J. Geology/Norsk Geol. Forening 94 (4).
Rüther, D. C., Mattingsdal, R., Andreassen, K., Forwick, M., and Husum, K. (2011). Seismic architecture and sedimentology of a major grounding zone system deposited by the Bjørnøyrenna Ice Stream during Late Weichselian deglaciation. Quat. Sci. Rev. 30, 2776–2792. doi:10.1016/j.quascirev.2011.06.011
Seroussi, H., Nakayama, Y., Larour, E., Menemenlis, D., Morlighem, M., Rignot, E., et al. (2017). Continued retreat of Thwaites Glacier, West Antarctica, controlled by bed topography and ocean circulation. Geophys. Res. Lett. 44, 6191–6199. doi:10.1002/2017GL072910
Serov, P., Patton, H., Mazzini, A., Mattingsdal, R., Shephard, G., Cooke, F. A., et al. (2022). CAGE22-6 cruise report: GEO-3144/8144 Teaching Cruise: Geologically controlled hydrocarbon seepage in Hopendjupet and the wider Barents Sea. CAGE – Cent. Arct. Gas. Hydrate Environ. Clim. Rep. Ser. 10. doi:10.7557/cage.6769
Shackleton, C., Patton, H., Hubbard, A., Winsborrow, M., Kingslake, J., Esteves, M., et al. (2018). Subglacial water storage and drainage beneath the Fennoscandian and Barents Sea ice sheets. Quat. Sci. Rev. 201, 13–28. doi:10.1016/J.QUASCIREV.2018.10.007
Shepherd, A., Hubbard, A., Nienow, P., King, M., McMillan, M., and Joughin, I. (2009). Greenland ice sheet motion coupled with daily melting in late summer. Geophys. Res. Lett. 36, L01501. doi:10.1029/2008GL035758
Siegert, M. J., and Bamber, J. L. (2000). Subglacial water at the heads of Antarctic ice-stream tributaries. J. Glaciol. 46, 702–703. doi:10.3189/172756500781832783
Siegfried, M. R., Fricker, H. A., Carter, S. P., and Tulaczyk, S. (2016). Episodic ice velocity fluctuations triggered by a subglacial flood in West Antarctica. Geophys. Res. Lett. 43, 2640–2648. doi:10.1002/2016GL067758
Sigmond, E. M. O. (2002). Geological map, land and sea areas of northern Europe, scale 1: 4 million. Trondheim, Norway: Geological Survey of Norway.
Simkins, L. M., Anderson, J. B., Greenwood, S. L., Gonnermann, H. M., Prothro, L. O., and Halberstadt, A. R. W. (2017). Anatomy of a meltwater drainage system beneath the ancestral East Antarctic ice sheet. Nat. Geosci. 10, 691–697. doi:10.1038/ngeo3012
Smith, B. E., Fricker, H. A., Joughin, I. R., and Tulaczyk, S. (2009). An inventory of active subglacial lakes in Antarctica detected by ICESat (2003–2008). J. Glaciol. 55, 573–595. doi:10.3189/002214309789470879
Smith, B. E., Gourmelen, N., Huth, A., and Joughin, I. (2017). Connected subglacial lake drainage beneath Thwaites Glacier, West Antarctica. Cryosphere 11, 451–467. doi:10.5194/tc-11-451-2017
Sole, A. J., Mair, D. W. F., Nienow, P. W., Bartholomew, I. D., King, M. A., and Burke, M. J. (2011). Seasonal speedup of a Greenland marine-terminating outlet glacier forced by surface melt–induced changes in subglacial hydrology. J Geophys. Res 116, F03014. doi:10.1029/2010JF001948
Solheim, A., and Kristoffersen, Y. (1984). The physical environment in the Western Barents Sea, 1: 5,000,000. Sediments above the upper regional unconformity: thickness, seismic stratigraphy and outline of the glacial history. Nor. Polarinst 179b, 26.
Stearns, L. A., Smith, B. E., and Hamilton, G. S. (2008). Increased flow speed on a large East Antarctic outlet glacier caused by subglacial floods. Nat. Geosci. 1, 827–831. doi:10.1038/ngeo356
Storrar, R. D., Evans, D. J. A., Stokes, C. R., and Ewertowski, M. (2015). Controls on the location, morphology and evolution of complex esker systems at decadal timescales, Breiðamerkurjökull, southeast Iceland. Earth Surf. Process. Landf. 40, 1421–1438. doi:10.1002/esp.3725
Storrar, R. D., Stokes, C. R., and Evans, D. J. A. (2013). A map of large Canadian eskers from Landsat satellite imagery. J. Maps 9, 456–473. doi:10.1080/17445647.2013.815591
Storrar, R. D., Stokes, C. R., and Evans, D. J. A. (2014). Morphometry and pattern of a large sample (20,000) of Canadian eskers and implications for subglacial drainage beneath ice sheets. Quat. Sci. Rev. 105, 1–25. doi:10.1016/j.quascirev.2014.09.013
Stroeven, A. P., Hättestrand, C., Kleman, J., Heyman, J., Fabel, D., and Fredin, O. (2016). Deglaciation of Fennoscandia. Quat. Sci. Rev. 147, 91–121. doi:10.1016/j.quascirev.2015.09.016
Sugiyama, S., Skvarca, P., Naito, N., Enomoto, H., Tsutaki, S., and Tone, K. (2011). Ice speed of a calving glacier modulated by small fluctuations in basal water pressure. Nat. Geosci. 4, 597–600. doi:10.1038/ngeo1218
Tedstone, A. J., Nienow, P. W., Gourmelen, N., Dehecq, A., Goldberg, D., and Hanna, E. (2015). Decadal slowdown of a land-terminating sector of the Greenland Ice Sheet despite warming. Nature 526, 692–695. doi:10.1038/nature15722
Tsai, V. C., and Rice, J. R. (2010). A model for turbulent hydraulic fracture and application to crack propagation at glacier beds. J. Geophys. Res. Earth Surf. 115 (F3), F03007. doi:10.1029/2009JF001474
Vaughan, D. G. (2008). West Antarctic Ice Sheet collapse – the fall and rise of a paradigm. Clim. Change 91, 65–79. doi:10.1007/s10584-008-9448-3
Walder, J. S. (1986). Hydraulics of Subglacial Cavities. J. Glaciol. 32, 439–445. doi:10.3189/S0022143000012156
Wingham, D. J., Siegert, M. J., Shepherd, A., and Muir, A. S. (2006). Rapid discharge connects Antarctic subglacial lakes. Nature 440, 1033–1036. doi:10.1038/nature04660
Winsborrow, M., and Knies, J. (2022). CAGE21-6 Cruise Report: Hydrocarbon leakage in Hopendjupet, central Barents Sea. CAGE – Cent. Arct. Gas. Hydrate Environ. Clim. Rep. Ser. 9. doi:10.7557/cage.6675
Keywords: esker, subglacial drainage, ice sheet hydrology, glacial geomorphology, barents sea, tunnel valley, meltwater channel, beaded esker
Citation: Shackleton C, Patton H, Winsborrow M, Esteves M, Bjarnadóttir L and Andreassen K (2023) Distinct modes of meltwater drainage and landform development beneath the last Barents Sea ice sheet. Front. Earth Sci. 11:1111396. doi: 10.3389/feart.2023.1111396
Received: 29 November 2022; Accepted: 03 April 2023;
Published: 18 April 2023.
Edited by:
Bethan Joan Davies, Newcastle University, United KingdomReviewed by:
Iestyn Barr, Manchester Metropolitan University, United KingdomKelly Hogan, British Antarctic Survey (BAS), United Kingdom
Copyright © 2023 Shackleton, Patton, Winsborrow, Esteves, Bjarnadóttir and Andreassen. This is an open-access article distributed under the terms of the Creative Commons Attribution License (CC BY). The use, distribution or reproduction in other forums is permitted, provided the original author(s) and the copyright owner(s) are credited and that the original publication in this journal is cited, in accordance with accepted academic practice. No use, distribution or reproduction is permitted which does not comply with these terms.
*Correspondence: Henry Patton, aGVucnkucGF0dG9uQHVpdC5ubw==