 Yue Li
 Mingzhao Hu2*†
- 1School of Economics, Ocean University of China, Qingdao, China
- 2Department of Statistics and Applied Probability, University of California, Santa Barbara, CA, United States
Exploring the relationship between industrial green development, technological innovation, and employment structure, especially the impact between industrial green development and technological innovation on employment structure, is of enormous theoretical and practical importance to achieve high-quality employment as well as optimize the employment structure of China. Thirty Chinese provinces’ data from 2009 to 2019 is adopted to assess industrial green development levels. Considering the above, this research innovatively integrates industrial green development, technological innovation, and employment structure into an analytical framework, and empirically investigates the effects of the two factors and their interaction on employment structure by adopting a two-way fixed effects model. The specific conclusions are presented as follows. Firstly, China’s industrial green development levels exhibit a fluctuating and rising time-series evolutionary feature from 2009 to 2019 and have regional differences. Secondly, industrial green development, technological innovation, and their interaction are conducive to optimizing China’s employment structure. Thirdly, the eastern and northeastern areas’ employment structure optimization is boosted by industrial green development. However, the corresponding regression coefficients in the western and central areas are not significant. The northeastern, eastern, and western areas’ technological innovation encourages employment structure improvement. Instead, the employment structure is hampered by technological innovation in the central region. An interaction between industrial green evolution and technological innovation positively affects relevant employment structures in the four regions. Specific results of this research are of necessary theoretical significance and the realistic reference price for whether industrial green development and the interplay affect employment structure.
1 Introduction
The implication of industrial green development and technological innovation where the employment structure is concerned is thought-provoking. Employment structure has become a vital factor in boosting China’s economy (Wu and Yang, 2022). China has always placed employment stabilization at the top of the “six stable” tasks and “six secure” tasks and implemented employment as a priority strategy. As the result, the employment structure is improved continuously. However, China’s employment is still facing a serious challenge. The structural contradictions of employment are prominent. Another important factor for economic and social development is technological innovation (Ma et al., 2022a) which is a key driver of employment change (Wang et al., 2021a). The function that technological innovation in the job skill structure is becoming increasingly significant (Ma et al., 2022a). The current new cycle of industrial transformation and technological revolution is emerging, which forces the industry to continuously accelerate green transformation and upgrading (Xie et al., 2020). Technological innovation has been a critical factor in leading industrial green development (Xie et al., 2020). The Ministry of Industry and Information Technology of the People’s Republic of China issued the 14th Five-Year Plan for Green Industrial Development in 2021. The plan states that China will promote the industrial revolution in an environment-friendly and low-carbon direction. Meanwhile, China is committed to fulfilling carbon neutrality by 2050. Bu et al. (2022) However, the industry currently continues to rely on a high consumption and emission development approach in China (Wang et al., 2021b). Resource and environmental issues have become bottlenecks that constrain industrial development. A vital mainstay of China’s national economy is industry which has a direct bearing on employment. Therefore, it is critical to optimize the employment structure by encouraging the industry to achieve green development.
The important influential effect of industrial green development on the employment structure has received considerable attention along with the internal structural adjustment and optimization of industry and the green transformation of development methods. Many institutions and scholars have deeply discussed the connotation of industrial green development. The United Nations Industrial Development Organization elaborated on its connotation in 2011. In the process of continuous industrial expansion, poverty is adequately addressed, new jobs are constantly created, the utilization efficiency of resources and energy is increased and environmental pollution is improved (United Nations Industrial Development Organization, 2011). In the same year, the Institute of Industrial Economics of the Chinese Academy of Social Sciences also explained it. Based on the orientation of resource conservation and environmental protection, the industry takes technological innovation as an important tool for advancing the greening and sustainability of production methods (Research Group of Institute of Industrial Economics of China Academy of Social Sciences, 2011). It is also to use technological innovation to change the composition of production factors, optimize resource utilization, waste emissions and industrial restructuring to attain reduced resource depletion and waste discharge at the same degree of output or raise industrial yield with no added resource depletion and waste release (Duan and Shi, 2021). In general, its connotation is mostly focused on both resource and environmental aspects. On this basis, various studies have also proposed different perspectives, such as technology, social welfare, and industrial economy. So, this study combines the above aspects to ensure the comprehensiveness of its definition. The main connotation can be understood as follows: the first is to enhance the effectiveness of industrial economic growth and stimulate the green development potential of industry aiming at promoting the high-quality development of the industrial economy; the second is to promote the effective use of resources and energy, take the innovation of green technology as the core power, and improve the development mode with high input and energy usage; the third is to reduce ecological pollution and strengthen environmental management and prevention. Existing researches assess industrial green evolution on the aspect of the degrees and efficiency. Scholars mainly measure industrial green development levels by using a single indicator (Zeng et al., 2020) and constructing a multidimensional comprehensive index system (Li et al., 2019; Li et al., 2020; Wang et al., 2021b; He et al., 2021). The comprehensive index system is divided into several subsystems, such as economic situation, resource utilization, and pollution reduction (Li et al., 2019; Li et al., 2020). Industrial green development efficiency is measured mainly by the stochastic frontier method (Honma and Hu, 2014; Makridou et al., 2016; Sun et al., 2019; Kang et al., 2022) and the data envelopment analysis method (Zhang et al., 2015; Lin and Tan, 2016; Li and Lin, 2017; Piao et al., 2019; Wu et al., 2019; Guo et al., 2020).
Regarding the connection between industrial green development and employment structure, existing researchers are concerned about the influence that environmental protection and regulation, and clean energy on employment structure. There is relatively little literature about how industrial green development affects employment structure directly. This article mainly reviews the indirect effects of industrial green development on employment structure. Clean energy creates jobs, increases employment opportunities for high-skilled workers (Ibrahiem and Sameh, 2020; Liu et al., 2022), and optimizes the employment structure (Zhang et al., 2017). Similarly, environmental regulation improves the work environment (Wu et al., 2022), reduces polluting production, controls pollution, and develops clean technologies (Li and Du, 2022) to optimize employment structure. Environmental regulations have heterogeneous effects on workers with different skills. High-skilled laborers are more likely to move to other jobs due to their high mobility after the implementation of environmental regulations (Zheng et al., 2022). Low-skilled workers are more vulnerable to relevant environmental regulations than high-skilled workers (Liu et al., 2021; Zheng et al., 2022). Nevertheless, Zhong et al. (2021) came to the opposite conclusion. Highly skilled workers are more vulnerable to changes in environmental legislation than those with low skills. It may be because the highly skilled workers have better skills, more stable wages, and greater concern for the environmental conditions of the job. Similarly, the effect of protecting the environment on employment is heterogeneous. Depending on the sectoral structure, environmental protection boosted business employment and depressed agricultural employment (Mori-Clement and Bednar-Friedl, 2019). According to gender structure, the closing of coal mines resulted in a decline in the female workforce employed and an augment in the manufacturing and service industries’ male workforce employed (Aragón et al., 2018).
With regard to the connection between employment structure and technology innovation, the labour market is affected by technological innovation, which leads to a decrease in employment opportunities in existing industries and an increase in employment opportunities in emerging industries (Kolade and Owoseni, 2022). The capacity to gather information varies among professions. Jobs at important information hubs are more advantageous in the technological innovation process (Kristal, 2020). Therefore, technological innovation has caused a bifurcation of the labor market to some extent, which means that jobs cluster more at the higher and lower levels (Autor and Dorn, 2009; Kim et al., 2019; Wang et al., 2021a; Kolade and Owoseni, 2022). Technological innovation encourages the employment of highly skilled labor since highly qualified labor is more in sync with technological development (Yang, 2022). Further research has found that jobs associated with creativity are unorthodox and have a low danger of being replaced (Kolade and Owoseni, 2022). Technological innovation has destroyed unskilled jobs (Mnif et al., 2016). The workforce it has displaced is mainly employed in basic, low-qualified, and low-skilled jobs (Bennett, 2016; Cortes et al., 2017; Acemoglu and Restrepo, 2020). However, Van Roy et al. (2018) discovered that technological innovation has a more substantial impact on workforce employment in high-technological and medium-technological manufacturing, while it is not statistically significant for the low-tech manufacturing sector. In the meantime, the function that technology innovation affects the employment structure has a turning point and an “inverted U-shape” form (Ma et al., 2022a; Wu and Yang, 2022).
However, there is a dearth of studies about how the interplay between industrial green development and technology innovation affects employment structure as well as the link between these three factors. This research establishes a multidimensional assessment indicator system of industrial green development and estimates green development levels in the industry with the Entropy Weight-TOPSIS method for exploring the direct effects of industrial green development, technological innovation, and their interactions on employment structure. Later, this study constructs a concrete two-way fixed effects model controlling for provincial-individual and year-time effects to discover the influence between industrial green development, technological innovation, and their interactions on employment structure. Finally, this article conducts robustness tests.
This article innovates in two ways. Firstly, aiming at industrial green development, existing studies focus on its level measurement and efficiency evaluation. Scholars mostly discussed its relationship with technological innovation, digital economy, and energy policy. There is a vacancy in its relationship with the employment structure. So, the relationship between them is directly explored in this article. Secondly, this research offers a general analysis of whether the interactive item between industrial green development and technology innovation affects employment structure. This article not only enriches the study of the connection between technological innovation and employment structure, but also fills the study gap of industrial green development and employment structure together with the interactive term about industrial green development and technological innovation, and employment structure. The above establishes a theoretical basis for the successive research.
2 Hypothesis
2.1 Industrial green development and employment structure
The concept of green development requires every province to concentrate more on green sustainable industrial growth, under the economic system of China (Su and Fan, 2022). It encourages workers with a wide range of skills, including the ability to operate and maintain pollution control equipment. Green development means introducing clean and pollution control technologies, increasing the amount of clean production equipment, and raising the efficiency of production processes. All of these have a substitution effect on low-quality personnel. Meanwhile, low-qualified workers cannot be immediately repositioned because of their high dependence on the job position (Zheng et al., 2022). So the number of low-skilled manufacturing workers is declined. The numerical control rate of each province is continuously improving. The trend of intelligence and information in manufacturing equipment is expanding in the provinces (Zhong et al., 2021). It will raise the demand for highly qualified workers with comprehensive skills and sophisticated talents, and decrease the demand for low-skilled manufacturing workers. So an ongoing employment structure optimization will occur. According to the foregoing, hypothesis 1 came up in this research.
Hypothesis 1. The improvement and upgrading of employment structure are facilitated by industrial green development.Industrial sectors are reluctant to pay high rates for highly skilled labor in the short term because they seek to maximize economic profits and save expenses (Qin et al., 2022). Meanwhile, industrial green development may raise the marginal cost of consumption and make the supply of highly skilled labor less incentivized (Aubert and Chiroleu-Assouline, 2019). Highly skilled individuals are reluctant to provide labor, which might make it less desirable to optimize the employment structure. According to the foregoing, hypothesis 2 came up in this research.
Hypothesis 2. The enhancement and optimization of the employment structure are rarely supported by industrial green development.
2.2 Technological innovation and employment structure
Technology has increased the level of threat faced by workers with repetitive tasks (Cassandro et al., 2021). Highly qualified personnel use technology more effectively. At the same time, technological innovation activities need to attract more highly qualified personnel to participate in (Georgieff and Hyee, 2022), which raises the need for high-educated and high-quality industrial labor and encourages the improvement and escalation of the employment structure. Additionally, the innovation of technology has prompted industries in various regions to introduce new technologies and equipment and develop new products. It requires workers to continuously improve the corresponding professional knowledge reserve and job skills (Kolade and Owoseni, 2022), which causes a shift in the labor force’s employment structure toward higher-skilled positions. According to the foregoing, hypothesis 3 came up in this research.
Hypothesis 3. The improvement of the labor employment structure is facilitated by technological innovation.
2.3 Interaction and employment structure
The interactive synergy between industrial green development and technological innovation is manifested as follows. On the one hand, industrial green development has an inducing and pulling effect on technological innovation (Song et al., 2022a). Various fields of the industry will follow the direction of the technological revolution and industrial transformation and take the initiative to accelerate green technological innovation as the means to that end in order to achieve green sustainability. On the other hand, technology innovation has a significant part to play in propelling industrial green development. It changes the mix of resource utilization, streamlines the industrial structure, and activates spillover effects for both human and technology capital to affect the green development of the industry (Duan and Shi, 2021). In order to achieve green, intensive, and efficient production in various industrial domains, the need for highly qualified and skilled workers in technology research and development, equipment operation and maintenance has increased. In the contrast, the need for low-skilled labor forces has decreased. The accelerated application of intelligent technologies continues to create more high-quality employment opportunities. With the impetus of technological innovation, various fields of industry have been improving their production processes, building a green and low-carbon talent pool, creating skill-based, knowledge-based, and complex jobs, and expanding the market for highly skilled labor. All of this help to optimize the employment structure. According to the foregoing, hypothesis 4 came up in this research.
Hypothesis 4. The interactive item between industrial green development and technological innovation facilitates employment structure to achieve optimization.
3 Materials and methods
3.1 Concrete introduction of industrial green development
A single indicator to measure industrial green development degree includes energy intensity and energy consumption per unit of GDP (Zeng et al., 2020). The multi-indicator system is composed of three main parts. The first is the industrial economic situation which mainly contains the industrial added value. The second is the resource use, including water resources, solid waste, and other resources. The third is pollution control which involves waste water, exhaust gas, smoke, and dust, etc. In addition, scholars also consider low-carbon production and technology (Li et al., 2020; Wang et al., 2021b). This article makes reference to the target tasks set by Chinese government departments in the Industrial Green Development Plan (2016–2020) and the relevant assessment indicators in the Green Development Index System. Following the principle of systematic, comprehensive, scientific, and feasible, and referring to relevant literature (Li et al., 2019; Li et al., 2020; Wang et al., 2021b; Duan and Shi, 2021), it then builds an assessment indicator system for industrial green expansion from two subsystems: industrial economic growth quality and industrial environmental pollution management. The quality of industrial economic growth contains three parts: industrial economic growth efficiency, industrial economic development potential, and industrial resource utilization efficiency. Industrial environmental pollution control includes industrial environmental pollution degrees and industrial environmental management levels. This research not only considers the three aspects covered in previous studies, but also adds indicators related to pollution treatment facilities. Details are presented in Table 1.
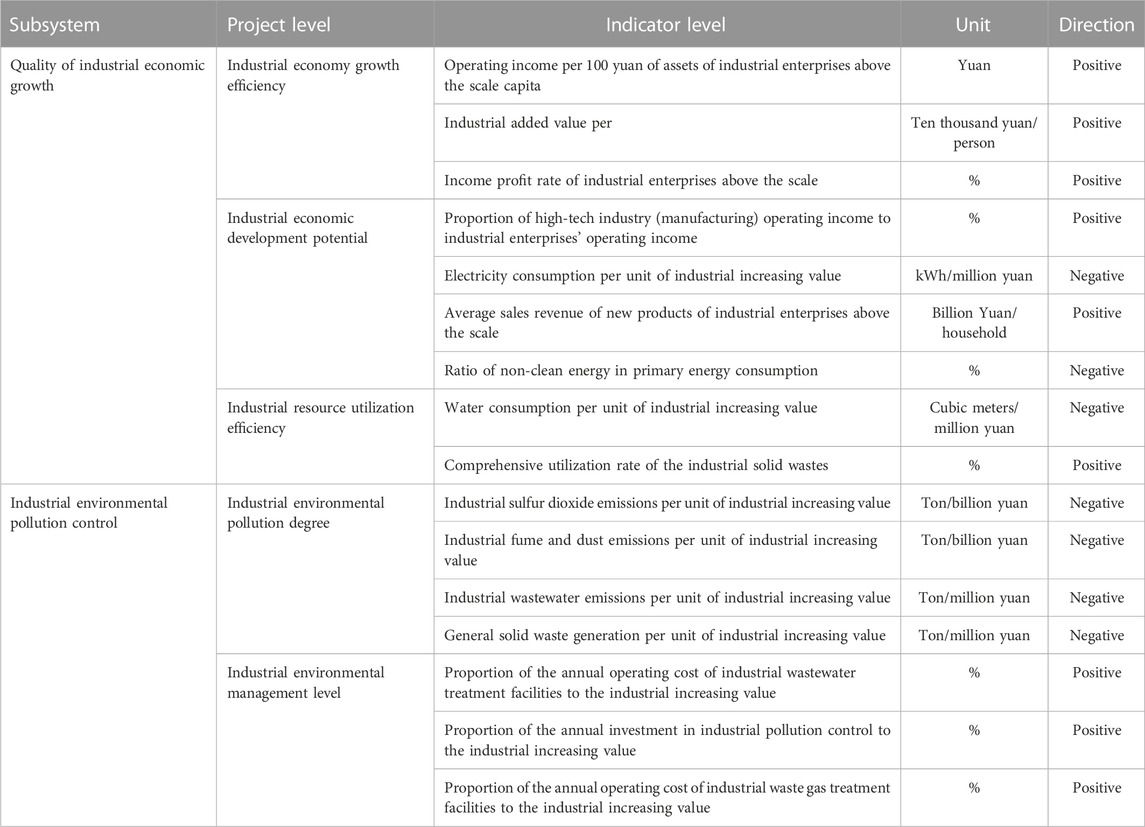
TABLE 1. Green development indicator system of the industry.
The common measures are principal component analysis, functional data analysis (He et al., 2021), the weighted-TOPSIS method (Li et al., 2019), the Entropy method (Xiao et al., 2022), the comprehensive index method (Xu et al., 2022), and the Entropy Weight-TOPSIS method (Wang et al., 2021b; Shang et al., 2022). This article measures Chinese provinces’ industrial green expansion levels through the Entropy Weight-TOPSIS method. This concrete method uses the Entropy Weight method (EWM) to give objective weight to evaluation indexes. Then, it assesses the benefits and drawbacks of industrial green expansion using the principle of approximate ideal solution ordering in the TOPSIS model (Hwang and Yoon, 1981). By using the EWM to define weights and addressing a problem of too-rough weight determination for evaluation indexes, this method effectively eliminates the effect of subjective factors on the results when compared to the traditional TOPSIS model. The Entropy Weight-TOPSIS method not only achieves a thorough assessment of multiple indicators but also facilitates a comparison of provincial dimensions horizontally and temporal dimensions vertically. It utilizes data effectively and produces outcomes that are unbiased and reasonable. So it is suitable for measuring industrial green development levels.
Eq. 1 is finally derived from the Entropy Weight-TOPSIS method. Deciding the relative proximity of evaluation targets to the ideal solution (
3.2 Variables situation
The specific variables are divided into explained variables, explained variables, and controlled variables in this paper. Employment structure (EMPLOY_S) is used as the explained variable. The employment structure covers several aspects, including gender structure, skill structure, and industry structure. This article measures the employment structure by utilizing the ratio of R&D workers in the employment of industrial firms above the designated size in every province, as it focuses on the skill structure of employment. Industrial green expansion and technological innovation are the core explanatory variables. The industrial green development (IGDP) levels in every province are expressed by the measured results of the evaluation index system. The two primary areas in which technological innovation is now represented in academia are technological innovation inputs and outputs. The outputs of technological innovation may more clearly demonstrate the level of technological innovation than its inputs. Existing studies have mainly measured its level. Scholars have mainly selected measurement indicators from two aspects: patents and technical cooperation. For patents, the corresponding indicators are the number of patent applications (Ahma et al., 2022; Song et al., 2022b), patents granted (Liang et al., 2022), and patents owned (Wang et al., 2023; Wei et al., 2023). Technological cooperation mainly includes technical cooperation grants (Chen et al., 2022). In order to measure technological innovation (TECH), this article adopts the number of industrial businesses’ effective invention patents above the size of each province. This indicator refers to previous studies and combines the industrial perspective. Compared with the previous indicator, it is more specific and consistent with the research topic.
The employment structure is influenced by a wide range of factors. Referring to relevant literature, the following four variables are primarily chosen as control variables in this article. 1) Industrial structural change (INS). Changes occurring in the industrial structure and new industries’ development necessitate adjustments in labor quality, which may alter employment structure. Industrial structural change is expressed by the logarithm of the tertiary sector’s share of GDP (Gao et al., 2022). 2) Foreign investment levels (FDI). The influence of foreign investment on employment structure depends on the way it enters. Foreign investment delivers cutting-edge technologies and managerial experience (Baffour et al., 2018). As a result, there is a greater need for highly skilled labor, which improves the employment skill structure. The country will continue to function as a global processing factory if foreign capital mostly arrives at the industrial chain in the low-end position, which hinders the improvement of the employment structure. The employment structure. The proportion of actual FDI utilization to GDP for each province is used to measure foreign investment levels (Li et al., 2019; Zhang et al., 2022). 3) Educational attainment (EDU). The higher workers’ education levels in a specific area, the more comprehensive the overall ability of workers. Enhancing the employment skills and quality of laborers can fully meet the demand for highly qualified workers in the new industries’ development, which helps to optimize the employment structure. Educational attainment by province is indicated by the ratio of general higher education undergraduates in the total population at year-end. 4) Wage levels (WAGE). The demand and supply of labor are impacted by changes in wage levels. When the minimum wage is high, higher wage levels imply higher costs and lower demand for low-skilled labor (Wang et al., 2019), which affects employment structure. To exclude the interference of price, this article uses urban units’ on-the-job workers’ average wage logarithm after CPI reduction based on the period of 2009 to reflect the wage levels. The situation of variables is displayed in Table 2.
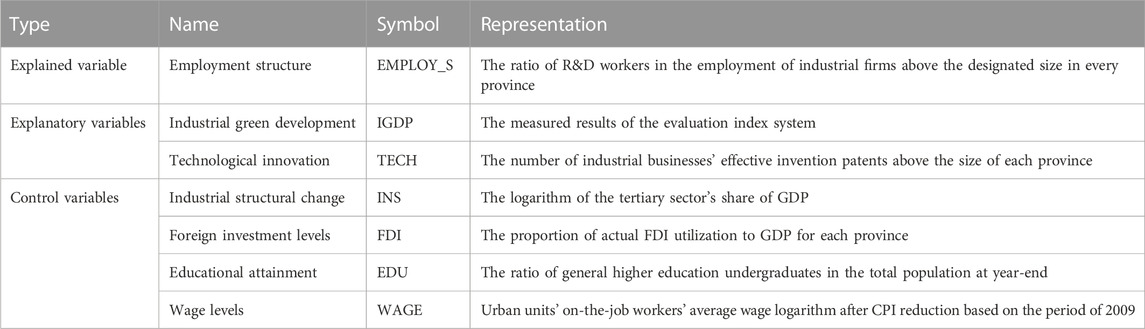
TABLE 2. Situation of variables.
3.3 Specific methodology
The two-way fixed effects (TWFE) model adequately attenuates the bias in results due to omitted variables and autocorrelation issues. Considering that the data type is short panel data, this article employs the Hausman test to compare models and finally builds this model controlling for both provincial fixed effects and year fixed effects. The specific models are as follows:
where
Although the TWFE model is better at circumventing the endogeneity problem arising from omitted variables, it still has the contingency of ignoring other influencing factors. Meanwhile, it is possible that industrial green development, technological innovation, and employment structure exist in a two-way causal relationship. In order to address the above issues and avoid bias in the estimation results, this article adopts a transformation measure to test the empirical results’ reliability. The specific measurement approach consults the practice of Li et al. (2019). The lag phase of the employment structure is included as an explanatory variable in the estimation equation on the basis of Eq. 5. It expands this model into a dynamic panel model and analyzes the robustness by the systematic generalized moment method (system GMM). The model is set up as follows:
where
3.4 Data situation
The 30 Chinese provinces’ (excluding Tibet) panel data between 2009 and 2019 are studied in this study. The main data sources include the National Bureau of Statistics of China and various Chinese statistical yearbooks, such as China Statistical Yearbook, China Industry Statistical Yearbook, China Statistical Yearbook On Environment, China Energy Statistical Yearbook, China Statistical Yearbook On Science and Technology, China Labour Statistical Yearbook, and so on. The linear interpolation and gray prediction methods and so on were used to fill in part of the missing data. Additionally, for eliminating the price interference on related measurement results, indicators with value attributes such as industrial value added and sales revenue of industrial enterprises above the scale were deflated adopting the relevant price indices with 2009 as the base period. Table 3 presents the variables’ statistical description. This article decentralized the data to obtain interaction terms and tested the variables for multicollinearity to avoid the possibility of regression bias due to the correlation among variables. According to the findings of the covariance test, the variance inflation factors (VIF) of all variables passed the crucial requirement of having a mean value of less than five and a maximum value of less than 10, demonstrating that the issue of multicollinearity among the variables did not exist. Further regression analysis can be carried out.
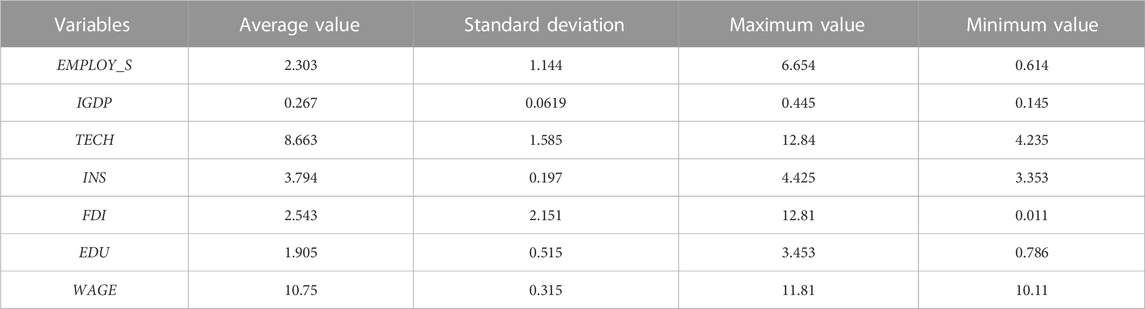
TABLE 3. Descriptive statistics.
4 Empirical results
4.1 Measuring results of IGDP
The integrated assessment values of industrial green expansion in every Chinese province are shown in Table 4. The five provinces with higher annual averages are Shanghai (0.3708), Guangdong (0.3689), Beijing (0.3534), Tianjin (0.3528), and Jiangsu (0.3500) in turn. It shows that industrial green development levels in the five provinces are in a relatively high position. The above five provinces are located in national key development areas. In recent years, they have continuously been enhancing high-end industry leadership and optimizing industrial structure. They also make great efforts to build green factories and manufacturing systems to improve the energy consumption structure and facilitate the industrial economy to achieve green growth. The bottom five provinces in the annual average are Liaoning (0.2175), Xinjiang (0.2135), Shaanxi (0.2077), Jilin (0.1995), and Gansu (0.1960). These provinces are still on the backward side in promoting industrial green development. As the old industrial bases of China, Liaoning and Jilin still have bottlenecks and shortcomings in transforming traditional industries and constructing sustainable and low-carbon cycles. Shaanxi, Gansu, and Xinjiang are located in the western region. Their foundations of industrial development such as infrastructure construction are insufficient.
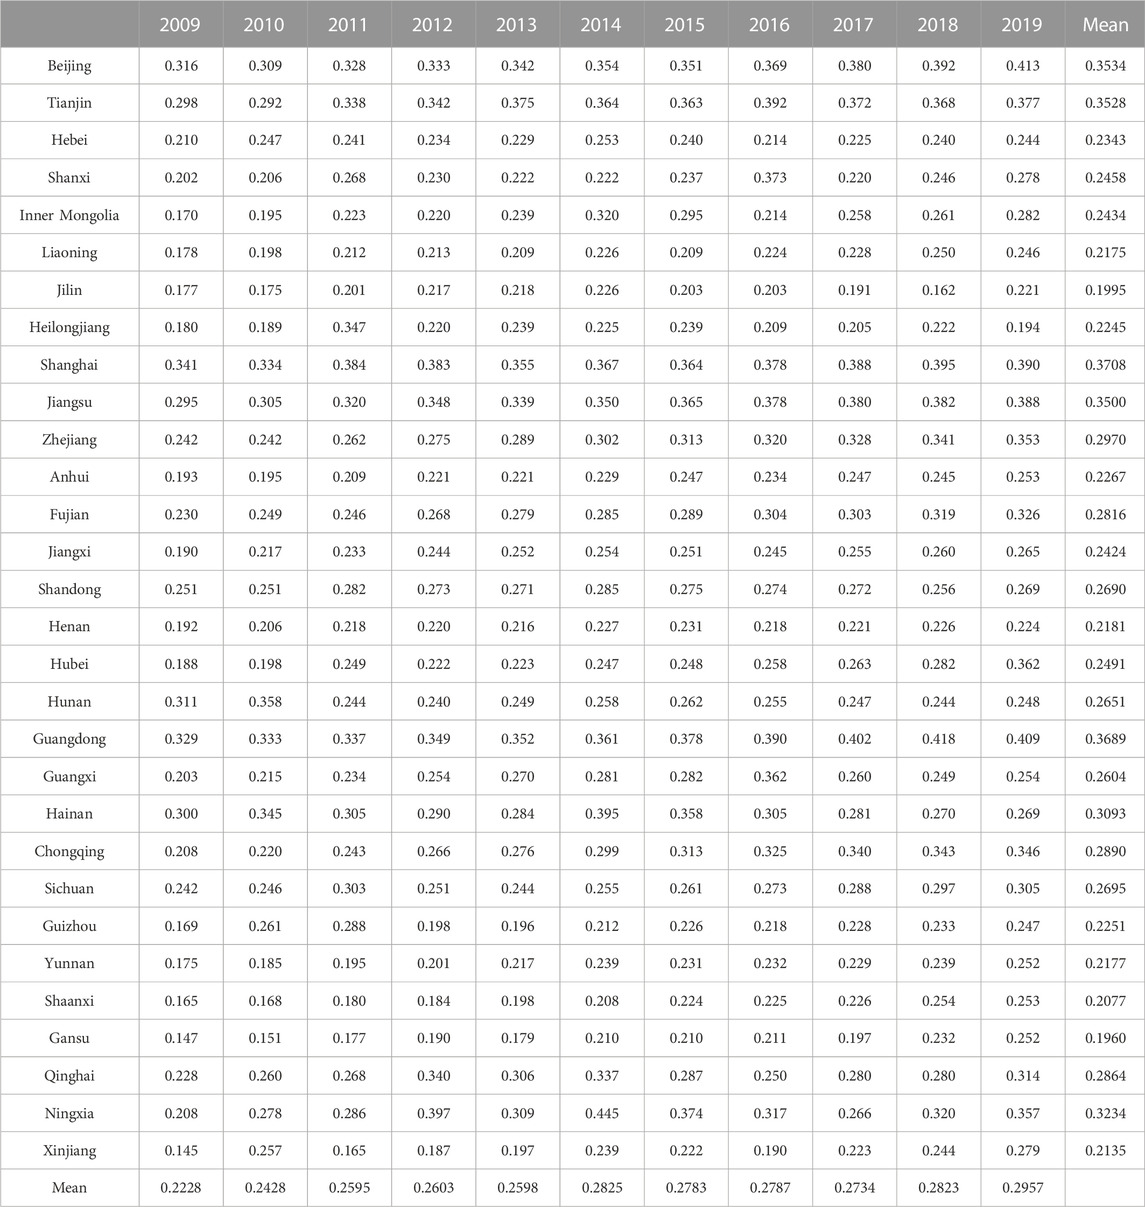
TABLE 4. Provincial levels of IGDP.
According to Figure 1, the degrees of industrial green expansion exhibit a time-series evolution with fluctuation and growth as its main characteristics. Industrial green development in China has achieved progress between 2009 and 2019, but the results remained inconsistent. Meanwhile, the annual average value was only 0.2669 during the 11-year period, which means that overall degrees of industrial green expansion were still low.
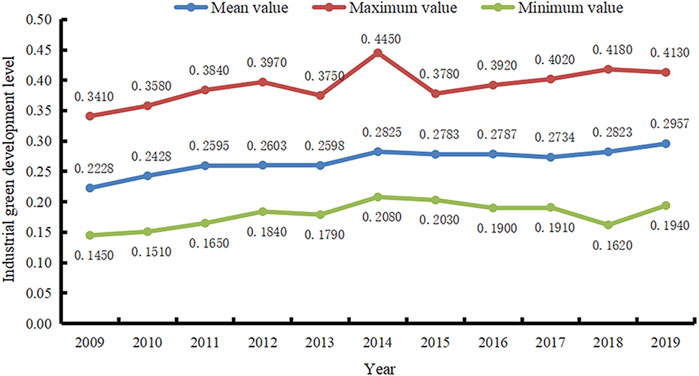
FIGURE 1. The levels of IGDP in China.
Based on China’s regional classification of the Chinese National Bureau of Statistics and related studies, this article divided 30 Chinese provinces (excluding Tibet) into four areas for comparative analysis, including the eastern area (Zhejiang, Hebei, Shanghai, Jiangsu, Guangdong, Fujian, Beijing, Tianjin, Shandong, and Hainan), the northeastern area (Heilongjiang, Jilin, and Liaoning), the central area (Hunan, Anhui, Henan, Hubei, Jiangxi, and Shanxi) and the western area (Inner Mongolia, Yunnan, Guangxi, Guizhou, Chongqing, Sichuan, Xinjiang, Qinghai, Gansu, Ningxia, and Shaanxi). The degrees of industrial green expansion in Chinese four regions from 2009 to 2019 are shown in Table 5. It is clear that all regions’ industrial green development degrees are slowly improving. However, there are significant variations among regions. According to industrial green development levels, the four regions are ranked as follows: eastern area, western area, central area, and northeastern area. The eastern provinces are highly open to the outside world. They have abundant human resources and strong advantageous industrial clusters. Additionally, they have achieved more remarkable results in facilitating new and old kinetic energy conversion, and accelerating industrial enterprises’ energy saving and consumption reduction, which has contributed to a strong industrial green momentum. The west area is clearly endowed with resources and energy, notably enriched clean energy. Recently, it has been vigorously undertaking the transfer of eastern industry, striving to move up to the high-end value chain and effectively transforming resource advantages into real productivity to continuously accelerate industrial green development. The six provinces contained by the central area belong to the Yellow River Basin and the Yangtze River Economic Belt, which have regional advantages for evolution. With the continuous attention to ecological protection in the Yellow River Basin and the Yangtze River Economic Belt in recent years, each province has been trying to explore the special route of industrial green development according to local conditions. The northern industrial structure is dominated by heavy industry. Energy consumption is dominated by coal. There are problems that restrict industrial green expansion in adjusting structure and changing mode.
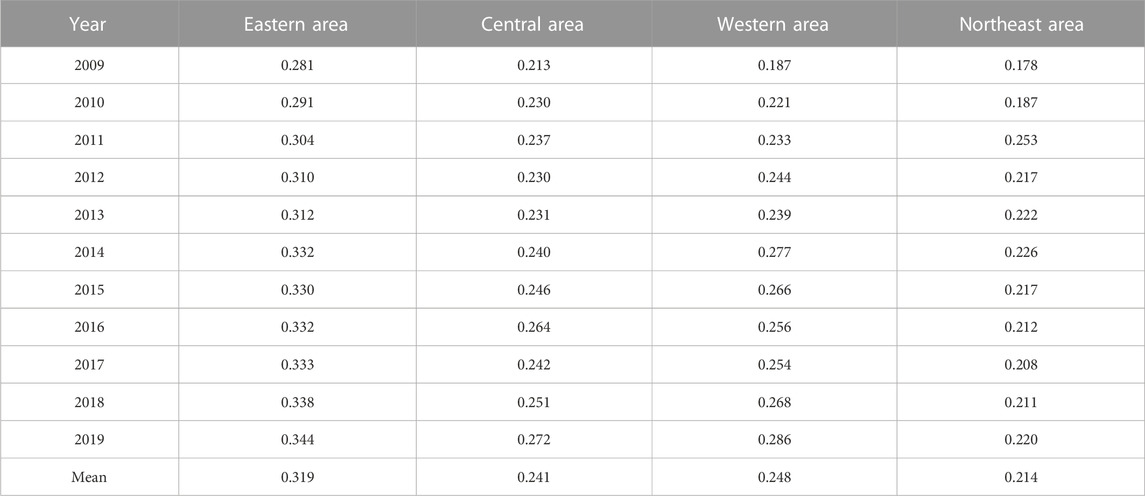
TABLE 5. Regional levels of IGDP.
4.2 Empirical analysis of employment structure
Regression analysis results about whether industrial green expansion, technological innovation, and their interactive item on employment structure are displayed in Table 6. The outcomes of introducing industrial green development and technological innovation are respectively reported in columns (1, 2). Column 3) indicates the effect on employment structure in the case of the introduction of both industrial green development and technological innovation. Column 4) introduces the interaction term between the two variables based on column 3) to examine how the interaction affects the employment structure.

TABLE 6. Industrial green development, technological innovation, and employment structure.
The results support hypothesis 1. The employment structure is significantly improved by the green improvement of the industry. Existing literature lays stress on industrial green development levels, but few pieces of literature directly explore its influence on employment structure. This conclusion provides innovative proofs of the relationship between them. The innovative research conclusion is helpful to encourage the provinces not only to think highly of the sustainable and greening evolution of the industry and pursue environmentally friendly production methods, but also to continuously accelerate the pace of intelligent and digital transformation. The possible reasons are as follows. In order to achieve green development, relevant policies are formulated by provinces. They may force polluting companies to transform to comply with green development requirements. Polluting enterprises are even more likely to shut down or close down (Zheng et al., 2022). The scale effect of production leads to the laid-off of low-skilled workers, which creates structural unemployment. The purpose of an enterprise is to maximize profits. The advantages of high-skilled workers with corresponding theoretical knowledge and practical experience are more prominent. Despite the high wages of high-skilled workers, enterprises will keep hiring high-skilled personnel to continue production. Thus, the employment structure is continuously promoted.
The estimation results demonstrate that technological innovation contributes to optimizing the employment structure, which verifies hypothesis 3. The results are in agreement with those of Tang et al. (2021). Currently, technological innovation has become a core way to break through the bottleneck of industrial development. New kinetic energy has been fostered and encouraged through technological progress. Moreover, robust talent support is essential for the expansion of technological innovation activities, which promotes the employment of high-quality labor forces (Ergül and Göksel, 2020). At the same time, technological innovation drives the gradual high-end of production methods and equipment. The manufacture of new industrial equipment is promoted by technological innovation. High-tech industries require constant access to new information (Sacristán Dı́Az and Quirós Tomás, 2002) which highly skilled people have the ability to collect. The industry needs high-quality labor forces adapted to the new technological environment to guarantee production, which boosts employment structure improvement.
The regression results demonstrate that the interaction of industry green development and technological innovation improves the employment structure, which proves the validity of hypothesis 4. This innovative research result guided by the interaction thought provides theoretical backing for the subsequent studies. The implementation of the green development concept requires the reduction of industrial pollutants, which has prompted every province to enhance the technology of industrial pollution management and actively achieve low-carbon transformation through technological innovation (Chen and Zheng, 2022). Technological innovation provides technical support for green development. It also improves the utilization of factors to reduce pollutant emissions (Duan and Shi, 2021). The concept of industrial green development has been deepened recently. The technical level and research and development capability have been improved. Both of them support and enhance each other. The way of industrial production organization has been innovated as a result of both factors working together. The “industrial internet + green manufacturing” integration model has been promoted one after another. Green low-carbon industries such as intelligent photovoltaics are developing rapidly. Clean technology in the process of industrial development requires talents with knowledge and experience in pollution control. Traditional high-polluting and energy-intensive industries have achieved pollution control and clean production by continuously increasing the proportion of skilled workers employed. Meanwhile, the new industries’ rapid development creates a lot of high-end positions and promotes the hiring of high-quality and high-skilled labor. Meanwhile, the cost of pollution control is raised. Technology leads to an increase in labor productivity (Xin, 2021). These contribute to a reduction in the required workers. A greater vulnerability of low-skilled workers may occur. So there will be a change in the employment structure toward seniority.
4.3 Robustness test
The following four main approaches are adopted for the robustness test to verify the reliability of the results and enhance the scientific validity of the article. Firstly, the measurement of relevant variables is replaced. For one thing, the levels of IGDP are recalculated by the EWM according to the assessment indicator system of industrial green development established in the previous part. For another thing, the number of invention patent applications of industrial enterprises above the designated size is selected as an alternative indicator of technological innovation. The specific estimation results are displayed in columns (1, 2) of Table 7. It is observed that regression coefficients of IGDP, TECH, and IGDP* TECH are significantly positive, which proves the reliability of the obtained results.
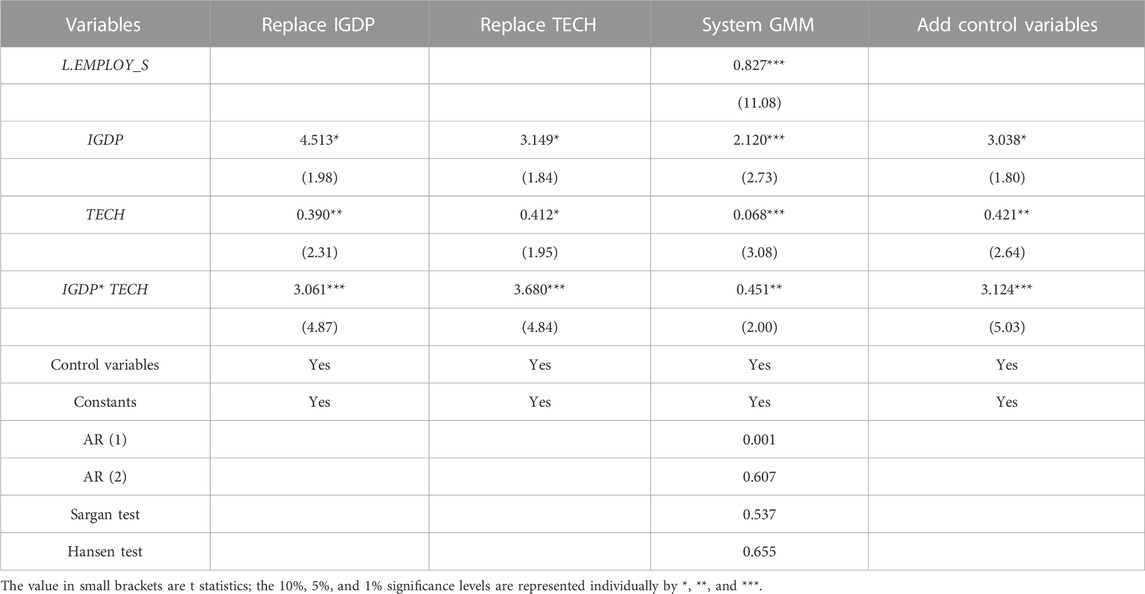
TABLE 7. Robustness test results 1.
Secondly, the robustness is examined in this article by modifying the measurement approach. The concrete results are presented in column 3) of Table 7. The sequence correlation test AR (2) indicates that second-order autocorrelation does not exist in the model. Hansen test and Sargan test demonstrate the effectiveness of the tool variables. The sign and significance of regression coefficients for industrial green development, technological innovation, and their interaction are in accord with those of benchmark regression. Therefore, the estimation findings discussed above pass the robustness test.
Thirdly, referring to the study of Lyu et al. (2022), the method of adding control variables is used in this research. On the basis of the original four control variables, GDP and urbanization levels are added in this study. The specific results are displayed in column 4) of Table 7. Similarly, the coefficients of all variables are significantly positive, indicating that the above estimation results are robust.
Fourthly, the tool variable method is adopted. Employment structure may adversely affect industrial green development and technological innovation. In order to deal with the endogenous problems caused by two-way causality, the two-stage least square method is used for regression. With reference to (Liu and Zhuo, 2021), this paper chooses the lag period of IGDP as the tool variable of IGDP. Additionally, the one-period lag of patent applications of industrial enterprises above the designated size and the number of Internet broadband access ports are selected as tool variables for technological innovation. The lag data is highly correlated with the current level, but not with the error term. The number of Internet ports is related to technological innovation. Meanwhile, they cannot directly affect the employment structure. They all satisfy the requirements of instrumental variables. Specific results are displayed in Table 8. It is found that the regression coefficients of IGDP and TECH are significantly positive. F statistics are above the 10% threshold, which implies that the instrumental variables are not weakly instrumental. The p-values are all less than 0.01, demonstrating that there is no unidentifiable problem. The robustness of the obtained results is proved.
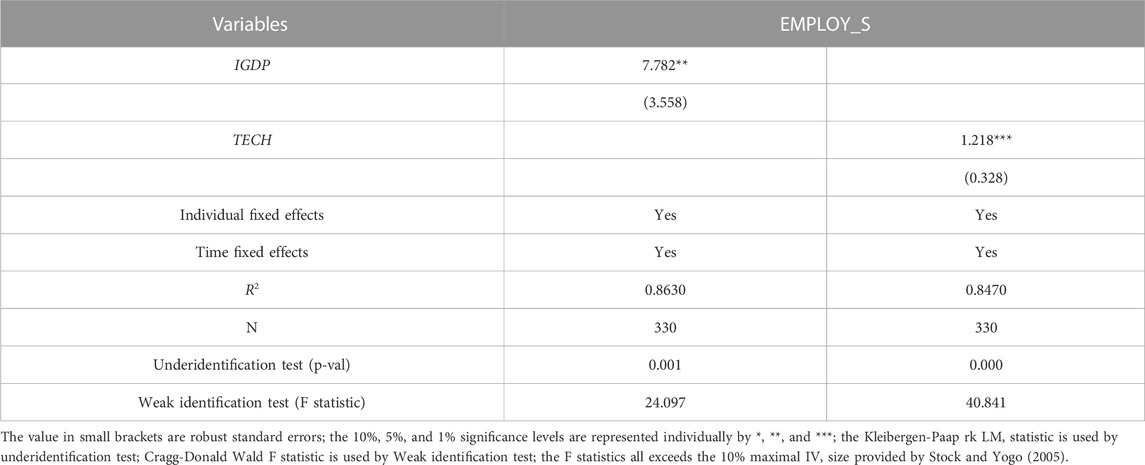
TABLE 8. Robustness test results 2.
4.4 Analysis of regional heterogeneity
China’s industrial green development levels exhibit spatial differences. Meanwhile, the capabilities for technological innovation are also clearly regionally different due to regional variations in economic development, opening degree, quality of human capital, and infrastructure development. Considering the possible diversities that the impact of different industrial green development degrees and technological innovation capabilities in the employment structure, this study further explores how industrial green development, technological innovation, and their interaction affect employment structure in four regions. The findings of the heterogeneity analysis are presented in Table 9. It is observed that the impacts of these factors on employment structure exhibit geographical diversity.
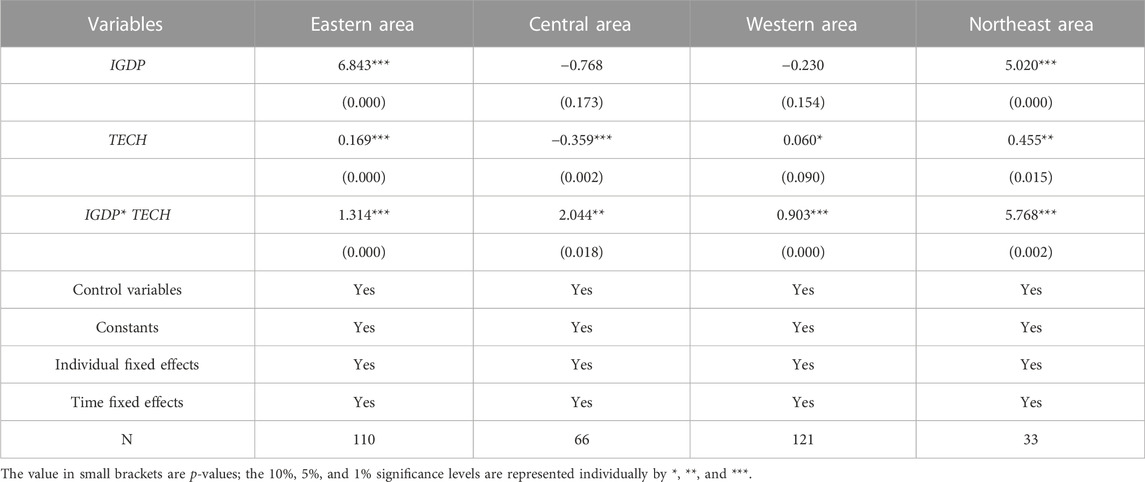
TABLE 9. Regression results of regional heterogeneity.
According to the coefficients of IGDP, this factor in the northeastern and eastern areas is beneficial to employment structure optimization. In contrast, the central and western areas’ coefficients show no significance. The radiation effect of employing high-skilled labor forces should be enforced by relying on advantageous policies and sticking to the orientation of green industrial development. However, the strict environmental restrictions have raised the constant costs of high-energy-consuming enterprises, perhaps because the current industrial growth in the central area still relatively relies more on energy resources. In order to pursue short-term profits, enterprises are reluctant to bear the high wages of high-skilled labor. Additionally, there is still a gap in the cultivation of modern industries such as advanced manufacturing, which is insufficient to attract high-quality labor. All of these factors lead to a non-significant influence of this factor on the employment structure. The western area is deficient in infrastructure construction, new industries cultivation, industrial scale, and factor allocation. Prohibited development zones and restricted development zones occupy a high proportion of the main functional areas’ construction. The constrained industrial green development is less attractive to talents, and the reserve and supply of highly qualified and skilled talents are insufficient.
According to the technological innovation regression coefficients in the eastern, western, and northeastern regions, employment structure optimization is considerably aided by technology innovation. However, the employment structure in the central area is negatively impacted by technological innovation. The interplay coefficients are positive in all areas, which implies that the interactive term impels the employment structure in a more forward-thinking direction.
5 Discussion and conclusion
5.1 Discussion
Research about whether industrial green development impacts employment structure as well as the influence of the interactive term of industrial green development and technology innovation on employment structure is currently a hot topic. Industrial green development is a solid foundation for optimizing employment structure. Industrial green development has reduced ecological environmental pollution (Li et al., 2019) and improved the working environment, which is essential to achieve fuller and higher-quality employment. The industrial green development degrees in China have been fluctuating upward in recent years. However, the level is still modest and varies among provinces. The differences arise from innate geographical conditions, resource situation, economy and population. How to improve the overall level of China’s industrial green development and play the leading role of the better-developed provinces is a key issue to be considered. Additionally, the necessity for green development compels the government to consider the impact of technological innovation which is subtly affecting employment in the labor market (Kolade and Owoseni, 2022). Therefore, the government should support industrial green development and play a role in technological innovation to optimize the employment structure. The optimization of employment structure means that highly qualified workers have more employment opportunities while low-quality workers will be eliminated from their jobs. The speed of technological change is accelerating. Green development requires industrial workers to have appropriate skills. If low-qualified workers do not update their skills and stick to their own, they will face fewer employment opportunities (Gagliardi, 2019) and great challenges in the job competition. Therefore, it is necessary to focus on the improvement of their skills and enhance their competitiveness in the job market.
However, there is still room for optimization in this article. The data type is the panel data of each Chinese province. Future studies should focus on each Chinese prefecture-level city and lengthen the study period to more thoroughly examine how industrial green development and technological innovation affect employment structure. It will be crucial to enrich the research findings relating to industrial green development, technological innovation, and employment structure.
5.2 Conclusions and policy implications
This article uses the Entropy Weight-TOPSIS method to estimate 30 Chinese provinces’ industrial green development degrees and constructs the TWFE model equipped with provincial and year fixed effects. It innovatively dissects the impact caused by industrial green development and the interactive term of technology innovation and industrial green expansion on employment structure. The specific outcomes mean that 1) The Chinese industrial green development degrees show a fluctuating and ascending historical evolutionary characteristic from 2009 to 2019. Although industrial green development has achieved results, the results are inconsistent and still at a low level. Meanwhile, the green expansion of industry varies regionally. The ranking of industrial green expansion degrees in the four major areas is the eastern, western, central, and northeastern areas in turn. 2) Green development of industry, innovation of technology, and their interaction contribute to optimizing employment structure. The impact varies between geographic areas. The industrial green expansion benefits employment structure optimization in the east and northeast areas, but the coefficients are not significant in the central and western areas. The employment structure is significantly influenced by technological innovation in the eastern, western, and northeastern areas. However, the opposite conclusion is drawn in the central area. It is in favor of upgrading the employment structure through the interplay between technology innovation and industrial green development.
China should optimize the employment structure from the following three aspects in the future. 1) Accelerate the pace of industrial green development. For one thing, the government reduces the cost of updating traditional industrial equipment and advancing technology through policies such as tax reduction and subsidies. It also provides professional training for low-skilled industrial workers. For another thing, industries strive to accomplish green and clearer production (Zhang et al., 2022), strengthen the construction of environmental protection equipment and actions to control environmental pollution (Wang et al., 2020), and use clean energy (Zheng et al., 2022).
2) Encourage technological innovation (He et al., 2021). For one thing, the industry should add research and development institutions and research projects, as well as the share of researchers working on technology development and transformation. The government provides sufficient funds for technological development. For another thing, fresh development momentum is generated by technological innovation. Digital high-tech industries’ development such as artificial intelligence should be accelerated.
3) Play a role in regional radiation of industrial green development and technological innovation, encourage the reasonable flow of factors such as knowledge, management, technology, and other new production factors in the four regions. The eastern area should generate a leading effect in the demonstration, accelerate the rise of new industries, and strengthen the promotion of advanced experience. The central and western areas should undertake the technology spillovers from the eastern region (Ma et al., 2022b). It is necessary for the western area to break down the structure contradiction caused by the single industrial structure, and develop industries such as new energy, intelligent green textile and clothing processing, and so on. The northeast area needs to speed up the digital transformation of traditional industries, and carry out counterpart cooperation with other regions.
Data availability statement
The original contributions presented in the study are included in the article; further inquiries can be directed to the corresponding author.
Author contributions
YL: Conceptualization, Methodology, Formal analysis, Software, Writing-original draft. MH: Validation, Conceptualization, Visualization, Writing-review and editing, Funding acquisition. LZ: Conceptualization, Supervision, Project management, Writing-review and editing, Funding acquisition.
Funding
This research was funded by the National Natural Science Foundation of China (Nos. 71974176, 71473233) and the UCSB Open Access Publishing Fund.
Conflict of interest
The authors declare that the research was conducted in the absence of any commercial or financial relationships that could be construed as a potential conflict of interest.
Publisher’s note
All claims expressed in this article are solely those of the authors and do not necessarily represent those of their affiliated organizations, or those of the publisher, the editors and the reviewers. Any product that may be evaluated in this article, or claim that may be made by its manufacturer, is not guaranteed or endorsed by the publisher.
References
Acemoglu, D., and Restrepo, P. (2020). Unpacking skill bias: Automation and new tasks. Aea Pap. Proc. 110, 356–361. doi:10.1257/pandp.20201063
Ahma, N., Youjin, L., Žiković, S., and Belyaeva, Z. S. (2022). The effects of technological innovation on sustainable development and environmental degradation: Evidence from China. Technol. Soc. 72, 102184. doi:10.1016/j.techsoc.2022.102184
Aragón, F. M., Rud, J. P., and Toews, G. (2018). Resource shocks, employment, and gender: Evidence from the collapse of the UK coal industry. Lab. Econ. 52, 54–67. doi:10.1016/j.labeco.2018.03.007
Aubert, D., and Chiroleu-Assouline, M. (2019). Environmental tax reform and income distribution with imperfect heterogeneous labour markets. Eur. Econ. Rev. 116, 60–82. doi:10.1016/j.euroecorev.2019.03.006
Autor, D., and Dorn, D. (2009). This job is "getting old": Measuring changes in job opportunities using occupational age structure. Amer. Econ. Rev. 99 (2), 45–51. doi:10.1257/aer.99.2.45
Baffour, P. T., Ebo Turkson, F., Gyeke-Dako, A., Oduro, A. D., and Abbey, E. N. (2018). Innovation and employment in manufacturing and service firms in Ghana. Small Bus. Econ. 54 (4), 1153–1164. doi:10.1007/s11187-018-0120-7
Bennett, J. (2016). Skill-specific unemployment risks: Employment protection and technological progress – a cross-national comparison. J. Eur. Soc. Policy. 26 (5), 402–416. doi:10.1177/0958928716664294
Bu, T., Du, W. H., Tang, C. X., Liu, Y. H., Wang, X. Y., Wang, Y. H., et al. (2022). Market-oriented environmental regulations, employment adjustment and transfer path: Quasi-experimental evidence from China's carbon emissions trading pilot. J. Clean. Prod. 369, 133292. doi:10.1016/j.jclepro.2022.133292
Cassandro, N., Centra, M., Guarascio, D., and Esposito, P. (2021). What drives employment–unemployment transitions? Evidence from Italian task-based data. Econ. Polit. 38 (3), 1109–1147. doi:10.1007/s40888-021-00237-5
Chen, X., Rahaman, M. A., Murshed, M., Mahmood, H., and Hossain, M. A. (2022). Causality analysis of the impacts of petroleum use, economic growth, and technological innovation on carbon emissions in Bangladesh. Energy 267, 126565. doi:10.1016/j.energy.2022.126565
Chen, Z., and Zheng, J. (2022). Can green technology innovation promote high-quality regional economic development? Mod. Econ. Sci. 44 (04), 43–58.
Cortes, G. M., Jaimovich, N., and Siu, H. E. (2017). Disappearing routine jobs: Who, how, and why? J. Monet. Econ. 91, 69–87. doi:10.1016/j.jmoneco.2017.09.006
Duan, L. L., and Shi, D. Y. (2021). Technological innovation, market proximity, and China's industrial green development. Chin. J. Popul. Resour. 19 (1), 1–11. doi:10.1016/j.cjpre.2021.12.001
Ergül, Ö., and Göksel, T. (2020). The effects of technological development on the labor share of national income. Econ. Model. 87, 158–171. doi:10.1016/j.econmod.2019.07.015
Gagliardi, L. (2019). The impact of foreign technological innovation on domestic employment via the industry mix. Res. Policy. 48 (6), 1523–1533. doi:10.1016/j.respol.2019.03.005
Gao, P. F., Wang, Y. D., Zou, Y., Su, X. F., Che, X. H., and Yang, X. D. (2022). Green technology innovation and carbon emissions nexus in China: Does industrial structure upgrading matter? Front. Psychol. 13, 951172. doi:10.3389/fpsyg.2022.951172
Georgieff, A., and Hyee, R. (2022). Artificial intelligence and employment: New cross-country evidence. Front. Artif. Intell. 5, 832736. doi:10.3389/frai.2022.832736
Guo, Y. H., Tong, L. J., and Mei, L. (2020). The effect of industrial agglomeration on green development efficiency in Northeast China since the revitalization. J. Clean. Prod. 258, 120584. doi:10.1016/j.jclepro.2020.120584
He, L. Y., Sun, Y. M., Xia, Y. F., and Zhong, Z. Q. (2021). Construction of a green development performance index of industrial enterprises: Based on the empirical study of 458 listed industrial enterprises in China. Ecol. Indic. 132, 108239. doi:10.1016/j.ecolind.2021.108239
Honma, S., and Hu, J. (2014). A panel data parametric frontier technique for measuring total-factor energy efficiency: An application to Japanese regions. Energy 78, 732–739. doi:10.1016/j.energy.2014.10.066
Hwang, C. L., and Yoon, K. P. (1981). Multiple attribute decision making. Methods and applications. A state-of- the-art survey. New York: Springer-Verlag.
Ibrahiem, D. M., and Sameh, R. (2020). How do clean energy sources and financial development affect unemployment? Empirical evidence from Egypt. Environ. Sci. Pollut. Res. Int. 27 (18), 22770–22779. doi:10.1007/s11356-020-08696-2
Kang, J. J., Yu, C. Y., Xue, R., Yang, D., and Shan, Y. L. (2022). Can regional integration narrow city-level energy efficiency gap in China? Energy Policy 163, 112820. doi:10.1016/j.enpol.2022.112820
Kim, E., Hong, A., and Hwang, J. (2019). Polarized labor demand owing to routine-biased technological change: The case of Korea from 1993 to 2015. Telemat. Inf. 39, 1–10. doi:10.1016/j.tele.2018.12.002
Kolade, O., and Owoseni, A. (2022). Employment 5.0: The work of the future and the future of work. Technol. Soc. 71, 102086. doi:10.1016/j.techsoc.2022.102086
Kristal, T. (2020). Why has computerization increased wage inequality? Information, occupational structural power, and wage inequality. Work Occup. 47 (4), 466–503. doi:10.1177/0730888420941031
Li, J. L., and Lin, B. Q. (2017). Ecological total-factor energy efficiency of China's heavy and light industries: Which performs better? Renew. Sust. Energ. Rev. 72, 83–94. doi:10.1016/j.rser.2017.01.044
Li, M. J., and Du, W. J. (2022). The impact of environmental regulation on the employment of enterprises: An empirical analysis based on scale and structure effects. Environ. Sci. Pollut. Res. Int. 29 (15), 21705–21716. doi:10.1007/s11356-021-17460-z
Li, W., Wang, J., Chen, R. X., Xi, Y. Q., Liu, S. Q., Wu, F. M., et al. (2019). Innovation-driven industrial green development: The moderating role of regional factors. J. Clean. Prod. 222, 344–354. doi:10.1016/j.jclepro.2019.03.027
Li, W., Xi, Y. Q., Liu, S. Q., Li, M. J., Chen, L., Wu, X. P., et al. (2020). An improved evaluation framework for industrial green development: Considering the underlying conditions. Ecol. Indic. 112, 106044. doi:10.1016/j.ecolind.2019.106044
Liang, H., Lin, S., and Wang, J. (2022). Impact of technological innovation on carbon emissions in China's logistics industry: Based on the rebound effect. J. Clean. Prod. 377, 134371. doi:10.1016/j.jclepro.2022.134371
Lin, B. Q., and Tan, R. P. (2016). Ecological total-factor energy efficiency of China’s energy intensive industries. Ecol. Indic. 70, 480–497. doi:10.1016/j.ecolind.2016.06.026
Liu, B. C., Song, C. Y., Wang, Q. S., and Wang, Y. (2022). Forecasting of China's solar PV industry installed capacity and analyzing of employment effect: Based on GRA-BiLSTM model. Environ. Sci. Pollut. Res. Int. 29 (3), 4557–4573. doi:10.1007/s11356-021-15957-1
Liu, M. D., Tan, R. P., and Zhang, B. (2021). The costs of “blue sky”: Environmental regulation, technology upgrading, and labor demand in China. J. Devel. Econ. 150, 102610. doi:10.1016/j.jdeveco.2020.102610
Liu, Y., and Zhuo, C. (2021). Research on the impact of green development on poverty alleviation: Based on the comparative analysis of concentrated and contiguous poverty-stricken areas and non-concentrated and non-contiguous poverty-stricken areas in China. J. Finance Econ. 47 (4). doi:10.16538/j.cnki.jfe.20201211.402
Lyu, R.-J., Li, W.-H., and Zhang, Y.-M. (2022). Service-oriented transformation and employment skill structure optimization——from the perspective of artificial intelligence application. Soft Sci., 1–13.
Ma, H. M., Gao, Q., Li, X. Z., and Zhang, Y. (2022a). AI development and employment skill structure: A case study of China. Econ. Anal. Pol. 73, 242–254. doi:10.1016/j.eap.2021.11.007
Ma, Q. F., Jia, P., and Kuang, H. B. (2022b). Spatial imbalance and factors influencing carbon emission efficiency in China’s transport industry. Front. Earth Sci. 10. doi:10.3389/feart.2022.986467
Makridou, G., Andriosopoulos, K., Doumpos, M., and Zopounidis, C. (2016). Measuring the efficiency of energy-intensive industries across European countries. Energy Policy 88, 573–583. doi:10.1016/j.enpol.2015.06.042
Mnif, S., Feki, C., and Abdelkafi, I. (2016). Effects of technological shock on employment: Application of structural approach VECM. J. Knowl. Econ. 9 (4), 1138–1153. doi:10.1007/s13132-016-0405-5
Mori-Clement, Y., and Bednar-Friedl, B. (2019). Do clean development mechanism projects generate local employment? Testing for sectoral effects across Brazilian municipalities. Ecol. Econ. 157, 47–60. doi:10.1016/j.ecolecon.2018.10.011
Piao, S. R., Li, J., and Ting, C. J. (2019). Assessing regional environmental efficiency in China with distinguishing weak and strong disposability of undesirable outputs. J. Clean. Prod. 227, 748–759. doi:10.1016/j.jclepro.2019.04.207
Qin, B. T., Liu, L., Yang, L., and Ge, L. M. (2022). Environmental regulation and employment in resource-based cities in China: The threshold effect of industrial structure transformation. Front. Environ. Sci. 10. doi:10.3389/fenvs.2022.828188
Research Group of Institute of Industrial Economics of China Academy of Social Sciences (2011). Research on China's industrial green transformation. China Ind. Econ. 4, 5–14. doi:10.19581/j.cnki.ciejournal.2011.04.001
Sacristán Dı́Az, M., and Quirós Tomás, F. J. (2002). Technological innovation and employment: Data from a decade in Spain. Int. J. Prod. Econ. 75 (3), 245–256. doi:10.1016/s0925-5273(01)00115-3
Shang, D., Lu, H., Liu, C., Wang, D., and Diao, G. (2022). Evaluating the green development level of global paper industry from 2000-2030 based on a market-extended LCA model. J. Clean. Prod. 380, 135108. doi:10.1016/j.jclepro.2022.135108
Song, M. L., Peng, L. C., Shang, Y. P., and Zhao, X. (2022a). Green technology progress and total factor productivity of resource-based enterprises: A perspective of technical compensation of environmental regulation. Technol. Forecast. Soc. Change. 174, 121276. doi:10.1016/j.techfore.2021.121276
Song, Y., Zhang, Z., Zhang, Y., and Cheng, J. (2022b). Technological innovation and supply of critical metals: A perspective of industrial chains. Resour. Policy 79, 103144. doi:10.1016/j.resourpol.2022.103144
Su, Y., and Fan, Q.-M. (2022). Renewable energy technology innovation, industrial structure upgrading and green development from the perspective of China's provinces. Technol. Forecast. Soc. Change. 180, 121727. doi:10.1016/j.techfore.2022.121727
Sun, J. C., Du, T., Sun, W. Q., Na, H. M., He, J. F., Qiu, Z. Y., et al. (2019). An evaluation of greenhouse gas emission efficiency in China's industry based on SFA. Sci. Total Environ. 690, 1190–1202. doi:10.1016/j.scitotenv.2019.07.093
Tang, C. J., Huang, K. Q., and Liu, Q. R. (2021). Robots and skill-biased development in employment structure: Evidence from China. Econ. Lett. 205, 109960. doi:10.1016/j.econlet.2021.109960
United Nations Industrial Development Organization (2011). UNIDO green industry: Policies for supporting green industry. Avaialable at: http://www.unido.org/fileadmin/user_media/Services/Green_Industry/web_policies_green_industry.pdf (Accessed May 03, 2011).
Van Roy, V., Vértesy, D., and Vivarelli, M. (2018). Technology and employment: Mass unemployment or job creation? Empirical evidence from European patenting firms. Res. Policy. 47 (9), 1762–1776. doi:10.1016/j.respol.2018.06.008
Wang, J., Dong, X., and Dong, K. (2023). Does renewable energy technological innovation matter for green total factor productivity? Empirical evidence from Chinese provinces. Sustain. Energy Technol. Assess. 55, 102966. doi:10.1016/j.seta.2022.102966
Wang, J., Hu, Y., and Zhang, Z. M. (2021a). Skill-biased technological change and labor market polarization in China. Econ. Model. 100, 105507. doi:10.1016/j.econmod.2021.105507
Wang, W. Y., Phillips, P. C. B., and Su, L. J. (2019). The heterogeneous effects of the minimum wage on employment across states. Econ. Lett. 174, 179–185. doi:10.1016/j.econlet.2018.11.002
Wang, Y., Hu, H., Dai, W. J., and Burns, K. (2021b). Evaluation of industrial green development and industrial green competitiveness: Evidence from Chinese urban agglomerations. Ecol. Indic. 124, 107371. doi:10.1016/j.ecolind.2021.107371
Wang, Y., Sun, X. H., Wang, B. C., and Liu, X. L. (2020). Energy saving, ghg abatement and industrial growth in oecd countries: A green productivity approach. Energy 194, 116833. doi:10.1016/j.energy.2019.116833
Wei, L., Lin, B., Zheng, Z., Wu, W., and Zhou, Y. (2023). Does fiscal expenditure promote green technological innovation in China? Evidence from Chinese cities. Environ. Impact Assess. Rev. 98, 106945. doi:10.1016/j.eiar.2022.106945
Wu, B. Z., and Yang, W. G. (2022). Empirical test of the impact of the digital economy on China's employment structure. Finance Res. Lett. 49, 103047. doi:10.1016/j.frl.2022.103047
Wu, J., Li, M. J., Zhu, Q. Y., Zhou, Z. X., and Liang, L. (2019). Energy and environmental efficiency measurement of China's industrial sectors: A dea model with non-homogeneous inputs and outputs. Energy Econ. 78, 468–480. doi:10.1016/j.eneco.2018.11.036
Wu, W. P., Yan, J. J., Chen, Y. H., Wang, Z. J., and Lin, Y. R. (2022). Has environmental policy improved the job quality of migrant workers? A quasi-natural experiment on China's clean air action. J. Clean. Prod. 347, 131231. doi:10.1016/j.jclepro.2022.131231
Xiao, Y., Chen, J., Wang, X., and Lu, X. (2022). Regional green development level and its spatial spillover effects: Empirical evidence from Hubei Province, China. Ecol. Indic. 143, 109312. doi:10.1016/j.ecolind.2022.109312
Xie, W. C., Yan, T. H., Xia, S. M., and Chen, F. Z. (2020). Innovation or introduction? The impact of technological progress sources on industrial green transformation of resource-based cities in China. Front. Energy Res. 8. doi:10.3389/fenrg.2020.598141
Xin, M. (2021). Research on technological innovation effect of environmental regulation from perspective of industrial transfer: Evidence in China's thermal power industry. Clean. Eng. Technol. 4, 100178. doi:10.1016/j.clet.2021.100178
Xu, G., Chang, H., Meng, L., and Sine Marma, K. J. (2022). Green development level, resource utilization, and ecological protection across China from 2006 to 2017: Based on the national standard indicator system. Environ. Dev. 44, 100776. doi:10.1016/j.envdev.2022.100776
Yang, C.-H. (2022). How artificial intelligence technology affects productivity and employment: Firm-level evidence from taiwan. Res. Policy. 51 (6), 104536. doi:10.1016/j.respol.2022.104536
Zeng, J., Tong, W., and Tang, T. (2020). How do energy policies affect industrial green development in China: Renewable energy, energy conservation, or industrial upgrading? Chin. J. Popul. Resour. 18 (2), 79–86. doi:10.1016/j.cjpre.2021.04.020
Zhang, H. T., Sun, X. M., Ahmad, M., Lu, Y., and Xue, C. K. (2022). A step towards a green future: Does sustainable development policy reduce energy consumption in resource-based cities of China? Front. Environ. Sci. 10. doi:10.3389/fenvs.2022.901721
Zhang, N., Kong, F. B., and Yu, Y. N. (2015). Measuring ecological total-factor energy efficiency incorporating regional heterogeneities in China. Ecol. Indic. 51, 165–172. doi:10.1016/j.ecolind.2014.07.041
Zhang, S. F., Chen, Y., Liu, X. L., Yang, M. S., and Xu, L. (2017). Employment effects of solar PV industry in China: A spreadsheet-based analytical model. Energy Policy 109, 59–65. doi:10.1016/j.enpol.2017.06.058
Zheng, J. J., He, J., Shao, X. F., and Liu, W. (2022). The employment effects of environmental regulation: Evidence from eleventh five-year plan in China. J. Environ. Manage. 316, 115197. doi:10.1016/j.jenvman.2022.115197
Keywords: industrial green development, technological innovation, employment structure, two-way fixed effects model, dynamic panel model, China
Citation: Li Y, Hu M and Zhao L (2023) Study on the impact of industrial green development and technological innovation on employment structure. Front. Earth Sci. 11:1115476. doi: 10.3389/feart.2023.1115476
Received: 04 December 2022; Accepted: 20 January 2023;
Published: 02 February 2023.
Edited by:
Chuanwang Sun, Xiamen University, ChinaReviewed by:
Xiaodong Yang, Xinjiang University, ChinaMian Yang, Wuhan University, China
Lanyun Chen, Jimei University, China
Copyright © 2023 Li, Hu and Zhao. This is an open-access article distributed under the terms of the Creative Commons Attribution License (CC BY). The use, distribution or reproduction in other forums is permitted, provided the original author(s) and the copyright owner(s) are credited and that the original publication in this journal is cited, in accordance with accepted academic practice. No use, distribution or reproduction is permitted which does not comply with these terms.
*Correspondence: Lingdi Zhao, bGluZ2RpemhhbzUxMkAxNjMuY29t; Mingzhao Hu, bWh1QHBzdGF0LnVjc2IuZWR1
†These authors have contributed equally to this work