 Fengli Liu1
 Xiaocheng Zhou1,2*
 Jinyuan Dong1*
 Yucong Yan2
 Jiao Tian1Jingchao Li1Shupei Ouyang1Miao He1Kaiyi Liu3Bingyu Yao2Yuwen Wang1
 Zhaojun Zeng1
 Yongxian Zhang1
- 1CEA Key Laboratory of Earthquake Prediction, Institute of Earthquake Forecasting, China Earthquake Administration, Beijing, China
- 2School of Water Resources and Environment, China University of Geosciences (Beijing), Beijing, China
- 3University of Sydney Business School, Sydney, NSW, Australia
Introduction: Carbon dioxide emissions from non-volcanic areas are undervalued in the carbon cycle.
Methods: First estimates of diffuse CO2 flux from the Anninghe—Zemuhe fault (AZF), Southeastern Tibetan Plateau, China, which suggests this could equal 15% emissions from all volcanoes in China. Following the accumulation chamber method, CO2 flux was investigated at 1,483 points, and along 67 profiles crossing the AZF.
Results and discussion: Total CO2 emissions from the AZF were estimated 1.2 Mt yr-1. The relationship between soil gas CO2 fluxes, earthquakes, and fault activity was discussed. The intense fault activity in the southern part of the Zemuhe fault (ZMHF) and the northern part of the Anninghe fault (ANH) was inferred, which could have enhanced the porosity of the soil, and accelerated the water-rock interactions and soil gas emission within the fault zone. The chemical and isotopic data indicated that biogenic CO2 was the primary source of CO2 from the AZF. Produced by interactions between groundwaters and carbonates, soil gas CO2 could migrate to the near surface through cracks. Spatial variations of CO2 flux in soil gas indicate that seismic activity could be responsible for the jumpy variations of CO2 flux. The diffuse CO2 from deep faults may contribute considerably to the greenhouse gas cycles.
1 Introduction
Consistently, Global warming is a central focus of climate change and studies have suggested that the growing number of carbon emissions has been considered as an essential factor for global warming (Lee et al., 2016; Isson et al., 2020; Huo et al., 2022). Nowadays, studying the distribution and magnitude of global carbon sources and sinks is an international mainstream for a better understanding of rates and mechanism of carbon cycling in and out of earth (Kämpf et al., 2013; Kang et al., 2020; Hiett et al., 2022; Xu et al., 2022). In addition to human activities, natural factors (e.g., volcanic eruptions, biological respiration, seismic activity) will also contribute to the increase of greenhouse gas concentration in the atmosphere (Inguaggiato et al., 2012; Muirhead et al., 2020). Therefore, a great interest has been focused on studying of CO2 Earth degassing. There are many targets for such research, such as the relationships between the CO2 flux and the tectonic structures (Etiope et al., 1999; Jolie et al., 2015), the researches of volcanic degassing (Inguaggiato et al., 2012; Chen et al., 2019; Fischer and Aiuppa, 2020), and the quantification of deeply derived CO2 discharging into the atmosphere (Lee et al., 2016; Viveiros et al., 2017; Jacome-Paz et al., 2020; Bekaert et al., 2021; Rahilly and Fischer, 2021).
However, the contribution of CO2 released from non-volcanic areas, particularly deep and large faults, is also worthy of attention (Fischer et al., 2019; Rahilly and Fischer, 2021; Zhang et al., 2021). Based on a study of 3He and CO2 in springs and wells, Kennedy et al. (1997) estimated a mantle-derived CO2 flux of ∼0.02 gm-2 d−1 for the entire San Andreas Fault system. The relationship between active crustal stress and soil CO2 flux in southern Italy suggested that crustal stress associated with the seism genic process can effectively modulate the gas release in a seismically active area (Camarda et al., 2016). On the Chaozhou fault in China, significant anomalies in soil gas He and Rn were observed before the earthquake, which may reflect changes in the stress field before the earthquake (Fu et al., 2008); The sudden increase in CO2 and Rn before the earthquake was observed on a fault in the earthquake cluster area in northwestern Bohemia, Czech Republic, which may indicate an increase in porosity and the opening of transport channels due to stress redistribution (Weinlich et al., 2006). Weinlich and others concluded that underground gas components can objectively and sensitively reflect the stress and tectonic activity changes of the earth’s crust, and usually show various anomalies before or after the occurrence of earthquakes.
AZF is a seismic zone with vigorous seismic activity, which has high slip rates and developed fractures providing a channel for fluid migration deep and CO2 degassing. Therefore, the estimation of CO2 degassing from the AZF is of great significance to understand the impact of the Earth’s natural degassing on the environment. Yang et al. (2028) studied three characteristic points in AZF for soil gas CO2 concentration measurements. The results showed that the mean and maximum values of soil gas CO2 concentration in the northern section of the ZMHF were much higher than those in the southern section of the ANHF. The soil gas CO2 geochemistry produced different anomalous features, which, combined with the degree of occlusion in the AZF, reflect the gas-bearing characteristics of the AZF as well as the seismic hazard. However, there is no research on the characteristics of AZF soil gas CO2 flux and its causes.
Taken together, the relationship between soil gas CO2 fluxes and active fault tectonic features is considered a hot topic for discussion in the field of geochemistry. In this paper, measurements of flux of soil gas CO2 were performed at 1,483 sampling points along 67 profile lines oriented perpendicularly to the AZF. The geochemical characteristics of soil gas CO2 emissions in study areas and the association between the earthquakes and degassing process were investigated. This investigation aims to evaluate the total output of the CO2 from the AZF and elucidate the tectonic association between the flux of soil gas CO2 and the activity of earthquakes.
2 Geological setting
The AZF is the main active rift on the eastern boundary of the Sichuan-Yunnan block (Deng et al., 2003; Zhang et al., 2003). Under the combined effect of deep dynamic processes, large shear displacement and deformation zones are formed near the Xianshui fault, the ANHF and the Xiaojiang fault, which control the tectonic pattern of the Sichuan-Yunnan region (Figure 1).
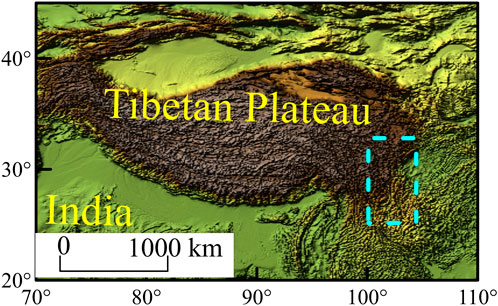
FIGURE 1. Study area location diagram the dotted line is the specific location of the study area on the Tibetan Plateau.
The ANHF starts from Shimian in the north, extending through Xichang to Huili (Figure 2), with an overall northsouth trend. The overall NS trend is dominated by left-slip motion, with a maximum left-slip. The maximum left-slip rate since the Cenozoic is about 6.2 years−1 (He and Oguchi, 2008), and the maximum extrusion rate is about 1.4 years−1 (Ran et al. 2008; Ren and Lin, 2010). The Shimian-Xichang area in the southern section of the ANHF was the main rupture site of the earthquake with MS 71/2 in 1,536, but no more significant earthquakes have occurred in the ANHF since an Ms 6 earthquake occurred south of Shimian in 1952 (Wen, 2000).
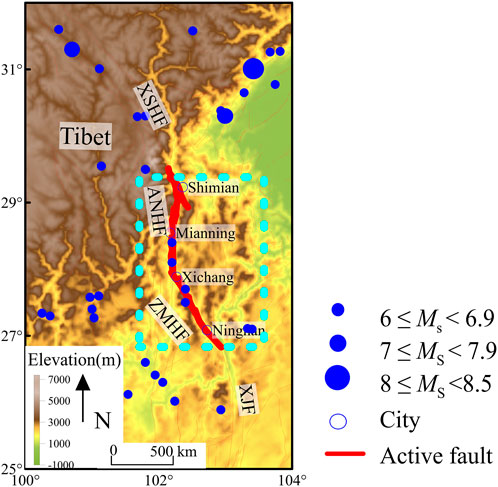
FIGURE 2. Schematic diagram of the Sichuan-Yunnan block structure the earthquakes are the events (MS ≥ 6.0) since 1618.
The Zemu River rift zone is connected with the ANHF in the north and the Xiaojiang fault in the south, extending from Xichang to Qiaojia (Figure 2), Yunnan via Puge and Ningnan, with a general strike of 330°. The Zemu River rift zone is dominated by left-slip motion, with a Holocene left-slip rate of about (6.4 ± 0.6) year−1 (Wen, 2000). Historically, there were earthquakes of an Ms 7 in Xichang in 1814 and Ms 7 in Dajiaoliangzi in 1850, and the most recent moderately strong earthquake was the Xichang Ms 5.1 earthquake on 31 October 2018.
3 Materials and methods
3.1 Site description
Soil gas flux CO2 surveys were performed at ANHF and ZMHF (26.8°N-29.2°N, 102°E – 103°E). During the layout of the CO2 flux measuring line, a large number of field investigations were carried out on the fault zone in the field. First, we found the location of the active fault fracture zone, and then the suitable measuring line was selected. A total of 67 measuring lines were arranged in ANHF and ZMHF, recording the longitude and latitude of the starting point and end point of the measuring line. Finally, the measuring lines designed for the investigation were drawn on the map indoors, according to the line density and feasibility and the final line scheme was obtained. Overall, sampling for soil gas CO2 flux was conducted at 1,483 sampling points along the 67 profiles that crossed the target faults (Figure 3). The measuring line is perpendicular to the fracture zone of the active fault zone and each line is generally more than 20 measuring points according to the landform. The spacing of measuring points near the active fault fracture zone is generally 10 m. After leaving the fracture zone, the spacing of measuring points was expanded by tens of meters to hundreds of meters according to the terrain (Figure 4).
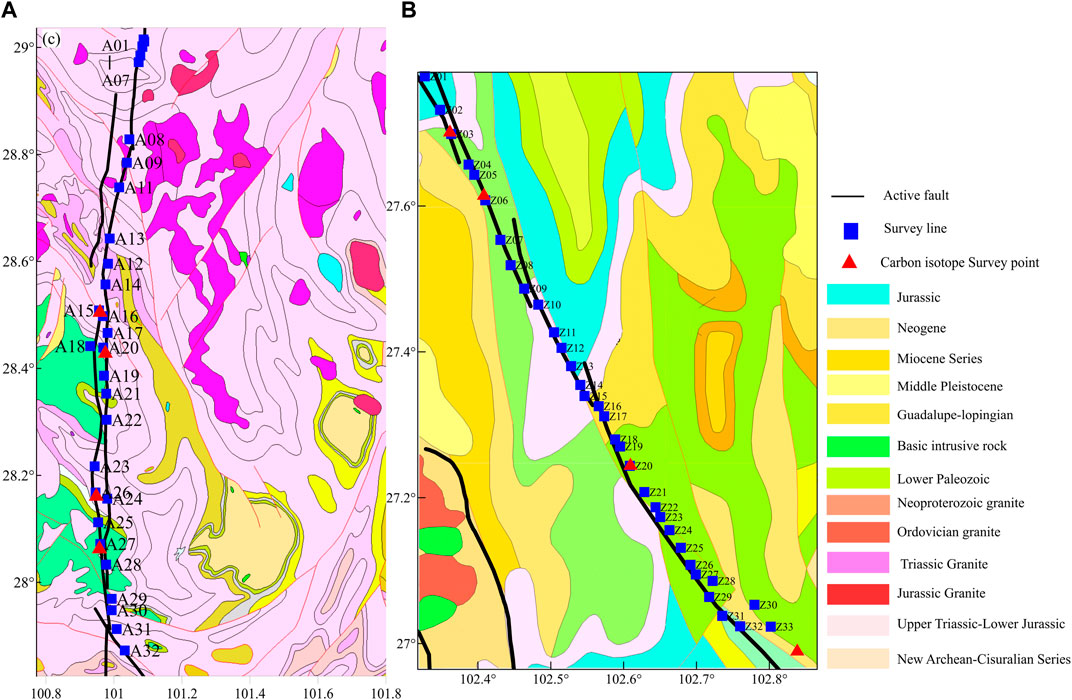
FIGURE 3. AZF measurement line distribution diagram Map showing the CO2 sampling points along the ANHF (A) and the ZMHF (B), together with the geology of the study area.
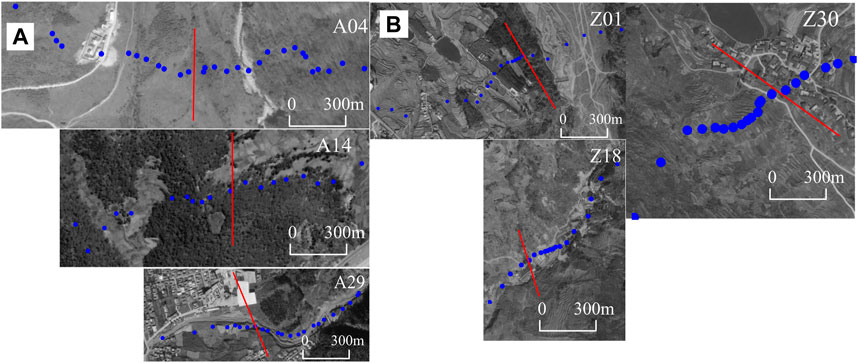
FIGURE 4. AZF sampling point diagram. The figure shows three profile lines for each of ANHF (A) and ZMHF (B), the blue points are sampling points and the red is the fault location.
3.2 Measurement methods of soil CO2 flux
The details and principles of the closed-chamber method were described by Zhou et al. (2016). Analytical error associated with a single measurement was about ±5% and the reproducibility was about ±10% for the range of 100–10,000 gm−2 d−1.
Soil temperature at a depth of 10 cm was taken at every site, using a pocket digital thermometer (Henxin AZ8821), which has an accuracy of ±0.1°C. To minimize the inherent variability of gas flux due to soil water and humidity, sampling was performed during dry stable weather. Ambient air temperature and barometric pressure were recorded every 25 samples. Each survey was executed over three consecutive days, and under rain-free conditions, to avoid environmental effects. Both soil temperature and atmospheric pressure, recorded at every measurement, were used for calibrating soil flux values. At each observation site, the wind speed and barometric pressure was measured.
3.3 Measurement methods of carbon isotope
Four samples of CO2 in soil gas from ANHF and four samples from ZMHF were collected for measurement of values of δ13CCO2(V-PDB). Glass bottles (500 mL) were used to collect soil gas in order to improve the accuracy of carbon isotopes. The gas samples were collected as follows: first, the glass bottle was filled with saturated brine and then inverted into a bucket filled with saturated brine and kept the glass bottle from tipping over. Soil gas is pumped into the glass bottle through a rubber hose. Until the filled saturated brine was replaced by gas in one-half of the bottle, the glass bottles were sealed in water with rubber blocks to avoid air contamination. All gas samples were analyzed at the Key Laboratory of Petroleum Resources Research, Institute of Geology and Geophysics, Chinese Academy of Sciences. Carbon isotope analysis was performed using a Delta Plus XL mass spectrometer. It is manufactured by ThermoFinnigan Inc., consisting of the HP6890 gas chromatograph, combustion/conversion oven, interface and DeltaPlusXP mass spectrometer (Li et al., 2017). The stable carbon isotope composition is generally expressed as δ13C and has a precision of ±0.2‰.
4 Results
Overall, 734 points along 32 profiles across the ANHF and 728 points along 35 profiles across the ZMHF were sampled for the CO2 flux analysis (Figure 5). There are two main patterns in the distribution of soil gas CO2 fluxes on the AZF, one with anomalously high values near the fractures, which are mainly because the fault fractures are well developed at this location, creating many gas escape routes. The other is where the anomaly occurs on both sides of the fault, because the fault is mature and its fractured core is well developed, while the surrounding fragmentation is so high that a peak occurs above the lateral fault. This bimodal distribution is also observed in the San Andreas Fault profile (Kang et al., 2020).
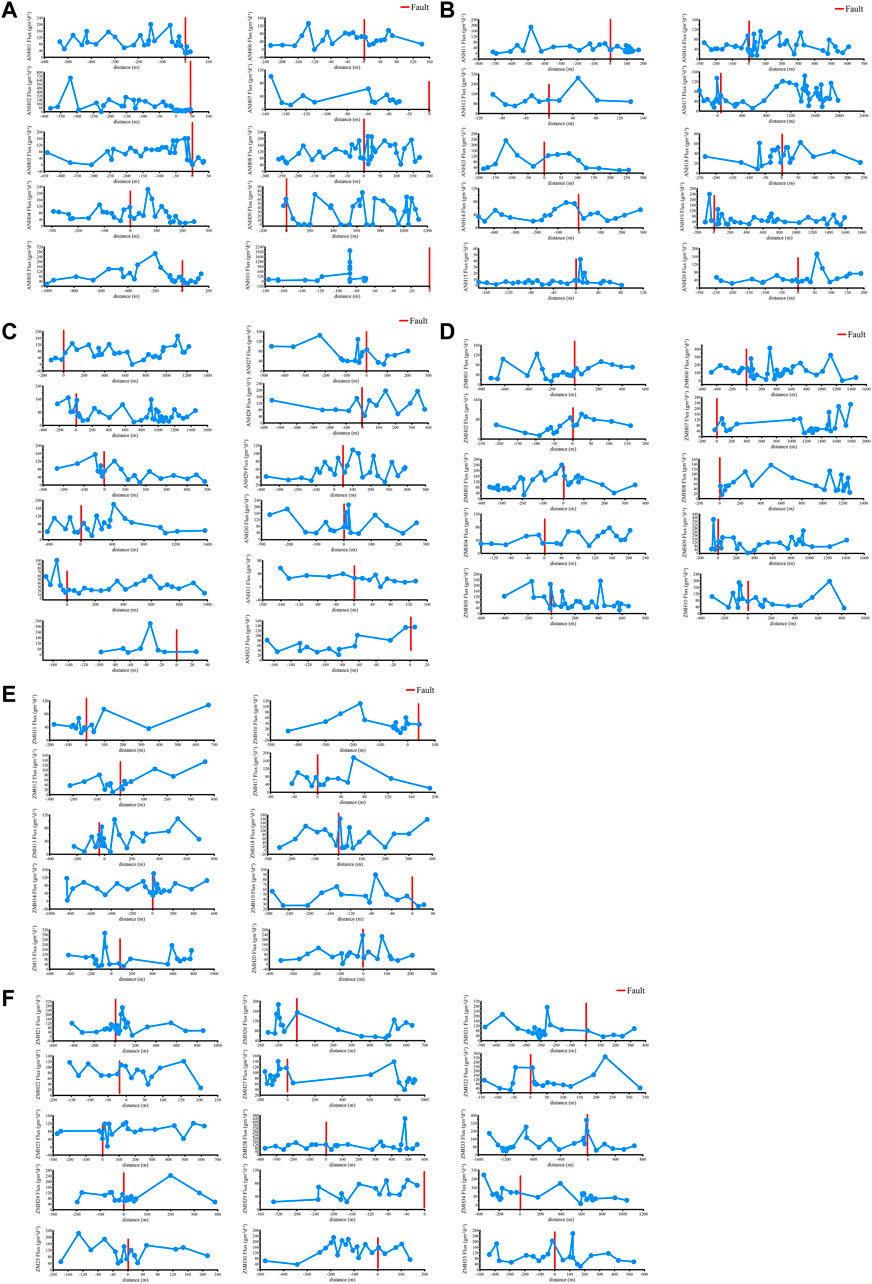
FIGURE 5. Soil gas flux profile. The short red line represents the location of the fault, positive value is the east side of the fault, negative value is the west side of the fault. The order is: (A) ANHF 1–10; (B) ANHF 11–20; (C) ANHF 21–32; (D) ZMHF 01–10; (E) ZMHF 11–20; (F) ZMHF 21–35.
In ANHF, the CO2 flux in soil gas varied in the range of 0–1996.2 g m2d−1, and the arithmetic mean values were 73.7 g ±2.36 m2d−1 (Figure 6); In ZMHF, the CO2 flux in soil gas varied in the range of 0–442.3 gm2d−1, and the arithmetic mean values were 87.5 g ±4.21 m2d−1. The δ13CCO2(V-PDB) were in the range of −25.0‰ ∼ −19.7‰ (Table 1). The statistics data on the fluxes of CO2 in soil gas from the AZF are listed in Table 2. The mean fluxes of CO2 in each soil gas survey line were in the range of 7.23–272.22 gm−2 d−1 (Figure 7).
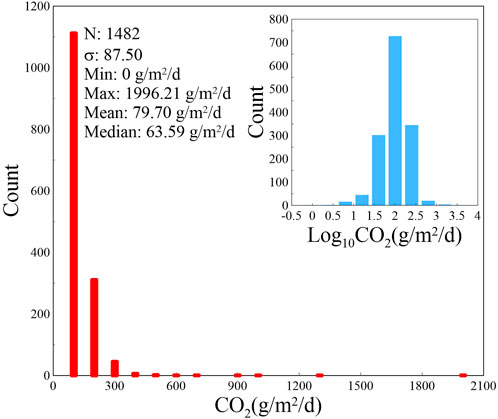
FIGURE 6. Soil gas flux statistics. Statistical histogram of all CO2 fluxes, showing a normal distribution.
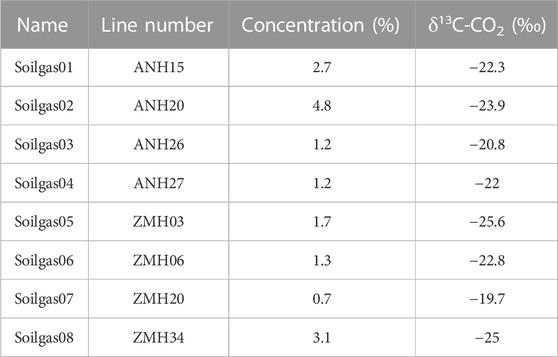
TABLE 1. Values of Soil gas CO2 carbon isotope.
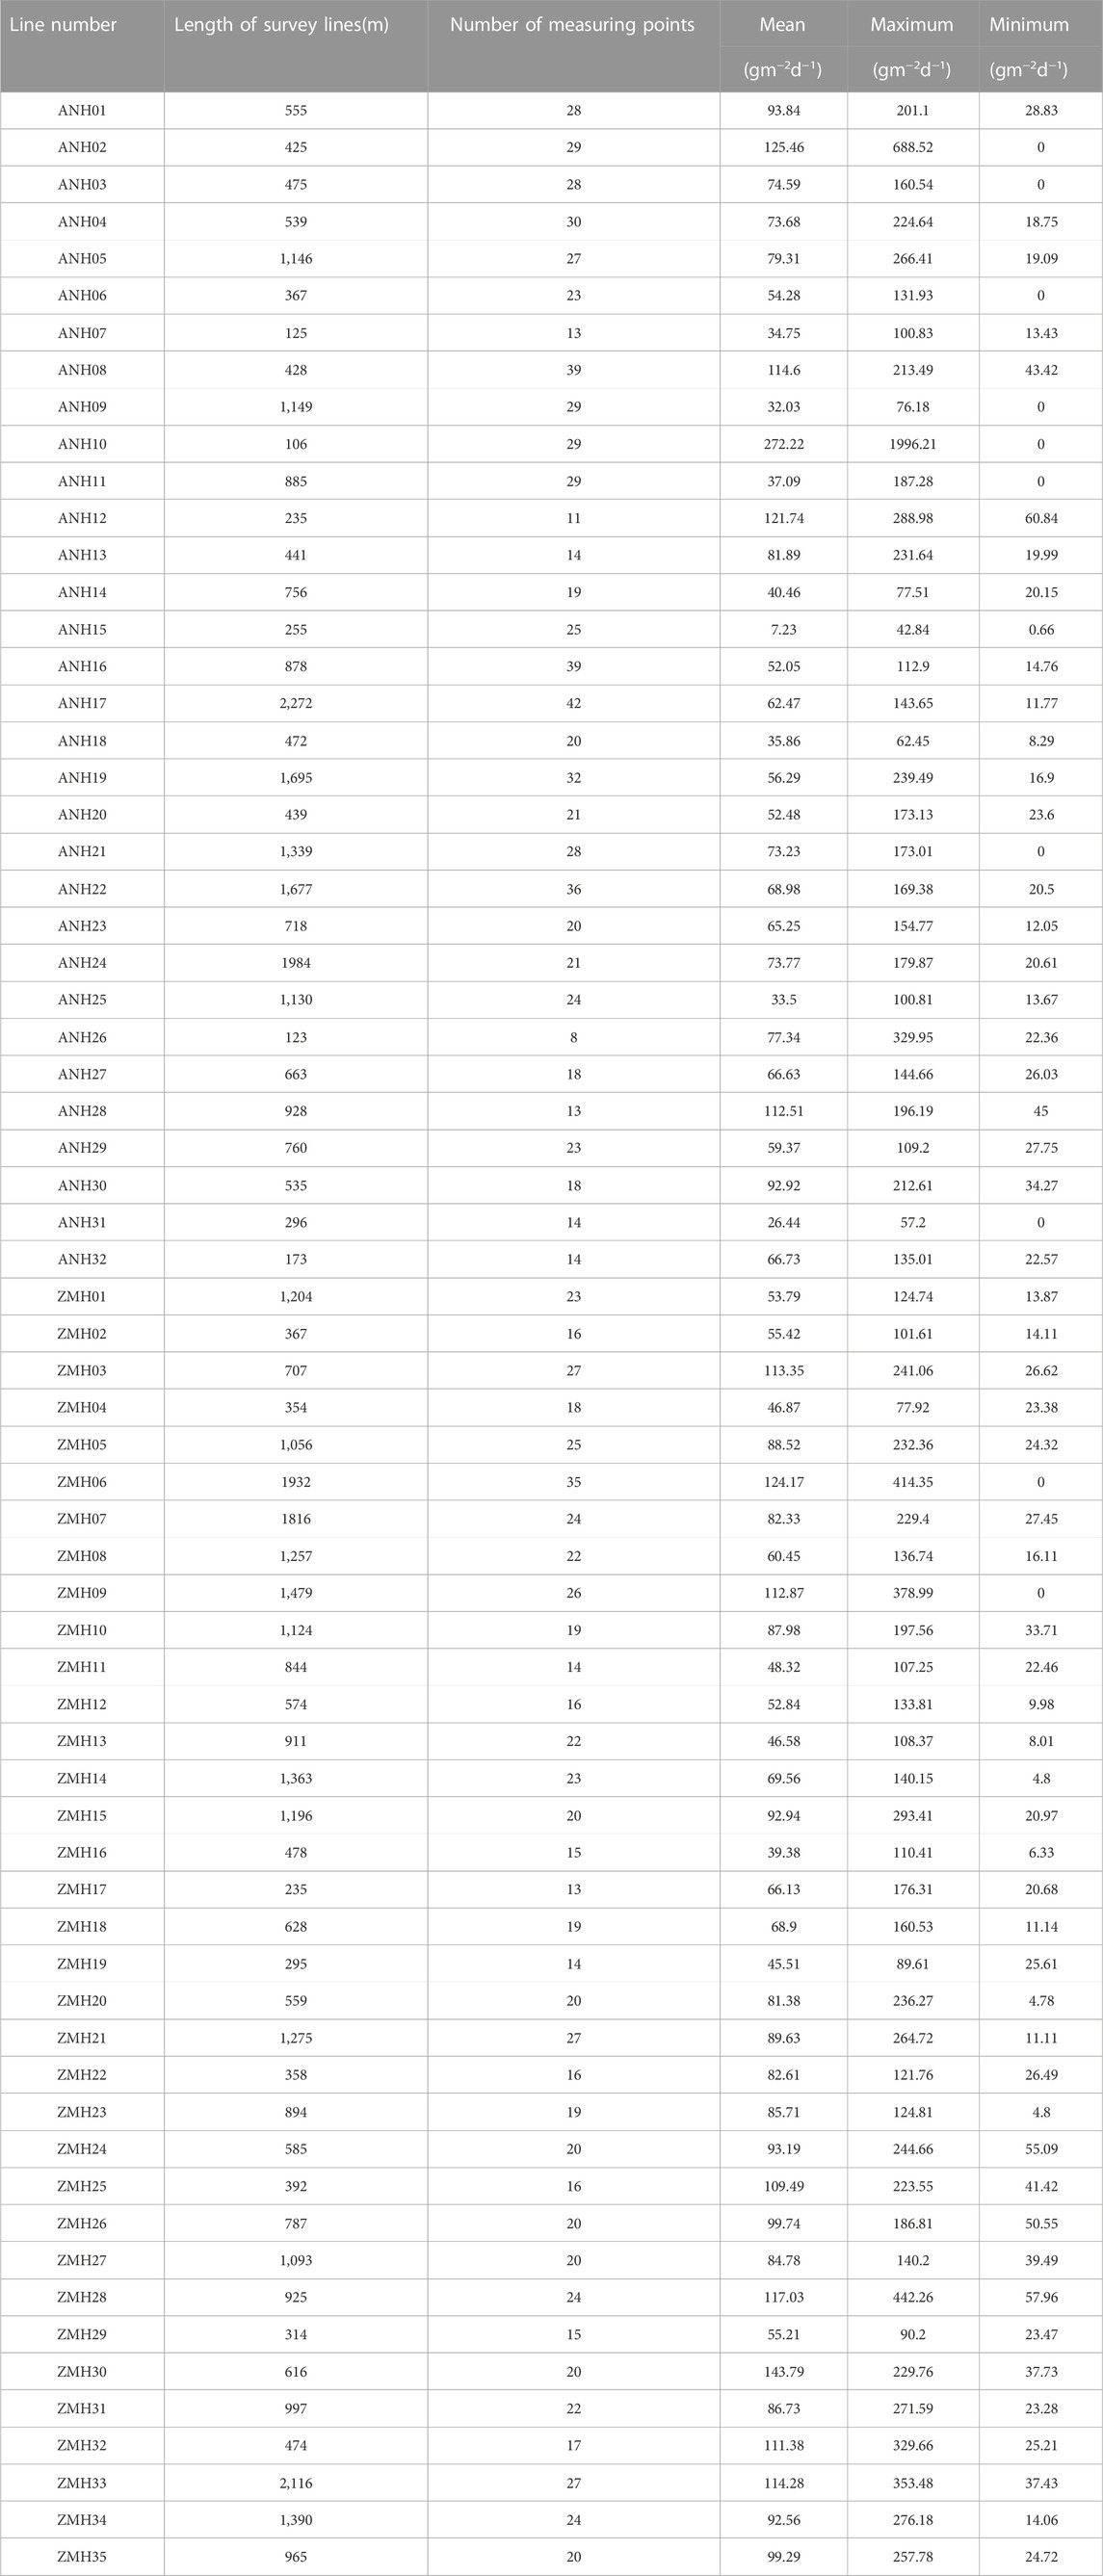
TABLE 2. The value of each measurement line on AZF.
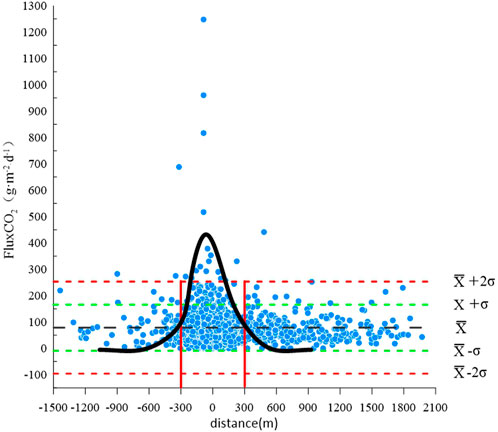
FIGURE 7. CO2 flux scatter distribution map.
5 Discussion
5.1 Sources of CO2 degassing
The CO2 in subsurface fluids can be classified into two categories based on the type of parent material formed, organic and inorganic. The organic mainly formed by organic matter decomposition and bacterial activity, and the inorganic mainly from mantle/magmatic activity, thermal decomposition of carbonate rocks and dissolution of carbonate rocks (Wycherley et al., 1999). Different types of CO2 exhibit different carbon isotopic signatures. δ13CCO2 (V-PDB) vs. 1/CO2 is regarded to be an indicator for gas sources region (Sano and Marty, 1995; Yuce et al., 2017; Chen et al., 2020). The values of end members for δ13CCO2 of mantle and crust are −6.5‰ and 0‰, respectively, while for atmospheric and biogenic end members are −7‰ and −26‰, respectively (Dai, 1995; Sano and Marty, 1995; Dogan et al., 2009).
From Figure 8, it can be seen that the values of δ13CCO2 values of the hot spring gas and soil gas samples are located in the composition mixing range between the mixed end of the crustal mantle and the biological end. The δ13CCO2 values of the soil gas samples are located between the hot spring gas and the end of biological, which indicates that the CO2 in the surface AZF mainly originates from the biological and the mixed end of the crustal mantle. Compared to the shallow depth of soil air circulation, the circulation of hot spring gas can reach depths of tens of kilometers. The CO2 in soil gas is closer to the end of biological, which indicates that the oxidation of organic matter during aerobic microbial respiration plays the most important role in the production of CO2 in soil gas.
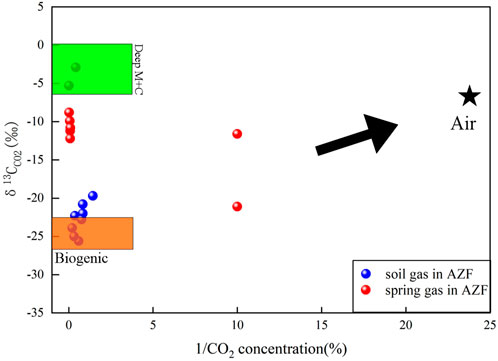
FIGURE 8. Plot showing δ13CCO2 vs.1/CO2 values for gas samples from the soil gas and springs (spring gas data from Tian et al., 2021). Deep (M +C): end-member of mantle and crust sources, biogenic: end-member of biogenic source, Air: end-member of the atmospheric source.
Based on the above results, an attempt is made to explain the conceptual model of CO2 sources and transport in the active fault zone of AZF. Fluids from the crust and mantle that accumulate in the lower crust and upper mantle rise through deep faults with a small amount of crust- and mantle-derived gas diffusing into near-surface soil gas. Although biogenic CO2 is the primary source of soil gas, crust-derived and mantle-derived CO2 may be a secondary source. In addition, air can intrude into faulted soil gas due to fluctuations in air pressure (Tamir et al., 2012; Chen et al., 2020).
5.2 Contribution to the atmosphere from CO2 degassing in the AZHF
Global warming, which has received widespread social attention, is thought to be closely related to the rapid increase in atmospheric CO2 concentrations over the past 100 years (Joos et al., 1999; solomon et al.,2009; Italiano et al., 2010). However, many scientists currently question the warming caused by increasing atmospheric CO2 concentrations, and the main debate focuses on what are the main drivers of warming; how accurate predictions of future climate trends based on existing climate models; and what is the magnitude of the impact of climate change (Italiano et al., 2009; Iqbal et al.,2009), all of which are subject to considerable uncertainty. There is a great deal of uncertainty in these issues. Therefore, it is necessary not only to reduce greenhouse gas emissions caused by human activities, but also to study the contribution of natural factors to atmospheric greenhouse gases, so as to distinguish between natural and anthropogenic factors leading to changes in atmospheric greenhouse gas concentrations, and to correctly understand the impact of Earth degassing on the increase of atmospheric greenhouse gas concentrations. In addition, the degassing areas of seismically active fracture zones are also “natural analogue” sites for studying the leakage of CO2 geological storage, especially the risk of sudden leakage of stored gases to the biosphere (Jing et al., 2019).
The annual contribution of CO2 degassing from the fault zone to the atmosphere is equal to the amount of the annual average released flux each section of the fault zone multiplied by the area of each section of the fault zone. Based on the AZF and degassing characteristics, the AZF was divided into 5 segments, and the average value of the length and degassing flux of each segment was calculated based on the measurements (Table 3). The width of the fracture zone of the fault is generally tens of meters to hundreds of meters, and the surface avoidance zone of the active fault is more than 50 m (Xu et al., 2002). After the Wenchuan Ms8.0 earthquake, the width of the surface fracture zone of Longmenshan fault is about 200 m (Zhou et al., 2017), Several earthquakes of magnitude 6 or greater have occurred in the history of AZF, with the strongest one occurring north of Xichang with a magnitude of 7.5. The flux data from all sampling points on the AZF were superimposed on a single graph, which could be seen that the outliers with more than double the variance are concentrated within 200 m (Figure 8). High values of soil gas are usually exhibited near the fracture zone (Yuce et al., 2017; Jacome-paz et al., 2020), So the width of AZF was supposed as 200 m in this study.
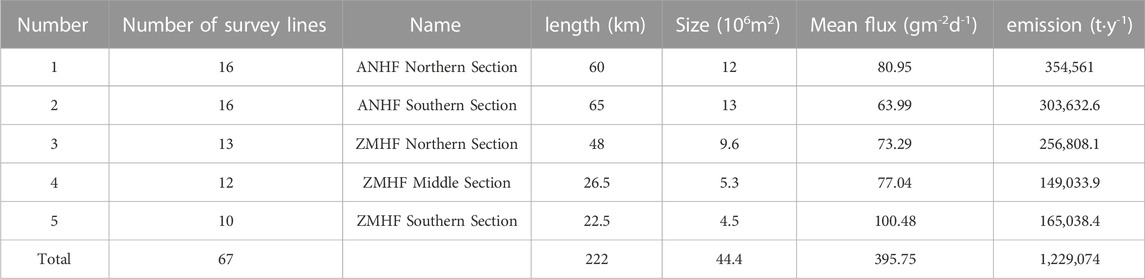
TABLE 3. CO2 emissions by segment.
By calculating the average flux of each survey line of ANHF and ZMHF, the annual contribution of ANHF and ZMHF zone to the atmosphere is 1.2 ±0.4 Mt (Table 3). The total flux of greenhouse gases from typical Cenozoic volcanic areas in Chinese Mainland to the atmosphere is about 8.13 Mt · a−1 equivalent to about 6% of the total greenhouse gas emissions caused by global (102 ∼ 103 Mt·y−1) volcanic activities (Guo et al., 2014). The annual emission of AZF is relatively small compared with that of typical volcanoes in China. However, there are only 8 active volcanoes in China (Liu., 1999), while there are more than 200 active fault zones in the intraplate area of Chinese Mainland (Deng et al., 2003), among which the Tanlu fault zone, Altun fault zone, Haiyuan fault zone and Xianshuihe fault zone are more than 1000 km long. The total emission of CO2 from all active fault zones would be huge, which may be higher than that from active volcanoes in China. Only a few of researches were aimed to calculate carbon emissions from faults in the world (Table 4), but it is far from enough. From a public health risk assessment perspective, detailed CO2 degassing maps should also be performed to evaluate the potential for CO2 release from fault.
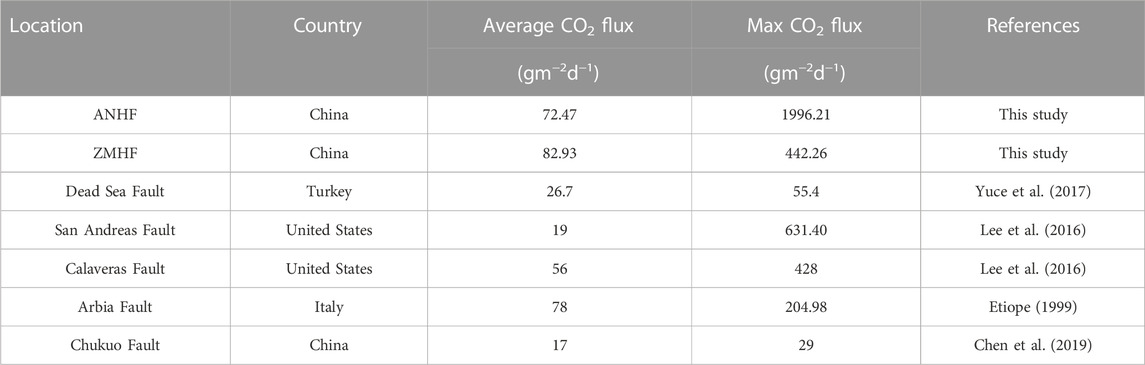
TABLE 4. Study on soil gas CO2 fluxes in fracture zones in the world.
5.3 Diffuse degassing in the ANHF and ZMHF
It is well known that understanding of crustal dynamics and degassing processes can be improved by studying soil gas in fracture zones (Ciotoli et al., 2016). Soil gas CO2 flux is an important indicator of crustal stress accumulation and fault activity (Irwin and Barnes, 1980; Zhou et al., 2010; Yuce et al., 2017). Changes in tectonic stress leads to expansion or contraction of bedrock, altering the degree of water-rock response and thus affecting CO2 degassing. The strength of degassing along active faults is related to seismic activity, which can reflect the state of stress accumulation to some extent (Rovira and Vallejo, 2008; Manaker et al.,2008). Hence, there could be some degree of correlation between CO2 emissions and historical earthquakes and nowadays earthquakes.
According to the location and magnitude of historical strong earthquakes on the fault zone, the seismic gap on the fault zone, and the spatial distribution of current seismic activity, the soil gas flux on the AZF has obvious segmented features (Yu et al., 2014; Yu et al., 2018; Wen, 2000; Zhou et al., 2017; Chen et al., 2019; Walia et al., 2010).
In this paper, our results show that high soil gas CO2 fluxes are found in the northern section of ANHF, southern section of AMHF and the central section of AZF (Figure 9), which well correlates with the sites that have high seismic activities. Notably, the higher soil gas concentration values in the northern section of the ANHF relative to the southern section of the ANHF, combined with the high flux values at point A (Figure 9), may indicate that the higher degree of fracture fragmentation in the area leads to elevated bedrock permeability, which promotes CO2 migration from deeper to the surface. B point (Figure 9) is located at the intersection of ANHF and ZMHF. On the one hand, the area has a high stress background value under the interaction of multiple sets of ruptures (Wen, 2000); on the other hand, the study shows that the area is highly occluded and belongs to the seismic gap area for both historical and present-day earthquakes (Deng et al., 2003). Therefore, the fault fragmentation in this area is low, the fracture is not fully developed, and the overall soil gas CO2 flux values are in the middle. C point (Figure 9) is characterized by the same high seismic activity, but the soil gas CO2 flux is weaker than point A. This may be due to the “Y” shaped intersection of the ZMHF, Daliangshan fault, and Xiaojiang fault in the southern section, which may not have the tectonic conditions for high stress concentration. Although the frequency of seismic activity is high and the magnitude is large, the stress drop value of the earthquake source is generally in the middle. Therefore, the degree of fault fragmentation in this area is weak, resulting in relatively low bedrock permeability and fewer soil gas CO2 migration channels.
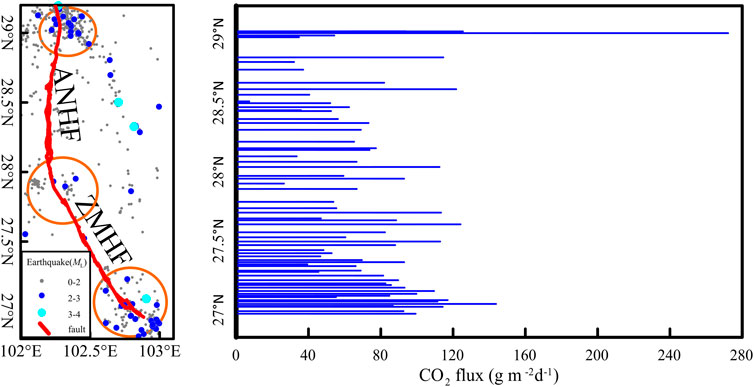
FIGURE 9. Spatial distribution of soil gas CO2 fluxes and seismicity in AZF.
The higher degree of active fault fragmentation and the increased permeability of bedrock and soil, provide an upward channel for gas transport (Ciotoli et al., 2016). However, under the action of tectonic stress, the degree of water-rock response varies at different stages of deformation evolution, and the permeability within the fault changes temporally and spatially (Dai et al., 1996; King, 1986; Pei et al., 1998; Neri et al., 2006; Annunziatellis et al., 2008). It is well known that faults can be both an upward pathway for transporting gases and can also block deep gas leaks (Caine et al., 1996; Dai et al., 1996; Sizova et al., 2019). Moreover, fault permeability is subject to self-sealing processes that might limit or inhibit fluid gas motion (Pei et al., 1998). The pore pressure of faulted soils usually depends on the crustal stresses associated with tectonic activity, which promotes the development of fractures and the formation of microfractures, resulting in the migration and redistribution of gases within the pore space (Holub and Brady, 1981; Zhang et al., 2003). CO2 transport to the surface along well-developed fractures driven by pressure, which explains the higher soil gas CO2 fluxes are often found near faults.
6 Conceptual model of soil gas in the AZF
The cross-cutting and interaction of fracture zones of different scales on the AZF, with some strongly extruded passages forming blockages, leads to stress concentration, earthquake nucleation and breeding (Shen et al., 2005). The geometric structure and activity habits of different sections of the fault zone is also controlled by the general dynamical background of the east boundary of the Sichuan-Yunnan active block (Chiodini et al., 1998; Toda et al., 2008). This is reflected in the uncoordinated deformation movement of the tectonic units. This incoordination is probably the main reason for the type and size of earthquakes and the local stress distribution pattern. In discussing the seismic activity and stress distribution in this multi-crossing fault zone, it is necessary to consider the characteristics of the cross-faults (Brune et al., 1970; Jiang et al., 2015). The interaction of cross-faults on the local stress field and seismic hazard needs to be considered when discussing the seismic activity and stress distribution characteristics in this multi-cross-fault region.
The northern section of the ANHF meets the Xianshuihe fault and the Daliangshan fault at an acute angle, which has local conditions of high stress concentration, high seismic activity, large magnitude, and high source stress, so the soil gas CO2 flux is the highest (Figure 10) (Wang et al., 1998; Toda et al., 2008); the ANHF and ZMHF meet at an obtuse angle, which has weak seismic activity and low source stress in general, so the soil gas CO2 flux is the lowest; the southern section of the AZF, ZMHF meets the Xiaojiang fault and the Daliangshan fault at an obtuse angle, which may not have high source stress (Xu et al., 2022) (Figure 10). The southern section of AZF, ZMHF and Xiaojiang fault and Daliangshan fault meet at an obtuse angle, so they may not have the tectonic condition of high stress concentration, and although the seismic activity is frequent, the source stress is relatively not high (Wu, 2020). Therefore, the overall performance of soil gas CO2 flux is at medium level.
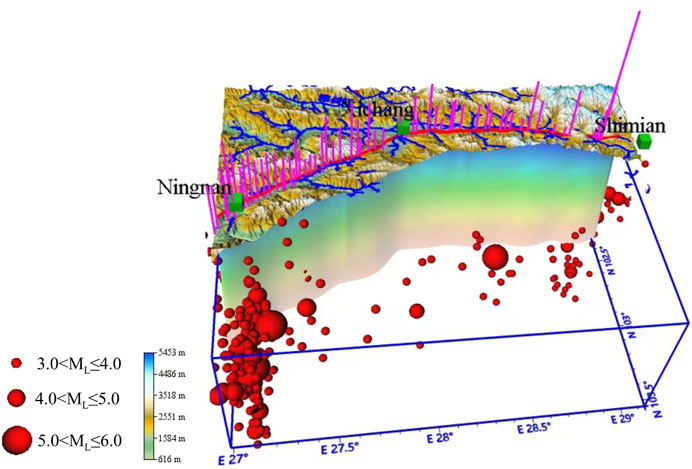
FIGURE 10. Coupling model of soil gas CO2 flux and seismic activity in AZF.
It has been suggested that degassing features similar to the AZF can be found in worldwide geologic extensional contexts (Apollaro et al., 2012), and spatial variations in CO2 emissions from deep sources may be attributed to tectonic activity (Irwin and Barnes, 1980). In addition, it has also been demonstrated that areas with enhanced crustal permeability may show precursors of CO2 degassing activity. Therefore, the geochemical exploration method proposed in this paper for AZF would be applied to other CO2 degassing areas on Earth (Martinelli and Dadomo, 2017). Meanwhile, tectonic activity in possible future earthquakes can be monitored by implementing soil gas CO2 flux and concentration measurements on active faults.
7 Conclusion
In this study, geochemical characteristics and causes of the fluids released from the AZF were systematically analyzed, and the seismic activity of various segments of the AZF was discussed. The main conclusions are as follows:
(1) The investigation of carbon isotopic of underground fluid in AZF highlighted that: there are multiple sources of underground fluids in AZF; Soil gas CO2 was demonstrated to be mainly biogenesis in AZF, while the spring gas is mainly of crustal and mantle origin.
(2) Soil gas CO2 emissions surveys in this study and previous studies reveal a substantial range of average soil CO2 fluxes (1996.2 gm−2 d−1) for the AZF, which may have close affnities with the influence of regional fault systems and the seismic activity. Total soil CO2 output of the AZF is about 1.2 Mt a−1, suggesting high CO2 outgassing flux of the eastern boundary of the Chuan–Dian rhombic block. There are many longer fracture zones than AZF in the worldwide, so more attention should be given to CO2 emissions from faults.
(3) The variation of CO2 emissions in the study area is consistent with the strength of regional seismicity, and CO2 fluxes are also relatively low in areas with weaker tectonic stresses. These results indicate that seismicity and regional stress are the major triggering mechanism for CO2 emissions from the AZF.
Data availability statement
The original contributions presented in the study are included in the article/Supplementary Material, further inquiries can be directed to the corresponding authors.
Author contributions
XZ, YL, and JD conceived the study. FL performed the literature review with support from YY, JT, JL, MH, OY, and SZ. KL, BY, ZZ, and YW participated in data processing. All authors contributed to interpretation and writing of the manuscript.
Funding
The work was funded by the National Key Research and Development Project (2018YFE0109700 and 2019YFC1509203), Central Public-interest Scientific Institution Basal Research Fund (CEAIEF2022030205, CEAIEF20220213, CEAIEF2022030200, and CEAIEF20220507), and the National Natural Science Foundation of China (41673106, 42073063, 4193000170, and U2039207), IGCP Project 724.
Acknowledgments
Special thanks are addressed to Chang Lu and Zhaofei Liu for the support during the fieldwork.
Conflict of interest
The authors declare that the research was conducted in the absence of any commercial or financial relationships that could be construed as a potential conflict of interest.
Publisher’s note
All claims expressed in this article are solely those of the authors and do not necessarily represent those of their affiliated organizations, or those of the publisher, the editors and the reviewers. Any product that may be evaluated in this article, or claim that may be made by its manufacturer, is not guaranteed or endorsed by the publisher.
Supplementary material
The Supplementary Material for this article can be found online at: https://www.frontiersin.org/articles/10.3389/feart.2023.1117862/full#supplementary-material
References
Annunziatellis, A., Beaubien, S. E., Bigi, S., Ciotoli, G., Coltella, M., and Lombardi, S. (2008). Gas migration along fault systems and through the vadose zone in the Latera caldera (central Italy): Implications for CO2 geological storage[J]. Inter. J. Greenhouse Gas Cont. 2 (3), 353–372.
Apollaro, C., Dotsika, E., Marini, L., Barca, D., Bloise, A., De Rosa, R., et al. (2012). Chemical and isotopic characterization of the thermo mineral water of Terme Sibarite springs (Northern Calabria, Italy). Geochem. J. 46, 117–129. doi:10.2343/geochemj.1.0166
Bekaert, D. V., Turner, S. J., Broadley, M. W., Barnes, J., Halldórsson, S., Labidi, J., et al. (2021). Subduction-driven volatile recycling: A global mass balance. Annu. Rev. Earth Planet. Sci. 49, 37–70. doi:10.1146/annurev-earth-071620-055024
Brune, J. N. (1970). Tectonic stress and the spectra of seismic shear waves from earthquakes[J]. J. Geophys. Res. 75 (6), 4997–5009.
Camarda, M., De Gregorio, S., Di Martino, R. M. R., and Favara, R. (2016). Temporal and spatial correlations between soil CO2 flux and crustal stress[J]. J. Geophys. Res. Solid Earth 121 (10), 7071–7085. doi:10.1002/2016jb013297
Caine, J. S, Evans, J. P., and Forster, C. B. (1996). Fault zone architecture and permeability structure[J]. Geology 24(11), 1025–1028.
Chen, Z., Li, Y., Liu, Z., Zheng, G., Xu, W., Yan, W., et al. (2019). CH4 and CO2 emissions from mud volcanoes on the southern margin of the Junggar basin, NW China: Origin, output, and relation to regional tectonics[J]. J. Geophys. Res. Solid Earth 124 (5), 5030–5044. doi:10.1029/2018jb016822
Chen, Z., Li, Y., Martinelli, G., Liu, Z., Lu, C., and Zhao, Y. (2020). Spatial and temporal variations of CO2 emissions from the active fault zones in the capital area of China[J]. Appl. Geochem. 112, 104489. doi:10.1016/j.apgeochem.2019.104489
Chiodini, G., Cioni, R., Guidi, M., Raco, B., and Marini, L. (1998). Soil CO2 flux measurements in volcanic and geothermal areas[J]. Appl. Geochem. 13 (5), 543–552. doi:10.1016/s0883-2927(97)00076-0
Ciotoli, G., Sciarra, A., Ruggiero, L., Annunziatellis, A., and Bigi, S. (2016). Soil gas geochemical behaviour across buried and exposed faults during the 24 August 2016 central Italy earthquake. Ann. Geophys. 59 (5), 1. doi:10.4401/ag-7242
Dai, J., Song, Y., Dai, C., Yan, S., Chun-sen, D., Da-rui, W., et al. (1996). Geochemistry and accumulation of carbon dioxide gases in China[J]. AAPG Bull. 80 (10), 1615–1625. doi:10.1306/64EDA0D2-1724-11D7-8645000102C1865D
Dai, J. X. (1995). Abiogenic gas in oil-gas bearing basins in China and its reservoirs. Nat. Gas. Ind. 15 (3), 22–27.
Deng, Q., Zhang, P., Ran, Y., Xiaoping, Y., Weie, M., Quanzhi, C., et al. (2003). Basic characteristics of active tectonics of China[J]. Sci. China Ser. D Earth Sci. 46 (4), 356–372. doi:10.1360/03yd9032
Doğan, T., Sumino, H., Nagao, K., Notsu, K., Tuncer, M. K., and Çelik, C. (2009). Adjacent releases of mantle helium and soil CO2 from active faults: Observations from the Marmara region of the North Anatolian Fault zone, Turkey[J]. Geochem. Geophys. Geosystems 10 (11). doi:10.1029/2009gc002745
Etiope, G., Beneduce, P., Calcara, M., Favali, P., Frugoni, F., Schiattarella, M., et al. (1999). Structural pattern and CO2–CH4 degassing of Ustica Island, Southern Tyrrhenian basin[J]. J. Volcanol. Geotherm. Res. 88 (4), 291–304. doi:10.1016/s0377-0273(99)00010-4
Fischer, T. P., and Aiuppa, A. (2020). AGU centennial grand challenge: volcanoes and deep carbon global CO2 emissions from subaerial volcanism—recent progress and future challenges[J]. Geochem. Geophys. Geosystems 21 (3), e2019GC008690. doi:10.1029/2019GC008690
Fischer, T. P., Arellano, S., and Carn, S. (2019). The emissions of CO2 and other volatiles from the world’s subaerial volcanoes[J]. Sci. Rep. 9 (1), 1–11.
Fu, C. C., Yang, T. F., Du, J., Walia, V., Chen, Y. G., Liu, T. K., et al. (2008). Variations of helium and radon concentrations in soil gases from an active fault zone in southern Taiwan. Radiat. Meas. 43, S348–S352. doi:10.1016/j.radmeas.2008.03.035
Guo, Z., Zhang, M., Cheng, Z., Zhang, L., and Liu, J. (2014). Fluxes and Genesis of greenhouse gases emissions from typical volcanic fields in China. Acta Petrol. Sin. 30 (11), 346–3480. ( in Chinese).
He, H., and Oguchi, T. (2008). Late Quaternary activity of the Zemuhe and Xiaojiang faults in southwest China from geomorphological mapping. Geomorphology 96 (1-2), 62–85. doi:10.1016/j.geomorph.2007.07.009
Hiett, C. D., Newell, D. L., Jessup, M. J., Grambling, T. A., Scott, B. E., and Upin, H. E. (2022). Deep CO2 and N2 emissions from Peruvian hot springs: Stable isotopic constraints on volatile cycling in a flat-slab subduction zone[J]. Chem. Geol. 595, 120787. doi:10.1016/j.chemgeo.2022.120787
Holub, R. F., and Brady, B. T. (1981). The effect of stress on radon emanation from rock. J. Geophys. Res. 86, 1776–1784. doi:10.1029/jb086ib03p01776
Huo, C., Hameed, J., Sharif, A., Ohoud, A., Nouf, A., Noor ul-ain, B., et al. (2022). Recent scenario and nexus of globalization to CO2 emissions: Evidence from wavelet and Quantile on Quantile Regression approach. Environ. Res., 113067. doi:10.1016/j.envres.2022.113067
Inguaggiato, S., Mazot, A., Diliberto, I. S., Inguaggiato, C., Madonia, P., Rouwet, D., et al. (2012). Total CO2 output from Vulcano island (Aeolian Islands, Italy)[J]. Geochem. Geophys. Geosystems 13 (2). doi:10.1029/2011gc003920
Iqbal, J., Lin, S., Hu, R., and Feng, M. (2009). Temporal variability of soil-atmospheric CO2 and CH4 fluxes from different land uses in mid-subtropical China[J]. Atmosph. Environ. 43(37), 5865–5875.
Irwin, W. P., and Barnes, I. (1980). Tectonic relations of carbon dioxide discharges and earthquakes. J. Geophys. Res. 85, 3115–3121. doi:10.1029/JB085iB06p03115
Isson, T. T., Planavsky, N. J., Coogan, L. A., et al. (2020). Evolution of the global carbon cycle and climate regulation on Earth[J]. Glob. Biogeochem. Cycles 34 (2), 1–28. doi:10.1029/2018GB006061
Italiano, F., Bonfanti, P., Ditta, M., Petrini, R., and Slejko, F., Helium and carbon isotopes in the dissolved gases of Friuli Region (NE Italy): Geochemical evidence of CO2 production and degassing over a seismically active area, Chem. Geol.,266,Issues 76–85, 2009, Pages 76–85. ISSN 0009-2541, doi:10.1016/j.chemgeo.2009.05.022
Italiano, F., Bonfanti, P., Pizzino, L., and Quattrocchi, F. (2010). Geochemistry of fluids discharged over the seismic area of the Southern Apennines (Calabria region, Southern Italy): Implications for Fluid-Fault relationshipsfluids discharged over the seismic area of the southern apennines (Calabria region,southern Italy): Implications for fluid-fault relationships. Appl. Geochem. 25, 540–554. doi:10.1016/j.apgeochem.2010.01.011
Jacome-Paz, M. P., Gonzalez-Romo, I. A., Prol-Ledesma, R. M., Torres Vera, M., Pérez-Zárate, D., Rodríguez-Díaz, A., et al. (2020). Multivariate analysis of CO2, H2S and CH4 diffuse degassing and correlation with fault systems in Agua Caliente-Tzitzio, Michoacan, Mexico[J]. J. Volcanol. Geotherm. Res. 394, 106808. doi:10.1016/j.jvolgeores.2020.106808
Jiang, G. Y., Xu, X. W., Chen, Y. H., Liu, Y. J., Fukahata, Y., Wang, H., et al. (2015). Geodetic imaging of potential seismogenic asperities on the Xianshuihe-Anninghe-Zemuhe fault system, southwest China, with a new 3-D viscoelastic interseismic coupling model. J. Geophys. Res. 120, 1855–1873. doi:10.1002/2014JB011492
Jing, J., Tang, Z., Yang, Y., and Ma, L. (2019). Impact of formation slope and fault on CO2 storage efficiency and containment at the Shenhua CO2 geological storage site in the Ordos Basin, China[J]. Int. J. Greenh. Gas Control 88, 209–225. doi:10.1016/j.ijggc.2019.06.013
Jolie, E., Moeck, I., and Faulds, J. E. (2015). Quantitative structural–geological exploration of fault-controlled geothermal systems—A case study from the Basin-and-Range Province, Nevada (USA). Geothermics 54, 54–67. doi:10.1016/j.geothermics.2014.10.003
Joos, F., Plattner, G. K., Stocker, T. F., Marchal, O., and Schmittner, A. (1999). Global warming and marine carbon cycle feedbacks on future atmospheric CO2[J]. Sci. 284 (5413), 464–467.
Kämpf, H., Bräuer, K., Schumann, J., Hahne, K., and Strauch, G. (2013). CO2 discharge in an active, non-volcanic continental rift area (Czech Republic): characterisation (δ13C, 3He/4He) and quantification of diffuse and vent CO2 emissions[J]. Chem. Geol. 339, 71–83. doi:10.1016/j.chemgeo.2012.08.005
Kang, Y. J., Yun, S. T., Yu, S., Do, H. K., and Chae, G. (2020). Quantitative assessment of deep-seated CO2 leakage around CO2-rich springs with low soil CO2 efflux using end-member mixing analysis and carbon isotopes[J]. J. Environ. Manag. 276, 111333. doi:10.1016/j.jenvman.2020.111333
Kennedy, B. M., Kharaka, Y. K., Evans, W. C., Ellwood, A., DePaolo, D. J., Thordsen, J., et al. (1997). Mantle Fluids in the San Andreas Fault System, California. Science 278 (5341), 1278–1281. doi:10.1126/science.278.5341.1278
King, C. Y. (1986). Gas geochemistry applied to earthquake prediction: An overview[J]. J. Geophys. Research: Solid Earth 91 (B12), 12269–12281. doi:10.1038/ngeo2622
Lee, H., Muirhead, J. D., Fischer, T. P., Ebinger, C. J., Kattenhorn, S. A., Sharp, Z. D., et al. (2016). Massive and prolonged deep carbon emissions associated with continental rifting. Nat. Geosci. 9 (2), 145–149. doi:10.1038/ngeo2622
Li, Y. C., Shan, X. J., Qu, C. Y., Zhang, Y. F., Song, X. G., Jiang, Y., et al. (2017). Elastic block and strain modeling of GPS data around the Haiyuan-Liupanshan fault, northeastern Tibetan Plateau. J. Asian Earth Sci. 150, 87–97. doi:10.1016/j.jseaes.2017.10.010
Liu, J. (1999). Volcanoes hazards and montoring[J]. Quadrangular Res. (05), 414–422. (in Chinese abstract).
Manaker, D. M., Calais, E., Freed, A. M., Ali, S. T., Przybylski, P., Mattioli, G., et al. (2008). Interseismic plate coupling and strain partitioning in the northeastern Caribbean[J]. Chem. Geol. 469, 176–184. doi:10.1016/j.chemgeo.2017.01.006
Martinelli, G., and Dadomo, A. (2017). Factors constraining the geographic distribution of earthquake geochemical and fluid-related precursors. Chem. Geol. 469, 176–184. doi:10.1016/j.chemgeo.2017.01.006
Muirhead, J. D., Fischer, T. P., Oliva, S. J., Laizer, A., van Wijk, J., Currie, C. A., et al. (2020). Displaced cratonic mantle concentrates deep carbon during continental rifting. Nature 582 (7810), 67–72. doi:10.1038/s41586-020-2328-3
Neri, G., Barberi, G., Oliva, G., Orecchio, B., and Presti, D. (2006). A Possible Seismic Gap within a Highly Seismogenic Belt Crossing Calabria and Eastern Sicily, Italy. Italy. Bull. Seismol. Soc. Am. 96, 1321–1331. doi:10.1785/0120050170
Pei, X. Y., Wang, X. M., and Zhang, C. G. (1998). Basic character of segmentation of the Quaternary movement on the Anninghe fault[J]. Earthq. Res. Sichuan 4, 52–61.
Rahilly, K. E., and Fischer, T. P. (2021). Total diffuse CO2 flux from Yellowstone caldera incorporating high CO2 emissions from cold degassing sites[J]. J. Volcanol. Geotherm. Res. 419, 107383. doi:10.1016/j.jvolgeores.2021.107383
Ran, Y. K., Cheng, J. W., Gong, H. L., and Chen, L. (2008). Late Quaternary geomorphic deformation and displacement rates of the Anninghe fault around Zimakua[J]. Seismology and Geology 30 (1), 86–98.
Ren, Z., and Lin, A. (2010). Deformation characteristics of co-seismic surface ruptures produced by the 1850 M 7.5 Xichang earthquake on the eastern margin of the Tibetan Plateau. J. Asian Earth Sci. 38 (1-2), 1–13. doi:10.1016/j.jseaes.2009.12.008
Rovira, P., and Vallejo, V. (2008). Changes in δ13C composition of soil carbonates driven by organic matter decomposition in a Mediterranean climate: a field incubation experiment. Geoderma 144 (3), 517–534. doi:10.1016/j.geoderma.2008.01.006
Sano, Y., and Marty, B. (1995). Origin of carbon in fumarolic gas from island arcs. Chem. Geol. 119 (1–4), 265–274. doi:10.1016/0009-2541(94)00097-r
Shen, Z. K., Lü, J., Wang, M., and Bürgmann, R. (2005). Contemporary crustal deformation around the southeast borderland of the Tibetan Plateau. J. Geophys. Res. Solid Earth 110. doi:10.1029/2004JB003421
Sizova, E., Hauzenberger, C., Fritz, H., Faryad, S. W., and Gerya, T. (2019). Late orogenic heating of (ultra)high pressure rocks: Slab rollback vs. slab breakoff. Geosciences 9, 499. doi:10.3390/geosciences9120499
Solomon, S., Plattner, G. K., Knutti, R., and Friedlingstein, P. (2009). Irreversible climate change due to carbon dioxide emissions[J]. Proc. Natl. Acad. Sci. 106 (6), 1704–1709.
Tamir, G., Shenker, M., Heller, H., Bloom, P. R., Fine, P., and Bartal, A. (2012). Dissolution and recrystallization processes of active calcium carbonate in soil developed on tufa. Soil. Sci. Soc. Am. J. 76 (5), 1606–1613. doi:10.2136/sssaj2012.0041
Toda, S., Lin, J., Meghraoui, M., and Stein, R. S. (2008). May 2008 M = 7.9 Wenchuan, China, earthquake calculated to increase failure stress and seismicity rate on three major fault systems[J]. Geophy. Res. Let. 35 (17).
Viveiros, F., Marcos, M., Faria, C., João, L. G., Catarina, S., Teresa, F., et al. (2017). Soil CO2 degassing path along volcano-tectonic structures in the Pico-Faial-São Jorge islands (Azores archipelago, Portugal)[J]. Front. Earth Sci. 5, 50. doi:10.3389/feart.2017.00050
Walia, V., Lin, J., Fu, C., Yang, F., Hong, W., Wen, L., et al. 2010. Soil-gas monitoring: a tool for fault delineation studies along Hsinhua Fault (Tainan),Southern Taiwan. Appl. Geochem. 25 (4), 602–607. doi:10.1016/j.apgeochem.2010.01.017
Wang, Q. L., Wang, W. P., Liang, W. F., and Chen, B. (1998). Stress-dissipative heat geotemperature precursor mechanism of earthquakes[J]. Acta Seismologica Sinica 11, 615–621.
Weinlich, F. H., Faber, E., Boušková, A., Horálek, J., Teschner, M., and Poggenburg, J. (2006). Seismically induced variations in Mariánské Lázně fault gas composition in the NW Bohemian swarm quake region, Czech Republic — A continuous gas monitoring. Tectonophysics 421 (1-2), 89–110. doi:10.1016/j.tecto.2006.04.012
Wen, X. Z. (2000). Character of rupture segmentation of the Xianshuihe-Anninghe-Zemuhe fault zone, Western Sichuan. Seismol. Geol. 22 (3), 239–249. doi:10.3969/j.issn.0253-4967.2000.03.005
Wycherley, H., Fleet, A., and Shaw, H. (1999). Some observations on the origins of large volumes of carbon dioxide accumulations in sedimentary basins. Mar. Petroleum Geol. 16 (6), 489–494. doi:10.1016/s0264-8172(99)00047-1
Xu, S., Guan, L., Zhang, M., Zhong, J., Liu, W., Xie, X., et al. (2022). Degassing of deep-sourced CO2 from Xianshuihe-Anninghe fault zones in the eastern Tibetan Plateau[J]. Sci. China Earth Sci. 65 (1), 139–155. doi:10.1007/s11430-021-9810-x
Xu, X., Yu, G., Ma, W., Yongkang, R., You, H.-C., Zhang, L.-F., et al. (2002). Evidence and methods for determining the safety distance from the potential earthquake surface rupture on active fault[J]. Seismol. EGOLOGY 24 (4), 470.
Yang, Y., Li, Y., Guan, Z., Chen, Z., Zhang, L., Lv, C. J., et al. (2018). Correlations between the radon concentrations in soil gas and the activity of the Anninghe and the Zemuhe faults in Sichuan, southwestern of China. Appl. Geochem. 89, 23–33. doi:10.1016/j.apgeochem.2017.11.006
Yu, X., Yang, C., Dong, G., and Zhan, D. (2014). Drilling and completion technology in the first geothermal well construction in Jixian system in Tangshan. Explor. Eng. Media 41 (2), 41–44.
Yuce, G., Fu, C., DʼAlessandro, W., Gulbay, A., Walia, V., Bellomo, S., et al. (2017). Geochemical characteristics of soil radon and carbon dioxide within the Dead Sea fault and Karasu fault in the Amik basin (Hatay), Turkey. Chem. Geol. 469, 129–146. doi:10.1016/j.chemgeo.2017.01.003
Zhang, M., Xu, S., Zhou, X., Caracausi, A., Sano, Y., Guo, Z., et al. (2021). Deciphering a mantle degassing transect related with India-Asia continental convergence from the perspective of volatile origin and outgassing. Geochimica Cosmochimica Acta 310, 61–78. doi:10.1016/j.gca.2021.07.010
Zhang, P., Deng, Q., and Zhang, G. (2003). Active tectonic blocks and strong earthquakes in the continent of China. Sci. China Ser. D Earth Sci. 46 (2), 13–24. doi:10.1360/03dz0002
Zhou, X., Sun, F., and Chen, Z. (2017). Degassing of CO2, CH4, Rn and Hg in the rupture zones produced by Wenchuan Ms 8.0 earthquake. Acta Petrol. Sin. 33 (1), 291–303. (in Chinese with English abstract). Web of Science Id WOS:000393257900023 .
Zhou, X. C., Du, J. G., Chen, Z., Cheng, J. W., Tang, Y., Yang, L. M., et al. (2010). Geochemistry of soil gas in the seismic fault zone produced by the Wenchuan Ms 8.0 earthquake, southwestern China. Geochem. Trans. 11, 5. doi:10.1186/1467-4866-11-5
Keywords: soilgas, carbon dioxide, geochemistry, diffuse degassing, AZF
Citation: Liu F, Zhou X, Dong J, Yan Y, Tian J, Li J, Ouyang S, He M, Liu K, Yao B, Wang Y, Zeng Z and Zhang Y (2023) Soil gas CO2 emissions from active faults: a case study from the Anninghe—Zemuhe fault, Southeastern Tibetan Plateau, China. Front. Earth Sci. 11:1117862. doi: 10.3389/feart.2023.1117862
Received: 06 December 2022; Accepted: 11 April 2023;
Published: 09 May 2023.
Edited by:
Ziming Yang, Oakland University, United StatesReviewed by:
Nunzia Voltattorni, Istituto Nazionale di Geofisica e Vulcanologia (INGV), ItalyKan Li, Woods Hole Oceanographic Institution, United States
Copyright © 2023 Liu, Zhou, Dong, Yan, Tian, Li, Ouyang, He, Liu, Yao, Wang, Zeng and Zhang. This is an open-access article distributed under the terms of the Creative Commons Attribution License (CC BY). The use, distribution or reproduction in other forums is permitted, provided the original author(s) and the copyright owner(s) are credited and that the original publication in this journal is cited, in accordance with accepted academic practice. No use, distribution or reproduction is permitted which does not comply with these terms.
*Correspondence: Xiaocheng Zhou, emhvdXhpYW9jaGVuZzE4OEAxNjMuY29t; Jinyuan Dong, ZG9uZ2ppbnl1YW5AMTYzLmNvbQ==