 Maurizio Ercoli1,2*
 Filippo Carboni2,3*
 Assel Akimbekova1,2
 Ramon Bertran Carbonell4Massimiliano Rinaldo Barchi1,2
- 1Dipartimento di Fisica e Geologia, Università Degli Studi di Perugia, Perugia, Italy
- 2CRUST Centro inteRUniversitario per l’analisi SismoTettonica Tridimensionale, Chieti, Italy
- 3Institut für Geo-und Umweltnaturwissenschaften, Geologie, Albert-Ludwigs-Universität Freiburg, Breisgau, Germany
- 4CSIC-GeoSciences Barcelona (Geo3BCN-CSIC), Barcelona, Spain
Legacy seismic reflection data constitute infrastructure of tremendous value for basic research. This is especially relevant in seismically hazardous areas, as such datasets can significantly contribute to the seismotectonic characterization of the region. The quality of the data and the resulting image can be effectively improved by using modern tools, such as pre-conditioning techniques and seismic attributes. The latter are extensively used by the hydrocarbon exploration industry, but are still only poorly applied to the study of active faults. Pre-conditioning filters are effective in removing random noise, which hampers the detection of subtle geologic structures (i.e., normal faults). In this study, a workflow including pre-conditioning and extraction of seismic attributes is used to improve the quality of the CROP-04 deep seismic reflection profile. CROP-04 was acquired in the 1980s across the Southern Apennines mountain range, one of the most hazardous seismically active regions in Italy. The results show the capacity of this method to extract, from low-resolution legacy data, subtle seismic fabrics that correspond to a dense network of fault sets. These seismic signatures and the enhanced discontinuities disrupting the reflections, which were invisible in the original data, correlate well with the main regional normal faults outcropping at the surface. Moreover, the data reveal higher structural complexity, due to many secondary synthetic and antithetic structures, knowledge of which is useful in modeling of the local and regional distribution of the deformation and potentially in guiding future field mapping of active faults. This proposed approach and workflow can be extended to seismotectonic studies of other high-hazard regions worldwide, where seismic reflection data are available.
1 Introduction
Seismically active regions are struck by strong earthquakes, which, in densely populated areas, may cause widespread and intense damage as well as loss of human lives. To better define the seismic hazard of a region, seismotectonic studies are fundamental in providing the foundational knowledge establishing the link between active faults at the surface and the hypocentral source; such studies aim to image the deep geometry and kinematics of the region (Allen et al., 1965; Schwartz and Coppersmith, 1984; Barchi and Mirabella, 2008). Reconstructing the geological and structural framework of seismogenic areas requires the integration of several methodologies and datasets. This process may encompass conventional fieldwork (e.g., geological–structural mapping) and the analysis and interpretation of subsurface data, such as borehole data and geophysical datasets. Undoubtedly, seismic reflection is the most powerful geophysical tool, providing high-resolution images of the subsurface and effectively constraining the subsurface structural settings. In urban or protected areas, drilling of new boreholes and acquisition of novel seismic reflection data can be complex or hampered by high costs, complex logistics, and environmental limitations. In the past several decades, several research projects have successfully acquired deep seismic profiles, which have been used to build up regional and/or relatively large-scale crustal models (e.g., LITHOPROBE, Clowes et al., 1968; Clowes et al., 1999; Hope et al., 1999; COCORP; Cook et al., 1979; BIRPS; Brewer et al., 1983; ECORS; Roure et al., 1989; DEKORP; Meissner and Bortfeld, 1990; TAICRUST; Nakamura et al., 1998; CROP; Barchi et al., 1998; Pialli et al., 1998; Finetti et al., 2001; Pauselli et al., 2006; IBERSEIS; Simancas et al., 2003; TRANSALP; Castellarin et al., 2004; FIRE; Kukkonen et al., 2006; Korja et al., 2018; ALCUDIA; Ehsan et al., 2014;Ehsan et al., 2015). Data corresponding to these unique large-scale crustal and lithospheric research programs are currently available through open seismic data repositories such as LITHOPROBE (Clowes, 2010), OPENFIRE (Heinonen et al., 2017, https://helda.helsinki.fi/handle/10138/225858), and SEISDARE (Deng and Stauffer, 2006). Higher-resolution seismic reflection data provided by the energy industry or national archives have also been used in local and/or regional geological studies of upper crust structures (e.g., Wu, 1986; William-Keach et al., 1989; Boncio et al., 2000; Clowes and Hyndman, 2002; Carvalho et al., 2008; Beidinger et al., 2011; Percival, et al., 2012; Bonini et al., 2014; Maesano et al., 2015; Porreca et al., 2018; Barchi et al., 2021). As shown by Ercoli et al. (2020), more information can be extracted from this type of data for seismotectonic research through seismic attribute analysis. A similar approach can also be applied to deep seismic reflection profiles, which are acquired in regional studies (i.e., longer transects with larger spacing between recording stations) and thus generally targeted for exploration of the deep crust (Torvela et al., 2013). For these reasons, although data with such characteristics are theoretically not ideal for high-resolution imaging of faults, fault zones, and fracture networks, they can contain subtle seismic signatures and/or seismic fabrics, which provide very valuable information on structural features and tectonic lineaments located at shallower levels, in the upper crust.
In Italy, in early 2000, a national effort resulted in a very significant deep crustal characterization project involving the acquisition of deep seismic reflection transects known as CROP (Morelli, 2003; Scrocca et al., 2003; Finetti, 2005; http://www.crop.cnr.it/ last accessed 17 August 2022). The goal of CROP was to provide foundational knowledge of the deep geological structure of both on-shore and off-shore areas of the Italian Peninsula. The resolution of these data is relatively limited (∼100 m), mostly due to the configurations used in acquisition and the limits of the available technology at that time. The resulting images provided critical results unveiling the deep crustal structure of the Italian Peninsula (e.g., for the Central and Southern Apennines, see Pauselli et al., 2006; Patacca and Scandone, 2007). The signal-to-noise ratio (SNR) of these seismic profiles is generally considered to be low due to the generalized low fold and high level of random noise content obscuring the reflectivity of the subsurface. These drawbacks place limitations on the interpretation of the seismic images, which is always affected by a degree of uncertainty and subjectivity, depending largely on the data quality and the interpreter’s experience, thus giving rise to contrasting geological models. In addition, seismic interpretation is always a time-consuming task, particularly without the use of modern and efficient semi-automatic or automatic tools for extraction of the most prominent structural features (e.g., faults; Tingdahl and de Rooij, 2005; Zhao and Sun, 2013; Acuña-Uribe, 2021). Nonetheless, these techniques should be used with care, as they may fail or produce artifacts when applied to noisy data; for this reason, all processing strategies that can be used to improve data quality are an asset in reducing and minimizing errors, while also enhancing embedded features and speeding up the seismic interpretation process. It is also known that application of a full and modern reprocessing workflow increases the value of old datasets (e.g., Stucchi et al., 2003; Tognarelli et al., 2011; Giustiniani et al., 2015; Meffre et al., 2022); however, this solution is typically time-consuming and expensive, and it requires access to the original raw shot-gathers, observers’ logs, and careful and detailed positioning information on sources and receivers.
When only stack images are available, alternative procedures based on advanced post-stack processing schemes are needed to extract more information from seismic data (e.g., information on fault patterns and clearer seismic fabrics); these may include, for example, seismic attribute analysis (Sheriff, 2002; Tingdahl, 2003). This method was developed for studies involving the characterization of hydrocarbon reservoirs (Chopra and Marfurt, 2007; Marfurt, 2018), and the tool is still under rapid development (using machine learning techniques; Wrona et al., 2018; Naeini and Prindle, 2019; Ashraf et al., 2020; DeFelipe et al., 2021; Yu and Ma, 2021). Seismic attributes are rarely used in seismotectonic studies (i.e., those involving earthquakes), either in studies at the scale of legacy seismic reflection profiles (Ercoli et al., 2020; Barchi et al., 2021) or those involving high-resolution near-surface imaging (e.g., ground-penetrating radar; McClymont et al., 2008; Forte et al., 2012; Ercoli et al., 2015; De Lima et al., 2018; Zhao et al., 2018; Ercoli et al., 2021). As far as we are aware, there is still no study applying this technique to deep, regional seismic reflection profiles, such as the aforementioned Italian CROP transect, with the aim of imaging relatively shallow and seismogenic faults. Therefore, this paper presents the first application of seismic attribute analysis to pre-conditioned deep seismic reflection data, aiming to improve the resolution and interpretability of CROP-04 NVR (Mazzotti et al., 2000; Mazzotti et al., 2007a). This profile crosses the Southern Apennines mountain range (Figure 1). This zone is one of the most important seismogenic regions of the Italian peninsula. It was affected by the strongest seismic event (Mw 6.9, 23rd November 1980) to have occurred in Italy in the last 100 years (the Irpinia earthquake; e.g., Del Pezzo et al., 1983; Pantosti and Valensise, 1990; Valensise, 1993; Amoruso et al., 2011; Galli, 2020 and references therein; Matano et al., 2020; Rovida et al., 2020; Bello et al., 2021; 2022; Lombardi, 2021).

FIGURE 1. Map indicating the study area, which is located in the Southern Apennines (Italy). (A) Geological map of the study area, with simplified geology, thrusts, and normal faults (from Bello et al., 2021), earthquake hypocenters (black dots), and the CROP-04 trace (black line). (B) Inset with the trace of the CROP-04 profile from Agropoli city to Barletta city, with several representative CDP numbers (yellow dots) related to its westernmost reprocessed sector (Mazzotti et al., 2000; 2007a). The segment crossing the Irpinia area, highlighted in yellow, is re-interpreted in this article.
The processing workflow designed in this study aims to remove or attenuate the high amplitude of random noise, thus extracting additional embedded information on the locations of the main active faults of this region outcrop (Figure 1). The workflow aims to enhance the imaging of not only the master (seismic) faults but also possible patterns of minor networks of fractures (“sub-seismic scale faults”; Adigun and Ayolabi et al., 2013; Odoh et al., 2014; Cohen et al., 2006; Chopra and Marfurt, 2007; Iacopini et al., 2016), thereby reviving the CROP-04 NVR profile in light of seismotectonic studies. Such faults at a local scale represent important structures, which can be seismically active and which are fundamental in fully reconstructing the extent of the fault zones and deformations occurring within this study area.
Following an overview of pre-conditioning techniques for seismic reflection data and seismic attribute analysis, we present an application of the proposed workflow customized for structural interpretation. We first test the efficiency of a pre-conditioning technique on synthetic 2D data, generated from a simple model featuring dipping beds and multi-scale faults; this is followed by an attribute analysis. Then, we apply this workflow to the CROP-04 NVR transect crossing the Southern Apennines (Figure 1, profile track in the inset b). The results provide data with a higher signal-to-noise ratio and improved lateral continuity of reflections, and reveal the presence of complex seismic signature patterns, which are consistent with the seismic signature provided by the systems of faults. Finally, we focus our seismic interpretation on the seismically active sector across the Southern Apennines mountain range. We present, for the first time, a clear image of a complex system of fractures characterizing this area, displaying the main zones of the most pervasive deformation, in which the faults are clearly visualized in terms of their spatial organization, distribution, and relationships, down to a depth of at least 4–5 km. These results are fundamental from a seismotectonic perspective, since faults and fracture areas can play a key role as conduits for or barriers to fluid flow. An increase in pressure is recognized as one of the main factors triggering strong earthquakes (e.g., Knipe et al., 1998; Scholz, 1998; Improta et al., 2014; Mulargia and Bizzarri, 2015; Chiarabba et al., 2020a; 2020b). This article proposes a processing flow combining data pre-conditioning with seismic attribute analysis, showing the strong potential for revived legacy seismic reflection images to contribute to seismotectonic research and to support assessments of the seismic hazard of active regions worldwide.
2 Geological framework
The study area is located in the Campania–Lucania arc (Figure 1), forming the western part of the Southern Apennines. It consists of a complex stack of tectonic units, derived from the deformation of sedimentary successions and originally deposited on the Paleo-Tethys oceanic floor and/or on the adjacent western margin of the Adriatic Plate. The main tectonic units, related to the four main paleogeographic domains (e.g., Patacca and Scandone, 2007; Bonardi et al., 2009; Hussein et al., 2021), are (from uppermost to lowermost):
1) the Liguride and Sicilide nappe units (Lower Cretaceous–Lower Miocene), made of basinal sediments (e.g., Ogniben, 1969; Knott, 1987; Bonardi et al., 1988; Monaco and Tortorici, 1995; Lentini et al., 2002; Cavalcante et al., 2012) originally deposited on the Tethys Ocean and/or on the distal continental margin;
2) the Apennine Platform Unit (Upper Triassic–Middle Miocene), made of internally deformed, thick carbonate shelf succession (D'Argenio et al., 1975; D’argenio et al., 1973; Palladino et al., 2008; Merlini and Mostardini, 1986; Menardi Noguera and Rea, 2000);
3) the Lagonegro Unit (Middle Triassic–Early Tertiary), made of deep-sea pelagic and turbiditic deposits (Marsella et al., 1995); and
4) the Apulian Platform (Mesozoic Early Tertiary), made of thick shallow-water carbonates (Lentini et al., 2002; Patacca and Scandone, 2007) lying on top of a crystalline basement succession (Lower Paleozoic–Permian–Early Triassic).
A phase of NE-SW Quaternary extension generated a series of normal fault systems (Figure 1A), which displaced the pre-existing internal contractional structures (migrating from west to east), synchronous with the contraction affecting the front of the belt (e.g., Elter et al., 1975; Lavecchia et al., 1994; Doglioni et al., 1999). The still-active extension is mainly responsible for the present-day earthquake hazard in the study area (Amato and Montone, 1997; D’Agostino et al., 2008; Brozzetti, 2011; Ferranti et al., 2014).
In 1980, this area was struck by a strong earthquake (Mw 6.9; Bernard and Zollo, 1989; Pantosti and Valensise, 1990), followed by several subevents that activated, in sequence, three distinct fault segments (Westaway and Jackson, 1984; Bernard and Zollo, 1989). In recent decades, the subsurface geological and structural status of the seismogenic sources (and, in particular, the current attitude and geometry of the activated fault segments, their structural hierarchy, and their link with seismicity) has been targeted in depth in relevant scientific debates (Ascione et al., 2003; Improta et al., 2003a; b; 2014; Maschio et al., 2005; Brozzetti, 2011; Bello et al., 2021; De Landro et al., 2022). The CROP-04 NVR deep seismic reflection profile partially covers the epicentral area with an SW-NE trend, which is orthogonal to the average strike of the extensional structures (Alburni, Inner Irpinia, Irpinia, Monticello, and other antithetic faults; Bello et al., 2021) (Figure 1A).
3 Data, materials, and methods
3.1 The CROP-04 NVR seismic reflection profile
The deep seismic reflection line CROP-04 NVR (Mazzotti et al., 2000, 2007a), hereafter CROP-04, runs from the south-western sector of the Campania region (near the town of Agropoli) to the city of Barletta in the Puglia Region (Cippitelli, 2007; https://www.videpi.com/videpi/crop/crop.asp, last accessed 17 August 2022). In this study, we worked on the westernmost portion of this seismic line, the limit of which is located ∼ 6 km northeast of the city of Venosa (CDP 2620, Mazzotti et al., 2000, 2007a) in the Basilicata region (Figure 1). The acquisition of the CROP-04 profile was funded by C.N.R., AGIP (now known as Eni S.p.A.) in collaboration with ENEL, and it was acquired between 1989 and 1990. As in other Italian areas, during the 1980s–1990s, the Southern Apennines were the object of hydrocarbon exploration, and the oil industry collected new data and reprocessed available industrial seismic lines (Cippitelli, 2007). Therefore, the acquisition and analysis of these reflection profiles, collected at a depth range of ∼6,000 m for hydrocarbon exploration, aided in the discovery of important oil fields in Val d’Agri, which are currently still operational. On average, these seismic reflection profiles achieved a higher resolution than the deep CROP-04, since the latter targeted the crustal structure of the mountain range and the foreland (Cippitelli, 2007). This consideration is supported by examination of several of the main acquisition parameters of the CROP-04: this stack line, acquired using a combination of both dynamite and vibroseis sources, shows a fold of 120%, a CDP distance of 40 m, and a time window of 10 s TWT (Figure 2), but Patacca and Scandone (2001) report continuous and well-structured reflections visible until ∼9 s TWT.
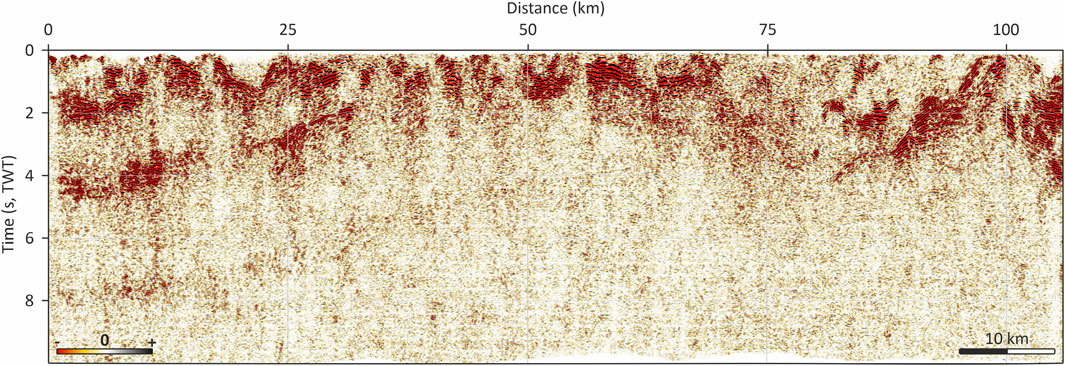
FIGURE 2. CROP-04 normal incidence deep seismic reflection lines (stack) displayed over the entire length of the profile. The left (west) side, dominated by W-dipping reflections, is the central sector and focus of this work, characterized by investigation depth limited to ∼6 s TWT; the right (east) side also exhibits steep W-dipping reflections. Note that the entire seismic line is widely contaminated by high-frequency random noise, hampering accurate seismic interpretation (see spectrum in Table 1).
The average amplitude spectrum shows a bandwidth ranging from 5 to 45 Hz, with a dominant frequency of ∼11 Hz (Table 1). Assuming an average velocity of 5,000 m/s for the subsurface, a value of ∼110 m is estimated for the vertical resolution. Based on the acquisition parameters, processing difficulties can be anticipated: one is the combination of zero and minimum phase sources (dynamite and vibroseis), each most probably differing in frequency content; spatial aliasing (Steeples and Miller, 1998) is also critical, meaning that spatial sampling might not be sufficient to image sub-vertical structures such as normal faults and/or fractures.
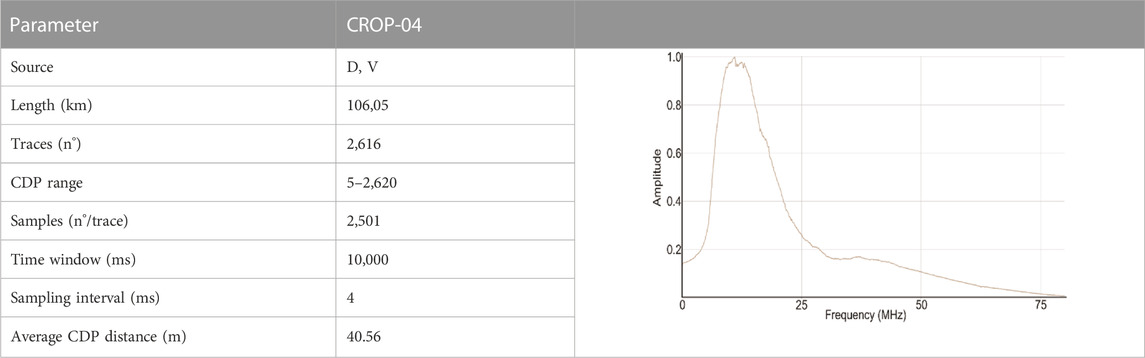
TABLE 1. Parameters of deep seismic line CROP-04. The amplitude vs. frequency spectrum shows a narrow bandwidth with a frequency range close to 50 Hz, mostly dominated by random noise components (all details of the processing workflow can be found in Mazzotti et al., 2007a).
The availability of this deep profile, as well as all the other commercial data that have been released, has favored important improvements in the understanding of the geological frameworks and the evolution of the Southern Apennines region. The seismic interpretation and re-interpretation of such data (Mazzoli et al., 2000; 2001; Menardi Noguera and Rea, 2000; Patacca and Scandone, 2001; Scrocca et al., 2005), including full reprocessing of CROP-04 (Mazzotti et al., 2000; Scrocca et al., 2003; Stucchi et al., 2003; Mazzotti et al., 2007a), has contributed to the definition of a variety of contrasting geological models (.e.g.,Menardi Noguera and Rea, 2000; Butler et al., 2004; Shiner et al., 2004; Finetti, 2005; Cippitelli, 2007; Patacca and Scandone, 2007; Scrocca et al., 2007; Scrocca, 2010; Vezzani et al., 2010; Mazzoli et al., 2013; Savastano and Piana Agostinetti, 2019). Controversies in this domain are nearly always attributable to the relatively low S/N ratio in the data, which hampers the application of more sophisticated processing techniques, as reported by Mazzotti et al. (2000; 2007b), and thus a clear mapping of the fault architecture within the subsurface of the region is still not well defined. For this reason, any achievements in improving noise reduction and increasing the lateral resolution will help with re-interpretation of the data, especially if further information can be extracted from the seismic fabrics and their patterns.
3.2 Background on data pre-conditioning techniques and seismic attributes
Geophysical features in seismic reflection data can be considerably enhanced with the application of seismic attribute analysis, which can be used to extract qualitative and quantitative information from data and to emphasize the display of structural features and relationships. A seismic attribute is a descriptive and quantifiable parameter (e.g., time or dip) that can be calculated from a single seismic trace within 3D cubes (Taner et al., 1979; Barnes, 1996; 1999; Chen and Sidney, 1997; Taner, 2001; Chopra and Marfurt, 2007; Iacopini, 2011; Forte et al., 2016; Dewett et al., 2021; Iacopini and Butler, 2021). Seismic attributes can be computed over pre-stack or post-stack seismic data and, nowadays, over 3D seismic volumes. The latter guarantees more efficient applicability of the proposed analysis by allowing the identification of stratigraphic and tectonic structures along time slices or depth horizons (Chopra and Marfurt, 2005; Marfurt et al., 2011; Hale, 2013; Torvela et al., 2013; Barnes, 2016; Wu and Hale, 2016; Di and AlRegib, 2019). Currently, the extraction of seismic attributes represents a fundamental tool for the exploration industry, as it speeds up the seismic interpretation process, reduces interpretation bias (Alcalde et al., 2019), and improves quantitative results (Chopra and Marfurt, 2007; Marfurt, 2018). Nevertheless, attribute analysis of a 2D seismic transect has some limitations, even when the tools are applied proficiently (e.g., “apparent dip”; Ha et al., 2019).
In the 80s and 90s, the acquisition of sparse 2D seismic reflection data was the operative standard, and nowadays, many such datasets are released by industry for research purposes. Therefore, the re-evaluation of these data can contribute to energy (geothermal) and mineral exploration research, as well as work on characterization of the subsurface for geological storage and seismotectonic studies (Malehmir et al., 2016; Schmelzbach et al., 2016; Ercoli et al., 2020; Malehmir et al., 2021; Pertuz et al., 2022), together with additional novel high-resolution data acquired using modern technologies (Manning et al., 2019; Dieulangard et al., 2021; Strobbia et al., 2022). For this reason, it is worth attempting any available strategy to extract as much information as possible from legacy data, which are typically characterized by both advantages and disadvantages (Ercoli et al., 2020). Conventional seismic interpretation is based on analysis of the amplitudes, geometry, and lateral continuity or discontinuity of reflections; thus, any successful reduction of random noise and increase in signal quality might represent a major step forward for re-evaluation of legacy data. For example, seismic discontinuities interpreted as faults, possibly not visible or unclear in conventionally processed profiles, can be strongly enhanced with relatively quick and cheap data treatment strategies like attribute analysis, without the need to fully reprocess everything from the pre-stack raw data. However, seismic attributes can be extremely sensitive to incoherent noise (Marfurt and Alves, 2015; Ercoli et al., 2020 and references therein), so it is necessary to hamper or reduce the generation of seismic artifacts by suppressing random noise and improving the linear features using pre-conditioning techniques (e.g., Tingdahl and de Groot, 2003; Acuña-Uribe et al., 2021). The latter can be operated via conventional frequency filtering or via structural filters and statistical attributes (Barnes, 2016), based on the extraction of reflections dip and azimuth (Chopra and Marfurt, 2007; Qayyum and de Groot, 2012). After this step, the use of geometric or structural attributes based on the determination of reflector geometry, dip and trace coherence, similarity, variance, and curvature (Bahorich and Farmer, 1995; Gersztenkorn and Marfurt, 1999; Marfurt et al., 1999; Randen et al., 2000; Roberts, 2001; Al-Dossary and Marfurt, 2006; Marfurt, 2006; Chopra and Marfurt, 2008; Dewett and Henza, 2016) might favor the identification and enhancement of the amplitude and phase of seismic events (Acuña-Uribe et al., 2021 and references therein). It must also be noted that during the last few years, the detection of fault structures has been optimized using various techniques (Meldahl et al., 2001; Pedersen et al., 2002; Pepper and Bejarano, 2005; Vasudevan et al., 2005; Aqwari and Boe, 2011; Aqwari et al., 2012; Babangida et al., 2013; Hale, 2013; Di and Gao, 2017; Qi and Marfurt, 2018). On unconditioned legacy profiles, the main faults and related splays can be masked or complicated by several factors, including random noise, dispersion effects, and geological complexities due to intense deformation, which, in unmigrated data, might generate many diffractions.
The detection of faults in seismic data can be considerably improved and refined through use of pre-conditioning filters such as a dip-steered median filter (DSMF; Tingdahl, 1999; Tingdahl and de Groot, 2003), a dip-steered fault-enhancement filter like the structure-oriented filter (SOF; Fehmers and Höcker, 2003), edge-preserving smoothing (EPS; Luo et al., 2002; AlBinHassan et al., 2006), and structural smoothing (SS; Iske and Randen, 2005; D'Argenio et al., 1992). Some seismic attributes are typically sensitive to sharp variations in wave geometry and amplitude among traces or sectors of traces. The attribute response across faults is also quite sensitive to the dip of traces. The dip-steering technique allows seismic reflections to be followed by auto-tracking of the pre-calculated dip-field from a given starting position (Tingdahl and de Rooij, 2005), so that a sample-to-sample analysis clearly improves the lateral correlation of events across seismic traces and along tracks. Attributes such as (geological) dip, azimuth, and curvature are computed directly from steering data; auto-tracker tools, conventional amplitude, and similarity trackers, which can include dip-field, are used to constrain horizon-tracking and fill in any gaps. Steering cubes are typically calculated over 3D seismic volumes, and these require dip values in both the inline and the crossline directions at each seismic sample position. Dip-steering can also be calculated over 2D seismic profiles by storing the dip at every sample position only in the line direction (Ha et al., 2019). Conventionally, at least two steering outputs are generated. The “Detailed-Steering” (DS) form of output includes dips as calculated by the dip-computation algorithm (central-steering or full-steering, as in Figure 3; dGB Earth Sciences, 2021), and this is used to preserve details in the data (e.g., detection of fractures through computation of curvature attributes). The “Background Steering” (BS) output is a smoothed version of DS obtained through the application of a median filter. As BS is less noisy and includes dips relating to larger (regional) structural trends, it is suitable for dip-steered filtering operations. Dip-steering filters can dramatically improve the output of attributes such as similarity, coherence, texture, and volume statistics, and are also critical in neural network-based “probability” cubes (e.g., chimney cubes and fault cubes; dGB Earth Sciences, 2021).
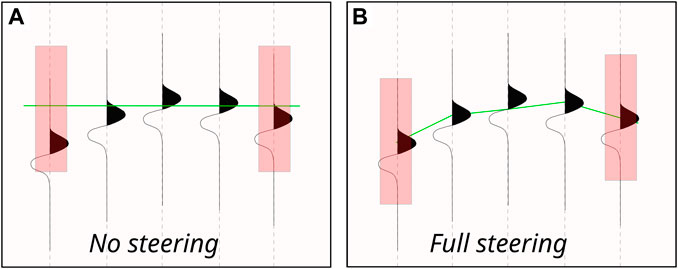
FIGURE 3. Simplified scheme for the steering concept. (A) No steering algorithm is applied during the filter or attribute computation; (B) application of full steering across the seismic traces: dip/azimuth is updated at every trace position (redrawn from dGB Earth Sciences, 2021).
3.3 2D forward modeling: Synthetic profile of a normal fault set
To define an efficient pre-conditioning strategy for application of the seismic attribute analysis, we tested a workflow, including DSMF, on a synthetic seismic profile (Botter et al., 2014; Iacopini et al., 2016), to which we artificially added statistical noise to perturb the reflections resulting from the Vp velocity contrasts. The reflectors built in the model were dislocated by a set of simulated high-angle faults (70° dip angle), including a master fault on the left side and two progressively closer secondary splays (at a distance of ∼400 and 800 m); the three displaced reflectors showed a few hundred meters of vertical offset, which increased with depth and decreased across the splays (Figure 4). The synthetic profile was obtained through forward modeling of the seismic wavefield using finite-difference time-domain (FDTD) numerical simulations, with two main goals: 1) to verify the capacity to image and resolve subtle tectonic structures using a dominant frequency wavelet of 11 Hz, comparable to that of CROP-04, which is lower than that of wavelets typically observed in vintage commercial seismic lines (Ercoli et al., 2020); and 2) to test the efficiency of the proposed workflow on this synthetic image. The aim was to reveal subtle seismic features in order to improve data interpretability through attribute analysis of pre-conditioned data (i.e., with noise removed). The model in Figure 4 was designed using the modeling package of the Reflex-Win software tool (v. 9.1.3; Sandmaier, 2022). A model was designed based on a multilayer sequence, with thicknesses increasing with depth. The assigned media properties (Vp) generated impedance contrast, which also increased with depth (Figure 4A). The simulation was executed using a finite-difference acoustic-wave propagator and the exploding reflector source approximation. The main fault was designed to be sub-vertical (e.g., 70° dip angle), inspired by preliminary interpretations of the CROP-04 profile (e.g., Brozzetti, 2011). Similarly, Vp reference value ranges and parameters (Table 2) were derived from the literature and from borehole stratigraphic information across the area (e.g., Improta et al., 2000; Adigun and Ayolabi, 2013). The synthetic profile obtained, illustrated in Figure 4B, showed criss-crossing diffraction patterns across the faults and several displaced events of variable amplitude. The synthetic profile was migrated using a 2D diffraction (post-stack) algorithm based on the input 2D velocity model. The migration operator collapsed the hyperbolic diffractions and restored a reliable geometry of the events (Figure 4C). The synthetic stack profile was migrated and overlaid over the depth-to-time conversion of the velocity model (Figure 4D). Subsequently, 10% high-frequency noise was added to the data. This noise was characterized by an exponential distribution and by a dominant frequency centered at 30 Hz (Figure 4E). The image illustrates the fact that imaging of the faulted zones was hampered by the random noise, particularly in the case of the shallower section characterized by smaller fault throws.

FIGURE 4. Seismic modeling of a set of normal faults: (A) multi-layer acoustic model (Vp velocity values reported on the right side) reproducing displacements by three simulated faults (master fault on the left side); (B) synthetic image generated using exploding reflector approximation, with clear diffraction patterns across the simulated faults and displaced reflections; (C) migrated line (2D diffraction stack) using the velocity model in (A); (D) migrated line of (B) with overlying red picks in TWT derived by velocity conversion of the model; (E) migrated line in (C) with the addition of 10% high-frequency noise (with a dominant frequency of 30 Hz and exponential distribution).
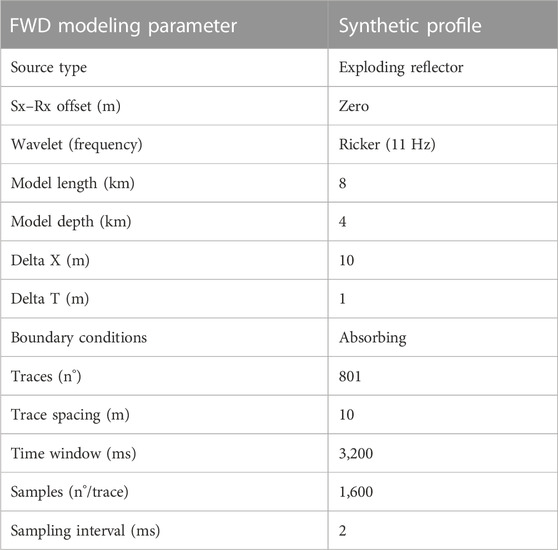
TABLE 2. Parameters for synthetic data generation using a multilayer model to simulate a normal fault set.
3.4 Seismic attribute analysis workflow
The synthetic profile was exported to the SEGY format and imported into the OpendTect software package, with the aim of setting up and testing the proposed workflow based on data pre-conditioning and seismic attribute analysis. After working on the seismic lines using a combination of a dip-steered median filter and a convolve low-pass filter (CLP) to clean up most of the random noise, several attributes were tested on the synthetic profile and on the experimental CROP-04 profile. Attributes ranging from instantaneous ones, like the cosine of instantaneous phase (Taner et al., 1979), up to multi-trace attributes (e.g., similarity), were applied over CROP-04 and displayed using multi-attribute co-rendering (Chopra and Marfurt, 2005; 2011). Among the attributes tested, we selected those that were most effective in enhancing the lateral discontinuities, namely the following.
1) Cosine of instantaneous phase (CIP). This is a frequency-based instantaneous attribute, representing the sample-by-sample instantaneous variation in phase (derivative of the instantaneous amplitude or “envelope”), determined from complex traces (the imaginary part of the complex trace is computed by Hilbert transform; Taner et al., 1979). This is an amplitude-independent algorithm that emphasizes the spatial continuity or discontinuity of reflections. It is continually smoothed, and therefore, it is not plagued by the 180° discontinuity characterizing the instantaneous phase. Another benefit is that amplitude peaks and troughs maintain the same position, but both strong and weak events are displayed at equal strength, thus enhancing thin events and subtle seismic fabrics (which can, for example, correspond to subtle faults) (Forte et al., 2012; Ercoli et al., 2015).
2) Energy (EN). This is an amplitude-based attribute, corresponding to the ratio between the squared sum of the amplitude (sample) values in a selected time window and the number of samples in the gate. A time-windowed measurement of reflectivity is provided, so that the higher the energy is, the higher the amplitude of reflection. EN is always positive (polarity-independent), avoiding the zero-crossing problem of seismic amplitude (Forte et al., 2012; Ercoli et al., 2015). This attribute is very effective to emphasize the most reflective zones (e.g., those with high-impedance properties) and to enhance lateral signal discontinuities attributable to fractures and faults (Ercoli et al., 2020 and references therein). We used a time window of 10 ms, as this produced the optimal display of main events while enhancing lateral discontinuities at the same time.
3) Pseudo-relief (PR). This is obtained by first computing the energy in a short time window and then applying a phase rotation of −90° (via Hilbert transform). This attribute generates an “outcrop-like” image, which is typically appreciated by interpreters for easy detection of both faults and horizons (Bulhões, 1999; Bulhões and de Amorin, 2005; Vernengo et al., 2015; 2017; De Lima et al., 2018; Barnes, 2016; Ercoli et al., 2020). We used a time window of 10 ms as an input parameter to improve both the main and the thinner reflections. This process considerably enhanced the visualization of normal fault sets, as well as the overall reflection patterns and bedding trends, and indirectly improved the mapping of low-dipping structural features (e.g., regional thrust faults).
4) Similarity (SM). This is a multi-trace attribute that characterizes trace-to-trace similarity (de Rooij and Tingdahl, 2002; Tingdahl and de Rooij, 2005; Brouwer and Huck, 2011). It represents a form of “coherence,” returning the degree of similarity between two or more trace segments. If the value is close to 1, the traces are nearly identical, close to 0 they are totally dis-similar. For values between 0 and 1, the lower the value, the more different are the trace segments compared (in terms of waveforms and amplitudes; dGB Earth Sciences, 2021). In this study, we computed similarity for CROP-04 by exploiting a combination of parameters and finally selecting the background-steered output computed using a time window of −28 +28 ms.
The pre-conditioning procedure on the synthetic profile is based on a first generation of a dip profile and on the application of a median filter (MF). Then, a DSMF was applied on the noisy synthetic line to obtain an improved steered profile (SP) with a reduced amount of random noise. This output was again filtered using a CLP by further smoothing the random noise (filtered steered profile, FSP). We have finally computed the selected attributes (CIP, EN, PR, SM, and workflow summarized in Figure 5, whose parametrization can be found in Table 3), using both the unfiltered and pre-conditioned data for comparison (Figure 6).
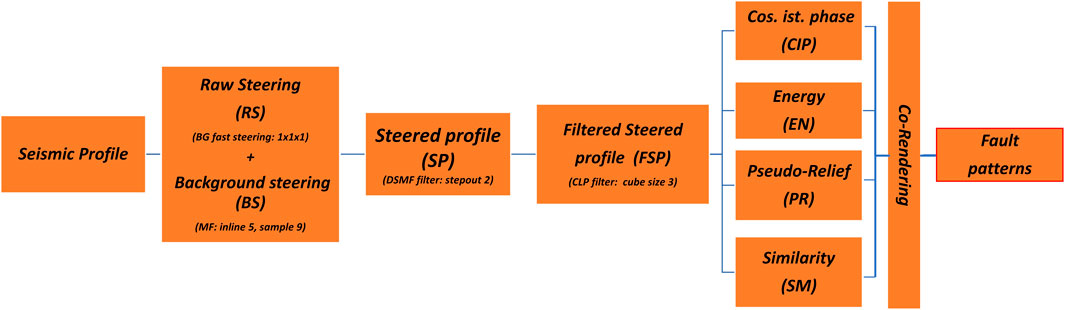
FIGURE 5. Full processing workflow scheme used to improve the quality of the synthetic data. This workflow was also applied to the deep reflection seismic line CROP-04, including data pre-conditioning and attribute analysis for fault detection.
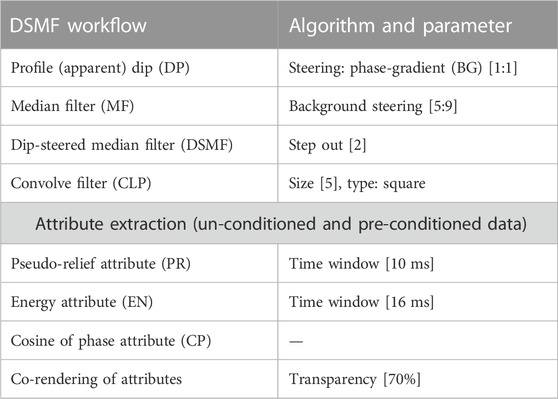
TABLE 3. Workflow applied to the synthetic profile, including a pre-conditioning strategy to attenuate random noise and analysis of selected seismic attributes.
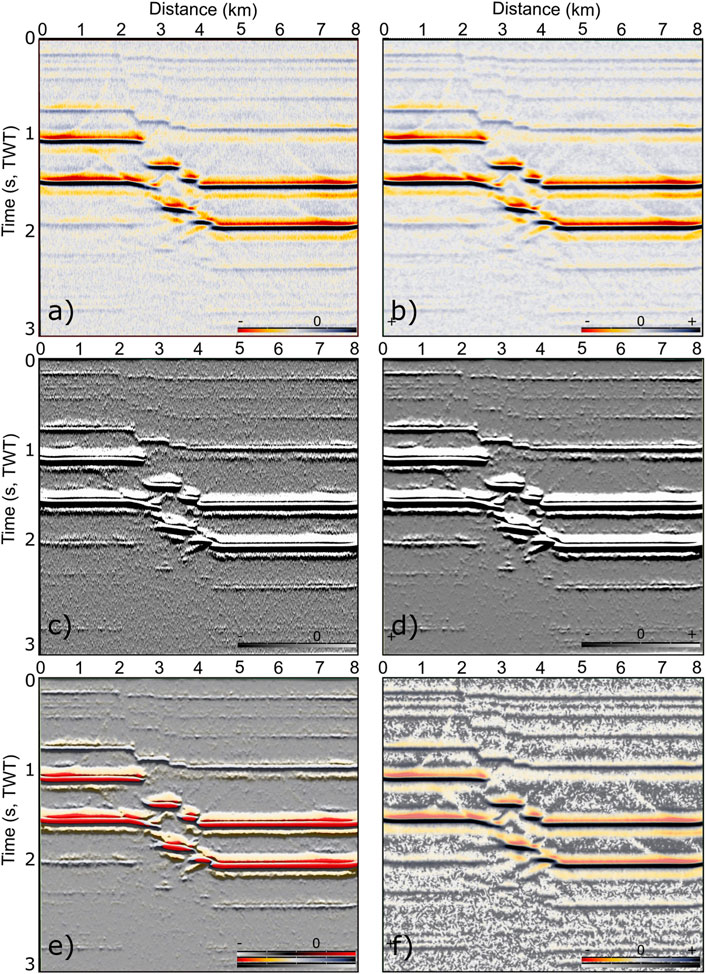
FIGURE 6. Testing of the pre-conditioning workflow and selected seismic attributes on the synthetic profile. (A) Noisy profile of Figure 4E in the seismic color scale. (B) Profile filtered after pre-conditioning, reducing the amount of random noise. (C) Pseudo-relief (PR) attribute computed on the profile of (A), with artifacts clearly visible, hampering the detection of minor faults within 1 s (TWT). (D) Pre-conditioned PR attribute computed on the profile of (B): imaged enhancement of the minor faults. (E) Energy attribute (red color palette) overlaid on both pre-conditioned synthetic profile (B) and PR attributes (70% transparency), enhancing the simulated tectonic discontinuities. (F) Pre-conditioned cos-phase attribute with (B) in transparency (70%), also effective in enhancing subtle/faint seismic fabrics generated by the fault structures.
A similar workflow based on a DSMF and a series of post-stack attributes was customized and applied, after an extensive phase of parametrization, to the vintage deep seismic profile CROP-04 (Figure 7, parameters in Table 3).
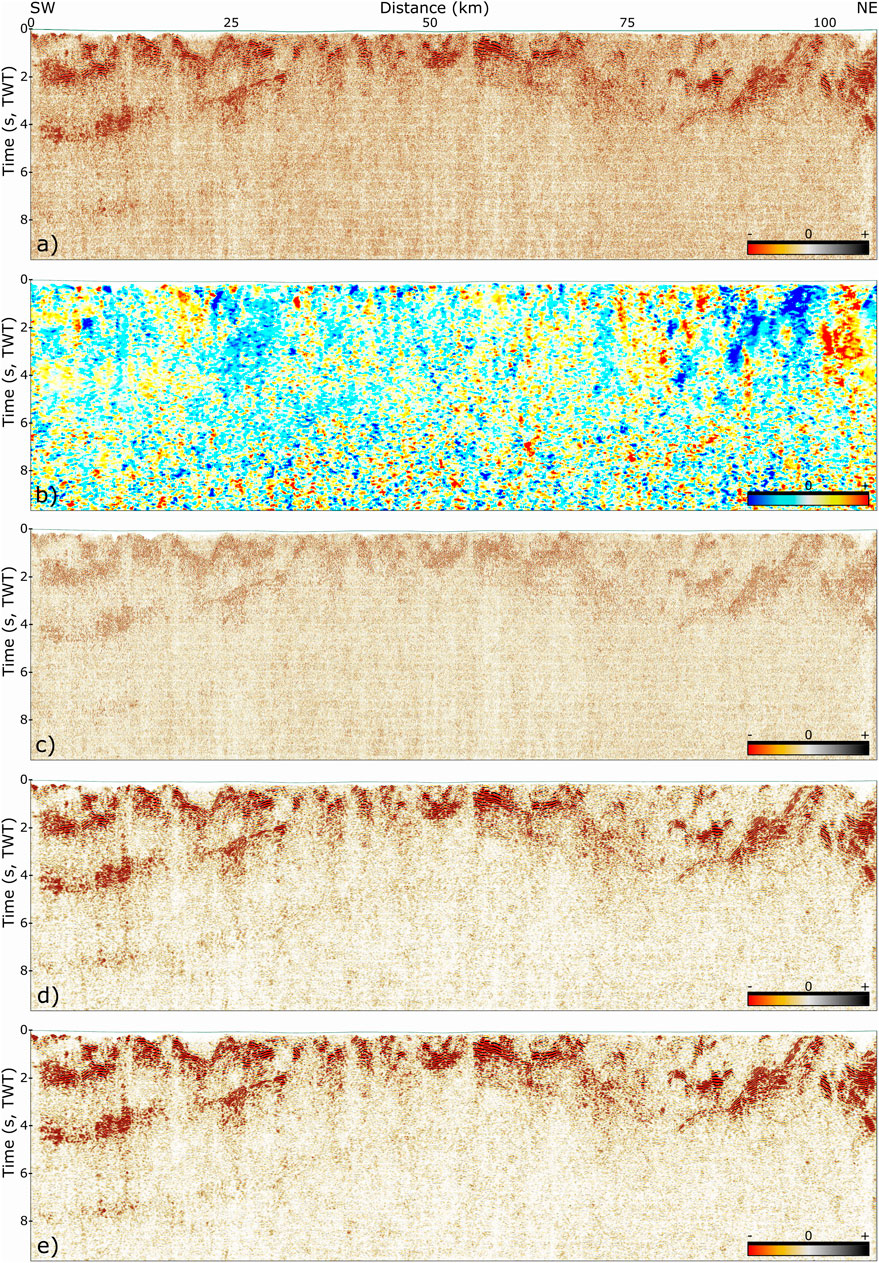
FIGURE 7. Workflow applied to the CROP-04 profile. (A) Original data, strongly contaminated by random noise, which hampers detailed visualization of both reflections and discontinuities. (B) Median filtered DP profiles computed via dip-steering phase-gradient (BG) algorithm. (C) Noise removed after the application of a dip-steered median filter (DSMF) using profile in (B) as input. (D) The result of the application of DSMF, removing the random noise shown in (C). (E) Convolve filter applied on (D) with application of additional smoothing of the random noise, thus improving the display of reflections and discontinuities.
The pre-conditioning data treatment included a structural filter operated via a DSMF and a BG algorithm [1:1], used compute a raw-steering (RS) profile, filtered using an MF [5:9] to obtain a background-steering output (BS). The DSMF noise-reduced profile obtained was then used as the input data, following application of an additional CLP filter, for computation of the same seismic attributes as performed for the synthetic line, using a co-rendered display. A pure methodological comparison between the two results (based on conditioned and un-preconditioned outputs) is presented in Figure 8.
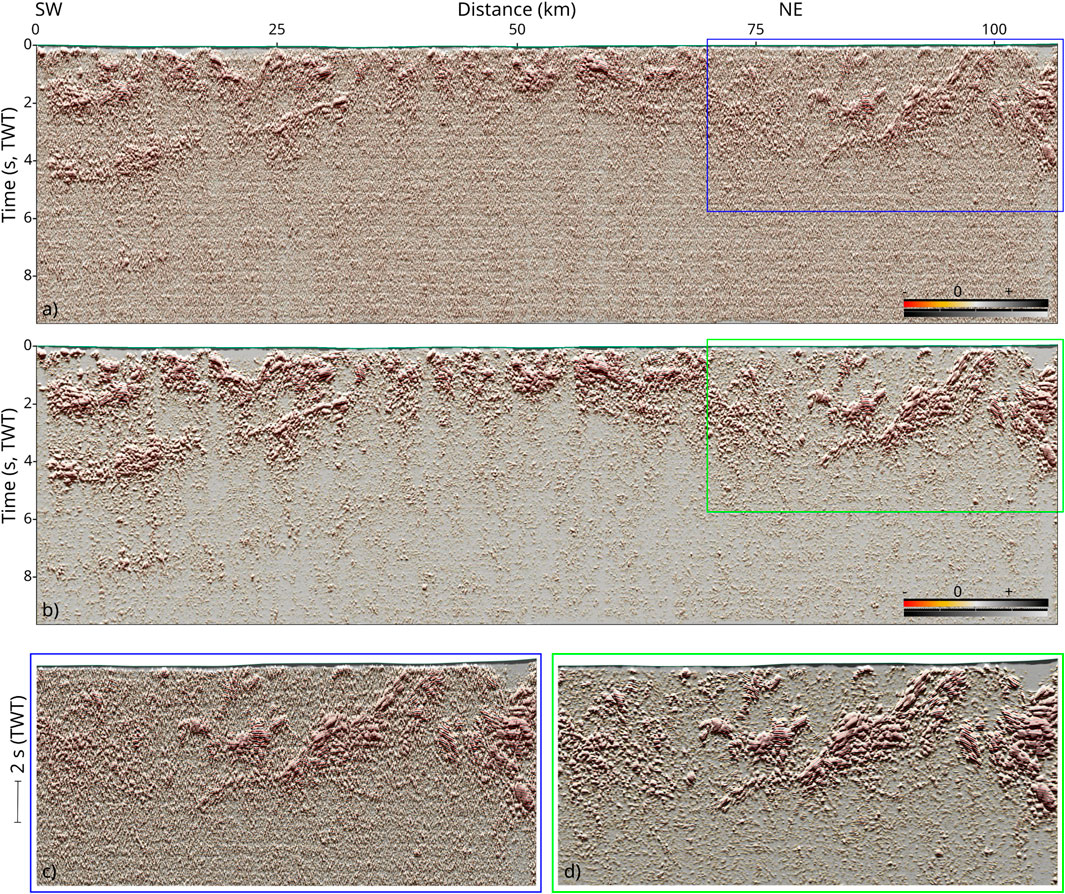
FIGURE 8. Original vs. pre-conditioned outputs computed over the entire CROP-04 profile. (A) PR attribute (co-rendered with the original amplitude profile, 70% transparency) obtained without any pre-conditioning. (B) The same output, but obtained over the pre-conditioned profile, showing significant improvement of its interpretability. (C) Blue box in (A), magnifying the easternmost area of the profile, with clear artifacts to an extent hampering the visualization of structures. (D) Green box in (B), showing detail of the improved continuity (and discontinuity) of reflections, with a significant amount of information recovered in comparison to the original profile in (C).
This procedure was customized to maximize the structural information derivable from the data through advanced seismic interpretation, which benefited from enhanced display of the subtle fabric pattern. These fabrics can be attributed to subtle faults. The results are discussed in detail in the next section.
4 Results
The proposed workflow described in the previous section produced various outputs, which were carefully compared, and the results are discussed in the following sections.
4.1 Synthetic data
The synthetic profile (Figure 4E) was imported into the OpendTect software package (displayed on a color scale as illustrated in Figure 6A), along with the DSMF and the CLF shown in Figure 6B, as inputs for computation of the PR attribute (Figures 6C, D). The result illustrates the benefits provided by the pre-conditioned profile, which produced a higher-quality image with a reduced number of artifacts. The pre-conditioned PR attribute also showed better resolution and an overall improved display of the thin, weak reflections located at shallow depth. This workflow effectively reduced random noise and improved the performance of seismic attribute computation to reveal main (deeper) and weak/subtle (shallower) lateral discontinuities, interpreted as faults. Figure 6C clearly shows the random noise present in the shallow sector hampering the detection of subtle fabrics/discontinuities/faults, while in Figure 6D, the profile is cleaner, meaning that the vertical displacements across the first three layers can be better interpreted in comparison to the unfiltered PR result.
The same operations were repeated for computation of the EN and CIP attributes, for which we report only the pre-conditioned results in Figure 6E (red “Energy” palette, co-rendered in transparency with the images in Figures 6B, D) and Figure 6F, respectively.
The EN envelope (Figure 6E) is useful to highlight the main (deeper) reflective contrasts as higher amplitude reflections, although it does not enhance the minor contrasts located at shallow depth. However, the attribute aids the visualization and detection of the main lateral amplitude discontinuities originating from the simulated faults. This output is particularly effective when co-rendered together with the PR attribute in the background (optionally, the conditioned seismic line FSP can be overlapped in slight transparency, as shown in Figure 6E). Finally, the CIP also enhances the detection of faults in comparison to the source data shown in Figure 6B.
4.2 Seismic profile CROP-04 NVR
The customized workflow applied to the CROP-04 NVR profile is reported and illustrated in extensive detail in Figures 7, 8, 9, and 10. The pre-conditioning steps produced several outputs, illustrated in Figure 7. Starting from the original, noisy CROP-04 profile (Figure 7A), we computed the median filtered profile, shown in Figure 7B, which was then used as input for the DSMF. This filtering operation removed a consistent amount of random noise, illustrated in Figure 7C (“net” profile). Following this process, the steered profile (SP) presented in Figure 7D clearly shows the benefits obtained after application of the DSMF, which reduced the noise and improved the lateral continuity of the events that could be associated with geologic structures. Figure 7E represents our final output (FSP) after an additional application of the convolve LP filter, which further smoothed the random noise, significantly improving the S/N ratio of the profile. Following this phase, we computed the above-described seismic attributes, over both the original CROP-04 profile and the novel noise-reduced version, as shown in Figure 8. Here, we report only one example for comparison (analogous to the synthetic data comparison of Figures 6C, D), showing the results obtained by computing the PR attribute over the entire seismic line (co-rendered with the FSP of Figure 7E). Figure 8A shows the unconditioned result, in which the visualization of the continuity of the reflections is greatly reduced by numerous random noise-generated artifacts, which particularly hamper the extraction of the signal (structural information). A pure methodological comparison with the cleaner profile of Figure 8B shows that the latter offers a much clearer display of the regional events along the CROP-04, and a significantly larger number of details can be locally extracted. An example is displayed in the magnified area on the easternmost side of the seismic line (without introducing, in this work, any geological considerations relating to the area), delimited by the blue and green boxes of Figures 8C, D (representing the unconditioned and pre-conditioned versions, respectively), where the difference between the two images is apparent.
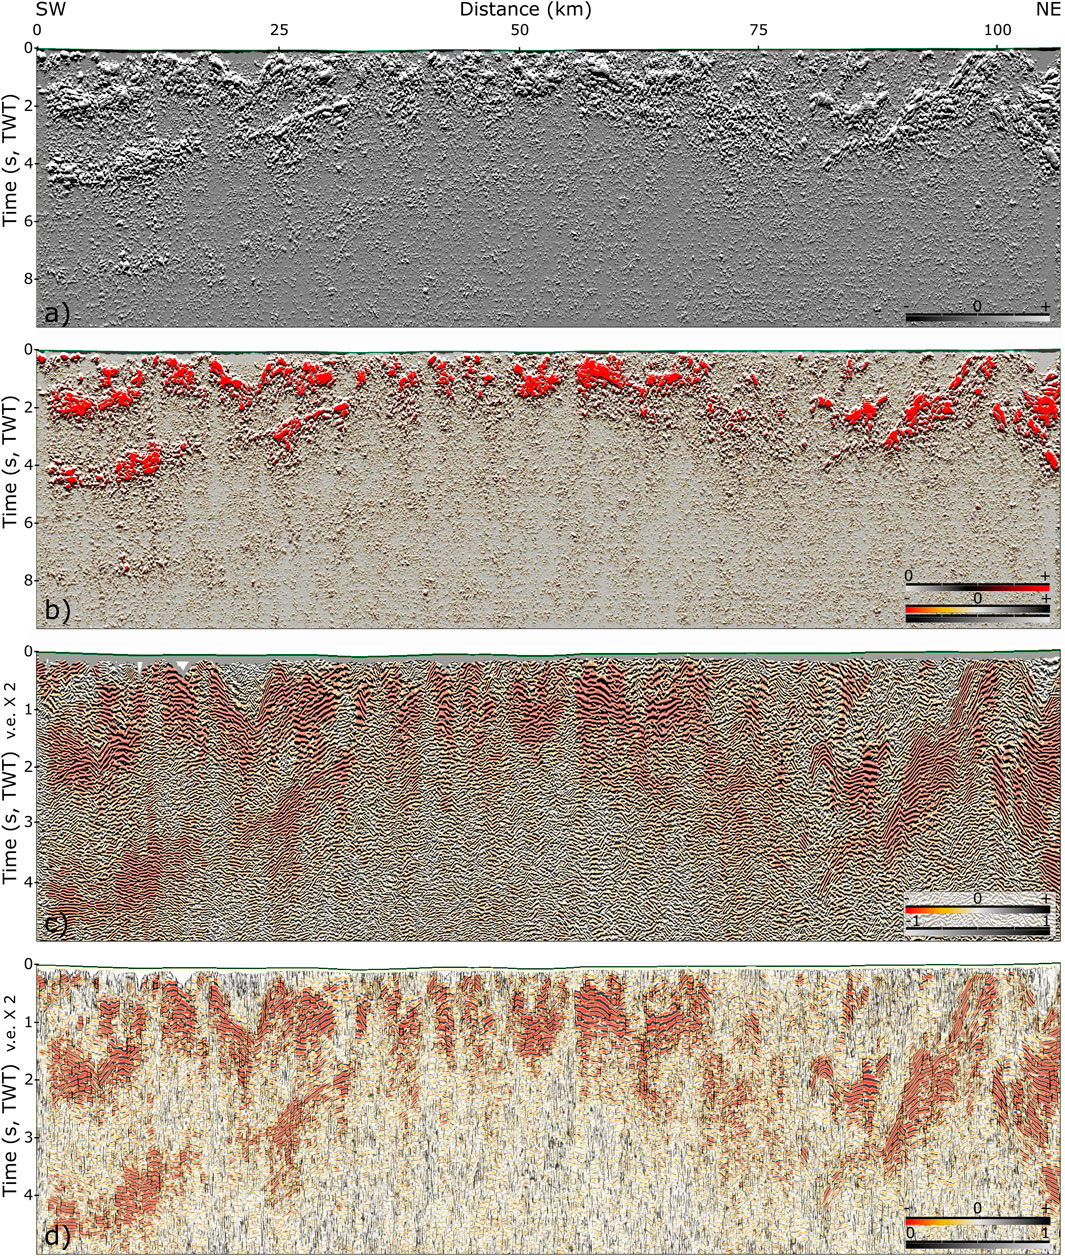
FIGURE 9. Seismic attribute analysis applied to the CROP-04 profile. (A) PR attributes providing an “outcrop-like” profile, enhancing the discontinuities and aiding structural interpretation. (B) EN attribute (red palette) overlaid on the PR attribute of (A), with conditioned line of Figure 7E in transparency (70%), identifying the most reflective sectors and indirectly enhancing the discontinuities. (C) CP attribute overlaid on Figure 7E in transparency (70%); this is fundamental for structural interpretation, as it strongly enhances the lateral discontinuity of reflected signals (image shown up to 5 s, vertical exaggeration ×2). (D) SL attribute co-rendered with Figure 7E, which despite still suffering from residual noise contamination, provides an alternative display of the main discontinuities, supporting the interpretation of the fault patterns (vertical exaggeration ×2).
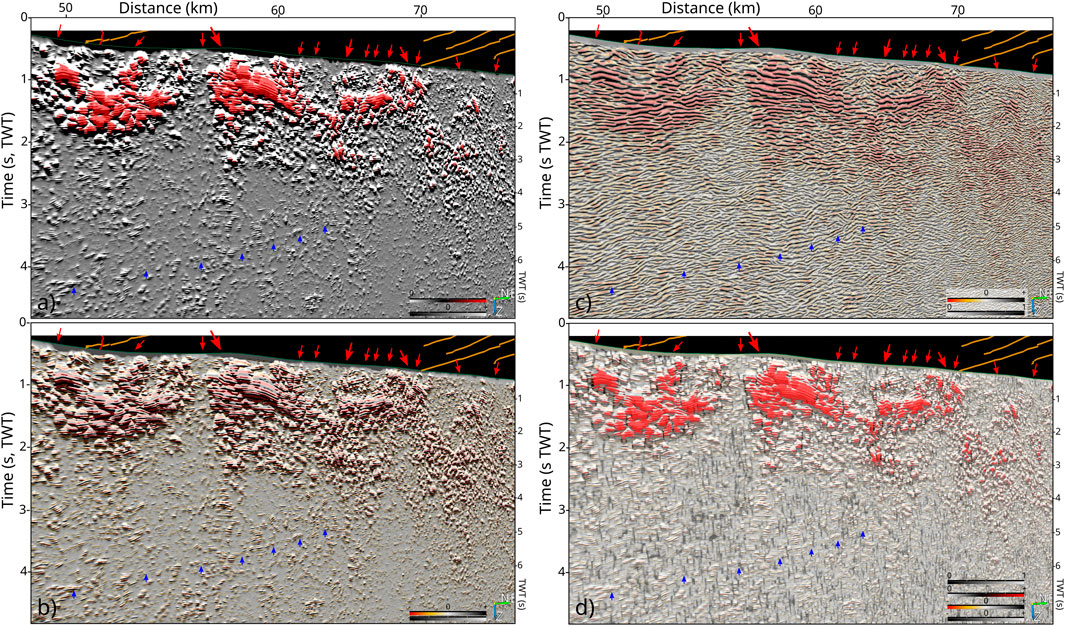
FIGURE 10. Pseudo-3D visualization of the central CROP-04 area selected for seismic interpretation across the study area, with lines on the top representing the surface-mapped fault by Bello et al. (2021). (A) PR attribute in grayscale, displayed with EN in transparency, with red and blue arrows suggesting, respectively, some synthetic (W-dip) and antithetic (E-dip), steep, structural lineaments extending in depth; and low-angle W-dipping regional features arising eastward. (B) The same display, but with the conditioned line on a color scale, enhancing these features. (C) CF attribute focused on the same area. (D) SI attribute, drawing the main faults in agreement with lateral discontinuities enhanced by the EN attribute (red color palette).
In Figure 9, from top to bottom, the computed seismic attributes represent consistent improvement in the visualization of the continuity of the reflection and, at the same time, visualization of the discontinuity patterns. The PR attribute is shown in grayscale in Figure 9A. The co-rendered display in Figure 9B consists of PR (again in transparency with the FSP of Figure 7E) plus the EN attribute, which effectively enhances the main reflective areas and, at the same time, the lateral signal discontinuities. The attribute analysis also encompassed other two outputs, namely, the cosine phase (CP, in grayscale) and the similarity (SI) attributes presented in Figures 9C, D (again, both with the FSP of Figure 7E in transparency). These attributes represent another two alternative outputs supporting advanced seismic interpretation of the network of fractures by strongly enhancing the lateral discontinuities.
A sector of CROP-04, on which we focus our structural interpretation and discussion, is magnified in Figure 10 to show the considerable improvements obtained through the combination of pre-conditioning filters with seismic attributes. Figures 10A, B show the PR + EN attributes and the PR + FSP of Figure 7E, respectively. Figures 10C, D show the CP + FSP and the PR + FSP + SL + EN attributes, respectively. All these images strongly enhance the visualization and continuity of shallow and deeper reflections, such as W-dipping regional events (indicated by blue arrows) as well as the identification of several major and minor discontinuities disrupting them (indicated by red arrows from the surface). An interpretation of these geophysical features is presented in the following section, in light of the regional tectonic framework of the study area, with a focus on the extensional structures.
4.3 Structural interpretation
In order to illustrate the benefits of the proposed processing flow, an interpretation is presented here of the central sector of the CROP-04 transect within the distance range ∼34–76 km (corresponding to ∼ CDPs 620 - 2620, Figure 1B), for a total length of ∼42 km. This region is characterized by the presence of numerous major normal faults, which are critical in assessing the seismogenesis of the area (Brozzetti, 2011; Ascione et al., 2020 and references therein; Bello et al., 2021). The improved quality of the “revived” CROP-04 elucidates several major stratigraphic and structural features, as shown in Figure 11, which can be summarized as follows: 1) several high-amplitude reflection packages down to a depth of ∼3 s (TWT, Figure 11A), whose lateral continuity is interrupted by a series of small-scale sub-vertical discontinuities interpreted as minor sub-vertical faults (Figure 11B); 2) these bright reflection packages are separated by relatively “transparent” areas, characterized by low-amplitude reflectivity and localized, in particular, where the most relevant normal faults have been recently mapped at the surface with high accuracy (following Bello et al., 2021; indicated with black arrows in Figure 11B); and 3) several continuous or semi-continuous low-angle reflections represent subparallel SW-dipping discontinuities at different depths, among which the basal one is strongly enhanced (laterally continuous up to 10 km eastward of the outcropping Monticello fault, at ∼2 s TWT; Figure 10). Such features, despite not being the focus of this work, may represent, respectively, shallow local thrusts and a deeper regional thrust, the latter rising up to ∼22 km in Figure 11 (corresponding to CDP 1405 in Patacca and Scandone, 2007).
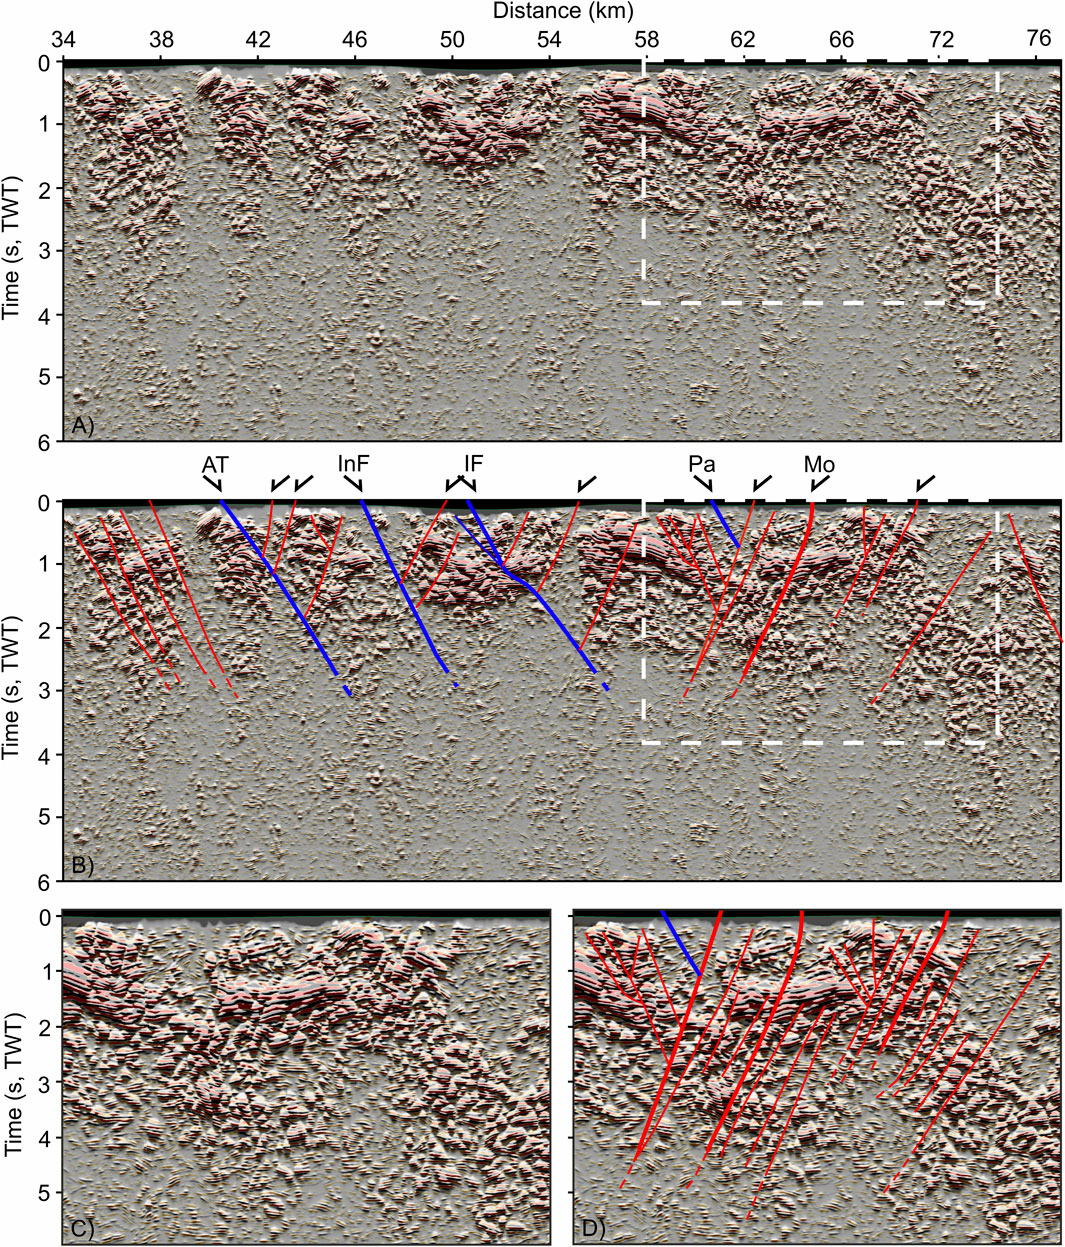
FIGURE 11. Sector of the CROP-04 profile covering the studied area. (A) Detail from results obtained after the customized workflow, including pre-conditioning filters and seismic attributes, increasing the interpretability of the seismic line. (B) Interpretation superimposed on (A), reporting sets of normal (synthetic and antithetic) faults in the shallower sector, matching the surface structures mapped in the field, but suggesting a considerable degree of structural complexity due to several secondary splays and densely fractured areas. (C) Magnification [white-dashed box in (A)] of the CROP-04 sector on the east side of the Irpinia fault (IF), showing the dense network of west- and east-dipping discontinuities. (D) Multiscale accurate interpretation of image (B) with steep discontinuities overlaying the magnified image (C), representing main and secondary normal tectonic structures and characterizing the area surrounding the Monte Paratiello (Pa) and Monticello (Mo) faults.
In the following material, the main geophysical features along the profile are described, starting from its western side (profile distance: ∼34 km) and moving toward its eastern end (profile distance: 76 km). In Figure 11, a package of high-amplitude reflections (between ∼34–40 km) are characterized by a general dip toward the SW and are clearly segmented by a series of NE-dipping minor faults/fractures that reach down to ∼3 s (∼9 km using an apparent Vav = 5 km/s). Further to the east, a series of high-amplitude reflections appear to be dislocated by a main NE-dipping structure (marked as AT, at surface) and faint antithetic events interpreted as fractures/faults (between ∼40–46 km). To the NE, the package of reflections is again interrupted by a NE-dipping feature, corresponding to the Inner Irpinia Fault (InF, at surface; Bello et al., 2021). Moving to the east, another area characterized by prominent, laterally discontinuous events and underlying semi-transparent units (corresponding to the Lagonegro basinal deposits and Apulia shallow water carbonates, respectively; Patacca and Scandone, 2007) is visible up to ∼72 km; this appears to be displaced by synthetic and antithetic normal faults (thick red and blue thick in Figure 11B), as well as by a series of subtle minor structures. At ∼51 km, the Irpinia Fault (IF) mapped at the surface (Improta et al, 2003a; b; Brozzetti, 2011; Ascione et al., 2020; Bello et al., 2021, 2022 and all references therein) has been traced to depth, together with parallel structures (e.g., the Paratiello fault - Pa) and some antithetic faults (e.g., the Monticello fault - Mo, Bello et al., 2021), and faint fault splays are particularly readily visible in the easternmost sector of the line (∼60 - 72 km, magnifications of Figures 11C, D). Here, a package of upward convex (antiform-shaped), very bright high-amplitude reflections with opposite dip (∼1 s TWT, Figure 11B) are densely disrupted by several faults, up to the shallower and transparent seismic facies, representing intra-mountain basins characterized by Quaternary fills. In this case, the application of pre-conditioning and attribute analysis was an asset in better visualizing the dense network of subtle, small-scale faults not visible in the original seismic profile. These tectonic structures clearly disrupt the very high-amplitude reflections, although the latter possibly tend to “saturate” the smaller offset associated with the minor faults. Such steep alignments dissect the reflections down to 3 s and are very closely spaced. The average distance between the minor faults is ∼600 m, which is a shorter distance than in the remainder of the profile. The area intersected by this dense network of minor faults extends to almost 8 km in width.
Below ∼3 s (TWT), the seismic image shows low-amplitude reflectivity fabric with limited lateral continuity. However, from ∼2.8 s to 5.5 s (TWT), in the westernmost side of the seismic profile, we identified a narrow package of gently SW-dipping sub-parallel events. The latter are characterized by the extent of their lateral continuity, with only a few main discontinuities, which seems to propagate to depth, and they are enhanced by its complex geometry, which is difficult to interpret. Multiple interpretations of this package of reflections (which, in the original profile (Figure 2), is visible mostly in the westernmost sector) can be found in the literature, such as a possible Moho discontinuity, a regional thrust, very deep deformed sedimentary layers incorporated into the thrust belt, near-bottom Apulian carbonates, and the top of the crystalline basement (Mazzotti et al., 2000; D’Argenio et al., 1973; Cippitelli, 2007; Patacca and Scandone, 2007; Scrocca et al., 2007; Scrocca, 2010).
5 Discussion
The proposed post-stack processing workflow considerably enhances the quality and interpretability of the seismic reflection normal incidence seismic profile, which is characterized by high levels of random noise, as in the case of the CROP-04 profile. Similar processing flows are applied to modern, higher-resolution commercial seismic reflection data reaching a maximum depth of 5–6 s (TWT). The research presented in this paper reveals an attempt to adapt a customized processing flow integrating pre-conditioning filters and seismic attributes for use with a deep seismic reflection profile imaging crustal-scale features. This is, to our knowledge, one of the first studies appearing in the literature that has aimed to revive legacy data by enhancing relatively shallow faults to support seismotectonic studies.
It should be considered that the acquisition, configuration, and parameters of the CROP-04 profile were focused on revealing deep regional-scale structures. For this reason, the resolution of this deep profile is intrinsically limited in comparison to that of conventional commercial seismic reflection profiles; in addition, the CROP-04 profile also suffers from several problems causing a low S/N ratio, as already highlighted in the literature (Mazzotti et al., 2000). Application of a second round of customized and more accurate processing, incorporating a priori geological information, improved the data quality, but it left a visible amount of random noise (Mazzotti et al., 2007a). Nevertheless, through the proposed workflow, we were able to make noticeable reductions to this noise, thereby further enhancing the reflective patterns and the embedded discontinuities, which were interpreted as faults. The proposed methodological approach produced clear images, providing new insight into the structural features along the entire CROP-04 profile (Figure 7), including the easternmost and westernmost sectors (Figure 8). This contribution focuses on interpretation and discussion only in relation to the central sector, this being the main subject of this study due to its relevance for the study of earthquakes. Thus, the more external sectors of this relatively long seismic profile (over 100 km) require additional detailed analysis, description, and discussion, as the transect crosses very different geological domains (Figure 8), which might be an objective for further research and collaborations.
Across the newly processed and analyzed central sector, it is now possible to identify very closely spaced sets of subtle normal faults, which were originally not visible at all or only partially detectable. The synthetic seismic profile illustrates the fact that the extent and geometry of the high-amplitude reflections resulting from high-impedance contrasts are well-enhanced by seismic attributes, and that the reduction of random noise improves the detection of the sub-vertical seismic signatures associated with discontinuities. However, it is notable that a small amount of smoothing of the edges of the events can be generated across the sharp lateral truncation of structures (i.e., the simulated faults), displacing high-amplitude reflection events. Thus, to avoid misinterpretation of the dip and kinematics of faults, it is necessary to evaluate and interpret the entire package of reflections and (possibly small) related displacements rather than looking at a single, local discontinuity.
Given these considerations, it is fundamentally important, in the case of relatively old or legacy normal incidence seismic profiles such as the CROP-04 profile, to integrate the enhanced reflections and fault patterns with other available information on the regional and local structural frameworks and with the fault tracks mapped across the study area; only this process can better enable the unraveling of complex structural sectors, such as the sector between the range of 24–36 km (Figure 11), which achieves only partial outcropping at the surface. Here, although the shallower part (∼0–2 s TWT) appears to be dominated by high-angle SW-dipping structures, in the deeper sector (between ∼ 2 and 4 s TWT), the fault patterns appear to be extremely complex, with a few visible NE-dipping discontinuities. This portion is characterized by many faint features interpreted as subtle faults, fragmenting the reflections within deep anticlines in a densely deformed pattern of discontinuities characterized by very small displacements (Figure 12).
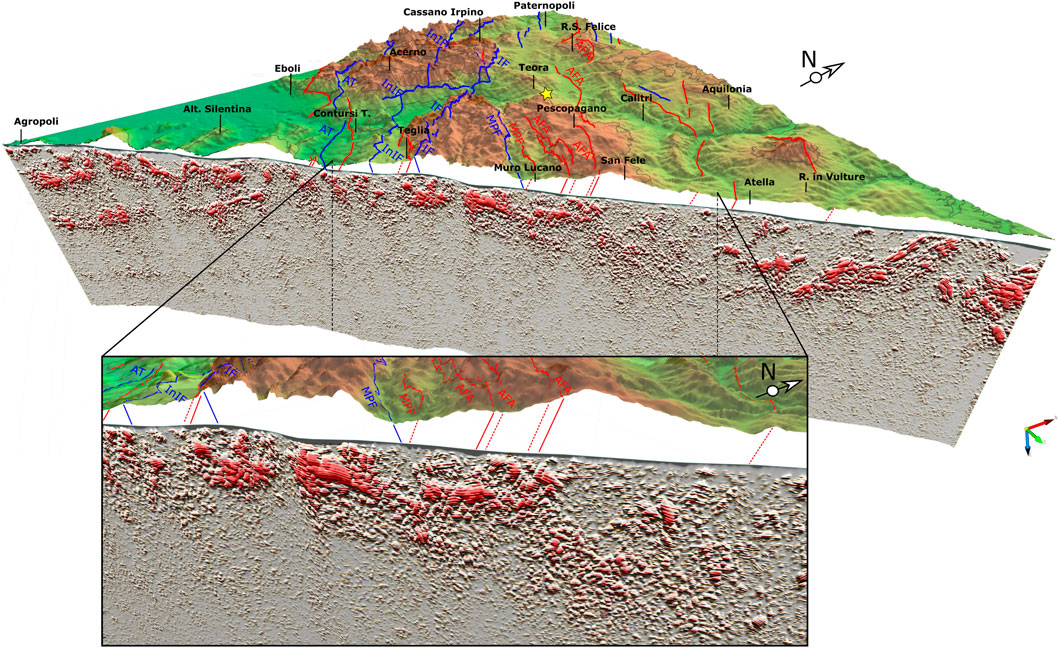
FIGURE 12. Tridimensional view encompassing surface and subsurface data. Digital elevation model (DEM, by Deng and Stauffer, 2006) plotted along a WNW–ESE view along the entire track of the CROP-04 profile; this includes the surface geometry of the normal faults recently mapped by Bello et al. (2021), (2022). The epicenter of the mainshock Mw 6.8 Irpinia earthquake (23/1/1980) is indicated by a yellow star. The fault tracks have been qualitatively linked to their subsurface signature, visible on the seismic line, which shows excellent general correspondence with the master faults. The visualization additionally shows the structural complexity of the area due to the presence of broadly faulted and fractured zones. These are characterized by subtle/faint sets of secondary faults revealed by the seismic attributes (pseudo-relief and energy co-rendered in transparency with the deep-steered seismic line), which were not clearly visible in the original data. The black box magnifies the central sector, where the master faults of the Irpinia area crop out with co-seismic faulting that is still visible at the surface after ∼40 years (Bello et al., 2021).
Despite the greater number of details enhanced by the proposed processing flow, the cross-cutting relationships between such subtle seismic faults are not always clear on examination at a detailed scale. Moreover, as suggested by the synthetic seismic modeling example, by zooming in and out to look at the enhanced reflective patterns and at the entire reflection package and/or all discontinuities, it can be observed that the NE-dipping alignments are the most predominant, particularly in the westernmost sector (Irpinia faults), while in the easternmost part, the SW-dipping faults (e.g., the Monticello area) become more relevant. The proposed interpretation of the main seismic discontinuities is in agreement with field observations of the structural context of the area, and it correlates well with the main normal faults mapped at the surface and with the landscape morphologically controlled by extensional tectonics. For this reason, at the same time, this form of interpretation may be driven or supported by surface geological data when structural complexity increases in the shallower sectors. In this case, the main seismic discontinuities, which are interpreted as master faults, are better imaged (i.e., InIF, IF, and MO); and the secondary and/or minor structures building up complex fracture zones arebetter imaged, after processing, up to very shallow levels. A series of closely spaced sub-vertical fractures, localized in an area of strong deformation, are located between and surrounding two main normal faults that outcrop at the surface, known as the Monte Paratiello (PA) and Monticello (MO). Following previous interpretations and well data on the studied area (Shiner et al., 2004; Patacca and Scandone, 2007), the higher number of closely spaced, minor fractures can be localized in this sector within the Lagonegro Units, which are composed of Middle Triassic–Lower Cretaceous basin deposits, such as marly limestones and clastic deposits. Toward the area of pervasive deformation, we observe a network of minor sub-vertical fractures. These are spaced about 600 m apart on average and locally dissect the possible low-angle thrust faults.
In conclusion, the analysis performed and described here can provide a more exhaustive structural framework, which is extremely important in terms of its seismotectonic implications and in accounting for the location of surface ruptures. Master faults are usually interpreted and modeled as single planes, but it is clear that deformation frequently occurs across wider damage zones characterized by complex geometry and architecture that need to be taken into account. The processing flow proposed in this article is critical in providing an improved understanding of the structural framework of an active seismogenic area. This approach aids better reconstruction of the fault geometry down to a seismogenic depth, as well as the segmentation and spatial distribution of faults, which are spread across sets of minor and subtle or faint structures that are rarely visible in the original low S/N seismic data and are complex to decipher at the surface. The proposed interpretation focuses mainly on tectonic structures, which are the most debated features across the study area (see the tridimensional views and a movie within the Supplementary Material). It should be noted that our workflow is particularly effective in improving the shallow portion of the deep reflection line CROP-04 NVR, while for the deeper portion, a full reprocessing with up-to-date pre-stack processing tools can be further carried out to achieve even more benefits. However, as the normal faults are better displayed nowadays, overall, we believe that most of the structural features and models previously reported by other authors (e.g., Scrocca et al., 2007; Brozzetti, 2011; Bello et al., 2021) might be considerably refined using our results and images along the entire transect.
6 Conclusion
The research carried out here represents an innovative application of a customized processing flow encompassing pre-conditioning filters and attribute analysis, which are commonly used by the hydrocarbon exploration industry. This workflow was applied to a legacy deep seismic reflection line across the Southern Apennines, aiming to help with seismotectonic assessment. Despite the low data quality of the CROP-04 deep normal incidence seismic reflection image, mainly due to high levels of random noise, the post-stack processing flow considerably improved the stacked image, enhancing the shallow and deep reflections all along the seismic line. The improved resolution of the seismic images reveals the existence of a dense network of subtle faults that are faint or even indistinguishable in the original stack. We highlight the excellent correlation between the main tectonic structures mapped at the surface and their specific and complex seismic signatures as enhanced by the pre-conditioned attribute analysis. Seismic attributes represent a cheaper technique in comparison to a full data reprocessing sequence; however, the evaluation and parameterization of seismic attributes are strongly data-dependent, requiring accurate customization to avoid generation of artifacts. Furthermore, a pre-conditioned attribute analysis represents an efficient aid for interpreters, enabling them to shed new light on the deep continuation of tectonic structures of regional and local seismogenic importance in high-hazard regions. To our knowledge, the current contribution is the first attempt to experiment on deep, legacy seismic data, with the aim of supporting earthquake studies; the results of this work encourage the application of our proposed workflow and of advanced pre-conditioned seismic attributes [e.g., thinned fault likelihood (Hale, 2013) and/or machine learning tools (Yu and Ma, 2021)] in other geological contexts and areas worldwide. Legacy data are in fact unique, may no longer be easy to collect, and nor are they repeatable in such regional configurations. This type of workflow enables an affordable approach to re-evaluation/re-processing/re-assessment of vintage data, revealing high-resolution structural details of the subsurface in a manner that would not be achievable otherwise, but which is extremely important for seismotectonic studies. The workflow may favor better seismic interpretation and integration with the available surface and seismological data, and the results can be also used to drive and support the field activities of geologists devoted to detecting long- and short-term field evidence of faulting at the surface. In addition, beyond our specific objective focused on seismogenic faults, our work aims to promote the use of seismic tools borrowed from the energy industry in many other geoscience applications, encompassing different scales and study goals.
Data availability statement
The dataset analyzed for this study is available in original version (paper scan of the stack seismic profile) in the Italian VIDEPI database, at this link: https://www.videpi.com/deposito/videpi/crop/F_54_CROP_04.pdf (last access, 2022, December 2). The digital (SEG-Y) data processed in this work are publicly available at the CROP DATABASE - ISMAR (Bologna Department), and can be requested at this website: http://www.crop.cnr.it/ (last access, 2022, December 2). The original contributions presented in the study are included in the supplementary material as additional high-resolution images and a video of the elaborated CROP-04 profile, and further inquiries can be directed to the corresponding authors.
Author contributions
ME and FC contributed to conception and design of the study. ME performed the data pre-conditioning, attribute analysis, and modeling. RC revised the methodology and workflow employed. ME and FC wrote the first draft of the manuscript. AA and FC wrote the geological framework section of the manuscript. ME, FC, AA and MB interpreted the data. MB, AA, and RC critically revised the text. ME and FC produced the maps, figures, and tables. FC, MB, AA, and RC contributed to discussion and to the language editing of the manuscript. All authors contributed to a complete manuscript revision, and read and approved the submitted version.
Funding
This research is part of the MUSE-4D project, financed by Ministero dell'università e della ricerca (MUR) in the framework of PRIN-2017 (Project #2017KT2MKE_003): National P.I.G. Lavecchia, U.R. Responsible Barchi.
Acknowledgments
The authors are very grateful to dgB Earth Sciences for providing an academic license for the OpendTect software package and plugins used in this work. We acknowledge Petroleum Experts for providing the MOVE 2019.1 suite software license. The authors are also very grateful to Dr. Simone Bello and Prof. Francesco Brozzetti for providing the surface fault pattern mapped along the seismic line analyzed in this work and for fruitful discussion.
Conflict of interest
The authors declare that the research was conducted in the absence of any commercial or financial relationships that could be construed as a potential conflict of interest.
Publisher’s note
All claims expressed in this article are solely those of the authors and do not necessarily represent those of their affiliated organizations, or those of the publisher, the editors, and the reviewers. Any product that may be evaluated in this article, or claim that may be made by its manufacturer, is not guaranteed or endorsed by the publisher.
Supplementary material
The Supplementary Material for this article can be found online at: https://www.frontiersin.org/articles/10.3389/feart.2023.1119554/full#supplementary-material
References
Acuña-Uribe, M., Pico-Forero, M., C., Goyes-Peñafiel, P., and Mateus, D. (2021). Enhanced ant tracking: Using a multispectral seismic attribute workflow to improve 3D fault detection. Lead. Edge 40 (7), 502–512. doi:10.1190/tle40070502.1
Adigun, A. O., and Ayolabi, E. A. (2013). The use of seismic attributes to enhance structural interpretation of Z-field, onshore Niger delta. J. Climatol. Weather Forecast. 1, 102. doi:10.5539/esr.v2n2p223
Al-Dossary, S., and Marfurt, K. J. (2006). 3D volumetric multi-spectral estimates of reflector curvature and rotation. Geophysics 17, 41–P51. doi:10.1190/1.2242449
AlBinHassan, N. M., Luo, Y., and Al-Faraj, M. N. (2006). 3D edge-preserving smoothing and applications. Geophysics 71 (4), P5–P11. doi:10.1190/1.2213050
Alcalde, J., Bond, C. E., Johnson, G., Kloppenburg, A., Ferrer, O., Bell, R., et al. (2019). Fault interpretation in seismic reflection data: An experiment analysing the impact of conceptual model anchoring and vertical exaggeration. Solid earth. 10, 1651–1662. doi:10.5194/se-10-1651-2019
Allen, C. R., St. Amand, P., Richter, C. F., and Nordquist, J. (1965). Relationship between seismicity and geologic structure in the southern California region. Bull. Seismol. Soc. Am. 55, 753–797. doi:10.1785/BSSA0550040753
Amato, A., and Montone, P. (1997). Present-day stress field and active tectonics in southern peninsular Italy. Geophys. J. Int. 130 (2), 519–534. doi:10.1111/j.1365-246x.1997.tb05666.x
Amoruso, A., Crescentini, L., Di Lieto, B., and Scarpa, R. (2011). Faulting mechanism of the Campania-Lucania 1980 earthquake, Italy, from high-resolution, 3D velocity structure, aftershock relocation, fault-plane solutions, and post-seismic deformation modeling. Ann. Geophys. 54, 806–821. doi:10.4401/ag-4984
Aqwari, A. A., and Boe, T. H. (2011). Improved fault segmentation using dip guided and modified 3D Sobel filter 81st Annual International Meeting. San Antonio, Texas: SEG, Expanded Abstracts, 999–1003. doi:10.1190/1.3628241
Aqwari, A. A., Weinzierl, W., Daber, R., and Boe, T. H. (2012). “Directional guided seismic attributes and their use in assisting structural, stratigraphic and lithological interpretation,” in Proceedings of the 82nd Annual International Meeting, SEG, Expanded Abstracts, Las Vegas, Nevada, 5 Oct 2012.
Ascione, A., Cinque, A., Improta, L., and Villani, F. (2003). Late quaternary faulting within the southern apennines seismic belt: New data from Mt. Marzano area (southern Italy). Quat. Int. 101– 102, 27–41. doi:10.1016/S1040-6182(02)00127-1
Ascione, A., Nardò, S., and Mazzoli, S. (2020). The ms 6.9, 1980 Irpinia earthquake from the basement to the surface: A review of tectonic geomorphology and geophysical constraints, and new data on postseismic deformation. Geosciences 10, 493. doi:10.3390/geosciences10120493
Ashraf, U., Zhang, H., Anees, A., Nasir Mangi, H., Ali, M., Ullah, Z., et al. (2020). Application of unconventional seismic attributes and unsupervised machine learning for the identification of fault and fracture network. Appl. Sci. 10, 3864. doi:10.3390/app10113864
Babangida, W. J., Tim, J. R., and Graham, K. W. (2013). Application of volumetric seismic discontinuity attribute for fault detection: Case study using deep-water Niger delta 3D seismic data. Lead. Edge 32, 424–428. doi:10.1190/tle32040424.1
Bahorich, M. S., and Farmer, S. L. (1995). 3-D seismic discontinuity for faults and stratigraphic features: The coherence cube. Lead. Edge 14, 1053–1058. doi:10.1190/1.1437077
Barchi, M. R., Carboni, F., Michele, M., Ercoli, M., Giorgetti, C., Porreca, M., et al. (2021). The influence of subsurface geology on the distribution of earthquakes during the 2016-2017 Central Italy seismic sequence. Tectonophysics 807, 228797. doi:10.1016/j.tecto.2021.228797
Barchi, M. R., Minelli, G., and Pialli, G. (1998). The CROP 03 profile: A synthesis of results on deep structures of the northern apennines. Mem. Soc. Geol. It. 52, 383–400.
Barchi, M. R., and Mirabella, F. (2008). The 1997-98 umbria marche earthquake sequence: “Geological” vs. “seismological” faults. Tectonophysics 476, 170–179. doi:10.1016/j.tecto.2008.09.013
Barnes, A., E. (2016). Handbook of poststack seismic attributes. Texas, United States: Society of Exploration Geophysicists.
Barnes, A. E. (1999). Attributes for automating seismic facies analysis. Seg. Tech. Program Expand. Abstr. 19. doi:10.1190/1.1816121
Barnes, A. E. (1996). Theory of 2-D complex seismic trace analysis. Geophysics 61, 264–272. doi:10.1190/1.1443947
Beidinger, A., Decker, K., and Roch, K. H. (2011). The Lassee segment of the Vienna Basin fault system as a potential source of the earthquake of Carnuntum in the fourth century AD. Int. J. Earth Sci. 100, 1315–1329. doi:10.1007/s00531-010-0546-x
Bello, S., de Nardis, R., Scarpa, R., Brozzetti, F., Cirillo, D., Ferrarini, F., et al. (2021). fault pattern and seismotectonic style of the Campania – lucania 1980 earthquake (Mw 6.9, southern Italy): New multidisciplinary constraints. Front. Earth Sci. 8. doi:10.3389/feart.2020.608063
Bello, S., Lavecchia, G., Andrenacci, C., Ercoli, M., Cirillo, D., Carboni, F., et al. (2022). Complex trans-ridge normal faults controlling large earthquakes. Sci. Rep. 12, 10676. doi:10.1038/s41598-022-14406-4
Bernard, P., and Zollo, A. (1989). The Irpinia (Italy) 1980 earthquake: Detailed analysis of a complex normal faulting. J. Geophys. Res. Solid Earth 94 (B2), 1631–1647. doi:10.1029/jb094ib02p01631
Bonardi, G., Amore, F. O., Ciampo, G., De Capoa, P., Miconnet, P., and Perrone, V. (1988). Il complesso Liguride Auct. Stato delle conoscenze e problemi aperti dulla sur evoluzione pre-Appenninica ed i suoli rapporti con l'Arco Calabro. Mem. della Soc. Geol. Ital. 41, 17–35.
Bonardi, G., Ciarcia, S., Di Nocera, S., Matano, F., Sgrosso, I., and Torre, M. (2009). Carta delle principali unità cinematiche dell’Appennino meridionale. Nota illustrativa. Boll. della Soc. Geol. Ital. 128 (1), 47–60.
Boncio, P., Brozzetti, F., and Lavecchia, G. (2000). Architecture and seismotectonics of a regional low-angle normal fault zone in central Italy. Tectonics 19, 1038–1055. doi:10.1029/2000TC900023
Bonini, L., Toscani, G., and Seno, S. (2014). Three-dimensional segmentation and different rupture behavior during the 2012 Emilia seismic sequence (Northern Italy). Tectonophysics 630, 33–42. doi:10.1016/j.tecto.2014.05.006
Botter, C., Cardozo, N., Hardy, S., Leconte, I., and Escalona, A. (2014). From mechanical modeling to seismic imaging of faults: A synthetic workflow to study the impact of faults on seismic. Mar. Pet. Geol. 57, 187–207. doi:10.1016/j.marpetgeo.2014.05.013
Brewer, J. A., Matthews, D. H., Warner, M. R., Hall, J., Smythe, D. K., and Whittington, R. J. (1983). BIRPS deep seismic reflection studies of the British Caledonides. Nature 305, 206–210. doi:10.1038/305206a0
Brouwer, F., and Huck, A. (2011),an integrated workflow to optimize discontinuity attributes for the imaging of faults.
Brozzetti, F. (2011). The campania-lucania extensional fault system, southern Italy: A suggestion for a uniform model of active extension in the Italian apennines. Tectonics 30, TC5009. doi:10.1029/2010TC002794
Bulhões, E. M., and de Amorin, W. (2005). “Princípio da sismocamada elementar e sua aplicação à técnica de volume de amplitudes (TecVa),” in Proceedings of the Anais Ninth International Congress of the Brazilian Geophysical Society, Bahia, Brazil, January 2005. in Portuguese.
Bulhões, E. M. (1999). “Técnica “Volume de Amplitudes” para mapea-mento de feições estruturais,” in Anais do VI Congresso Internacional da Sociedade Brasileira de Geofísica (Rio de Janeiro, Brazil: Ciedade Brasileira De Geoquímica). (in Portuguese).
Butler, R. W. H., Mazzoli, S., Corrado, S., De Donatis, M., Di Bucci, D., Gambini, R., et al. (2004). “Applying thick-skinned tectonic models to the Apennine thrust belt of Italy-Limitations and implications,” in Thrust tectonics and hydrocarbon systems. Editor K. R. McClay (Tulsa, Oklahoma: AAPG Memoir).
Carvalho, J., Taha, R., Cabral, J., Carrilho, F., and Miranda, M. (2008). Geophysical characterization of the OtaVila franca de Xiralisbon-sesimbra fault zone, Portugal. Geophys. J. Int. 174, 567–584. doi:10.1111/j.1365-246x.2008.03791.x
Castellarin, A., Cantelli, L., Bertelli, I., Borrini, D., Fantoni, R., Sella, M., et al. (2004). The TRANSALP seismic profile and the CROP 1A sub-project. Mem. Descr. Carta Geol. d'Italia 62, 107–126.
Cavalcante, F., Belviso, C., Laurita, S., and Prosser, G. (2012). PT constraints from phyllosilicates of the Liguride complex of the pollino area (southern apennines, Italy): Geological inferences. Ofioliti 37 (2), 65–75. doi:10.4454/ofioliti.v37i2.411
Chen, Q., and Sidney, S. (1997). Seismic attribute technology for reservoir forecasting and monitoring. Lead. Edge 16 (5), 445–448. doi:10.1190/1.1437657
Chiarabba, C., Buttinelli, M., Cattaneo, M., and De Gori, P. (2020a). Large earthquakes driven by fluid overpressure: The Apennines normal faulting system case. Tectonics 39, e2019TC006014. doi:10.1029/2019TC006014
Chiarabba, C., De Gori, P., Segou, M., and Cattaneo, M. (2020b). Seismic velocity precursors to the 2016 Mw 6.5 Norcia (Italy) earthquake. Geology 48 (9), 924–928. doi:10.1130/G47048.1
Chopra, S., and Marfurt, K. J. (2011). Coherence and curvature attributes on pre-conditioned seismic data. Lead. Edge 30, 386–393. doi:10.1190/1.3575281
Chopra, S., and Marfurt, K. J. (2008). Emerging and future trends in seismic attributes. Lead. Edge 27 (3), 298–318. doi:10.1190/1.2896620
Chopra, S., and Marfurt, K. J. (2007). Seismic attributes for prospect identification and reservoir characterization. United States: SEG Geophysical Developments.
Chopra, S., and Marfurt, K. J. (2005), Seismic attributes — a historical perspective. Geophysics, 70
Cippitelli, G. (2007). The CROP-04 seismic profile, Interpretation and structural setting of the Agropoli-Barletta Geotraverse. Boll. della Soc. Geol. Ital. Spec. Issue 7, 267–281.
Clowes, R., Cook, F., Hajnal, Z., Hall, J., Lewry, J., Lucas, S., et al. (1999). Canada’s LITHOPROBE Project (Collaborative, multidisciplinary geoscience research leads to new understanding of continental evolution). Episodes 22, 3–20. doi:10.18814/epiiugs/1999/v22i1/002
Clowes, R. M., and Hyndman, R. D. (2002). “Geophysical studies of the northern cascadia subduction zone off Western Canada and their implications for great earthquake seismotectonics: A review,” in Seismotectonics in convergent plate boundary. Editors Y. Fujinawa, and A. Yoshida (Tokyo, Japan: TERRAPUB), 1–23.
Clowes, R. M. (2010). Initiation, development, and benefits of Lithoprobe — Shaping the direction of Earth science research in Canada and beyondThis article is one of a series of papers published in this special issue on the theme lithoprobe — Parameters, processes, and the evolution of a continent.Lithoprobe contribution 1480. Can. J. Earth Sci. 47 (4), 291–314. doi:10.1139/e09-074
Clowes, R. M., Kanasewich, E. R., and Cumming, G. L. (1968). Deep crustal seismic reflections at near-vertical incidence. Geophysics 33 (3), 441–451. doi:10.1190/1.1439942
Cohen, I., Coult, N., and Vassiliou, A. A. (2006). Detection and extraction of fault surfaces in 3D seismic data. Geophysics 71, P21–P27. doi:10.1190/1.2215357
Cook, F. A., Albaugh, D. S., Brown, L. D., Kaufman, S., Oliver, J. E., and Hatcher, R. D. (1979). Thin-skinned tectonics in the crystalline southern Appalachians; COCORP seismic-reflection profiling of the Blue Ridge and Piedmont. Geology 7, 563–567. doi:10.1130/0091-7613(1979)7<563:ttitcs>2.0.co;2
D'agostino, N., Avallone, A., Cheloni, D., D'anastasio, E., Mantenuto, S., and Selvaggi, G. (2008). Active tectonics of the Adriatic region from GPS and earthquake slip vectors. J. Geophys. Res. Solid Earth 113, B12413. doi:10.1029/2008jb005860
D'Argenio, B., Ferreri, V., and Raspini, A. (1992). A cm-scale study of shallow water cretaceous deposits formed under high frequency eustatic regime, monti di Sarno (southern Italy) — a sedimentologic approach to microstratigraphy. Boll. Soc. Geol. Ital. 111, 399–407.
D’Argenio, B., De Castro, P., Emiliani, C., and Simone, L. (1975). Reassessing the lithosphere: SeisDARE, an open-access seismic data repository. AAPG Bull. 59 (3), 524–530. doi:10.5194/essd-13-1053-2021
D’Argenio, B., Pescatore, T., and Scandone, P. (1973). Schema geologico dell’Appennino meridionale (Campania-Lucania). Atti del convegno: Moderne vedute sulla geologia dell’Appenino. Acc. Naz. Lincei, Quad. 183, 49–72.
De Landro, G., Amoroso, O., and Russo, G., (2022). Decade-long monitoring of seismic velocity changes at the Irpinia fault system (southern Italy) reveals pore pressure pulsations. Sci. Rep. 12, 1247. doi:10.1038/s41598-022-05365-x
De Lima, R., Teixeira, L. E. W., de Albuquerque, F. R., and Lima Filho, F. (2018). Ground penetrating radar digital imaging and modeling of microbialites from the salitre formation, northeast Brazil. Geol. Usp. – Ser. Cient. 18, 187–200. doi:10.11606/issn.2316-9095.v18-146075
de Rooij, M., and Tingdahl, K. (2002). Meta-attributes-the key to multivolume, multiattribute interpretation. Lead. Edge 21 (10), 1050–1053. doi:10.1190/1.1518445
DeFelipe, I., Alcalde, J., Ivandic, M., Martí, D., Ruiz, M., Marzán, I., et al. (2021). Reassessing the lithosphere: SeisDARE, an open-access seismic data repository. Earth Syst. Sci. Data 13, 1053–1071. doi:10.5194/essd-13-1053-2021
Del Pezzo, E., Iannaccone, G., Martini, M., and Scarpa, R. (1983). The 23 november 1980 southern Italy earthquake. Bull. Seism. Soc. Am. 73 (1), 187–200. doi:10.1785/bssa0730010187
Deng, A., and Stauffer, D. R. (2006). On improving 4-km mesoscale model simulations. J. Appl. Meteorology Climatol. 45 (3), 361–381. doi:10.1175/JAM2341.1
Dewett, D. T., and Henza, A. A. (2016). Spectral similarity fault enhancement. Interpretation 4 (1), SB149–SB159. doi:10.1190/int-2015-0114.1
Dewett, D. T., Pigott, J. D., and Marfurt, K. J. (2021). A review of seismic attribute taxonomies, discussion of their historical use, and presentation of a seismic attribute communication framework using data analysis concepts. Interpretation 9:3, B39–B64. doi:10.1190/INT-2020-0222.1
DGB Earth Sciences (2021). Introduction to OpendTect & OpendTect pro. Train. Man. - OpendTect 6, 438 (version 6.
Di, H., and AlRegib, G. (2019). Semi-automatic fault/fracture interpretation based on seismic geometry analysis. Geophys. Prospect. 67, 1379–1391. doi:10.1111/1365-2478.12769
Di, H., and Gao, D. (2017). 3D seismic flexure analysis for subsurface fault detection and fracture characterization. Pure Appl. Geophys 174, 747–761. doi:10.1007/s00024-016-1406-9
Dieulangard, D., Popham, M., Grant, C., O’Connell, K., Ourabah, A., and Einchcomb, C. (2021). Land seismic recording systems in a changing world — A 2021 review. First break 40, 59–65. doi:10.3997/1365-2397.fb2022004
Doglioni, C., Gueguen, E., Harabaglia, P., and Mongelli, F. (1999). On the origin of west-directed subduction zones and applications to the Western Mediterranean. Geol. Soc. Lond. Spec. Publ. 156 (1), 541–561. doi:10.1144/gsl.sp.1999.156.01.24
Ehsan, S. A., Carbonell, R., Ayarza, P., Martí, D., Martínez Poyatos, D., Simancas, J. F., et al. (2015). Lithospheric velocity model across the southern central iberian zone (variscan iberian massif): The ALCUDIA wide-angle seismic reflection transect. Tectonics 34, 535–554. doi:10.1002/2014TC003661
Ehsan, S. A., Carbonell, R., Ayarza, P., Martí, D., PérezEstaún, A., Martínez-Poyatos, D. J., et al. (2014). Crustal deformation styles along the reprocessed deep seismic reflection transect of the Central Iberian Zone (Iberian Peninsula). Tectonophysics 621, 159–174. doi:10.1016/j.tecto.2014.02.014
Elter, P., Giglia, G., Tongiorgi, M., and Trevisan, L. (1975). Tensional and compressional areas in the recent (tortonian to present) evolution of the northern apennines. Boll. Geofis. Teor. Appl. 65, 3–18.
Ercoli, M., Bizzarri, R., Baldanza, A., Bertinelli, A., Mercantili, D., and Pauselli, C. (2021). GPR detection of fossil structures in conductive media supported by FDTD modelling and attributes analysis: An example from early pleistocene marine clay at bargiano site (central Italy). Geosciences 11, 386. doi:10.3390/geosciences11090386
Ercoli, M., Forte, E., Porreca, M., Carbonell, R., Pauselli, C., Minelli, G., et al. (2020). Using seismic attributes in seismotectonic research: An application to the norcia Mw=6.5 earthquake (30 october 2016) in central Italy. Solid earth. 11, 329–348. doi:10.5194/se-2019-108
Ercoli, M., Pauselli, C., Cinti, F. R., Forte, E., and Volpe, R. (2015). Imaging of an active fault: Comparison between 3D GPR data and outcrops at the Castrovillari fault, Calabria, Italy. Interpretation 3, SY57–SY66. doi:10.1190/int-2014-0234.1
Fehmers, G. C., and Höcker, C. F. W. (2003). Fast structural interpretation with structure-oriented filtering. Geophysics 68 (4), 1286–1293. doi:10.1190/1.1598121
Ferranti, L., Palano, M., Cannavò, F., Mazzella, M. E., Oldow, J. S., Gueguen, E., et al. (2014). Rates of geodetic deformation across active faults in southern Italy. Tectonophysics 621, 101–122. doi:10.1016/j.tecto.2014.02.007
Finetti, I. (2005). CROP project: Deep seismic exploration of the central mediterranean and Italy, atlases geosci. New York: Elsevier.
Finetti, I. R., Boccaletti, M., Bonini, M., Del Ben, A., Geletti, R., Pipan, M., et al. (2001). Crustal section based on CROP seismic data across the north tyrrhenian–northern apennines–adriatic sea. Tectonophysics 343, 135–163. doi:10.1016/s0040-1951(01)00141-x
Forte, E., Dossi, M., Pipan, M., and Del Ben, A. (2016). Automated phase attribute-based picking applied to reflection seismics. Geophysics 81 (2), V141–V150. doi:10.1190/GEO2015-0333.1
Forte, E., Pipan, M., Casabianca, D., Di Cuia, R., and Riva, A. (2012). Imaging and characterization of a carbonate hydrocarbon reservoir analogue using GPR attributes. J. Appl. Geophys. 81, 76–87. doi:10.1016/j.jappgeo.2011.09.009
Galli, P. (2020). Roman to middle age earthquakes sourced by the 1980 Irpinia Fault: Historical, archaeoseismological, and paleoseismological hints. Geosciences 10, 286. doi:10.3390/geosciences10080286
Gersztenkorn, G., and Marfurt, K. J. (1999). Eigenstructure-based coherence computations as an aid to 3-D structural and stratigraphic mapping. Geophysics 64, 1468–1479. doi:10.1190/1.1444651
Giustiniani, M., Tinivella, U., and Nicolich, R. (2015). Reflection seismic sections across the Geothermal Province of Tuscany from reprocessing CROP profiles. Geothermics 53, 498–507. doi:10.1016/j.geothermics.2014.09.003
Ha, T. N., Marfurt, K. J., Wallet, B. C., and Hutchinson, B. (2019). Pitfalls and implementation of data conditioning, attribute analysis, and self-organizing maps to 2D data: Application to the Exmouth Plateau, North Carnarvon Basin, Australia. Interpretation 7 (3), SG23–SG42. doi:10.1190/int-2018-0248.1
Hale, D. (2013). Methods to compute fault images, extract fault surfaces, and estimate fault throws from 3D seismic images. Geophysics 78 (2), O33–O43. doi:10.1190/geo2012-0331.1
Heinonen, A., Aalto, A., Väkevä, S., Heikkinen, P. J., and Korja, A. (2017). OpenFIRE – suomen syvyydet avataan verkkoon. Geol. Vuosikerta 69 (3), 92–97.
Hope, J., Eaton, D. W., and Ross, G. M. (1999), LITHOPROBE seismic transect of the Alberta Basin: Compilation and overview, Bull. Can. Petroleum Geol., 47, 4, 331–345. doi:10.35767/gscpgbull.47.4.331
Hussein, M., Stewart, R. R., and Wu, J. (2021), Which seismic attributes are best for subtle fault detection? Interpretation, 9:2, T299–T314. doi:10.1190/int-2020-0068.1
Iacopini, D., Butler, R., Purves, S., McArdle, N., and De Freslon, N. (2016). Exploring the seismic expression of fault zones in 3D seismic volumes. J. Struct. Geol. 89, 54–73. doi:10.1016/j.jsg.2016.05.005
Iacopini, D., and Butler, R. W. H. (2021). Imaging deformation in submarine thrust belts using seismic attributes. Earth Planet. Sci. Lett. 302, 414–422. doi:10.1016/j.epsl.2010.12.041
Iacopini, D., Butler, R. W. H., and Purves, S. (2011). Seismic imaging of thrust faults and structural damage: A visualization workflow for deepwater thrust belts. First Break 30, 39–46. doi:10.3997/1365-2397.30.5.58681
Improta, L., Bonagura, M., Capuano, P., and Iannaccone, G. (2003a). An integrated geophysical investigation of the upper crust in the epicentral area of the 1980, Ms=6.9, Irpinia earthquake (Southern Italy). Tectonophysics 361 (1–2), 139–169. doi:10.1016/S0040-1951(02)00588-7
Improta, L., De Gori, P., and Chiarabba, C. (2014). New insights into crustal structure, Cenozoic magmatism, CO2 degassing, and seismogenesis in the southern Apennines and Irpinia region from local earthquake tomography. J. Geophys. Res. Solid Earth 119, 8283–8311. doi:10.1002/2013JB010890
Improta, L., Iannaccone, G., Capuano, P., Zollo, A., and Scandone, P. (2000). Inferences on the upper crustal structure of Southern Apennines (Italy) from seismic refraction investigations and subsurface data. Tectonophysics 317 (3-4), 273–298. doi:10.1016/s0040-1951(99)00267-x
Improta, L., Zollo, A., Bruno, P. P., Herrero, A., and Villani, F. (2003b). High resolution seismic tomography across the 1980 (Ms 6.9) southern Italy earthquake fault scarp. Geophys. Res. Lett. 30 (10), 1494. doi:10.1029/2003GL017077
Iske, A., and Randen, T. (2005). Mathematical methods and modelling in hydrocarbon exploration and production. Berlin, Germany: Springer.
Knipe, R. J., Jones, G., and Fisher, Q. J. (1998). Faulting, fault seal and fluid flow in hydrocarbon reservoirs: An introduction. Geol. Soc. Publ. 147, VII–XXI. doi:10.1144/GSL.SP.1998.147.01.01
Knott, S. D. (1987). The Liguride complex of southern Italy—a cretaceous to paleogene accretionary wedge. Tectonophysics 142 (2-4), 217–226. doi:10.1016/0040-1951(87)90124-7
Korja, A., Heikkinen, P., Tiira, T., and Nikkilä, K. (2018). “FIRE3&3a,” in Atlas of structural geological interpretation from seismic images. Editors A. A. Misra, and S. Mukherjee (New Jersey, U.S. Wiley).
Kukkonen, I. T., Heikkinen, P., Ekdahl, E., Hjelt, S. E., Yliniem, J., and Jalkanen, E.FIRE Working Group (2006). Acquisition and geophysical characteristics of reflection seismic data on FIRE transects, Fennoscandian Shield. Surv. Finl. Spec. Pap. 43, 13–43.
Lavecchia, G., Brozzetti, F., Barchi, M., Menichetti, M., and Keller, J. V. (1994). Seismotectonic zoning in east-central Italy deduced from an analysis of the Neogene to present deformations and related stress fields. GSA Bull. 106 (9), 1107–1120. doi:10.1130/0016-7606(1994)106<1107:szieci>2.3.co;2
Lentini, F., Carbone, S., Di Stefano, A., and Guarnieri, P. (2002). Stratigraphical and structural constraints in the lucanian apennines (southern Italy): Tools for reconstructing the geological evolution. J. Geodyn. 34 (1), 141–158. doi:10.1016/s0264-3707(02)00031-5
Lombardi, G. (2021). Irpinia earthquake and history: A nexus as a problem. Geosciences 11, 50. doi:10.3390/geosciences11020050
Luo, y., Marhoon, M., Al Dossary, S., and Alfaraj, M. (2002). Edge-preserving smoothing and applications. Lead. Edge 21 (2), 136–158. doi:10.1190/1.1452603
Maesano, F. E., D’Ambrogi, C., Burrato, P., and Toscani, G. (2015). Sliprates of blind thrusts in slow deforming areas: Examples from the Po plain (Italy). Tectonophysics 643, 8–25. doi:10.1016/j.tecto.2014.12.007
Malehmir, A., Markovic, M., Marsden, P., Gil, A., Buske, S., Sito, L., et al. (2021). Sparse 3D reflection seismic survey for deep-targeting iron oxide deposits and their host rocks, Ludvika Mines, Sweden. Solid earth. 12, 483–502. doi:10.5194/se-12-483-2021
Malehmir, A., Socco, L. V., Bastani, M., Krawczykjj, C. M., Pfaffhuber, A. A., Miller, R. D., et al. (2016). Characterization of areas prone to natural hazards: A review of the current and perspective on the future. Adv. Geophys. 57. Chapter 2, ISSN 0065-2687. doi:10.5194/nhess-20-1069-2020
Manning, T., Ablyazina, D., and Quigley, J. (2019). The nimble node – million-channel land recording systems have arrived. Lead. Edge 38, 706–714. doi:10.1190/tle38090706.1
Marfurt, K. J., and Alves, T. M. (2015). Pitfalls and limitations in seismic attribute interpretation of tectonic features. Interpretation 3, SB5–SB15. SB5–SB15. doi:10.1190/int-2014-0122.1
Marfurt, K. J., Gao, D., Barnes, A., Chopra, S., Corrao, A., Hart, B., et al. (2011). Attributes: New views on seismic imaging–their use in exploration and production. United States: SEPM Society for Sedimentary Geology. doi:10.5724/gcs.11.31
Marfurt, K. J. (2006). Robust estimates of 3D reflector dip and azimuth. Geophysics 71 (4), P29–P40. doi:10.1190/1.2213049
Marfurt, K. J. (2018). Seismic attributes as the framework for data integration throughout the lifespan of oil field. Tulsa, OK: Society of Exploration Geophysics Distinguished Instructor Series, 508.
Marfurt, K. J., Sudakher, V., Gerszenkorn, A., Crawford, K. D., and Nissen, S. E. (1999). Coherency calculations in the presence of structural dip. Geophysics 64, 104–111. doi:10.1190/1.1444508
Marsella, E., Bally, A. W., Cippitelli, G., D'Argenio, B., and Pappone, G. (1995). Tectonic history of the Lagonegro domain and southern apennine thrust belt evolution. Tectonophysics 252 (1-4), 307–330. doi:10.1016/0040-1951(95)00097-6
Maschio, L., Ferranti, L., and Burrato, P. (2005). Active extension in val d'Agri area, southern apennines, Italy: Implications for the geometry of the seismogenic belt. Geophys. J. Int. 162 (2), 591–609. doi:10.1111/j.1365-246x.2005.02597.x
Matano, F., Di Nocera, S., Criniti, S., and Critelli, S. (2020). Geology of the epicentral area of the november 23, 1980 earthquake (Irpinia, Italy): New stratigraphical, structural and petrological constrains. Geosciences 10 (6), 247. doi:10.3390/geosciences10060247
Mazzoli, S., Ascione, A., Candela, S., Iannace, A., Megna, A., Santini, S., et al. (2013). Subduction and continental collision events in the southern apennines: Constraints from two crustal cross-sections. Rend. Online Soc. Geol. Ital. 25, 78–84. doi:10.3301/ROL.2013.07
Mazzoli, S., Barkham, S., Cello, G., Gambini, R., Mattioni, L., Shiner, P., et al. (2001). Reconstruction of continental margin architecture deformed by the contraction of the Lagonegro Basin, southern Apennines, Italy. J. Geol. Soc. 158, 309–319. doi:10.1144/jgs.158.2.309
Mazzoli, S., Corrado, S., De Donatis, M., Scrocca, D., ButlerDi BucciNasoNicolai, R. D. G. C., Zucconi, V., et al. (2000). Time and space variability of ‘‘thin-skinned’’ and ‘‘thick-skinned’’ thrust tectonics in the Apennines (Italy). Rend. Fis. Accad. Lincei 11 (1), 5–39. doi:10.1007/bf02904594
Mazzotti, A., Stucchi, E., Fradelizio, G. L., and Zanzi, L. (2007b). Analysis of the CROP-04 seismic data. Boll. Soc. Geol. It. Ital. J. Geosci.), Spec. Issue 7, 129–140.
Mazzotti, A., Stucchi, E., Fradelizio, G. L., Zanzi, L., and Scandone, P. (2007a). Re-processing of the CROP-04 seismic data. Boll. Soc. Geol. It. Ital. J. Geosci.), Spec. Issue 7, 141–153.
Mazzotti, A., Stucchi, E., Fradelizio, G., Zanzi, L., and Scandone, P. (2000). Seismic exploration in complex terrains; a processing experience in the Southern Apennines. Geophysics 65, 1402–1417. doi:10.1190/1.1444830
McClymont, A. F., Green, A. G., Villamor, P., Horstmeyer, H., Grass, C., and Nobes, D. C. (2008). Characterization of the shallow structures of active fault zones using 3-D ground penetrating radar data. J. Geophys. Res. 113, B10315. doi:10.1029/2007JB005402
Meffre, A., Prieux, V., Retailleau, M., Le Meur, D., Monteiro, A. A., Bouzouita, Z., et al. (2022). Revival of legacy land seismic surveys using advanced processing technologies: An example from the carpathian foothills. First Break 40, 45–52. doi:10.3997/1365-2397.fb2022002
Meissner, R., and Bortfeld, R. K. (1990). DEKORP atlas: Results of deutsches kontinentales reflexionsseismisches programme. Berlin, Germany: Springer-Verlag, 311.
Meldahl, P., Heggland, R., Bril, B., and de Groot, P. (2001). Identifying faults and gas chimneys using multi-attributes and neural networks. Lead. Edge 20 (5), 474–482. doi:10.1190/1.1438976
Menardi Noguera, A., and Rea, G. (2000). Deep structure of the campanian-lucanian arc (southern apennine, Italy). Tectonophysics 324 (4), 239–265. doi:10.1016/s0040-1951(00)00137-2
Merlini, S., and Mostardini, F. (1986). Appennino centro-meridionale: Sesioni geologiche proposta di modello strutturale. Geol. dell'Italia Cent. 73, 147–149.
Monaco, C., and Tortorici, L. (1995). Tectonic role of ophiolite-bearing terranes in the development of the Southern Apennines orogenic belt. Terra nova. 7 (2), 153–160. doi:10.1111/j.1365-3121.1995.tb00684.x
Morelli, C. (2003). An historical perspective to the CROP Project (Una rassegna storica del Progetto CROP). Mem. Descr. Carta Geol. D’it. LXII, 1–8.
Mulargia, F., and Bizzarri, A. (2015). Fluid pressure waves trigger earthquakes. Geophys. J. Int. 200 (3), 1279–1283. doi:10.1093/gji/ggu469
Naeini, E. Z., and Prindle, K. (2018). Machine learning and learning from machines. Lead. Edge 37 (12), 886–893. doi:10.1190/tle37120886.1
Nakamura, Y., McIntosh, K., and Chen, A. T. (1998). Preliminary results of a large offset seismic survey west of Hengchun Peninsula, southern Taiwan. Terr. Atmos. Oceanol. 9, 395–408. doi:10.3319/tao.1998.9.3.395(taicrust)
Odoh, B. I., Ilechukwu, J. N., and Okoli, N. I. (2014). The use of seismic attributes to enhance fault interpretation of OT field, Niger delta. Int. J. Geosciences 5, 826–834. doi:10.4236/ijg.2014.58073
Ogniben, L. (1969). Schema introduttivo alla geologia del confine calabro-lucano. Mem. Soc. Geol. It. 8, 453–763.
Palladino, G., Parente, M., Prosser, G., and Di Staso, A. (2008). Tectonic control on the deposition of the Lower Miocene sediments of the Monti della Maddalena ridge (Southern Apennines): Synsedimentary extensional deformation in a foreland setting. Boll. della Soc. Geol. Ital. 127, 317–335.
Pantosti, D., and Valensise, G. (1990). Faulting mechanism and complexity of the November 23, 1980, Campania- Lucania earthquake, inferred from surface observations. J. Geophys. Res. 95, 15319. doi:10.1029/jb095ib10p15319
Patacca, E., and Scandone, P. (2007). Geological interpretation of the CROP-04 seismic line (Southern Apennines, Italy). Boll. Soc. Geol. It., Spec. Issue 7, 297–315.
Patacca, E., and Scandone, P. (2001). “Late thrust propagation and sedimentary response in the thrust-belt foredeep system of the Southern Apennines (Pliocene-Pleistocene),” in Anatomy of an orogen: The Apennines and the adjacent mediterranean basins”. Editors G. B. Vai, and I. P. Martini (United States: Kluwer Academic Publishers), 401–440.
Pauselli, C., Barchi, M. R., Federico, C., Magnani, M. B., and Minelli, G. (2006). The crustal structure of the northern Apennines (Central Italy): An insight by the CROP03 seismic line. Am. J. Sci. 306, 428–450. doi:10.2475/06.2006.02
Pedersen, S. I., Randen, T., Sonneland, L., and Steen, O. (2002). Automatic fault extraction using artificial ants. Seg. Int. Conf. 12, 1–18. doi:10.1190/1.1817297
Percival, J. A., Cook, F. A., and Clowes, R. M. (2012). Tectonic styles in Canada: The lithoprobe perspective. St. John's, NL: Geological Association of Canada, 498.
Pertuz, T., Malehmir, A., Bos, J., Brodic, B., Ding, Y., de Kunder, R., et al. (2022). Broadband seismic source data acquisition and processing to delineate iron oxide deposits in the Blötberget mine-central Sweden. Geophys. Prospect. 70, 79–94. doi:10.1111/1365-2478.13159
Pialli, G., Barchi, M., and Minelli, G. (1998). Results of the CROP03 deep seismic reflection profile. Mem. Soc. Geol. It. 52, 657.
Porreca, M., Minelli, G., Ercoli, M., Brobia, A., Mancinelli, P., Cruciani, F., et al. (2018). Seismic reflection profiles and subsurface geology of the area interested by the 2016–2017 earthquake sequence (Central Italy). Tectonics 37, 1116–1137. doi:10.1002/2017tc004915
Qayyum, F., and de Groot, P. (2012). Seismic dips help unlock reservoirs. Am. Oil Gas Report. 58, 75–79.
Qi, X., and Marfurt, K. (2018). Volumetric aberrancy to map subtle faults and flexures. Interpretation 6, T349–T365. doi:10.1190/int-2017-0114.1
Randen, T., Monsen, E., Signer, C., Abrahamsen, A., Hansen, J. O., Sæter, T., et al. (2000). Three-dimensional texture attributes for seismic data analysis. 70th Annu. Int. Meet. Seg. Expand. Abstr. 22, 668–671. doi:10.1190/1.1816155
Roberts, A. (2001). Curvature attributes and their application to 3D interpreted horizons. First Break 19, 85–100. doi:10.1046/j.0263-5046.2001.00142.x
Roure, F., Choukroune, P., Berastegui, X., Munoz, J. A., Villien, A., Matheron, P., et al. (1989). Ecors deep seismic data and balanced cross sections: Geometric constraints on the evolution of the Pyrenees. Tectonics 8, 41–50. doi:10.1029/tc008i001p00041
Rovida, A., Locati, M., Camassi, R., Lolli, B., and Gasperini, P. (2020). The Italian earthquake catalogue CPTI15. Bull. Earthq. Eng. 18, 2953–2984. doi:10.1007/s10518-020-00818-y
Sandmeier, K. J. (2022). REFLEXW version 9.1.3 user manual. Karlsruhe, Germany: Sandmeier Geophysical Research, 1–682.
Savastano, L., and Piana Agostinetti, N. (2019). Deep structure of the Southern Apennines as imaged by active and passive seismic data along the CROP-04 (crustal) reflection seismic profile. J. Geol. Soc. 176 (6), 1284–1290. doi:10.1144/jgs2018-201
Schmelzbach, C., Greenhalgh, S., Reiser, F., Girard, J. F., Bretaudeau, F., Capar, L., et al. (2016). Advanced seismic processing/imaging techniques and their potential for geothermal exploration. Interpretation 4, SR1–SR18. doi:10.1190/INT-2016-0017.1
Schwartz, D. P., and Coppersmith, K. J. (1984). Fault behavior and characteristic earthquakes: Examples from the Wasatch and San Andreas fault zones. J. Geophys. Res. Sol. Ea. 89, 5681–5698. doi:10.1029/JB089iB07p05681
Scrocca, D., Carminati, E., and Doglioni, C. (2005). Deep structure of the southern Apennines, Italy: Thin-skinned or thick-skinned? Tectonics 24, TC3005. doi:10.1029/2004TC001634
Scrocca, D., Doglioni, C., Innocenti, F., Manetti, P., Mazzotti, A., Bertelli, L., et al. (2003). CROP atlas: Seismic reflection profiles of the Italian crust. Mem. Descr. Carta Geol. It. 62, 194. 71 plates.
Scrocca, D., Sciamanna, S., Di Luzio, E., Tozzi, M., Nicolai, C., and Gambini, R. (2007). Structural setting along the CROP-04 deep seismic profile (Southern Apennines - Italy). Boll. Soc. Geol. It., Spec. Issue 7, 283–296.
Scrocca, D. (2010). Southern apennines: Structural setting and tectonic evolution. J. Virtual Explor. 36 (14). doi:10.3809/jvirtex.2010.00225
Sheriff, R. E. (2002). Encyclopedic dictionary of applied Geophysics. 4 ed. Texas, United States: Society of Exploration Geophysicists, Geophysical References Series, 442.
Shiner, P., Beccacini, A., and Mazzoli, S. (2004). Thin-skinned versus thick-skinned structural models for apulian carbonate reservoirs: Constraints from the val d'Agri fields, S apennines, Italy. Mar. Petroleum Geol. 21 (7), 805–827. doi:10.1016/j.marpetgeo.2003.11.020
Simancas, J. F., Carbonell, R., González Lodeiro, F., Pérez Estaún, A., Juhlin, C., Ayarza, P., et al. (2003). Crustal structure of the transpressional variscan orogen of SW iberia: SW iberia deep seismic reflection profile (IBERSEIS). Tectonics 22, 1062. doi:10.1029/2002TC001479
Steeples, R., and Miller, R. D. (1998). Avoiding pitfalls in shallow seismic reflection surveys. Geophysics 63, 1213–1224. doi:10.1190/1.1444422
Strobbia, C., Dean, T., Re, S., Ceragioli, E., Sweeney, D., and Nightingale, M. (2022). Fundamental noise - the key to recovering your signal: An integrated workflow for seismic survey design. First break 40, 87–95. doi:10.3997/1365-2397.fb2022008
Stucchi, E., Zanzi, L., and Mazzotti, A. (2003). Lessons learned from the acquisition and the processing of the CROP C-ALPS/b, CROP 03, CROP 04, CROP 18 NVR and expanding spread seismic data. Mem. Descr. Carta Geol. D’it. LXII, 75–88.
Taner, M. T., Koehler, F., and Sheriff, R. E. (1979). Complex seismic trace analysis. Geophysics 44, 1041–1043. doi:10.1190/1.1440994
Taner, M. T. (2001). Seismic attributes. Calgary (CA): Canadian Society of Exploration Geophysicists Recorder.
Tingdahl, K. M., and de Rooij, M. (2005). Semi-automatic detection of faults in 3-D seismic data. Geophys. Prospect. 53, 533–542. doi:10.1111/j.1365-2478.2005.00489.x
Tingdahl, K. M., and de Groot, P. F. (2003). Post-stack dip-and azimuth processing. J. Seism. Explor. 12, 113–126.
Tingdahl, K. M. (2003). Improving seismic chimney detection using directional attributes. Dev. Petroleum Sci. 51, 157–173. doi:10.1016/S0376-7361(03)80013-4
Tingdahl, K. M. (1999). Improving seismic detectability using intrinsic directionality. Gothenburg, Sweden: Goteborg University.
Tognarelli, A., Stucchi, E., M., Musumeci, G., Mazzarini, F., and Sani, F. (2011). Reprocessing of the CROP M12A seismic line focused on shallow-depth geological structures in the northern Tyrrhenian Sea. Boll. Geofis. Teor. Appl. 52 (1), 23–38.
Torvela, T., Moreau, J., Butler, R. W. H., Korja, A., and Heikkinen, P. (2013). The mode of deformation in the orogenic mid-crust revealed by seismic attribute analysis. Geochem., Geophys., Geosyst. 14, 1069–1086. doi:10.1002/ggge.20050
Valensise, G. (1993), Summary of contributions on the 23 November 1980, Irpinia earthquake, Annali di Geofisica, 36, 1, 345-351.
Vasudevan, K., Eaton, D., and Cook, F. A. (2005). Adaptation of seismic skeletonization for other geoscience applications. Geophys. J. Int. 162 (3), 975–993. doi:10.1111/j.1365-246x.2005.02704.x
Vernengo, L., and Trinchero, E. (2015). Application of amplitude volume technique attributes, their variations, and impact. Lead. Edge 34 (10), 1242–1246. doi:10.1190/tle34101246.1
Vernengo, L., Trinchero, E., Torrejón, M. G., and Rovira, I. (2017). Amplitude volume technique attributes and multidimensional seismic interpretation. Lead. Edge 36 (9), 776–781. doi:10.1190/tle36090776.1
Vezzani, L., Festa, A., and Ghisetti, F. C. (2010). Geology and tectonic evolution of the central-southern Apennines, Italy. Colorado, United States: Geological Society of America.
Westaway, R., and Jackson, J. (1984). Surface faulting in the southern Italian Campania-Basilicata earthquake of 23 November 1980. Nature 312 (5993), 436–438. doi:10.1038/312436a0
William-Keach, R., Oliver, J. E., Brown, L. D., and Kaufman, S. (1989), Cenozoic active margin and shallow cascades structure: COCORP results from Western Oregon. GSA Bull., 101, (6), 783–794. doi:10.1130/0016-7606(1989)101<0783:CAMASC>2.3.CO;2
Wrona, T., Pan, I., Gawthorpe, R. L., and Fossen, H. (2018). Seismic facies analysis using machine learning. Geophysics 83 (5), O83–O95. doi:10.1190/geo2017-0595.1
Wu, X., and Hale, D. (2016). Automatically interpreting all faults, unconformities, and horizons from 3D seismic images. Interpretation 4, T227–T237. doi:10.1190/INT-2015-0160.1
Wu, Z. (1986). “Shallow structure of the southern albuquerque basin (rio grande rift), new Mexico from COCORP seismic reflection data,” in Reflection seismology: The continental crust. Editors M. Barazangi, and L. Brown (New Jersey, U.S. Wiley).
Yu, S., and Ma, J. (2021). Deep learning for geophysics: Current and future trends. Rev. Geophys. 59, e2021RG000742. doi:10.1029/2021rg000742
Zhao, J., and Sun, S. Z. (2013). Automatic fault extraction using a modified ant-colony algorithm. J. Geophys. Eng. 10, 025009. doi:10.1088/1742-2132/10/2/025009
Keywords: seismic reflection, legacy data, pre-conditioning filters, seismic attributes, normal faults, earthquakes, seismotectonics, Irpinia 1980 earthquake
Citation: Ercoli M, Carboni F, Akimbekova A, Carbonell RB and Barchi MR (2023) Evidencing subtle faults in deep seismic reflection profiles: Data pre-conditioning and seismic attribute analysis of the legacy CROP-04 profile. Front. Earth Sci. 11:1119554. doi: 10.3389/feart.2023.1119554
Received: 08 December 2022; Accepted: 27 February 2023;
Published: 31 March 2023.
Edited by:
David Gomez-Ortiz, Rey Juan Carlos University, SpainReviewed by:
Nam Pham, The University of Texas at Austin, United StatesRonghuo Dai, China West Normal University, China
Copyright © 2023 Ercoli, Carboni, Akimbekova, Carbonell and Barchi. This is an open-access article distributed under the terms of the Creative Commons Attribution License (CC BY). The use, distribution or reproduction in other forums is permitted, provided the original author(s) and the copyright owner(s) are credited and that the original publication in this journal is cited, in accordance with accepted academic practice. No use, distribution or reproduction is permitted which does not comply with these terms.
*Correspondence: Maurizio Ercoli, bWF1cml6aW8uZXJjb2xpQHVuaXBnLml0; Filippo Carboni, ZmlsaXBwby5jYXJib25pQGdlb2xvZ2llLnVuaS1mcmVpYnVyZy5kZQ==