 Tiantian Ma1
 Lu Xia2*
- 1School of Water Resources and Environment, China University of Geosciences, Beijing, China
- 2Key Laboratory of Groundwater Conservation of MWR, School of Water Resources and Environment, China University of Geosciences, Beijing, China
The fractures of different sizes in rock masses are important for describing rock fragmentation. The distribution dispersion of fracture size influences the blockiness level of the rock masses. Based on a normal statistical distribution, the volume ratio of blocks to rock (B) was obtained to describe the blockiness level. For exploring the effect of the dispersion of fracture size on blockiness level and the representative elementary volume (REV) of rock masses, the laboratory model and numerical simulation were established, and the theory of statistics and the method of analytical solution were applied. In addition, 4,525 practical rock models were established to qualitatively reproduce the behavior of B with changing domain size. The results show that by comparing the degree of convergence, the REV of a rock mass is determined by the fracture size rather than the degree of fracture dispersion. The value of B increases with the distribution dispersion of fracture size, indicating a higher blockiness level. From the experimental analysis of coin tossing, when the number of trials exceeds 69, the random results are nearly stable. In this study, 100 calculations were performed. A formula to calculate the blockiness by considering the dispersion degrees of fracture size was obtained. Moreover, a positive linear correlation between B and the coefficient of variation of fracture size was obtained. The rate of increase in B has a parabolic relationship with the ratio of fracture size to fracture spacing (L).
1 Introduction
The typical unit volume or the representative elementary volume (REV) is the minimum volume that represents a material on a large scale. The concept of the REV is an indispensable basis for understanding fractured rock masses, and the existence of a REV is the premise of continuum theory and the finite element theory. This continuum method is important for solving large rock problems (Wang et al., 2022b; Lei et al., 2022). When the REV size is very small, the theory of continuous media can be applied directly. However, the application of this theory to fractured rock masses is limited. For example, the representativeness of the permeability tensor and the applicability of porous medium theory depend on the existence of a REV in the rock mass (Bear, 1972; Long and Billaux, 1987; Wang et al., 2003). A REV is the basic and key index of rock mechanical properties (Xiang and Zhou, 2005). As a result, the concept has attracted a great deal of attention in the field of geotechnical engineering and has been discussed from various points of view in many publications. These include the three-dimensional (3D) and two-dimensional (2D) hydraulic conductivity, the damage coefficient, the geological strength index, and the REV (Wang et al., 2002; Ni et al., 2017; Wang et al., 2018; Huang et al., 2020). The REV method can describe a threshold of a rock mass property, such as hydraulic conductivity (Li and Zhang, 2011). Typical rock masses are formed under the influence of blocks with different domain sizes (Shahami et al., 2019). In this study, the REV of a rock mass was explored from the viewpoint of the block.
The stability of rocks has always been a focus of concern. Wang et al. estimated the effect of five indexes on the stability of slop by numerical and statistical methods (Wang et al., 2022c). The study of blockiness level is of great significance to avoid geological disasters such as rockfalls and tailings pond failures (Wang et al., 2019; Wang et al., 2021; Wang et al., 2022a; Lin et al., 2022; Ma and Liu, 2022). Blockiness is defined as the percentage of the volume of isolated blocks formed by fractures to the total volume of the rock (Xia et al., 2016). It is used to quantitatively describe the fragility level of a rock mass (Aler et al., 1996; Chen et al., 2021). A rock mass with a higher blockiness level tends to be more fragmented. Conversely, a rock mass with a lower blockiness level has a stronger integrity. In recent years, blockiness has been adopted by some researchers as an index of rock mass quality classification. In a paper by Xia et al. (2016), 77 types of fractured rock mass models were developed based on seven classes of fracture size and 11 spacing categories recommended and classified by the International Society for Rock Barton (1979). The rock block was identified and its B was investigated. For each domain size, nine implementations were performed to reduce the effects of randomness. The results indicated that 76 REV sizes ranged from 2 to 20 times the fracture spacing.
It is well known that the influence of fractures on the blockiness level is considerable, especially in the spacing, size, and statistical distribution of fractures (Elmouttie and Poropat, 2011; Zhu et al., 2014; Ajayi et al., 2018). The sizes and distributions of fractures in rock masses are diverse (Hu et al., 2022; Yang et al., 2022). Fracture spacing and size control the volume, quantity, and stability of a block. In this study, the fracture sizes of each model were constant. The quantitative relationship between B, fracture spacing, and size was explored, assuming equal fracture sizes (Xia and Yu, 2020). In this study, a relationship between B and normally distributed fracture size was obtained. The coefficient of variation (Cv) was now used to indicate the dispersion degree of fracture size. A more practical model was established by GeneralBlock (GB) software, and the influence of the statistical dispersion of fracture size on B and REV was investigated. To decrease the random error of this relationship, the number of calculations was increased from 5 to 100. This process includes the following: 1) based on the 77 models by Xia et al. (2016), the statistical distribution of fracture size was changed while the other parameters were kept constant; 2) five types of fracture networks were constructed under different statistical dispersions of fracture size; 3) rock blocks in each model were identified, and the fluctuation in B with the size of the model area was calculated; and 4) the REV sizes in these models were determined by the convergence or the Cv of B, and an analytical function describing the relationship between B and the distribution dispersion of fracture size was developed.
2 Statistical distribution of fracture size
2.1 Fracture shape and size
The complex fractures in rock have a great influence on the quality and safety of rock in geological engineering projects such as dam foundations, underground tunnels, or caverns. A scheme for modeling fracture networks was proposed (Neuman, 1989). However, for this model, the fracture geometry and distribution must be determined first. In past research, the fractures have been hypothesized to be disc-shaped, ellipsoidal, or polygonal (Baecher and Lanney, 1978; Dershowitz and Einstein, 1988; Kalenchuk et al., 2006). Polygonal and ellipsoidal models, which incorporate more geometric coefficients than the disc model, may describe the fracture shape more accurately. However, it is not easy to determine these coefficients (such as the directions of the major and minor axes of an ellipse). The more coefficients there are, the greater the uncertainty of the model. In this study, the disk assumption was adopted, so only its diameter or radius was needed to describe the fracture size. The spatial location of fractures was determined by the Poisson model (Priest and Hudson, 1976). Among all fracture parameters, fracture size directly and critically affects the characteristics of rock masses such as fracture closure, permeability, and rock instability (La Pointe et al., 1993; Giwelli et al., 2009; Lang et al., 2014; Zhang et al., 2020). A normal distribution and dispersion level are concerns in this study.
2.2 Statistical dispersion of fracture size
The statistical distribution of the fracture size is an important parameter for characterizing fractures. Although there are many distribution forms of fracture size, the Gaussian distribution (the normal distribution) is the most commonly applied distribution in the statistical analysis of geotechnical engineering. A simple form of the normal distribution is another reason for applying it. It only requires the parameters of mean and standard deviation. The discrete level of stochastic variables can be described by the standard deviation. Moreover, a normal distribution is generally adopted for fracture size. The standard deviation of the fracture size can be calculated by estimating the maximum value and the minimum value. In this study, the effect of the discrete level of fracture size on blockiness and REV was explored. The normal distribution of fracture size has been adopted by many authors, which is an important distribution in theory and application (Pahl, 1981; Min and Jing, 2003; Priest, 2004; Song et al., 2022; Zhang et al., 2022). According to the criterion of normal distribution, the probability density function, denoted as f(x), was defined as (Wilson, 1927)
where μ is the mean, σ is the standard deviation, and σ > 0. As demonstrated in Figure 1, the shape of the curve is determined by the parameter σ. The coefficient of variation (Cv) is defined as the ratio of the standard deviation (σ) to the mean (µ). To avoid the effect of the mean, Cv can be used to represent the statistical dispersion degree of fracture size.
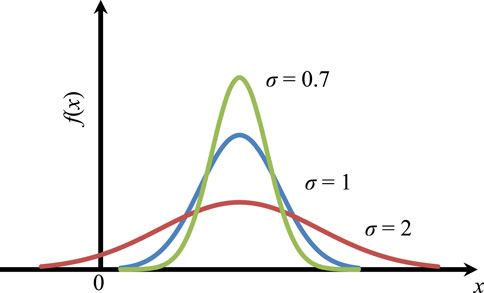
FIGURE 1. Probability density function f(x) for σ = 0.7, σ = 1, and σ = 2.
3 Blockiness and REV of rock masses
3.1 Fracture network modeling
Xia et al. (2016) developed 77 types of fractured rock mass models and calculated the 3D fracture density (d3) of these models (as illustrated in Table 1). On this basis, five types of models are selected to discuss the influence of fracture size dispersion with a normal distribution on the B and REV of rock masses. The five representative models were as follows: model I with moderate spacing and moderate persistence (MS1-MP1); model II with moderate spacing and low persistence (MS2-LP2); model III with wide spacing and high persistence (WS1-HP); model IV with wide spacing and medium persistence (WS1-MP1); and model V with wide spacing and low persistence (WS1-LP2). The domain sizes of these cubic models have side lengths ranging from 2 to 20 times the fracture spacing.
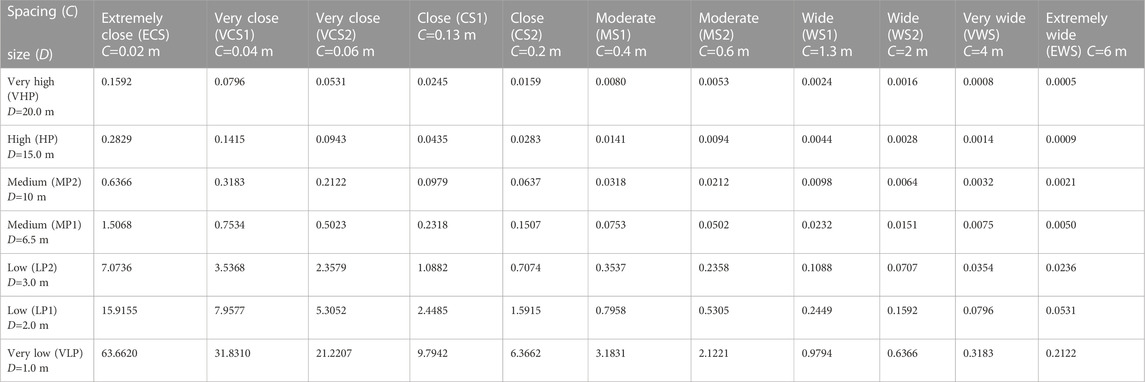
TABLE 1. Spacing, size, and 3D density (d3) of the fractures in the 77 fractured rock models. (Xia et al., 2016).
Using the principle of 3σ to measure the probability of a normal distribution within μ ± 3σ, the probability is approximately 99.7%, as given in Figure 2. That is, the probability of random numbers out of this range is negligible. Normal random variables range in value from positive to negative, whereas the fracture size cannot take negative values. We defined μ - 3σ > 0 to ensure that the value is positive. For each model, five different standard deviations were selected. The parameters of the discrete fracture networks are provided in Table 2, containing the fracture orientation, fracture occurrence, and standard deviations of fracture size. The representative fracture networks were obtained by statistical dispersions of different fracture sizes, as shown in Figure 3.
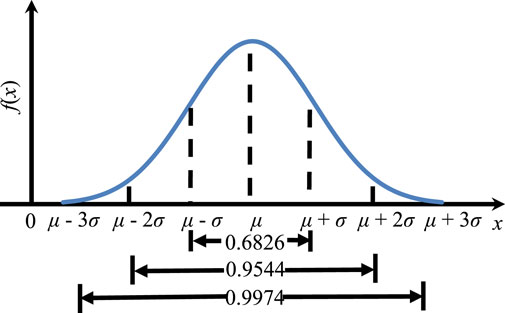
FIGURE 2. The areas under the normal density function within the ranges of μ ± σ, μ ± 2σ, and μ ± 3σ.
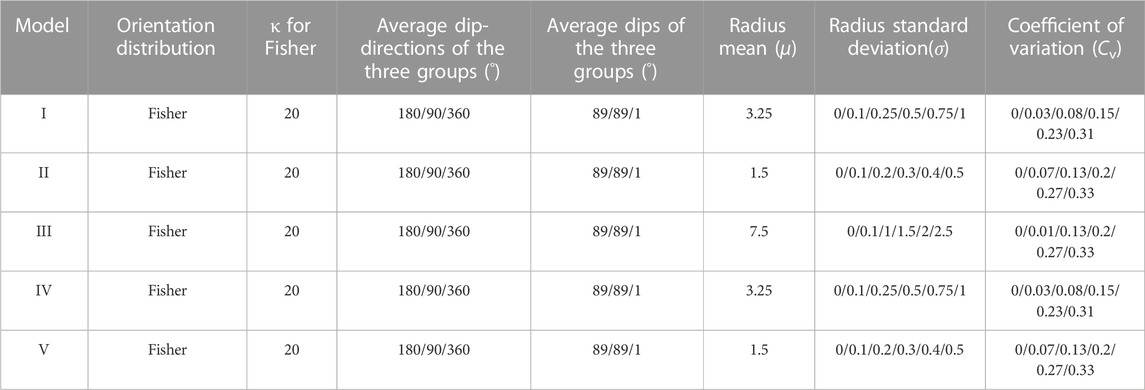
TABLE 2. Parameters of the discrete fracture network models with different means (μ), standard deviations (σ), and coefficients of variation (Cv).
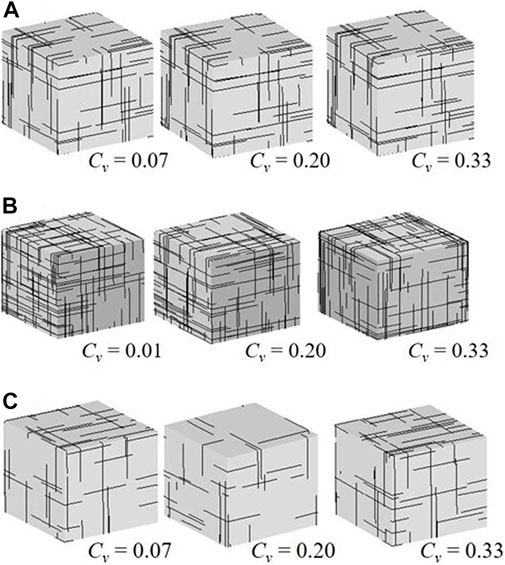
FIGURE 3. The fracture networks with different dispersions of fracture size: (A) model II, (B) model III, (C) model Ⅴ; the domain size of (A) to (C) is 3.6 × 3.6 × 3.6 m3, 18.2 × 18.2 × 18.2 m3, 2.6 × 2.6 × 2.6 m3.
3.2 Calculation of the blockiness and REV
In this study, fractures with five different standard deviations of normal distribution were considered in the simulation analysis. According to the parameters of fracture in Table 2, the domain size ranges from 2 to 20 times the spacing. A total of 4,525 fractured rock models were established. The method of multiple simulations was applied to reduce randomness. A comparison of the theoretical and simulated fracture radii of each model is presented in Table 3, for the number, mean, and standard deviation of the fractured radii. The results show that the models adopted in this work, which allow a more realistic consideration of fracture size dispersion than previous models, can capture the blockiness level well. These fractured rock models were considered reasonable. The rock model based on the fracture networks of the three models is shown in Figure 4. The number of blocks increases with the distribution dispersions of fracture size. To ignore random errors, simulations are performed 9 times at every domain size, and random values of B with 10 domain sizes of five models are obtained. The results reveal the behavior of B with domain size.
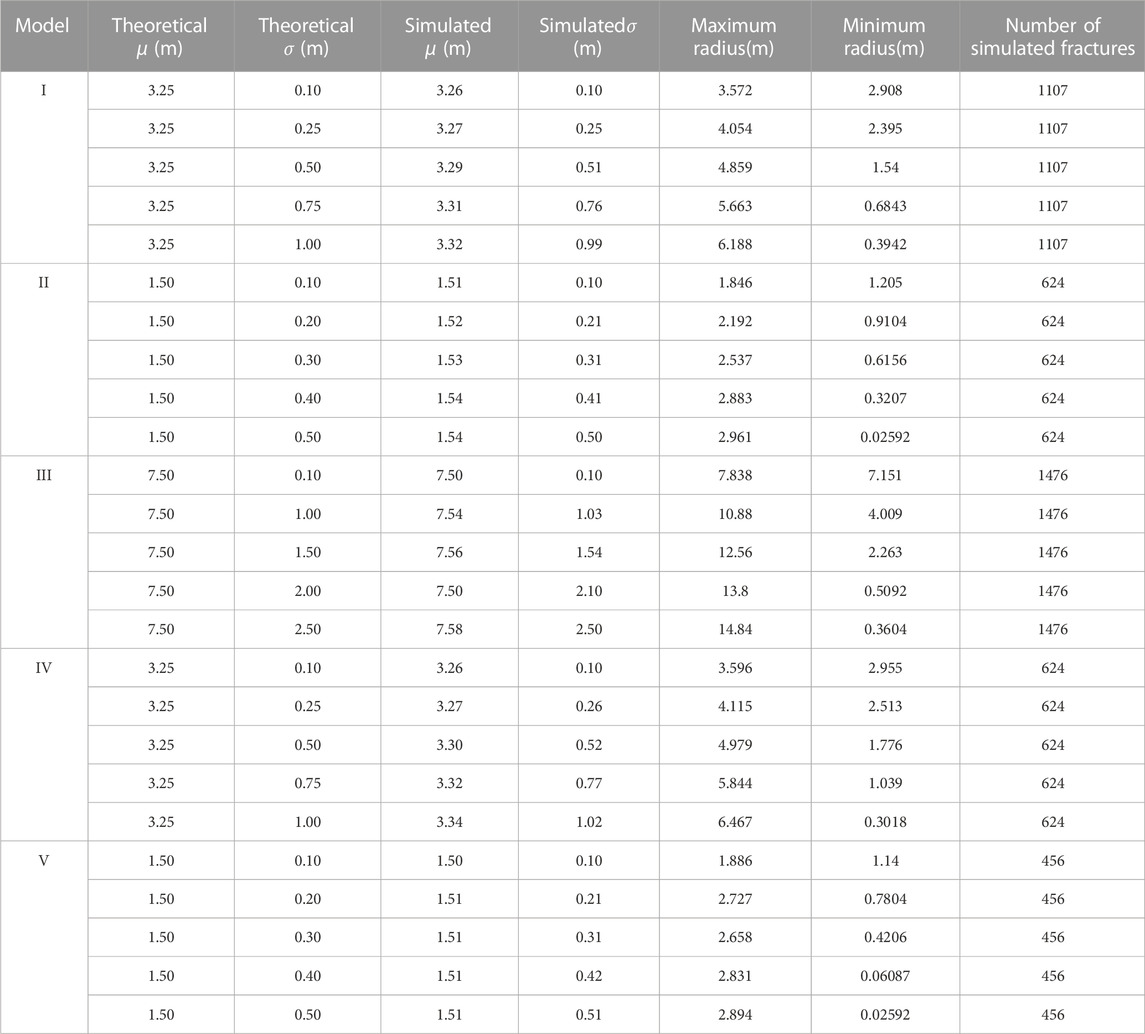
TABLE 3. Comparison between theoretical and simulated fracture radii in each model.
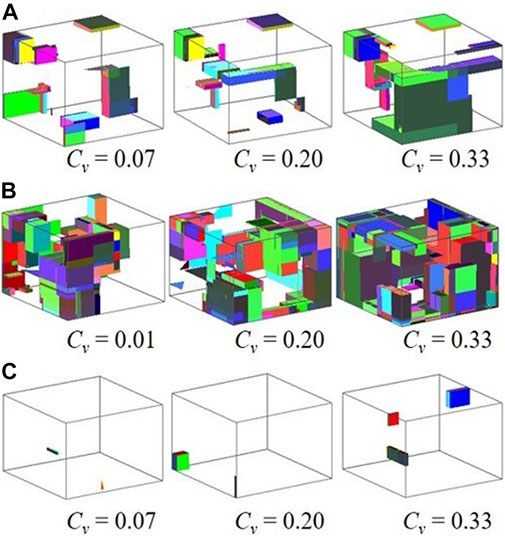
FIGURE 4. The models of rock masses produced by adopting different dispersions of fracture size: (A) model II, (B) model III, (C) model Ⅴ; the domain size of (A)-(C) is 3.6 m3 × 3.6 m3 × 3.6 m3, 18.2 m3 × 18.2 m3 × 18.2 m3, 2.6 m3 × 2.6 m3 × 2.6 m3.
A rock mass has volumetric properties. When the volume of the rock mass reaches a certain range, the rock parameters tend to be stable; this threshold volume (the REV) can be used to represent the whole rock. When the fluctuation in B is stable, the volume of rock is defined as the REV size. In this study, the Cv and the convergent mean with multiple simulations are used to investigate the REV volume (Min et al., 2004; Song et al., 2017; Chwała and Kawa, 2021). A point was proposed that 20 realizations were sufficient for the convergence of the factor of safety (Li et al., 2022). To obtain the value of B in the rock mass, 100 random realizations were performed at the REV size of the rock models.
The convergent mean with multiple simulations was used to estimate the fragile behavior of rock (Xia and Yu, 2020). For the 77 types of models, blocks were identified by GB, and the variation in B with domain size was investigated. Every domain size of the models was realized 5 times by Xia and Yu (2020). Then, a curve that represents the average of five random realizations was drawn to show the fluctuation in B with the domain size. In this way, the REV size of these models can be calculated by the convergence level of the mean B. The B of these fractured rock masses can be determined by the REV size. Based on block theory, the analytical function relating B, C, and D can be expressed (Yu et al., 2009; Xia and Yu, 2020; Cheng et al., 2021)
where L is the ratio of D to C; D is the fracture diameter, m; C is the fracture spacing, m; and α and β were calculated as α = −0.000176 and β = 3.42. The value of B in this equation is simulated under the circumstances that the fracture size is equal. It is worth considering how many random simulations of models can bring the random results close to a true value (Liu et al., 2019). To explore this issue, the experiment involved tossing a coin via a computer simulation. As shown in Figure 5, a coin tossed multiple times can land on either side with equal probability until 69 coins have been tossed. Only then will the coin have a 90% within the range from 0.4 to 0.6. To obtain an accurate B value, 100 random operations were performed in 10 different volume domains of 77 rock models. Then, this equation has new factors: α = −0.00656 and β = 2.15509.
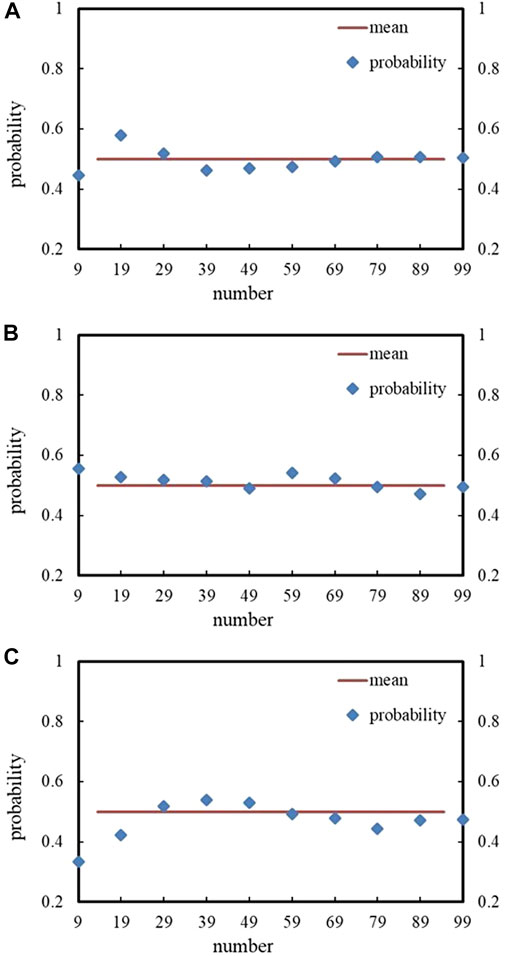
FIGURE 5. The 3 trials of random coin tossing from (A–C).
The value of B was determined by the coefficient of variation and the convergent mean method with multiple simulations. The B value for 100 calculations of the 77 types of models is shown in Table 4 when the fracture size is constant. A total of 77,000 calculations are performed. The detailed data is contained in Supplementary Data S2 of the supplementary material. The value of B with 100 calculations slightly changed, compared with the findings by Xia and Yu (2020). The S-shaped curve of B with 100 calculations of the 77 models is shown in Figure 6, which is consistent with the simulated results.
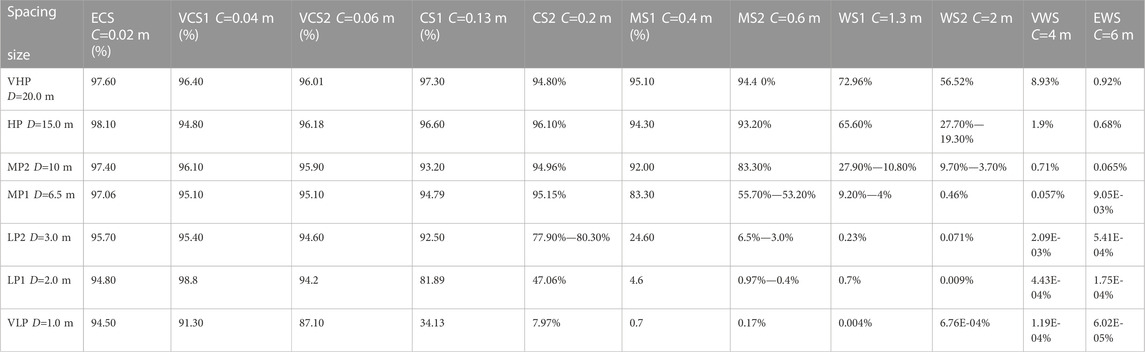
TABLE 4. The calculated blockiness results of 77 fractured rock models.
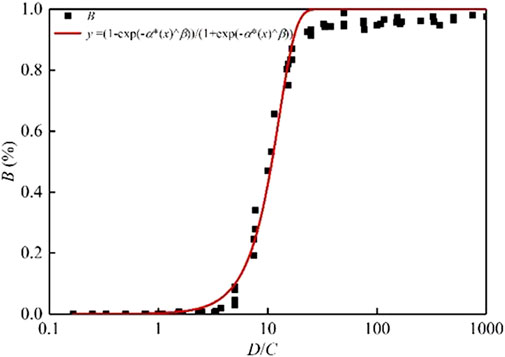
FIGURE 6. The function between blockiness, fracture diameter, and fracture spacing.
4 Relationship between distribution dispersion of fracture size and blockiness and REV
4.1 Relationship between the distribution dispersion of fracture size and REV
There are some errors in the construction of stochastic discrete fracture networks, which can be reduced by multiple realizations (Wei et al., 2020). For the fracture network model, 10 ranges of rock volumes were considered to investigate the blockiness level. Nine simulations of the models were carried out within each rock volume, and nine blockiness values were obtained. The average of the nine blockiness results was taken as the blockiness level of the rock masses. There exists a size effect for the blockiness level of the rock mass. The blockiness level gradually becomes stable when the volume size of the rock masses reaches a certain condition. The coefficient of variation method is currently used to evaluate the stability of multiple stochastic simulations (Min and Jing, 2003; Wei et al., 2020; Wang et al., 2022c; Wu et al., 2022). The calculated data from random simulations are considered more reliable when the coefficient of variation of the multiple simulations keeps less than 10%, 5%, or 2%. Alternatively, visual observation of the mean value of multiple simulations is a way to evaluate the stability. In this study, the B value was determined with the coefficient of variation and the convergent mean with multiple simulations. When the simulation results of the rock model are stable with the volume of the rock, the minimum volume is considered to be the REV volume of the rock. The size of the rock volume can be represented by a multiple of the fracture spacing. In this study, the multiple of the fracture spacing was used to describe the REV size of the rock masses. For different distribution dispersions of fracture size, the diagram of the B value within the domain size is drawn in Figure 7. The horizontal coordinate is the ratio of the length of the rock side to the fracture spacing, representing the size of the rock volume. The vertical coordinate is the blockiness, representing the fragmentation degree of the rock. As can be seen, the fluctuations of the curves are largely unaffected by the distribution dispersion of fracture size. REV size is the rock volume when B tends to be stable with the increase in domain size. The lengths of models I–V have REV sizes varying from 10, 6, 14, 6, and 4 times the fracture spacing, respectively.
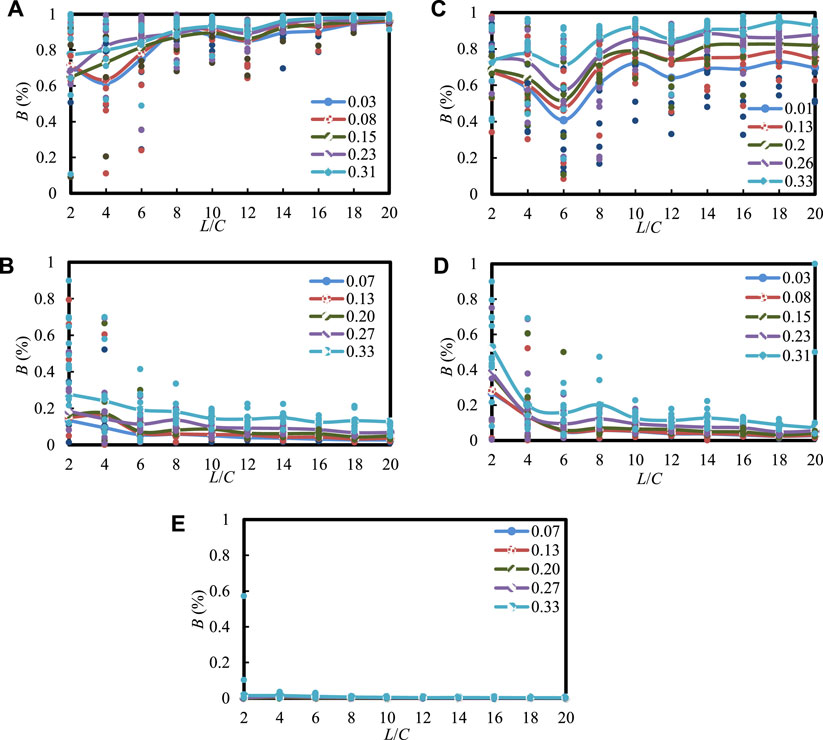
FIGURE 7. The relationships between B and the domain size of the five models: models of (A–E) is I to V.
4.2 Relationship between distribution dispersion of fracture size and blockiness
The B value of these fractured rock masses can be decided at the REV size. When the distribution of fracture size is normal, the length of models I–V at REV size is correspondingly 10, 6, 14, 6, and 4 times the fracture spacing. Thus, we take 100 random realizations at REV size. The detailed data is contained in Supplementary Data S1 of the supplementary material. The fluctuation in B with the coefficient of variation of fracture size is shown in Figure 8. The curve represents the average of 100 random realizations. The B value increases with the Cv of the fracture size. As shown in Figure 8A, the B of model I increases from 84.69% to 91.14%. As shown in Figure 8B, the B of model II increases from 9.39% to 29.17%. As shown in Figure 8C, the B of the model III increases from 63.51% to 89.70%. As shown in Figure 8D, the B of the model IV increases from 9.24% to 27.49%. As shown in Figure 8E, the B of the model V increases from 0.52% to 2.04%.
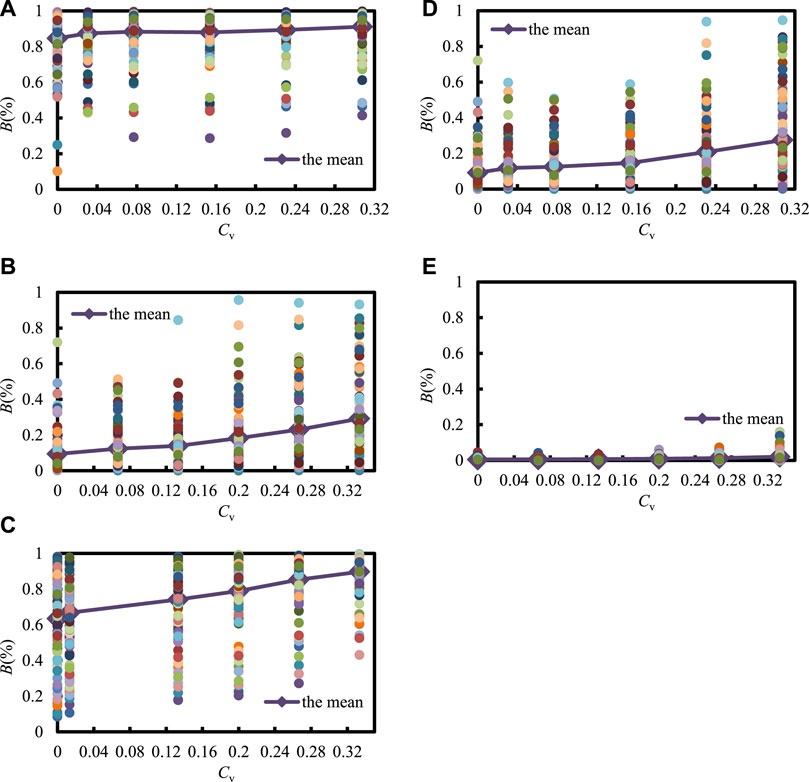
FIGURE 8. The relationships between B and the dispersion of fracture size (Cv): (A–E) is model I–V, the domain size of model I to Ⅴ is 4 m3 × 4 m3 × 4 m3, 3.6 m3 × 3.6 m3 × 3.6 m3, 18.2 m3 × 18.2 m3 × 18.2 m3, 7.8 m3 × 7.8 m3 × 7.8 m3, 2.6 × 2.6 × 2.6 m3.
If the distribution dispersion of the fracture size is higher, the rock has a higher blockiness level. The distribution dispersion of fracture size is important to influence the B of rock. As shown in Figure 8, the relationship between B and Cv is a linear curve. To explore the simulated relationship, the calculated results were fitted by computer tools. The equations describing the relationship between B and the distribution dispersion of fracture size corresponding to models Ⅰ to Ⅴ were
where Cv is the coefficient of variation of fracture size; and R2 is the relative coefficient. The R2 of these expressions ranges from 0.8 to 1, which means that the abovementioned functions match the data and trend change closely. Moreover, all of these equations can be summarized by
where k is the slope, Cv is the coefficient of variation of fracture size, and B0 is the intercept. Among these values, k represents the growth rate of increase in B with the distribution dispersion of fracture size, and B0 is the blockiness when the fractured dispersion equals 0. The B0 value in this equation can be determined by calculated data corresponding to equal fracture sizes. Namely, B0 can be obtained from Table 4, and it is fairly consistent with these models. Equation 4 indicates that this function has a non-deterministic parameter. The Cv of the fracture size is defined as the ratio of standard deviation to the mean fracture size. Namely, it interprets the fracture size and relates it to the fracture diameter. As provided in Table 3, the value of B0 can be effectively computed, whereas the relationship between k and the distribution dispersion of fracture size needs to be further validated. Since k can be assumed to capture the effects of fracture size and spacing, the 2D relationship among k, fracture diameter, and fracture spacing is depicted in Figure 9:
where L is the ratio of D to C; and R2 is the relative coefficient. Equation 5 is a standard quadratic polynomial function. Here, R2 can reach 0.99273, which means that k has a reasonably high correlation with fracture spacing and diameter via this function. Combining Eqs 2, 4, 5, a new function between B, Cv, and L capturing the effect of fracture spacing and fracture diameter can be determined:
where L is the ratio of D to C; α = −0.00656 and β = 2.15509.
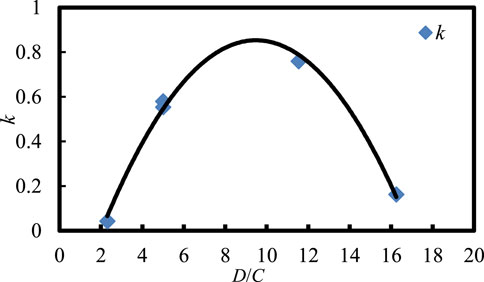
FIGURE 9. The 2D curve among k, fracture diameter (D), and fracture spacing (C).
5 Conclusion
The size and statistical distribution of fractures are key factors that determine the structural integrity and blockiness level of a rock mass. To discuss the influence of the distribution dispersion of fracture size on the B and REV of fractured rock masses, five standard deviations of fracture size with a normal distribution were considered. Based on 77 rock models, five typical fractured rock models were built. To take into account randomness, 10 volume domains of each model were studied and nine random operations were performed. To obtain an accurate B value, 100 random operations were carried out in the REV size domain. The main research results are as follows:
(1) The blockiness converges gradually with increasing rock volume when the fracture size is normally distributed. The simulated results show that the REV size of these models remains constant with the increasing dispersion level of fracture size. Namely rock REV is insensitive to the distribution dispersion of fracture size when the fracture diameter is constant.
(2) The blockiness increases slightly with the distribution dispersion of fracture size. The numerical analysis shows that there is a positive linear correlation between B and the coefficient of variation of fracture size. The relationship between the growth rate of increase in B (k) and the ratio of fracture size to fracture spacing (L) is a parabolic curve. This formula for the fracture spacing, fracture diameter, and dispersion of fracture size in relation to the blockiness level provides a means of calculating the blockiness level of a rock mass. The blockiness level of 77 fractured rock masses provides data to support the study of rock masses.
(3) Note that the proposed extended equation is generally applicable only when the fracture size of the five models satisfies the normal distribution, and its exact relationship needs to be further verified by constructing more fractured rock models. In addition, there is more than one commonly distributed form of fracture size. The influence of the distributed forms of fracture size on the rock masses is subject to further study.
Data availability statement
The original contributions presented in the study are included in the article/Supplementary Material, further inquiries can be directed to the corresponding author.
Author contributions
LX and TM contributed to the methodology, validation, analysis, and investigation of this study. TM was responsible for resources, and data of the work. Supervision and project administration were performed by LX. Both authors contributed to the writing and editing of the manuscript. All the authors have read and agreed to submit the manuscript.
Funding
This study was financially supported by the National Natural Science Foundation of China (Nos. 41802248 and 40772208).
Conflict of interest
The authors declare that the research was conducted in the absence of any commercial or financial relationships that could be construed as a potential conflict of interest.
Publisher’s note
All claims expressed in this article are solely those of the authors and do not necessarily represent those of their affiliated organizations, or those of the publisher, the editors and the reviewers. Any product that may be evaluated in this article, or claim that may be made by its manufacturer, is not guaranteed or endorsed by the publisher.
Supplementary material
The Supplementary Material for this article can be found online at: https://www.frontiersin.org/articles/10.3389/feart.2023.1128167/full#supplementary-material
References
Ajayi, K. M., Shahbazi, K., Tukkaraja, P., and Katzenstein, K. (2018). A discrete model for prediction of radon flux from fractured rocks. J. Rock Mech. Geotechnical Eng. 10 (5), 879–892. doi:10.1016/j.jrmge.2018.02.009
Aler, J., DuMouza, J., and Arnould, M. (1996). Measurement of the fragmentation efficiency of rock mass blasting and its mining applications. Int. J. Rock Mech. Min. Sci. 33 (2), 125–139. doi:10.1016/0148-9062(95)00054-2
Baecher, G., and Lanney, N. (1978). Trace length biases in joint surveys. Int. J. Rock Mech. Min. Sci. Geomechanics Abstr. 16 (1), 56–65. doi:10.1016/0148-9062(79)90799-X
Barton, N. (1979). Suggested methods for the quantitative description of discontinuities in rock masses: International society for rock mechanics, commission for standardisation of laboratory and field tests int J rock mech Min sci. Int. J. Rock Mech. Min. Sci. Geomechanics Abstr. 15, 319–368. doi:10.1016/0148-9062(78)91472-9
Chen, Q., Wang, S., Yin, T., and Niu, W. (2021). Improvement of the concept of the blockiness level of rock masses. Arabian J. Geosciences 14 (2), 84. doi:10.1007/s12517-020-06374-8
Cheng, X. L., Liu, L. P., Xiao, J., Zhang, Q. H., Xue, J., and Wang, Y. (2021). A general block stability analysis algorithm for arbitrary block shapes. Front. Earth Sci. 9. doi:10.3389/feart.2021.723320
Chwała, M., and Kawa, M. (2021). Random failure mechanism method for assessment of working platform bearing capacity with a linear trend in undrained shear strength. J. Rock Mech. Geotechnical Eng. 13 (6), 1513–1530. doi:10.1016/j.jrmge.2021.06.004
Dershowitz, W. S., and Einstein, H. H. (1988). Characterizing rock joint geometry with joint system models. Rock Mech. Rock Eng. 21 (1), 21–51. doi:10.1007/BF01019674
Elmouttie, M. K., and Poropat, G. V. (2011). A method to estimate in situ block size distribution. Rock Mech. Rock Eng. 45 (3), 401–407. doi:10.1007/s00603-011-0175-0
Giwelli, A. A., Sakaguchi, K., and Matsuki, K. (2009). Experimental study of the effect of fracture size on closure behavior of a tensile fracture under normal stress. Int. J. Rock Mech. Min. Sci. 46 (3), 462–470. doi:10.1016/j.ijrmms.2008.11.008
Hu, H., Xia, B., Luo, Y., and Gao, Y. (2022). Effect of crack angle and length on mechanical and ultrasonic properties for the single cracked sandstone under triaxial stress loading-unloading. Front. Earth Sci. 10, 900238. doi:10.3389/feart.2022.900238
Huang, H., Shen, J., Chen, Q., and Karakus, M. (2020). Estimation of REV for fractured rock masses based on Geological Strength Index. Int. J. Rock Mech. Min. Sci. 126, 104179. doi:10.1016/j.ijrmms.2019.104179
Kalenchuk, K. S., Diederichs, M. S., and McKinnon, S. (2006). Characterizing block geometry in jointed rockmasses. Int. J. Rock Mech. Min. Sci. 43 (8), 1212–1225. doi:10.1016/j.ijrmms.2006.04.004
La Pointe, P. R., Wallmann, P. C., and Dershowitz, W. S. (1993). Stochastic estimation of fracture size through simulated sampling. Int. J. Rock Mech. Min. Sci. Geomechanics Abstr. 30 (7), 1611–1617. doi:10.1016/0148-9062(93)90165-A
Lang, P. S., Paluszny, A., and Zimmerman, R. W. (2014). Permeability tensor of three-dimensional fractured porous rock and a comparison to trace map predictions. J. Geophys. Res. Solid Earth 119 (8), 6288–6307. doi:10.1002/2014jb011027
Lei, Z., Wu, B., Wu, S., Nie, Y., Cheng, S., and Zhang, C. (2022). A material point-finite element (MPM-FEM) model for simulating three-dimensional soil-structure interactions with the hybrid contact method. Comput. Geotechnics 152, 105009. doi:10.1016/j.compgeo.2022.105009
Li, J. H., and Zhang, L. M. (2011). Connectivity of a network of random discontinuities. Comput. Geotechnics 38 (2), 217–226. doi:10.1016/j.compgeo.2010.11.010
Li, X., Liu, J., Gong, W., Xu, Y., and Bowa, V. M. (2022). A discrete fracture network based modeling scheme for analyzing the stability of highly fractured rock slope. Comput. Geotechnics 141, 104558. doi:10.1016/j.compgeo.2021.104558
Lin, S.-Q., Wang, G.-J., Liu, W.-L., Zhao, B., Shen, Y.-M., Wang, M.-L., et al. (2022). Regional distribution and causes of global mine tailings dam failures. Metals 12 (6), 905. doi:10.3390/met12060905
Liu, Y., Wang, Q., Chen, J., and Song, S. (2019). Identification of the representative volume element at the maji dam site based on a multisample nonparametric test. Rock Mech. Rock Eng. 52 (5), 1287–1301. doi:10.1007/s00603-018-1664-1
Long, J. C. S., and Billaux, D. M. (1987). From field data to fracture network modeling: An example incorporating spatial structure. Water Resour. Res. 23 (7), 1201–1216. doi:10.1029/WR023i007p01201
Ma, K., and Liu, G. (2022). Three-dimensional discontinuous deformation analysis of failure mechanisms and movement characteristics of slope rockfalls. Rock Mech. Rock Eng. 55 (1), 275–296. doi:10.1007/s00603-021-02656-z
Min, K.-B., and Jing, L. (2003). Numerical determination of the equivalent elastic compliance tensor for fractured rock masses using the distinct element method. Int. J. Rock Mech. Min. Sci. 40 (6), 795–816. doi:10.1016/S1365-1609(03)00038-8
Min, K.-B., Jing, L., and Stephansson, O. (2004). Determining the equivalent permeability tensor for fractured rock masses using a stochastic REV approach: Method and application to the field data from Sellafield, UK. Hydrogeology J. 12 (5), 497–510. doi:10.1007/s10040-004-0331-7
Neuman, S. (1989). Stochastic continuum representation of fractured rock permeability as an alternative to the REV and fracture network concepts. Int. J. Rock Mech. Min. Sci. 26 (2), 331–362. doi:10.1016/0148-9062(89)90133-2
Ni, P., Wang, S., Wang, C., and Zhang, S. (2017). Estimation of REV size for fractured rock mass based on damage coefficient. Rock Mech. Rock Eng. 50 (3), 555–570. doi:10.1007/s00603-016-1122-x
Pahl, P. J. (1981). Estimating the mean length of discontinuity traces. Int. J. Rock Mech. Min. Sci. 18 (3), 221–228. doi:10.1016/0148-9062(81)90976-1
Priest, S. D. (2004). Determination of discontinuity size distributions from scanline data. Rock Mech. Rock Eng. 37 (5), 347–368. doi:10.1007/s00603-004-0035-2
Priest, S. D., and Hudson, J. A. (1976). Discontinuity spacings in rock. Int. J. Rock Mech. Min. Sci. Geomechanics Abstr. 13 (5), 135–148. doi:10.1016/0148-9062(76)90818-4
Shahami, M. H., Bafghi, A. Y., and Marji, M. F. (2019). Investigating the effect of external forces on the displacement accuracy of discontinuous deformation analysis (DDA) method. Comput. Geotechnics 111, 313–323. doi:10.1016/j.compgeo.2019.03.025
Song, K., Yang, H., Xie, J., and Karekal, S. (2022). An optimization methodology of cutter-spacing for efficient mechanical breaking of jointed rock mass. Rock Mech. Rock Eng. 55 (6), 3301–3316. doi:10.1007/s00603-022-02806-x
Song, S., Sun, F., Chen, J., Zhang, W., Han, X., and Zhang, X. (2017). Determination of RVE size based on the 3D fracture persistence. J. Eng. Geol. Hydrogeology 50 (1), 60–68. doi:10.1144/qjegh2016-127
Wang, G., Hu, B., Tian, S., Ai, M., Liu, W., and Kong, X. (2021). Seepage field characteristic and stability analysis of tailings dam under action of chemical solution. Sci. Rep. 11 (1), 4073. doi:10.1038/s41598-021-83671-6
Wang, G., Tian, S., Hu, B., Xu, Z., Chen, J., and Kong, X. (2019). Evolution pattern of tailings flow from dam failure and the buffering effect of debris blocking dams. Water 11 (11), 2388. doi:10.3390/w11112388
Wang, G., Zhao, B., Lan, R., Liu, D., Wu, B., Li, Y., et al. (2022a). Experimental study on failure model of tailing dam overtopping under heavy rainfall. Lithosphere 2022 (10), 5922501. doi:10.2113/2022/5922501
Wang, G., Zhao, B., Wu, B., Wang, M., Liu, W., Zhou, H., et al. (2022b). Research on the macro-mesoscopic response mechanism of multisphere approximated heteromorphic tailing particles. Lithosphere 2022 (10), 1977890. doi:10.2113/2022/1977890
Wang, G., Zhao, B., Wu, B., Zhang, C., and Liu, W. (2022c). Intelligent prediction of slope stability based on visual exploratory data analysis of 77 in situ cases. Int. J. Min. Sci. Technol. 33, 47–59. doi:10.1016/j.ijmst.2022.07.002
Wang, L. G., Yamashita, S., Sugimoto, F., Pan, C., and Tan, G. (2003). A methodology for predicting the in situ size and shape distribution of rock blocks. Rock Mech. Rock Eng. 36 (2), 121–142. doi:10.1007/s00603-002-0039-8
Wang, M., Kulatilake, P. H. S. W., Um, J., and Narvaiz, J. (2002). Estimation of REV size and three-dimensional hydraulic conductivity tensor for a fractured rock mass through a single well packer test and discrete fracture fluid flow modeling. Int. J. Rock Mech. Min. Sci. 39, 887–904. doi:10.1016/S1365-1609(02)00067-9
Wang, Z., Li, W., Bi, L., Qiao, L., Liu, R., and Liu, J. (2018). Estimation of the REV size and equivalent permeability coefficient of fractured rock masses with an emphasis on comparing the radial and unidirectional flow configurations. Rock Mech. Rock Eng. 51 (5), 1457–1471. doi:10.1007/s00603-018-1422-4
Wei, X., Guo, Y., Cheng, H., Wei, J., Zhang, L., Huo, L., et al. (2020). Estimation of fracture geometry parameters and characterization of rock mass structure for the beishan area, China. Acta Geol. Sin. - Engl. Ed. 94 (5), 1381–1392. doi:10.1111/1755-6724.13824
Wilson, E. B. (1927). Probable inference, the law of succession and statistical inference. J. Am. Stat. Assoc. 22 (158), 209–212. doi:10.1080/01621459.1927.10502953
Wu, S., Zhao, G., and Wu, B. (2022). Real-time prediction of the mechanical behavior of suction caisson during installation process using GA-BP neural network. Eng. Appl. Artif. Intell. 116, 105475. doi:10.1016/j.engappai.2022.105475
Xia, L., and Yu, Q. (2020). Numerical investigations of blockiness of fractured rocks based on fracture spacing and disc diameter. Int. J. Geomechanics 20 (3). doi:10.1061/(asce)gm.1943-5622.0001596
Xia, L., Zheng, Y., and Yu, Q. (2016). Estimation of the REV size for blockiness of fractured rock masses. Comput. Geotechnics 76, 83–92. doi:10.1016/j.compgeo.2016.02.016
Xiang, W. F., and Zhou, C. B. (2005). Advances in investigation of representative elementary volume for fractured rock mass. Chin. J. Rock Mech. Eng. 24 (2), 5686–5692.
Yang, Y., Wang, S., Zhang, M., and Wu, B. (2022). Identification of key blocks considering finiteness of discontinuities in tunnel engineering. Front. Earth Sci. 10. 794936. doi:10.3389/feart.2022.794936
Yu, Q., Ohnishi, Y., Xue, G., and Chen, D. (2009). A generalized procedure to identify three-dimensional rock blocks around complex excavations. Int. J. Numer. Anal. Methods Geomechanics 33 (3), 355–375. doi:10.1002/nag.720
Zhang, B., Mu, J., Zheng, J., Lv, Q., and Deng, J. (2022). A new estimation method and an anisotropy index for the deformation modulus of jointed rock masses. J. Rock Mech. Geotechnical Eng. 14 (1), 153–168. doi:10.1016/j.jrmge.2021.06.005
Zhang, L., Sherizadeh, T., Zhang, Y., Sunkpal, M., Liu, H., and Yu, Q. (2020). Stability analysis of three-dimensional rock blocks based on general block method. Comput. Geotechnics 124, 103621. doi:10.1016/j.compgeo.2020.103621
Keywords: dispersion of fracture sizes, normal distribution, representative elementary volume, blockiness, rock masses, the numerical model
Citation: Ma T and Xia L (2023) The influence of normal distribution dispersion of fracture size on blockiness and REV of fractured rock masses. Front. Earth Sci. 11:1128167. doi: 10.3389/feart.2023.1128167
Received: 20 December 2022; Accepted: 08 February 2023;
Published: 21 February 2023.
Edited by:
Guangjin Wang, Kunming University of Science and Technology, ChinaReviewed by:
Yingjie Li, China University of Mining and Technology, Beijing, ChinaWen Zhang, Jilin University, China
Copyright © 2023 Ma and Xia. This is an open-access article distributed under the terms of the Creative Commons Attribution License (CC BY). The use, distribution or reproduction in other forums is permitted, provided the original author(s) and the copyright owner(s) are credited and that the original publication in this journal is cited, in accordance with accepted academic practice. No use, distribution or reproduction is permitted which does not comply with these terms.
*Correspondence: Lu Xia, eGlhbHVAY3VnYi5lZHUuY24=