 Yulong Cui
 Wenhao Yang
 Chong Xu
 Shuai Wu1
- 1School of Civil Engineering and Architecture, Anhui University of Science and Technology, Huainan, China
- 2Ministry of Emergency Management of China, National Institute of Natural Hazards, Beijing, China
The Western Himalayan Syntaxis area is located near the Pamir Plateau. The geological structure is active and geological disasters occur frequently in this area. In this study, we employed the Google Earth platform and visual interpretation to identify ancient landslides in the region and to establish a regional ancient landslide database. Then, nine landslide-influencing factors (elevation, slope, aspect, curvature, distance to the river, distance to a glacier, lithology, distance to fault and distance to the epicenter of earthquakes above magnitude 5) were examined using ArcGIS software. The spatial distribution of landslides were analyzed statistically. Finally, an IV model and WoE model were used to evaluate the regional landslide hazard and the evaluation results were verified via a confusion matrix and a receiver operating characteristic (ROC) curve. The landslide database contained 7,947 landslides in this area with a total area of 3747.27 km2. Landslides were mostly developed at an elevation of 4,000–5,000 m, a slope of 15–25°, a north aspect, curvature of −0.33 to 0.33, distance to the water system of 1,000–2000 m, distance to a glacier of 2000–5,000 m, Permian sandstone, siltstone, argillaceous sandstone and Triassic siltstone, conglomerate and fine conglomerate, and distance to a fault of 20,000–50,000 m. The accuracy of the IV and WoE models was relatively high. The comprehensive accuracy of the confusion matrix of the two models was above 70% and the AUC value of the ROC curve was above 75%. The landslide database of the Western Himalayan Syntaxis was established and the landslide distribution and hazard assessment results can be used as a reference for landslide disaster prevention and mitigation and engineering construction planning in this area.
1 Introduction
Landslide refers to the phenomenon in which the rock and soil of a slope slide downward along a certain weakness plane under the action of gravity and other external forces form the influence of precipitation, earthquakes and slope undercutting (Varnes, 1978; Cruden and Varnes, 1996). The ancient landslides are those that occurred during the erosion period of river terraces at all levels before the Holocene and are in a relatively stable state at this stage (Lu and Xu, 1984; Xu et al., 2001). The stability of the ancient landslide is only temporary and may be revived under certain natural and human factors (Liu, 2018). Reactivated ancient landslide disasters occur frequently and often cause serious casualities and economic losses (Huang, 2009; Sassa, 2013). For example, in 2003 the Zigui Qianjiangping ancient landslide was reactivated, thereby causing many deaths and huge property damages (Li et al., 2008). In 2014, the ancient landslide of the Oso community in Washington state, United States, was reactivated, causing nearly one-fifth of the community to be buried and the deaths of more than 40 people (Zhang et al., 2018).
Regional landslide hazard assessment methods can be divided into qualitative and quantitative evaluations. Qualitative evaluation is based on engineering geological principles and related theories of geotechnical engineering combined with the experience of experts and researchers. There are two kinds of quantitative evaluation. One is evaluations based on a physico-mechanical model. The other is evaluation based on a landslide database and influencing factors using a certain model. Some common models include analytic hierarchy process (Xu et al., 2001), information value models (Saha et al., 2005), logistic regression models (Peng et al., 2009; Pirnau et al., 2017; Zhang et al., 2021), coefficient of determination models (Zhao and Chen, 2019), weight of evidence models (Dahal et al., 2008), artificial neural networks (Sadighi et al., 2020; Wen et al., 2022), random forest models (Shirvani et al., 2019) and multi-method coupling models (Chen et al., 2017). In recent years with the development of GIS and computer technology, researchers have carried out more practical researches throughout the world. Lee and Min. (2001) used logistic regression to evaluate and map the susceptibility of the Yongin landslide in Korea. Saha et al. (2005) used an IV model based on ArcGIS platform and the landslide nominal sensitivity factor to draw a landslide hazard zoning map for parts of the Himalayas. Msd et al. (2022) considered landslides within 2 km along the Thimphu-Phuentsholing highway in Bhutan; a landslide database was established; 11 influencing factors were selected; and a random forest model and logistic regression were used to evaluate the landslide hazard. Feng et al. (2016) took Chun’an County, Zhejiang Province, a southeastern coastal area as a research area. A landslide spatial database was established based on field investigation and remote sensing interpretation. Artificial neural networks, logistic regression and IV models have been used to evaluate the landslide susceptibility and the accuracy and prediction rates of the three models have been compared. Cui et al. (2021) examined the co-seismic landslides caused by the 2018 Hokkaido Mw 6.6 earthquake in Japan and a co-seismic landslide database containing 12,586 landslides was constructed based on satellite images provided by the Google Earth platform; in addition, a landslide hazard assessment was performed using a logistic regression model. Yang et al. (2022) considered Anhua, Xinhua, Taojiang, and Taoyuan in Hunan Province as the study area, and they adopted four different landslide susceptibility evaluation models in which a Bayesian algorithm was used to improve the hyper-parameters and to obtain a better result. Zhang et al. (2023) selected different areas of typical mountainous and hilly areas to construct landslide database. Then, a landslide susceptibility evaluation model is constructed based on XGBoost algorithm and landslide database, and the prediction results of the landslide susceptibility evaluation model are interpreted by SHAP algorithm.The previous studies on landslide hazard assessment have achieved good results that can be used as a reference for subsequent researches.
In recent years, with the introduction of China’s Belt and Road economic initiative, the ancient Silk Road located in the Western Himalayan Syntaxis has been revitalized. At the same time, the region is the main part of the China–Pakistan Economic Corridor. With the development of various engineering activities, new geological induced landslide disasters have emerged. The geological structure of this area is complex; the crust thickness reaches about 65 Km (Beloussov et al., 1980; Mechie et al., 2012) and many faults have also been developed. These unique geological conditions have led to the occurrence of landslides in this area that have the characteristics of being large scale, large in number and recent in formation. In this study, the ancient landslides in the Western Himalayan Syntaxis were used for analysis visual interpretation on the Google Earth platform and a database of ancient landslides was established in this area. The spatial distribution of landslides was analyzed using the ArcGIS software. On this basis, an information value model (IV) and a weight of evidence model (WoE) were used to evaluate the landslide hazard and then the two methods of confusion matrix and ROC curve were used to verify the results.
2 Geological background
The study area is located near the Pamir Plateau. It is about 366 Km long from east to west and 334 Km wide from north to south and has an area of about 119,414 Km2. The geographical coordinates are 70°–74E and 35–38N, as shown in Figure 1. In terms of topography, the regional valleys are vertically staggered and the mountains are high. The lowest altitude is 543 m; the highest is 7,674 m and the average altitude is above 4,000 m. The wide distribution of glaciers in the Pamir Plateau and the striking regional differences are caused by the layer-by-layer interception of the water vapor by the northeastern-southwestern mountains such as the Akademiya Nauk Range, the Zulu Marte Mountains, and the Sarekol Mountains. Mountain ranges with permanent snow and glaciers are interlaced with deep canyons, and various landforms formed by glacial erosion and accumulation are common.
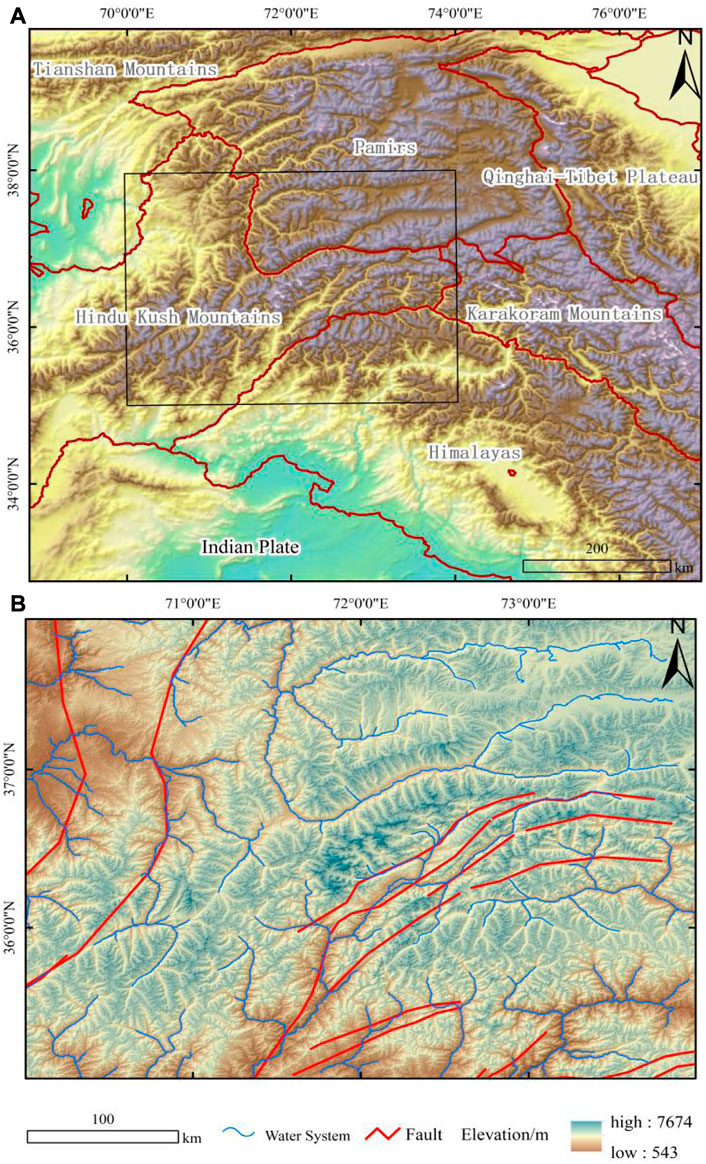
FIGURE 1. (A) Location map of the study area (B) Tectonic map of the study area.
In terms of the geological structure, the formation of the Himalayan orogenic belt was due to the collision between the Eurasian plate and the Indian plate. The northwestern corner of the Indian plate moved sharply northward and contacted the interior of the Eurasian plate, causing the landmass to rise. The region is densely faulted with strong tectonic activity. The collision of the two tectonic plates caused the disappearance of the ancient Tethys Ocean, forming a multi-massif, multi-island arc. There are four plots (island arc) in the area: North Pamir, Middle Pamir, South Pamir and the Kohistan–Ladakh arc. Dense faults serve as the dividing lines of these landmasses. The northern part of the study area is dominated by the Pamir thrust fault zone. The boundary between North and Central Pamirs is the Tanymas suture line. The Rushan–Pshart fault zone is the boundary between Central and South Pamirs. The boundary between South Pamir and the Kohistan–Ladakh arc is the main Karakoram thrust fault zone. The Yarlung Zangbo–India suture line is in the southern part of the study area. The exposed strata in the study area are complex. Specific strata and lithology are shown in Table 1.
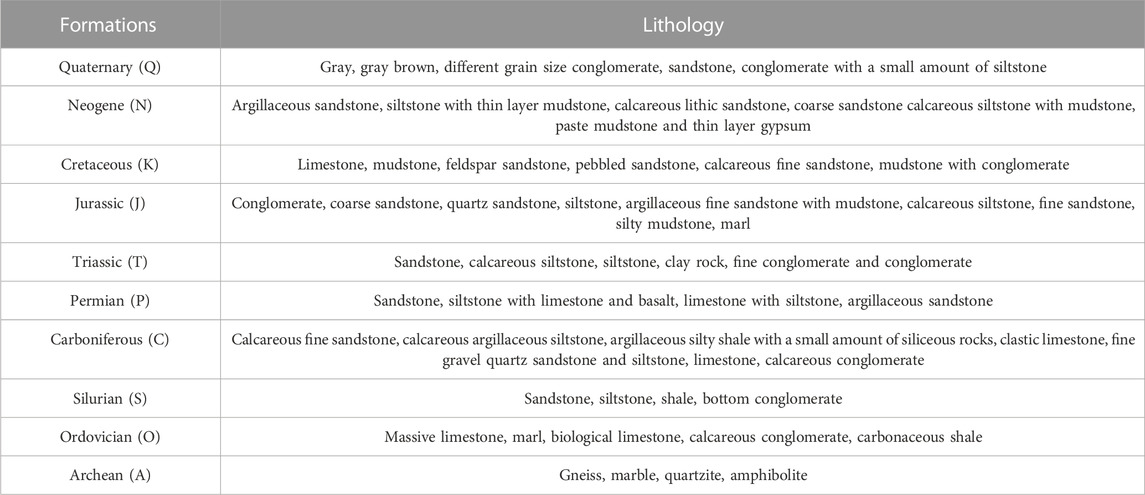
TABLE 1. Lithology in the study area.
The Pamir Plateau has a typical plateau continental climate with a long winter and large temperature differences between day and night. Due to the high mountains, the humid South Asian monsoon in the Indian Ocean cannot reach the area and the amount of precipitation is relatively small and is largely concentrated in the summer from July to September. The region has high glacier and snow coverage, high mountains and deep canyons, vertical climate zoning, and significant elevation differences.
3 Data and methods
3.1 Data
The data sources used in this study are shown in Table 2. Elevation, aspect, slope, and curvature are in raster data while river, glaciers, earthquakes, faults, and lithology are in vector data. Data extraction was completed in ArcGIS software.
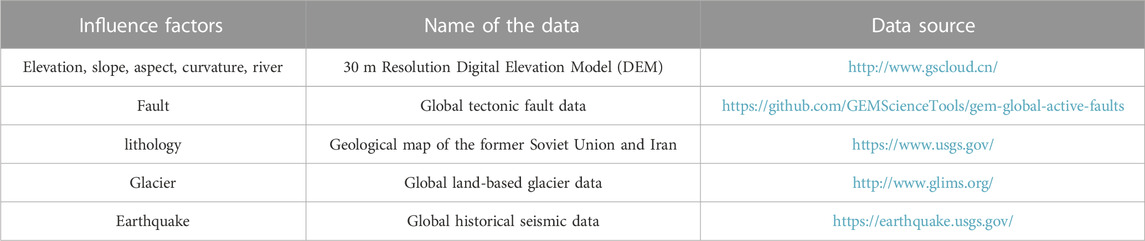
TABLE 2. Data sources.
3.2 Methods
3.2.1 Landslide interpretation method
Based on the satellite images provided by the Google Earth platform, this study used visual interpretation to delineate ancient landslides. The ancient landslides were formed a long time ago. Therefore, the identification of ancient landslides is primarily through the shape of the slope, the back wall of the landslide, the back of the landslide platform depression and landslide deposits that were artificially transformed into terraces. The interpretation of typical ancient landslides is shown in Figure 2.
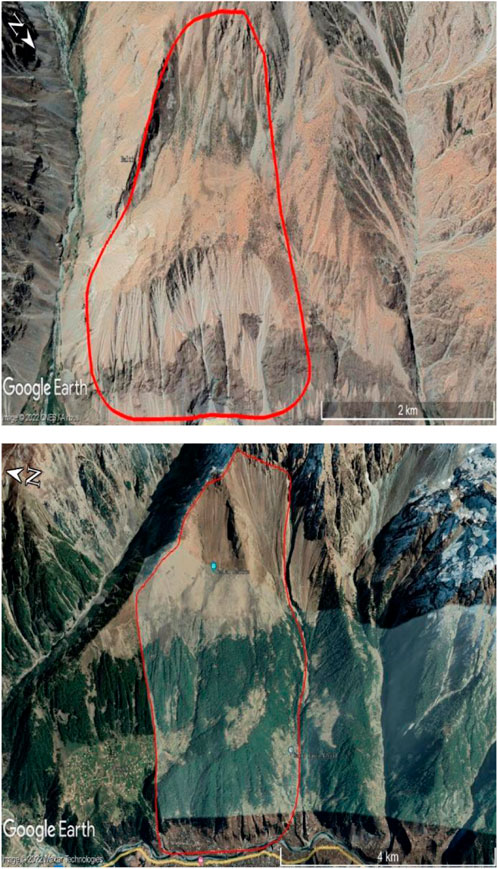
FIGURE 2. Schematic diagram of interpretation of typical ancient landslides in the study area.
3.2.2 Regular analysis method
In ArcGIS software, the nine landslide-influencing factors were selected based on DEM and geological maps: elevation, slope, aspect, curvature, distance to the river, distance to a glacier, lithology, distance to a fault, and distance to the epicenter of an earthquake above magnitude 5. For each influencing factor, two indexes of landslide number density (LND) and landslide area density (LAP) in each classification were extracted to analyze their spatial distribution. The classification of each influencing factor is shown in Table 3.
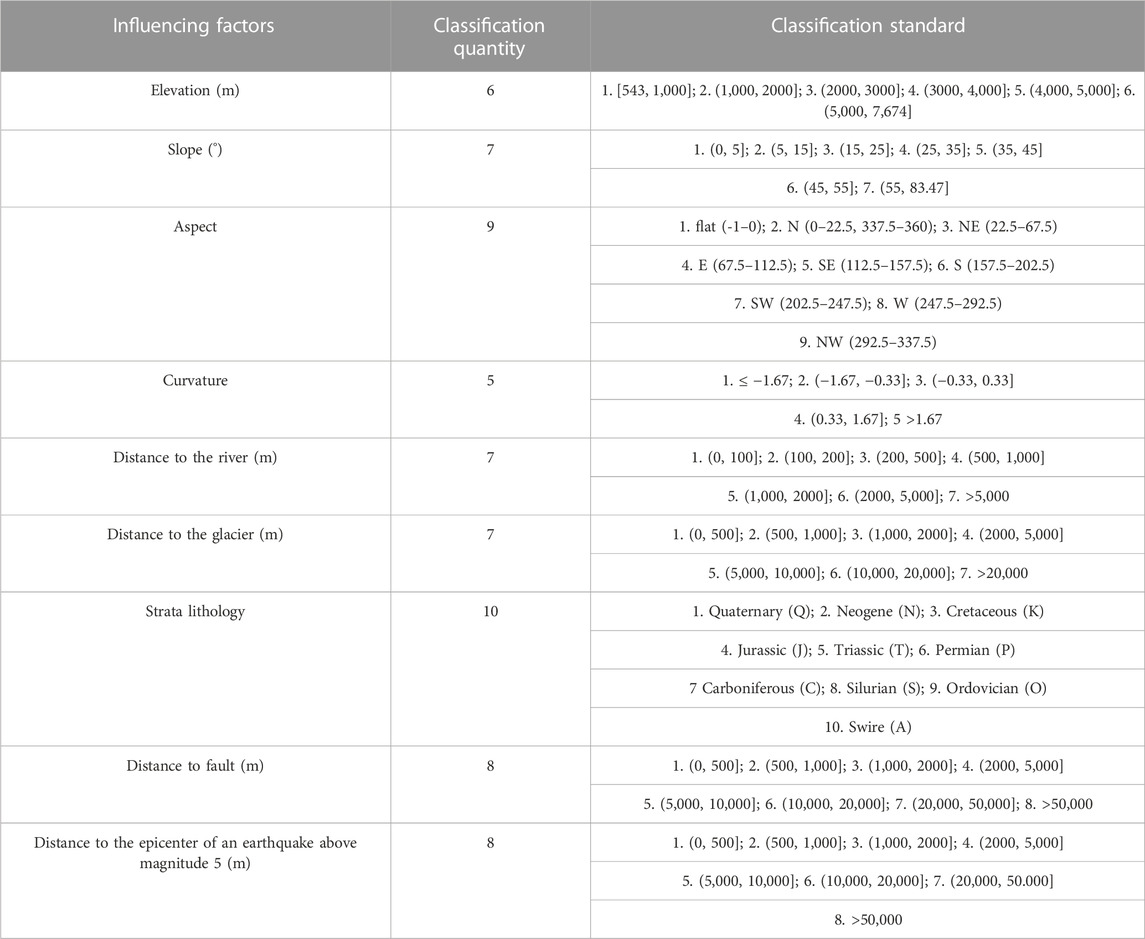
TABLE 3. Influencing factor classification table.
3.2.3 Hazard assessment methods
The IV model is a statistical forecasting method based on information theory (Jing et al., 2010). The IV model was used to combine various landslide factors to calculate the information value of each class under a certain influencing factor. The higher the information value, the higher the contribution of each factor class towards landslide occurrence (Barella et al., 2019). The model are calculated as follows:
S The number of grid cells with landslide.
N The total number landslide points (grid cells)
The WoE model is a hazard assessment model based on Bayes’ theorem. There are two assumptions in this model: the first assumption is that evaluation factors are independent of each other and the second assumption is that each evaluation factor will not change for a long period of time (Dahal et al., 2008). The model are calculated as follows:
where, A1 is the number of the landslide pixels present on a given factor class, A2 is the number of the landslide pixels not present in the given factor class, A3 is the number of the pixels in the given factor class in which no landslide pixels are present, and A4 is the number of the pixels in which neither landslide nor the given factor is present.
In recent years, IV and WoE models have been widely used in landslide hazard assessment. These models have low requirements for data and high accuracy of the results, and hence this study have used these models to carry out a regional landslide hazard assessment.
3.2.4 Validation method
There are only two cases for the occurrence of landslides, occurrence and non-occurrence and thus landslides can be considered a binary classification problem. For binary classification problems, we can use the confusion matrix and ROC curve to test the accuracy of each model’s results.
A confusion matrix, also known as an error matrix, can be used to judge the accuracy of binary classification problems. Accuracy for the landslide point value of 1, accuracy of non-landslide point value of 0 and the overall accuracy in the abovementioned model were quantitatively analyzed. The confusion matrix of each model was obtained by classifying the data of landslide points and non-landslide points using SPSS software.
The receiver operating characteristic curve is a comprehensive index reflecting the continuous variables of sensitivity and specificity. The area under the ROC curve is defined as the AUC value, and the AUC value ranges from 0 to 1. The larger the AUC value, the higher the accuracy of the model results. When using the ROC curve function in the analysis module of SPSS software, we first selected 15,894 points of 1:1 landslide points and non-landslide points. In ArcGIS software, the evaluation results of each model were assigned to point attributes and then classified. Seventy percent of the total points were randomly selected as a training set, and the remaining 30% were used as a validation set to obtain ROC curves. The flow chart of the research method is shown in Figure 3.
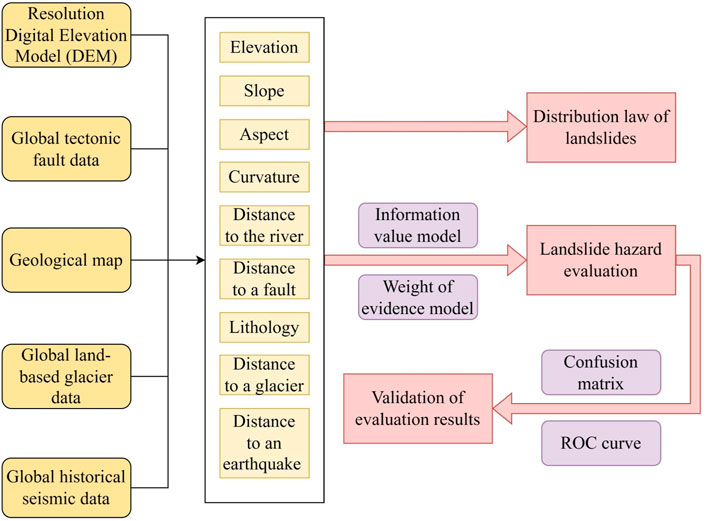
FIGURE 3. Method flow chart.
4 Results
4.1 Ancient landslide database
According to the obtained ancient landslide database, a regional landslide distribution map was produced in the ArcGIS software. Due to the large area, we used 10 Km as the search radius to construct a landslide number density map of the area (Figure 4). It can be seen from the map that the landslides are densely distributed on both sides of the Rushan–Pshart fault zone in blocks and belts, with a maximum density of 0.7894 /Km2.

FIGURE 4. LND map of ancient landslides in the study area.
There are 7,947 ancient landslides in the study area and the total area of ancient landslides is 3747.27 Km2. There were 32 landslides with a single landslide area of more than 5 Km2 and the total area of these landslides was 223.09 K m2, accounting for 0.403% of the total number of landslides and 5.95% of the total area of landslides. The area of landslides was divided into four levels: ≤0.1, 0.1–0.5, 0.5–1 and ≥1 Km2. The quantities of landslides in different areas are shown in Table 4.
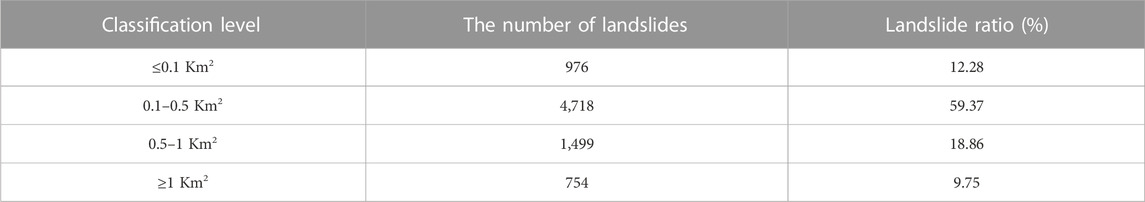
TABLE 4. Statistics of the landslides in different areas.
4.2 Distribution law of landslides
4.2.1 Topographic factors
Elevation, slope, aspect, curvature, distance to the river, and distance to a glacier are topographic factors affecting landslide occurrence. Elevation has an impact on a variety of slope stability factors, including vegetation, human activity, and many other factors that can influence the formation of landslides (Riaz et al., 2018). The stress state of the slope body is significantly influenced by slope, and a landslide catastrophe may result when the stress surpasses the failure strength (Dai et al., 2001). The aspect, which influences the development of landslides, is affected by solar energy, monsoon circulation, and various directions of geological structure movement (Chen et al., 2019). The curvature is either extremely large or extremely small, indicating that the slope’s surface curvature is extremely large, which causes a landslide catastrophe to occur (Wang et al., 2019). Rivers’ scouring and infiltration will cause the slope’s foot to slide down more readily and cause geological catastrophes like landslides (Wang et al., 2019; Sun et al., 2022). Glacial meltwater will seep into the slope’s body, decreasing the slope’s general stability.
As can be seen from Figure 5, LND and LAP increase initially and then decrease with the increase in elevation. Landslides are mainly distributed in the elevation range of 4,000–5,000 m. At this time, LND and LAP are the largest, being 0.095 /Km2 and 4.53%, respectively (Figure 5A). With the increase in slope, LND and LAP increase initially and then decrease. The landslide distribution is relatively concentrated in the slope of 15–25°, and LND and LAP reached the maximum values of 0.118/km2 and 5.65%, respectively. The landslides are concentrated in the range of 5–35°, where a large number of loose deposits are accumulated on the slope surface where the shear force and potential energy are relatively large and the slope is unstable. When the slope is greater than 55°, there are almost no landslides (Figure 5B). LND and LAP are the highest when the landslide is oriented northward, being 0.079 /Km2 and 3.60%, respectively. This is because the geological structure in the study area is protruding northward in an arc shape and the slope rock is squeezed more intensely in the north so that the damage is more pronounced and thus landslides are more likely to occur in the north (Figure 5C). LND and LAP reach their maximum values in the range of (−0.33, 0.33] at 0.086 /Km2 and 4.042%, respectively. The overall trend is to rise first and then decline, and the (−0.33, 0.33] interval is a turning point, indicating that the surface of the slope is strongly curved, far from a straight line, a situation that will lead to the development of development of landslides (Figure 5D). LND and LAP generally increase initially and then decrease with the increase in distance to the river, reaching the maximum values in the range of 200–500 m of 0.099 /Km2 and 4.34%, respectively. The number and area of landslides were the highest in the range of 2000–5,000 m from a glacier but LND and LAP were the largest in the range of 500–1,000 m from a glacier, being 0.126 /Km2 and 5.88%, respectively. LND and LAP increased initially and then decreased with the increase in the distance to the glacier; this was due to the fact that the effect of glacier meltwater on the slope have been reduced significantly with distance (Figure 5F).
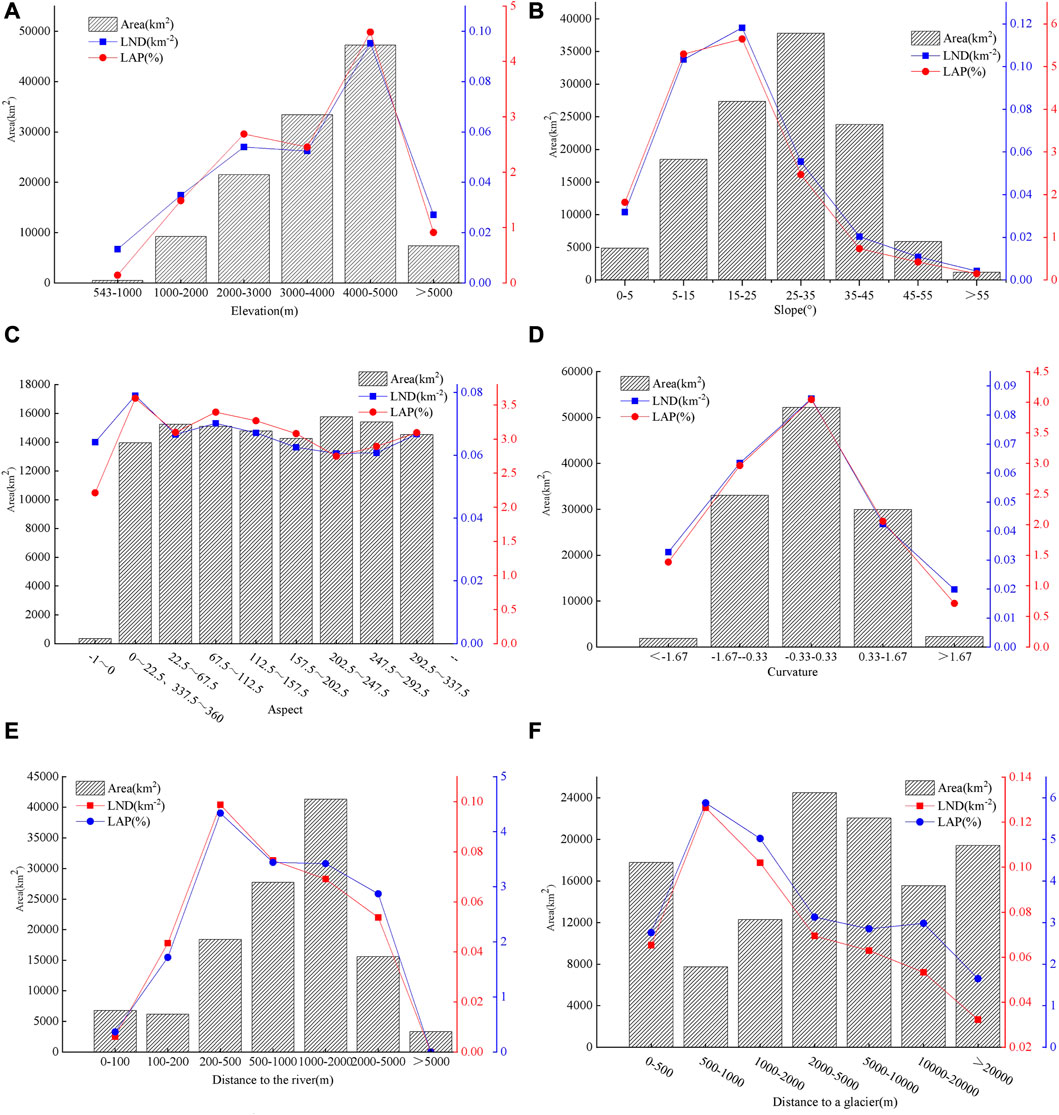
FIGURE 5. The relationships between landslides and topographic factors. (A) Landslide distribution and elevation; (B) Landslide distribution and slope; (C) Landslide distribution and aspect; (D) Landslide distribution and curvature; (E) Landslide distribution and the distance to the river; (F) Landslide distribution and the distance to the glacier.
4.2.2 Geological factors
Lithology is a geological factor affecting the spatial distribution of landslides. It is widely recognized that lithology has a significant impact on the occurrence of landslides and that changes in lithology frequently result in differences in the strength and permeability of rock and soil (Chen et al., 2019). As can be seen from Figure 6, LND and LAP were the highest when the lithology was Triassic (T), being 0.0947/km2 and 5.0467%, respectively. The second largest LND is Archean (A) at 0.09023/km2, and the second largest LAP is Permian (P) at 3.23%. The numbers and areas of ancient landslides in Permian, Triassic and Neogene were large and there were many landslides. This is because these strata are mostly argillaceous sandstone and siltstone; the mechanical properties of the rock and soil cause poor stability and thus the strata are prone to geologic related landslide disasters. However, the stratum lithology of the Triassic period had the largest LND and LAP, because there were many landslide occurrences in the Triassic period although the landslide area is relatively small.
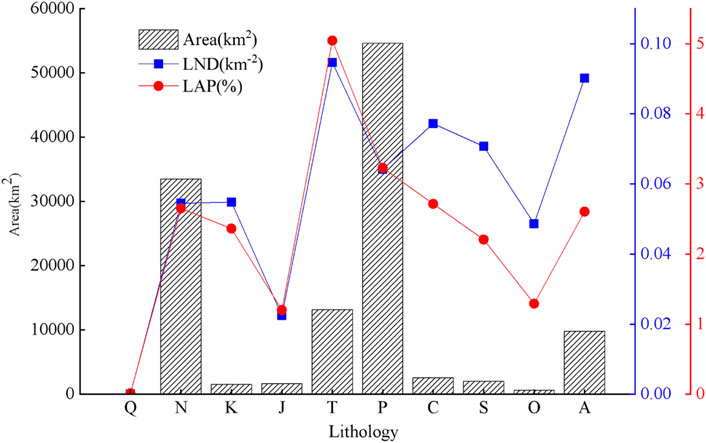
FIGURE 6. Relationship between landslide distribution and stratum lithology.
4.2.3 Earthquake factors
The distance to a fault and the distance to an earthquake epicenter above magnitude five are seismic factors affecting the development of landslides (Cui et al., 2021). As can be seen from Figure 7, LND reached the maximum value in the range of 20,000–50,000 m from a fault and showed a trend of rising initially and then decreasing. However, LAP was highest in the range of 0–500 m from the fault and showed a trend of falling first and then rising (Figure 7A). LND and LAP reached maximum values in the range of 0–500 m from the epicenters of earthquakes above 5, being 0.093 /Km2 and 14.084%, respectively and showed a downward trend as a whole and a small upward trend in some areas (Figure 7B).
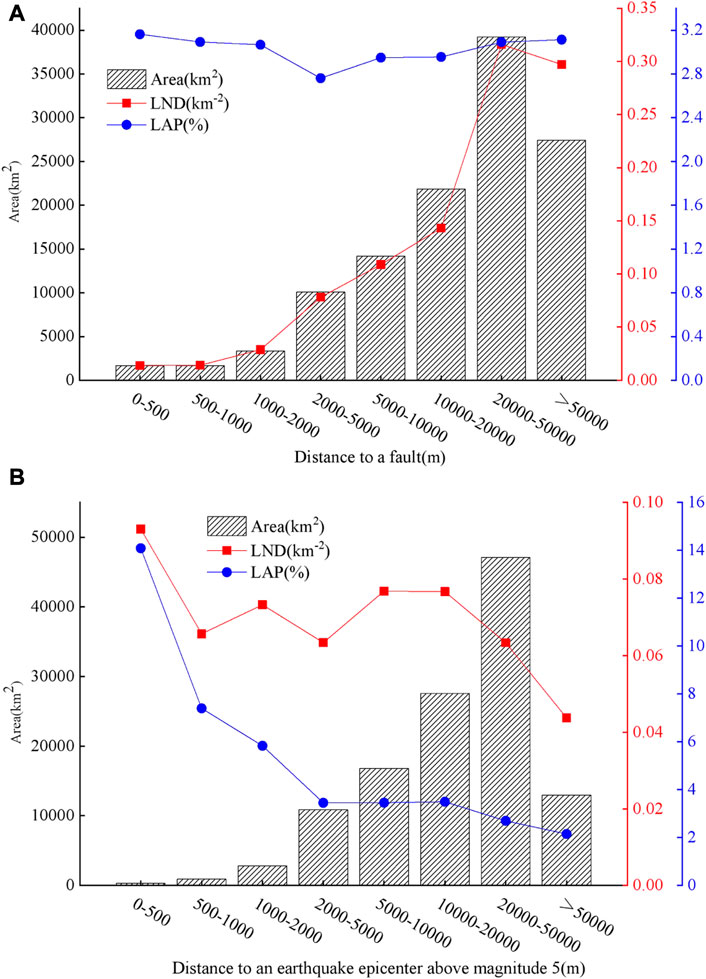
FIGURE 7. Relation between landslides and earthquake factors. (A) Landslide distribution and the distance to a fault; (B) Landslide distribution and the distance to the epicenter of an earthquake above magnitude five.
4.3 Landslide hazard evaluation results
4.3.1 Results of IV model evaluation
In ArcGIS software, an information value is added to each influencing factor and imported into their fields. Using the overlay analysis function in the Spatial Analyst tool, the information field of each influencing factor class was weighted and summed to obtain a hazard assessment map using the information value model in the study area. According to the natural discontinuity point classification method (Jenks), areas were reclassified into very low hazard (−15.132 to −2.969), low hazard (−2.969 to −1.674), medium hazard (−1.674 to −0.594), highhazard (−0.594 to 0.557) and very highhazard (0.557–3.220). The landslide hazard zoning map is shown in Figure 8.
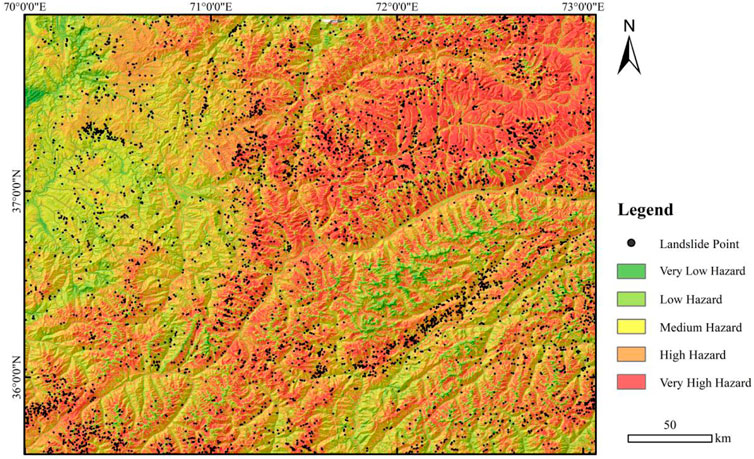
FIGURE 8. Landslide hazard zoning map based on IV model.
Then, using the Extract Multi Values to Points tool in ArcGIS software, the information model hazard reclassification grid was extracted into the ancient landslide point attribute table of the study area, that is, the assignment work was completed, and the attribute table was exported to calculate and analyze the distribution of ancient landslides in each hazard interval. As shown in Figure 9, with the increase in the degree of hazard, the number of landslides, LND and LAP have increased. The number of landslides n the very high hazard class was 4,163, accounting for 52.38% of the total number of landslides and the landslide area was 1927.6 K m2, accounting for 51.44% of the total area. LND of the extremely high-hazard area was 0.158 /Km2 and LAP was 7.296%, more than 40 times that of the very low hazard class. In general, the number of landslides, area, LND and LAP in the very high hazard class were the highest and the landslide hazard assessment results were in line with the actual landslide situation.
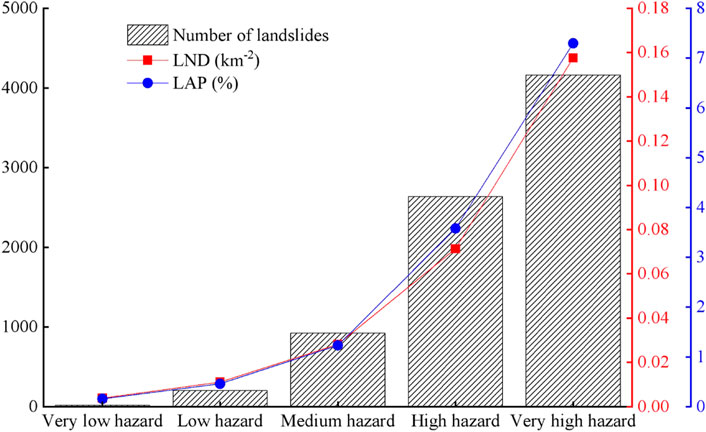
FIGURE 9. Landslide hazard statistics based on the IV model.
4.3.2 Results of WoE model evaluation
In ArcGIS software, evidence weight value are added to each influencing factor and imported into the fields separately. Using the overlay analysis function of the Spatial Analyst tool, the hazard assessment map of the ancient landslide weight of evidence model in the study area was obtained by summing the weights of evidence fields of each influencing factor. According to the natural discontinuity point classification method (Jenks), the study area was classified into five classes of very low hazard (−15.835 to −2.807), low hazard (–2.807 to −1.350), medium hazard (−1.350 to 0.021), highhazard (0.021–1.478) and very high hazard (1.478–6.021). The landslide hazard zoning map is shown in Figure 10.
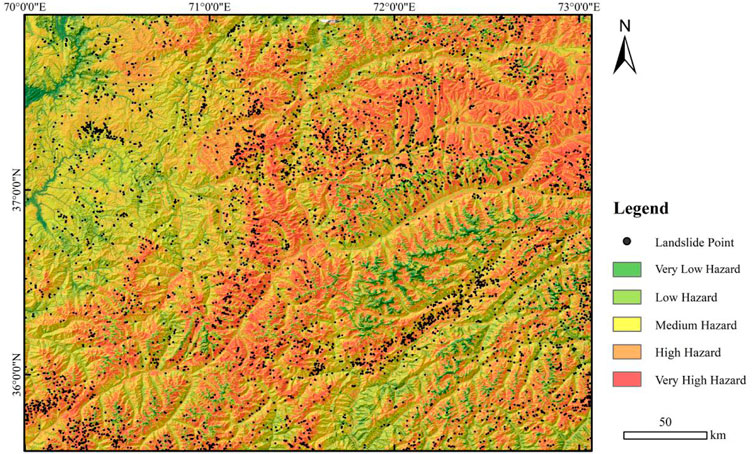
FIGURE 10. Landslide hazard zoning map based on WoE model.
Based on the zoning shown in Figure 10, the Extract Multi Values to Points tool in ArcGIS software was used to extract the WoE model hazard reclassification grid into the ancient landslide point attribute table of the study area, and the attribute table was exported to calculate and analyze the distribution of ancient landslides in each hazard interval. As shown in Figure 11, the degree of landslide hazard was proportional to the number of landslides, LND and LAP. In the very high hazard zone, the number of landslides was 3905, accounting for 49.14% of the total number of landslides. The landslide area was 1941.12 K m2, accounting for 51.8% of the total landslide area, and LND and LAP reached 0.16 /Km2 and 7.96%, respectively. The landslide in the study area was largely concentrated in the very high hazard zone/class and the hazard, and the hazard assessment results were in good agreement with the actual field observation of the landslides.
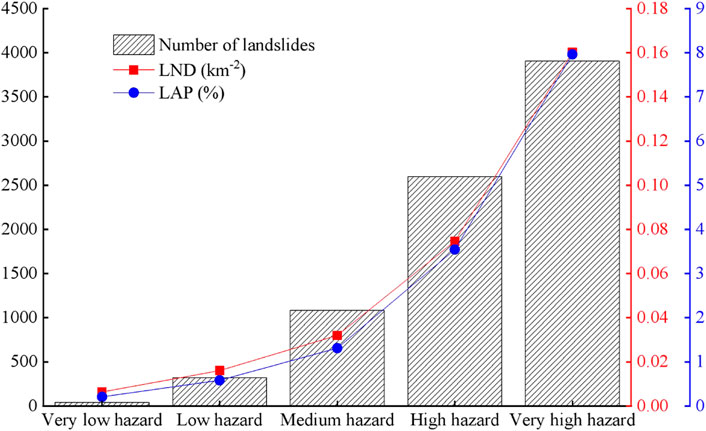
FIGURE 11. Landslide hazard statistics based on the WoE model.
4.4 Validation of evaluation results
4.4.1 Confusion matrix validation
The confusion matrix of each model was obtained by classifying the landslide point and non-sliding point data of each model in SPSS software as shown in Tables 5, 6. The comprehensive accuracy of the confusion matrix of the two models was above 70%, indicating that the abovementioned models have high accuracy for the reference values.
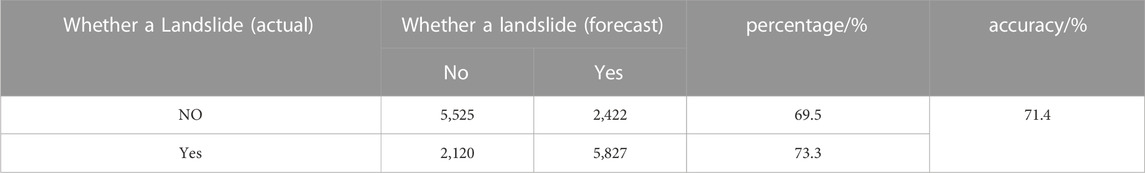
TABLE 5. Confusion matrix of the IV model.

TABLE 6. Confusion matrix of the WoE model.
4.4.2 ROC curve validation
The evaluation results of the validation sets of IV and WoE models were both above 75.0% (Figure 12). However, the accuracy of the IV model was slightly higher than that of the WoE model. The results indicate that the two models have higher accuracy for landslide evaluation in the study area, and the IV model is better than the WoE model for landslide hazard assessment in the area.
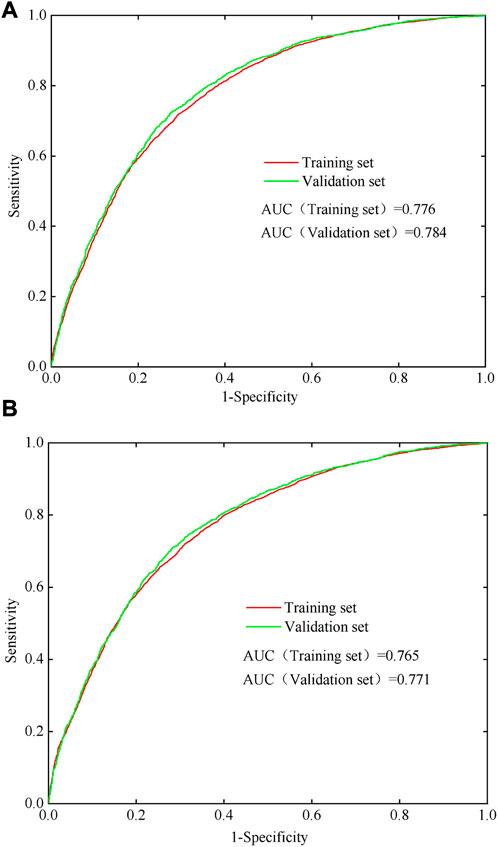
FIGURE 12. ROC curve validation diagram based on (A) IV model; (B) WoE model.
5 Discussion
Due to the harsh geographical environment and sparse population in the Western Himalayan Syntaxis, there are only few literature reports concerning landslide research. For example, Zhang et al. (2015) interpreted landslides in Badakhshan Province, Afghanistan, using an area of 44,059 Km2 and 608 landslides. Compared with the previous study, the present study has a larger scope and more landslide samples.
The evaluation of geological disasters has been carried out for many years and various methods of analysis have been developed. In this study, the IV and WoE models were used to evaluate and analyze the landslide hazard in the study area and the results were verified via a confusion matrix and ROC curve. The prediction accuracy of the IV model was higher than that of the WoE model. This finding is consistent with previous studies (Mandal et al., 2018; Singh and Kumar, 2018; Wubalem and Meten, 2020). This is because the IV model can better combine the subjective experience of experts with objective data so that the subjective evaluation is introduced into the analysis process and the accuracy is greatly improved. The WoE model is a data-driven method that avoids the intervention of subjective evaluation. Hence the prediction accuracy is not as good as the IV model. In this study, the AUC-ROC of the landslide hazard assessment based on the IV model reached 78.4%. This result was better than other cases using this model. For example, Chen et al. (2020) employed the IV model and 10 factors, namely, slope, elevation, aspect, plane curvature, profile curvature, NDVI, TWI, distance to water system, distance to road and land use. The AUC-ROC result was 73%. Aha et al. (2021) used the IV model and eight factors (slope, aspect, curvature, elevation, LULC, soil, lithology and drainage density) were used for evaluation and the AUC-ROC result was 76.09%. Achour et al. (2017) used seven factors for evaluation (lithology, slope, distance to a fault, land use, distance to the water system and geotechnical parameters) and the AUC-ROC result was 77%. The combination of the influencing factors selected in the present study was more suitable for the IV model as it has showed a better accuracy. In this study, two models were selected from among many evaluation models. In the future, more evaluation models will be selected for comparison to verify the prediction accuracy of different models.
6 Conclusion
In this study, the Western Himalayan Syntaxis was taken as the research area. Based on high-resolution satellite images provided by the Google Earth platform, a landslide interpretation was carried out by artificial visual interpretation and a landslide database for this area was established. The spatial distribution of ancient landslides in the study area was analyzed using the nine landslide influencing factors (elevation, slope, aspect, curvature, distance to the river, distance to a glacier, stratum lithology, a fault and distance, and distance to the epicenter of an earthquake above five magnitude). The landslide hazard in the study area was evaluated by the IV and WoE models. The conclusions are as follows.
(1) A total of 7,947 landslides were interpreted in the study area of 119,414 K m2, with a total area of 3747 Km2 and LND of 0.0654 /Km2. More than 87% of the ancient landslides had an area of more than 10 Km2 and the landslides in the area were mainly medium to large landslides.
(2) The regional landslides were more developed at an elevation of 4,000–5,000 m, a slope of 15–25°, a distance to the river of 200–500 m and the distance to a glacier of 500–1,000 m. Areas with a concave slope were more prone to landslides than convex slopes; northward slope (0–22.5, 337.5–360) was the dominant direction of landslide development; areas with Triassic lithology, distance from the fault 0–500 m and distance from the epicenter of an earthquake above magnitude 50–500 m were more prone to landslides.
(3) The IV and WoE models were used to evaluate the landslide hazard. The results showed that the number, area, point density, and area density of landslides in the very high hazard zone are the highest and the landslide hazard evaluation results were consistent with the actual landslide condition.
(4) A confusion matrix and an ROC curve were used to verify the results of the landslide hazard assessment. The accuracy of the confusion matrix was more than 70% and the AUC values of success rate and prediction rate from the ROC curve were higher than 0.75, indicating that the hazard assessment results were consistent with the actual landslide data. The IV model had a higher prediction accuracy than the WoE model.
Data availability statement
The original contributions presented in the study are included in the article/supplementary material further inquiries can be directed to the corresponding author.
Author contributions
YC wrote the manuscript, and he provided the methods of landslide hazard assessment in this paper. SW provided the landslides data. WY made suggestions for handling landslides data and contributed to the discussion. CX revised the complete manuscript and reviewed the references. The authors importantly contributed to write this article.
Funding
This research was supported by the National Natural Science Foundation of China (42277136), the Natural Science Research Project of the Colleges and Universities in Anhui Province (KJ2020ZD34), the National Key Research and Development Program of China (2021YFB3901205).
Conflict of interest
The authors declare that the research was conducted in the absence of any commercial or financial relationships that could be construed as a potential conflict of interest.
Publisher’s note
All claims expressed in this article are solely those of the authors and do not necessarily represent those of their affiliated organizations, or those of the publisher, the editors and the reviewers. Any product that may be evaluated in this article, or claim that may be made by its manufacturer, is not guaranteed or endorsed by the publisher.
References
Achour, Y., Boumezbeur, A., and Hadji, R. (2017). Landslide susceptibility mapping using analytic hierarchy process and information value methods along a highway road section in Constantine, Algeria[J]. Arabian J. Geosciences 10 (8), 1–16. doi:10.1007/s12517-017-2980-6
Aha, A., Ks, B., and As, B. (2021). Landslide susceptibility assessment in the Himalayan range based along Kasauli – parwanoo road corridor using weight of evidence, information value, and frequency ratio. J. King Saud Univ. Sci. 34, 2. doi:10.1016/j.jksus.2021.101759
Barella, C. F., Sobreira, F. G., and Zêzere, J. L. (2019). A comparative analysis of statistical landslide susceptibility mapping in the southeast region of Minas Gerais state, Brazil. Bull. Eng. Geol. Environ. 78 (5), 3205–3221. doi:10.1007/s10064-018-1341-3
Beloussov, V. V., Belyaevsky, N. A., Borisov, A. A., Volvovsky, B., Volkovsky, I., Resvoy, D., et al. (1980). Structure of the lithosphere along the deep seismic sounding profile: Tien Shan—Pamirs—Karakorum—himalayas. Tectonophysics 70 (3-4), 193–221. doi:10.1016/0040-1951(80)90279-6
Chen, F., Cai, C., and Li, X. (2020). Evaluation of landslide susceptibility based on information volume and neural network model[J]. Chin. J. Rock Mech. Eng. 39 (S1), 2859–2870. doi:10.13722/j.cnki.jrme.2019.1094
Chen, W., Pourghasemi, H. R., Kornejady, A., and Zhang, N. (2017). Landslide spatial modeling: Introducing new ensembles of ANN, MaxEnt, and SVM machine learning techniques. Geofis. Int. 305, 14–327. doi:10.1016/j.geoderma.2017.06.020
Chen, W., Sun, Z., and Han, J. (2019). Landslide susceptibility modeling using integrated ensemble weights of evidence with logistic regression and random forest models. Appl. Sci. 9 (1), 171. doi:10.3390/app9010171
Cruden, D. M., and Varnes, D. J. (1996). Landslide types and processes[J]. Special report, transportation research board. Natl. Acad. Sci. 247, 36–75.
Cui, Y., Bao, P., Xu, C., Ma, S., Zheng, J., and Fu, G. (2021). Landslides triggered by the 6 september 2018 Mw 6.6 Hokkaido, Japan: An updated inventory and retrospective hazard assessment. Earth Sci. Inf. 14 (1), 247–258. doi:10.1007/s12145-020-00544-8
Dahal, R. K., Hasegawa, S., Nonomura, A., Yamanaka, M., Dhakal, S., and Paudyal, P. (2008). Predictive modelling of rainfall-induced landslide hazard in the Lesser Himalaya of Nepal based on weights-of-evidence. Geomorphology 102 (3-4), 496–510. doi:10.1016/j.geomorph.2008.05.041
Dai, F. C., Lee, C. F., and Li, J. (2001). Assessment of landslide susceptibility on the natural terrain of Lantau Island, Hong Kong. Environ. Geol. 40 (3), 381–391. doi:10.1007/s002540000163
Feng, H., zhou, a., and Yu, J. (2016). A comparative studyon plum-rain-triggered landslide susceptibility assessment models in west Zhejiang Province. Earth Sci. 41 (03), 403–415. doi:10.3799/dqkx.2016.032
Huang, R. (2009). Some catastrophic landslides since the twentieth century in the southwest of China. Landslides 6 (1), 69–81. doi:10.1007/s10346-009-0142-y
Jing, Z., Zhou, Z., and Liu, L. (2010). Progressof the research on glacier velocities in China[J]. J. Glaciol. Geocryol. 4, 6.
Lee, S., and Min, K. (2001). Statistical analysis of landslide susceptibility at Yongin, Korea. Environ. Geol. 40 (9), 1095–1113. doi:10.1007/s002540100310
Li, S., Li, X., and Liu, Y. (2008). Geological evolution process of sliding zone in Qianjiangping landslide[J]. Hydrogeology Eng. Geol. 2, 18–23. doi:10.3969/j.issn.1000-3665.2008.02.004
Liu, C. (2018). On the problems of the times of the landslide[J]. Chin. J. Geol. Hazard Control 29 (03), 3.
Lu, Z., and Xu, B. (1984). On chronologic and historical classifications of landslides. USA: Landslide analysis and prevention.
Mandal, S. P., Chakrabarty, A., and Maity, P. (2018). Comparative evaluation of information value and frequency ratio in landslide susceptibility analysis along national highways of Sikkim Himalaya. Spatial Inf. Res. 26 (2), 127–141. doi:10.1007/s41324-017-0160-0
Mechie, J., Yuan, X., Schurr, B., Schneider, F., Sippl, C., Ratschbacher, L., et al. (2012). Crustal and uppermost mantle velocity structure along a profile across the Pamir and southern Tien Shan as derived from project TIPAGE wide-angle seismic data. Geophys. J. Int. 188 (2), 385–407. doi:10.1111/j.1365-246x.2011.05278.x
Msd, A., Ac, A., and Hg, A. (2022). Landslide susceptibility mapping along the Thimphu-Phuentsholing highway using machine learning. Comput. Earth Environ. Sci. 2022, 601–617. doi:10.1016/B978-0-323-89861-4.00038-5
Peng, W. F., Wang, C. L., Chen, S. T., and Lee, S. T. (2009). Incorporating the effects of topographic amplification and sliding areas in the modeling of earthquake-induced landslide hazards, using the cumulative displacement method. Comput. Geosci. 35 (5), 946–966. doi:10.1016/j.cageo.2008.09.007
Pirnau, R., Grozavu, A., Rosca, B., Tang, Z., and Chen, K. (2017). Comparative evaluation of geological disaster susceptibility using multi-regression methods and spatial accuracy validation. J. Geogr. Sci. 27 (4), 439–462. doi:10.1007/s11442-017-1386-4
Riaz, M. T., Basharat, M., and Hameed, N. (2018). A data-driven approach to landslide-susceptibility mapping in mountainous terrain: Case study from the northwest himalayas, Pakistan. Nat. Hazards Rev. 19 (4), 05018007. doi:10.1061/(ASCE)NH.1527-6996.0000302
Sadighi, M., Motamedvaziri, B., and Ahmadi, H. (2020). Assessing landslide susceptibility using machine learning models: A comparison between ANN, ANFIS, and ANFIS-ICA[J]. Environ. Earth Sci. 79 (24), 1–14. doi:10.1007/s12665-020-09294-8
Saha, A. K., Gupta, R. P., Sarkar, I., Arora, M. K., and Csaplovics, E. (2005). An approach for GIS-based statistical landslide susceptibility zonation—With a case study in the himalayas[J]. Landslides 2 (1), 61–69. doi:10.1007/s10346-004-0039-8
Sassa, K. (2013). International programme on landslides[J]. Landslides 1 (2), 3–24. doi:10.1007/978-3-642-22087-6_1
Shirvani, Z., Abdi, O., and Buchroithner, M. (2019). A synergetic analysis of sentinel-1 and -2 for mapping historical landslides using object-oriented random forest in the hyrcanian forests. Remote Sens. 11 (19), 2300. doi:10.3390/rs11192300
Singh, K., and Kumar, V. (2018). Hazard assessment of landslide disaster using information value method and analytical hierarchy process in highly tectonic Chamba region in bosom of Himalaya. Jurnal Mt. Sci. 15 (4), 808–824. doi:10.1007/s11629-017-4634-2
Sun, D., Ding, Y., Zhang, J., Wen, H., Wang, Y., Xu, J., et al. (2022). Essential insights into decision mechanism of landslide susceptibility mapping based on different machine learning models. Geocarto Int. 2022, 1–29. doi:10.1080/10106049.2022.2146763
Wang, Q., Guo, Y., Li, W., He, J., and Wu, Z. (2019). Predictive modeling of landslide hazards in Wen County, northwestern China based on information value, weights-of-evidence, and certainty factor. Geomatics, Nat. Hazards Risk 10 (1), 820–835. doi:10.1080/19475705.2018.1549111
Wen, H., Hu, J., and Zhang, J. (2022). Rockfall susceptibility mapping using XGBoost model by hybrid optimized factor screening and hyperparameter. Geocarto Int. 37, 1–28. doi:10.1080/10106049.2022.2120547
Wubalem, A., and Meten, M. (2020). Landslide susceptibility mapping using information value and logistic regression models in Goncha Siso Eneses area, northwestern Ethiopia[J]. SN Appl. Sci. 2 (5), 1–19. doi:10.1007/s42452-020-2563-0
Xu, C., Dai, F., and Yao, X. (2001). GIS-based landslide susceptibility assessment using analytical hierarchy process in wenchuan earthquake region[J]. Chin. J. Rock Mech. Eng. 28 (S2), 3978–3985. doi:10.0.12.249/j.issn:1000-6915.2009.z2.100
Yang, C., Liu, L., and Zhang, Y. (2022). Machine learning based on landslide susceptibility assessment with Bayesian optimized the hyperparameters. Bull. Geol. Sci. Technol. 41 (02), 228–238. doi:10.19509/j.cnki.dzkq.2022.0059
Zhang, J., Gurung, D. R., Liu, R., Murthy, M. S. R., and Su, F. (2015). Abe Barek landslide and landslide susceptibility assessment in Badakhshan Province, Afghanistan. Landslides 12 (3), 597–609. doi:10.1007/s10346-015-0558-5
Zhang, J., Ma, X., Zhang, J., Sun, D., Zhou, X., Mi, C., et al. (2023). Insights into geospatial heterogeneity of landslide susceptibility based on the SHAP-XGBoost model. J. Environ. Manag. 332, 117357. doi:10.1016/j.jenvman.2023.117357
Zhang, Y., Wen, H., Xie, P., Hu, D., Zhang, J., and Zhang, W. (2021). Hybrid-optimized logistic regression model of landslide susceptibility along mountain highway. Bull. Eng. Geol. Environ. 80 (10), 7385–7401. doi:10.1007/s10064-021-02415-y
Zhang, Y., Wu, R., and Guo, C. (2018). Research progress and prospect on reactivation of ancient landslides[J]. Adv. Earth Sci. 33 (07), 728–740. doi:10.11867/j.issn.1001-8166.2018.07.0728
Keywords: landslide database, landslide hazard, visual interpretation, Western Himalayan Syntaxis, IV model, WoE model
Citation: Cui Y, Yang W, Xu C and Wu S (2023) Distribution of ancient landslides and landslide hazard assessment in the Western Himalayan Syntaxis area. Front. Earth Sci. 11:1135018. doi: 10.3389/feart.2023.1135018
Received: 31 December 2022; Accepted: 06 March 2023;
Published: 17 March 2023.
Edited by:
Fanyu Zhang, Lanzhou University, ChinaReviewed by:
Haijia Wen, Chongqing University, ChinaMatebie Meten, Addis Ababa Science and Technology University, Ethiopia
Copyright © 2023 Cui, Yang, Xu and Wu. This is an open-access article distributed under the terms of the Creative Commons Attribution License (CC BY). The use, distribution or reproduction in other forums is permitted, provided the original author(s) and the copyright owner(s) are credited and that the original publication in this journal is cited, in accordance with accepted academic practice. No use, distribution or reproduction is permitted which does not comply with these terms.
*Correspondence: Chong Xu, Y2hvbmd4dUBuaW5obS5hYy5jbg==