 Ying Hu1,2,3,4
 Weiyi Sun1,2,3,4*Jian Liu1,2,3,4,5,6
 Deliang Chen7
 Liang Ning1,2,3,4
 Zhenghan Peng1,2,3,4
- 1Key Laboratory for Virtual Geographic Environment, Ministry of Education, Nanjing, China
- 2State Key Laboratory Cultivation Base of Geographical Environment Evolution of Jiangsu Province, Nanjing, China
- 3Jiangsu Center for Collaborative Innovation in Geographical Information Resource Development and Application, Nanjing, China
- 4School of Geography Science, Nanjing Normal University, Nanjing, China
- 5Jiangsu Provincial Key Laboratory for Numerical Simulation of Large Scale Complex Systems, School of Mathematical Science, Nanjing Normal University, Nanjing, China
- 6Open Studio for the Simulation of Ocean-Climate-Isotope, Qingdao National Laboratory for Marine Science and Technology, Qingdao, China
- 7Regional Climate Group, Department of Earth Sciences, University of Gothenburg, Gothenburg, Sweden
Introduction: Knowledge of precipitation over the Tibetan Plateau, often referred to as the “Asian water tower”, is crucial for water resource management, infrastructure planning, and disaster mitigation. However, the decadal variability of Tibetan Plateau precipitation in response to the 11-year solar cycle remains unknown.
Methods: Here, we used observational data obtained between 1901 and 2013, together with proxy-based reconstructions of the past five centuries, and discovered a notable summer wet condition over the central‒southern Tibetan Plateau, accompanied by a dry condition over the southeastern Tibetan Plateau, during peaks in the 11-year solar cycle. Using an ensemble mean of four solar-only sensitivity experiments from the Community Earth System Model Last Millennium Ensemble (CESM‒LME), we further demonstrated that the 11-year solar cycle can induce this anomalous pattern of a wet central‒southern and dry southeastern Tibetan Plateau.
Results and discussion: The modeling results indicated that, under a solar maximum, a substantial surface warming occurs over the Asian continent, especially the Tibetan Plateau region; this causes an anomalous Tibetan Plateau–Indian Ocean thermal contrast, which enhances the Indian summer monsoon. The additional Tibetan Plateau heating also enhances and causes a northward shift of the South Asian High, which further intensifies the Indian summer monsoon. The enhanced Indian summer monsoon transports water vapor to the northern Indian continent, which rises upon reaching the central‒southern Tibetan Plateau, substantially increasing precipitation. Meanwhile, a negative Pacific Decadal Oscillation-like sea surface temperature pattern occurs under a solar maximum, leading to a large-scale anticyclonic anomaly over the Yangtze River basin, southeastern Tibetan Plateau, and southern Japan, substantially decreasing precipitation in these regions.
1 Introduction
The Tibetan Plateau (TP) climate is one of Earth’s most active regional climate systems, having considerable land–air interaction and playing an important role in Asian hydrological cycles (Yao et al., 2015; Wu, 2020). The TP is often referred to as the “Asian water tower” as it directly affects the hydrology of the surrounding regions, in particular the flow of major Asian rivers (Yao et al., 2022), such as the Yangtze, Yellow, Nu, Lancang, Yarlung Zangbo, Ganges, and Indus. Changing TP precipitation is also one of the driving mechanisms of the retreat and advance of glaciers (Yao et al., 2012). Understanding the variability of TP precipitation is crucial for the ecosystem, agriculture, water resource management, and social development of the Asian region.
Instrumental data has demonstrated the decadal variability of TP precipitation. For example, Liu et al. (2021) analyzed summer precipitation over the TP based on 151 meteorological stations during the period 1976–2015 and found an interdecadal variation in southern TP precipitation, with an increase from 1976 to 1998 and a decrease from 1999 to 2015. Using station rainfall data from 1979 to 2018, Yue et al. (2021) found a decadal variation in precipitation over the southern TP, with a periodicity peaking at 10 years. The wet phase of decadal precipitation variation has been shown to be associated with cold sea surface temperature (SST) anomalies over the equatorial central Pacific and warm SST anomalies over the Indo–Pacific warm pool (Yue et al., 2021). This SST pattern resembles the pattern of Pacific quasi-decadal oscillation (QDO), with an 11-year signal, which might originate from internal variabilities, such as the low-frequency mega-El Niño/Southern Oscillation (ENSO) variability (e.g., Wang et al., 2014). Besides this internal variability, some studies have also suggested that the decadal solar cycle can also contribute to the formation of QDO (White and Liu, 2008; Jin et al., 2020) and decadal variation of the East Asian summer monsoon (Zhao et al., 2012). However, owing to the limited temporal length of observational data, it is difficult to understand how the decadal variability of TP precipitation responds to external forcing (i.e., solar activity).
The period of the last millennium provides opportunities to study the decadal variability of TP precipitation, benefiting from a large number of high-resolution proxy datasets. These studies provide new insights into the causes and processes behind the decadal variability. Xu et al. (2014) reconstructed the temperature on the eastern edge of the TP over the past four centuries, and found that the decadal variation in temperature was synchronized with precipitation, which was likely affected by solar activity. Shi et al. (2018a) reconstructed the relative humidity variation on the southeastern TP during the period 1751–2005 and suggested that the relative humidity could be modulated by the ENSO and Pacific Decadal Oscillation (PDO). In addition, stalagmite δ18O records from the southeastern TP have indicated marked 11-, 12-, and 22-year periodicities on the decadal time scale, suggesting the importance of solar forcing (Tan et al., 2018). Specifically, precipitation was shown to increase over the southeastern TP at solar minima. The stalagmite δ18O record from Tianmen Cave, central‒southern TP, showed a close agreement with the Indian summer monsoon (ISM) and a marked 11-year periodicity, implying that solar activity may have influenced the ISM and further affected the δ18O record (Cai et al., 2012). On the centennial timescale, precipitation records over the Asian monsoon region show centennial–multi-centennial variability, which lags the 200-year (DeVries cycle) or 300–500-year solar activity cycles by approximately several decades (Breitenmoser et al., 2012; Sun et al., 2022b). The above research has demonstrated the similar periodicities of TP precipitation and solar activity, and imply that TP precipitation may be affected by solar activity. However, some scholars have questioned the impact of solar activity on climate, citing the variation range of total solar irradiance being too small (Vieira et al., 2011; Chiodo et al., 2019). Moreover, reconstructions have failed to reveal the physical mechanisms behind the decadal variability of TP precipitation.
Previous studies have suggested that the 11-year solar activity cycle significantly impacts climate on a decadal time scale. The multi-model mean result from the Coupled Model Inter-Comparison Project (CMIP5) showed a significant increase in global mean surface air temperature 1–2 years after the peaks of 11-year solar cycles (Misios et al., 2015). Using the ensemble of four solar-only sensitivity experiments from the Community Earth System Model Last Millennium Ensemble (CESM‒LME), Jin et al. (2019) found that the decadal variation of the East Asian summer monsoon was significantly correlated with strong 11-year solar cycles over the last millennium; this was associated with a negative PDO-like SST pattern at each solar maximum, but this relationship disappeared during weak 11-year solar cycle epochs. Using observations and climate models, La Niña-like events have been identified over the equatorial eastern Pacific at the peaks of 11-year solar cycles, followed by El Niño-like events several years later (van Loon et al., 2007; Meehl et al., 2008; Meehl and Arblaster, 2009; Meehl et al., 2009). In contrast, Misios et al. (2019) used multiple regression analysis to suggest a weakened Pacific Walker circulation at solar cycle maxima, caused by a thermodynamics-induced muted hydrology mechanism. Both the ENSO-like and PDO-like SST patterns under solar forcing can further influence precipitation over eastern China (Ma et al., 2021; Liu et al., 2022; Xue et al., 2022). However, the effect of the 11-year solar activity cycle on TP precipitation remains unknown.
This study aims to address the following questions: 1) Has the decadal variability of TP precipitation been modulated by the 11-year solar cycle over the last millennium? 2) If so, how does solar activity affect TP precipitation? Here, we used instrumental data, reconstructions, and simulations from the CESM‒LME to investigate the impact of the 11-year solar activity cycle on TP precipitation over the last millennium. The remainder of the paper is organized as follows: Section 2 describes the data we used; Section 3 shows the characteristics and possible physical mechanisms causing changes in the precipitation over the TP under the influence of the 11-year solar cycle; and our discussion and conclusions are summarized in Section 4.
2 Data
2.1 Observational data
Observational data were used to validate reconstructed data and model simulations. The precipitation observations were derived from the Global Precipitation Climatology Centre (GPCC) full data monthly product version 2018 (Schneider et al., 2018), which is calculated from approximately 80,000 global station data points. The horizontal resolution of the data is 1 × 1 and the period covered is 1891–2016. We also used two sets of SST observations: one was the Extended Reconstructed Sea Surface Temperature version 5 (ERSST v5) global SST monthly data (Huang et al., 2017) covering the period 1854–2020, whose horizontal resolution is approximately 2 × 2; the other was the Hadley Center Sea Ice and SST dataset version 1.1 (HadiSST 1.1) (Rayner et al., 2003) covering the period 1871–2020, whose horizontal resolution is approximately 1 × 1.
2.2 Simulation data
We used simulation data to explore the spatiotemporal pattern and physical mechanism of the TP precipitation response to the 11-year solar cycle. The simulation data were derived from the CESM‒LME (Otto-Bliesner et al., 2015), which was conducted using CESM version 1.1 (Hurrell et al., 2013). The resolution of the atmosphere and land components is ∼2, while that of the ocean and sea ice components is ∼1.
The simulations used here contained a control experiment (CTRL) run from the year 850 onwards, an ensemble of 13 all-forcing (AF) experiments, and an ensemble of four total solar irradiance (TSI) forcing experiments. The time range of the AF and TSI simulations was 850–2005. The AF experiments were forced by solar activity, volcanic eruptions, land use/land cover changes, greenhouse gases, ozone, aerosols, and orbital changes (Otto-Bliesner et al., 2015). For the TSI experiments, only the reconstructed solar irradiance forcing (Vieira et al., 2011) was used to drive the simulations; the other external forcings were kept the same as in the CTRL. Differences among the ensemble members comprised the small random round-off differences in the air temperature field at the start of each run. On this basis, the ensemble-mean results from the AF and TSI experiments represented the net effect of all external forcings and solar activity forcing, respectively. Simulations imposed an estimated 11-year solar cycle and used linear regression of TSI at each spectral interval to derive spectral solar irradiance (Schmidt et al., 2011).
2.3 Proxy-based reconstructions
We used reconstructed data to reflect climate change over the last millennium. A proxy-based gridded reconstruction dataset, namely, the Asian summer precipitation (RAP) dataset during the period 1470–2013 (Shi et al., 2018b), was merged with 453 tree-ring-width chronologies and 71 historical documentary records. The RAP dataset comprises gridded data with a spatial range spanning 8.8°S–55.3°N, 61.3°–143.3°E, and a spatial resolution of approximately 2; it reconstructs the June–August (JJA) mean precipitation with an annual temporal resolution. Some previous studies have confirmed the inter annual–decadal variability of monsoon precipitation using the RAP and its relationship with the ENSO and Atlantic multi-decadal oscillation, and comparisons with instrumental data, other climatic reconstructions, and climate model simulations (Shi et al., 2019; Shi and Wang, 2019; Shen et al., 2022). In addition to the gridded reconstructions, we also collated some other high-resolution tree-ring and stalagmite reconstructions from different regions of the TP (Table 1).
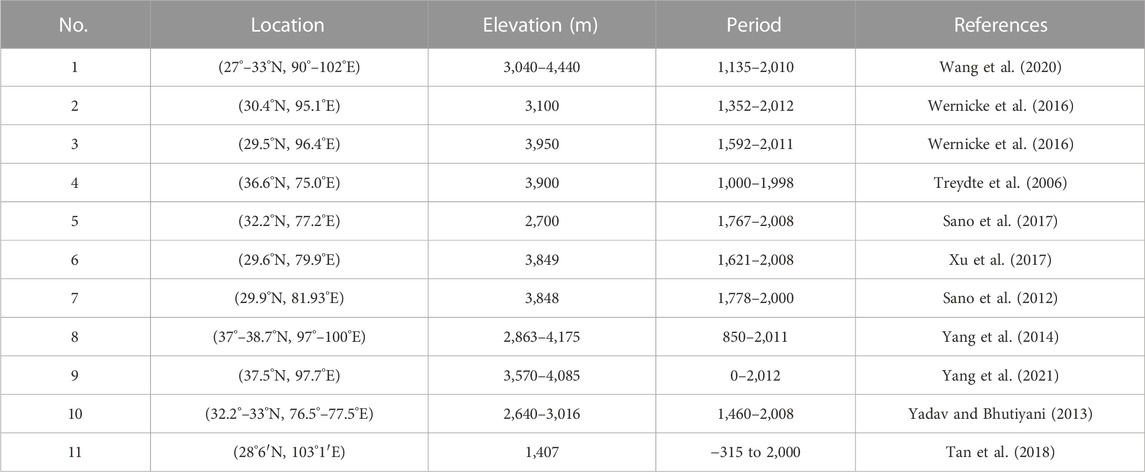
TABLE 1. Reconstructions from different regions of the TP.
3 Results
3.1 Validation of reconstructions and simulations
Precipitation over the TP is dominated by the summer mean precipitation (e.g., Feng and Zhou, 2012); hence, we focused on the JJA precipitation. To verify the reliability of the reconstructions and simulations, we compared the climatological precipitation derived from the GPCC, RAP, and CESM‒LME, respectively (Figure 1). The GPCC data (Figure 1A) showed that the JJA mean precipitation decreases from southeast to northwest over the TP; a similar pattern was seen in both the RAP and CESM‒LME data (Figures 1B, C). The results of the CESM‒LME were computed by the ensemble mean of 13 AF experiments, and the results of each experiment were generally similar to the ensemble mean result (Supplementary Figure S1). The spatial correlation coefficient between RAP and GPCC was 0.77 with a root mean square error (RMSE) of 1.9 mm day−1, while the correlation coefficient between CESM‒LME and GPCC was 0.74 with an RMSE of 3.7 mm day−1. However, both the RAP and CESM‒LME exhibited some wet bias over the southern TP, which is a common error in global climate models (GCMs) (Zhu et al., 2020; Chen et al., 2022). In addition, to detect the decadal variability of precipitation, we conducted the empirical orthogonal function (EOF) analysis during the period 1901–2000 for GPCC, RAP, and CESM‒LME. The EOF first modes of all the three show an east‒west zonal dipole pattern (Figure omitted). Overall, the RAP and CESM‒LME reasonably captured the spatial pattern of climatological JJA mean precipitation and the decadal variability of precipitation over the TP.
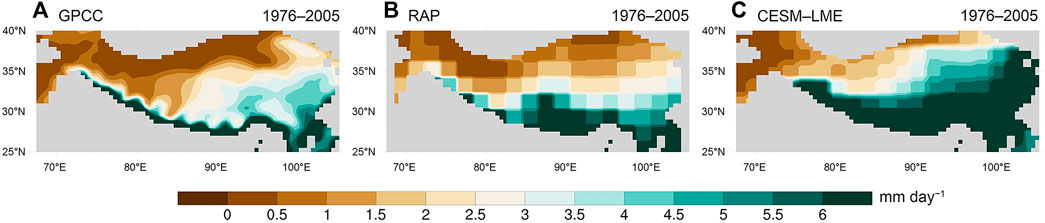
FIGURE 1. Climatological Jun–Aug (JJA) mean precipitation (mm day−1) during the period 1976–2005 derived from (A) GPCC, (B) RAP, and (C) CESM‒LME.
3.2 Response of TP precipitation to the 11-year solar activity cycle
According to the wavelet analysis of the TSI during the period 850–2000 (Supplementary Figure S2A), we selected three periods with substantial 11-year solar cycle signals as the active epochs: 850–1400, 1550–1650, and 1730–2000. Then based on the solar activity sequence (Supplementary Figure S2B), we manually selected the solar maximum (Smax) and minimum (Smin) phases for each 11-year solar cycle epoch in the selected three periods. To test the net effect of solar activity on TP precipitation, we performed a composite analysis of JJA mean precipitation between the Smax and Smin (Figure 2). During the instrumental period of 1901–2013, there were 10 cases for the differences between Smax and Smin. The GPCC data showed that the precipitation significantly increased by approximately 0.6 mm day−1 over the area of 28°–36°N, 85°–95°E, accounting for 36% of the mean climatological value during the period 1901–2013 (Figure 2A). The precipitation decreased over the southeastern and southwestern TP. The results from the RAP also indicated a similar pattern of precipitation anomalies over the TP, but the amplitude of wet conditions over the central‒southern TP was slightly weaker (Figure 2B) than that indicated by the GPCC data. Meanwhile, we also tested the composite results from two other well-known gridded precipitation reconstructions, those of Cook et al. (2010) and Shi et al. (2017). However, the patterns of precipitation shown by these datasets were different from the observations, with an overall drying over the TP region under solar peaks, especially over the central‒southern TP, and a wet condition over the southeastern TP (Supplementary Figure S3). Therefore, our further analysis used only the RAP gridded reconstruction because it compared favorably with the instrumental data when reproducing precipitation changes over the TP under the 11-year solar cycle.

FIGURE 2. Composite differences in JJA mean precipitation (mm day−1) between the 11-year solar maximum (Smax) and minimum (Smin) phases. (A) Results from the GPCC during 1901–2013 (10 cases). (B) Results from the RAP reconstruction during 1901–2013 (10 cases). (C) Results from the RAP during 1470–2013 (39 cases). (D) Ensemble-mean result of four TSI experiments (304 cases). The black dots denote significance at the 90% confidence level (two-tailed Student’s t-test). The solid blue lines denote the elevation contour of 2,000 m.
The above analysis may contain the influence of internal variability because the sample size of the 11-year solar cycle is small during the instrumental period. Hence, we extended the sampling period to the past millennium using the reconstructions and CESM‒LME simulations. The composite results with 39 cases for the differences between Smax and Smin from the RAP during the period 1470–2013 were very similar to the result from the instrumental period (Figure 2C), which suggests that enhanced solar irradiance causes an increase in precipitation over the central‒southern TP and a decrease in precipitation over the southeastern and southwestern TP. We further performed a correlation analysis between TSI sequence and RAP during 1470–2010, and the result was similar to that using the composite analysis (Figure omitted). These results indicate that the effect of the 11-year solar activity cycle on TP precipitation was stable over the entire sampling period. Moreover, this solar-forced pattern of TP precipitation can be confirmed by other reconstruction studies. For example, Cai et al. (2012) found that the stalagmite δ18O record from the central‒southern TP was correlated with the ISM on the decadal timescale, which bears a significant 11-year periodicity. The stalagmite δ18O record from the southeastern TP indicated a significant 11-year periodicity, with a wet condition during solar minima (Tan et al., 2018). We further analyzed the TP precipitation response to solar forcing based on the TSI sensitivity experiments in the CESM‒LME. The ensemble mean result of 304 cases from the TSI experiments showed a dipole precipitation pattern, with a notable wet condition over the central‒southern TP and a notable dry condition over the southeastern TP (Figure 2D), consistent with the reconstructions. However, there was no drying over the southwestern TP in the TSI simulations, suggesting a degree of uncertainty in the model.
We then conducted a power spectrum analysis of the TP precipitation derived from the RAP and other high-resolution proxy data (Figure 3). Since the response of RAP to 11-year solar activity cycle is out-of-phase over central–southern and southeastern TP, we performed the power spectrum analysis to the RAP over the two sub-regions, respectively. The result from the RAP showed a marked quasi-11-year cycle (Figures 3A–B), suggesting the notable effect of the 11-year solar cycle. Ten of the eleven tree-ring-based and stalagmite δ18O-based proxy records across the TP (Table 1) also indicated substantial 10–12-year periodicities (Figures 3C–M), similar to the RAP data. To further detect the effect of the 11-year solar cycle in controlling the periodicities of precipitation, we conducted a power spectrum analysis of simulated TP precipitation from the TSI experiments (Figures 3N–O). The four-member ensemble-mean result of TSI experiments further showed a statistically significant 11-year periodicity. Thus, this timescale analysis confirms that the 11-year solar cycle significantly influences precipitation over the TP.
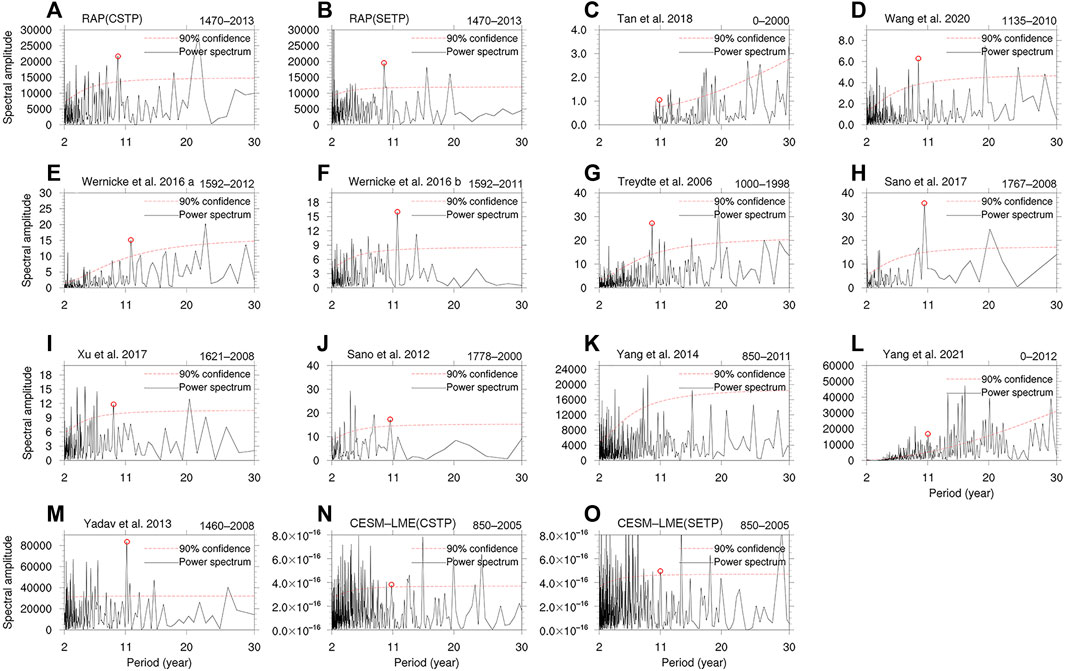
FIGURE 3. Power spectrum analysis of reconstructions (A–M) and simulations (N–O). (A) Result of RAP over central–southern TP. (B) same as (A), but over southeastern TP (C–M) Results from different proxy records across the TP listed in Table 1. (N) Results from the ensemble mean of four TSI experiments over central–southern TP. (O) same as (N), but over southeastern TP. Red dashed lines represent the 90% significance level; red circles mark the significant 11-year cycle.
3.3 Physical mechanism underlying the precipitation response
To understand the physical mechanism of TP precipitation under the influence of the 11-year solar activity cycles, we analyzed the results from the TSI experiments of CESM‒LME. We first examined the composite differences from the surface to 300-hPa vertically integrated water vapor transport between the 11-year Smax and Smin phases (Figure 4A). We identified an enhanced westerly anomaly over the tropical Indian Ocean and an anomalous cyclonic circulation over the Bay of Bengal, which produces an anomalous moisture transport from the Indian Ocean to the central‒southern TP. This may contribute to the increased precipitation over the northern Indian subcontinent. Meanwhile, a significant anomalous anticyclonic anomaly occurs over Japan and northern China, enhancing the transport of water vapor from the Pacific Ocean and southern China to northern and northeastern China; this induces a dry band-like zone over the Yangtze River basin, southeastern TP, and southern Japan.
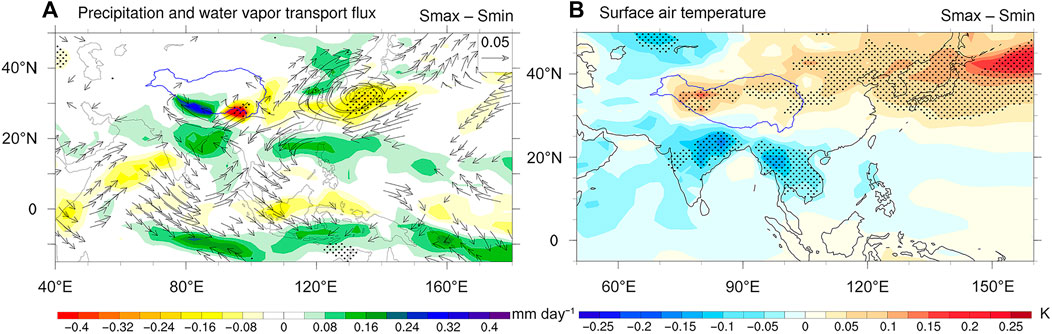
FIGURE 4. Composite differences in JJA mean precipitation (shading, mm day−1) overlain on the (A) water vapor transport flux (kg·m−1 s−1) and (B) surface air temperature (K) between the 11-year Smax and Smin phases from the ensemble-mean result of four TSI experiments in the CESM‒LME. The black dots denote significance at the 90% confidence level (two-tailed Student’s t-test).
A previous study found that precipitation over the central‒southern TP can be affected by the TP‒Indian Ocean thermal contrast, which causes northward water vapor transport over the Indian Ocean (Li and Xiao, 2022). We investigated the composite differences in surface air temperature between the 11-year Smax and Smin phases (Figure 4B). The result showed that, when solar irradiance increases, there is a significant warming over mid-latitude regions of the TP, northern China, Mongolia, and Pacific Ocean, accompanied by a cooling anomaly over low-latitude regions, such as the Indian Ocean, India, and Southeast Asia. This causes an enhanced land–sea thermal contrast between the TP and Indian Ocean, with a difference of approximately 0.1 K, which enhances the ISM and transports more moisture to the central‒southern TP.
Surface warming over the TP region can further heat the mid‒upper troposphere through diabatic heating (Figure 5C), which increases the geopotential height at the upper troposphere (Figure 5B). The climatological South Asian High (SAH) is located over southern Asia (Figure 5A) and is an important indicator for the Asian monsoon (Wei et al., 2015). The anomaly pattern of 200-hPa geopotential height showed an enhancement and northward shift of the SAH, compared with the normal climatological position of the SAH (Figures 5A, B). Some previous studies have suggested that the onset of the Asian summer monsoon is closely related to the northward shift of the SAH, which triggers a monsoon vortex over the Bay of Bengal through the upper-level divergence pumping effect (Liu et al., 2013; Wu et al., 2015). Hence, the strengthening and northward shift of the SAH under solar maxima may contribute to the enhancement of the ISM.
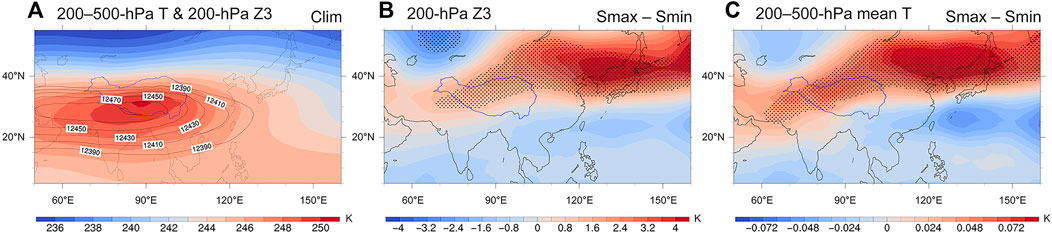
FIGURE 5. (A) Climatological JJA mean 200-hPa geopotential height (contours, gpm) and 200–500-hPa mean upper-tropospheric temperature (shading, K) during the period 1976–2005. (B) Composite differences in JJA mean geopotential height between the 11-year Smax and Smin phases from the ensemble-mean result of four TSI experiments in the CESM‒LME. (C) Same as (B), but for 200–500-hPa mean upper-tropospheric temperature (K). The black dots denote significance at the 90% confidence level (two-tailed Student’s t-test).
Surface warming over the TP region also decreases sea level pressure (SLP), which induces an ascending motion over the central‒southern TP and northern Indian subcontinent regions (Supplementary Figure S4). We further investigated the pressure–latitude cross section of zonally averaged temperature, vertical velocity, and meridional winds over the region 77.5–87.5°E (Figure 6). We found a uniform climatological upward motion over the central‒southern TP and northern India during the boreal summer (Figure 6A). When solar irradiance increases, the ascending motion is enhanced over the central‒southern TP and the meridional circulation is also strengthened (Figure 6B). The enhanced water vapor carried by the ISM flow rises upon reaching the central‒southern TP, causing an anomalous upward motion, and substantially increasing precipitation in this region.
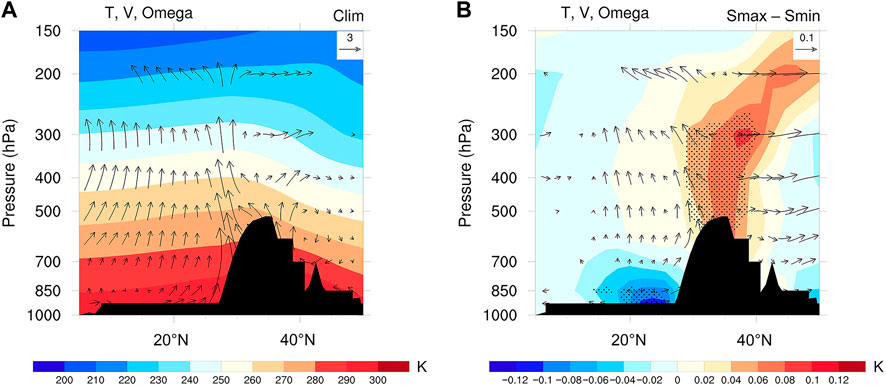
FIGURE 6. (A) Zonally averaged (77.5°–87.5°E) climatological JJA mean pressure–latitude cross section of temperature (shading, K), vertical velocity (vectors, 0.02 Pa s−1), and meridional winds (m s−1) during the period 1976–2005. (B) Same as (A), but for the composite differences between the 11-year Smax and Smin phases from the ensemble-mean result of four TSI experiments in the CESM‒LME. The black dots in (B) denote significance at the 90% confidence level (two-tailed Student’s t-test).
We also examined the changes in SST and winds at 850 hPa under the 11-year solar cycle (Figure 7). The result showed that a warm SST anomaly occurs over the Kuroshio–Oyashio Extension and North Pacific, while a cold SST anomaly occurs along the North American coastline, resembling the negative PDO phase (Figure 7B). A previous study indicated that a cool PDO-like SST pattern can be induced by solar forcing during strong 11-year solar cycle epochs (Jin et al., 2019). On the basis of observational data, our composite analysis also showed a negative PDO-like pattern between the 11-year Smax and Smin phases (Supplementary Figure S5); this is similar to the TSI modeling result from the CESM‒LME (Figure 7B). The negative PDO may induce a rise in SLP over the mid-latitude central and western North Pacific, causing a large-scale anomalous anticyclone over the extratropical North Pacific (Figure 7A) (Sun et al., 2022c). Asian continental warming induces a low SLP anomaly. Then, the large SLP gradient between the western North Pacific high and northern and northeastern China low anomalies generates strong southwesterlies over eastern China (Figure 7A); this causes wet conditions over northern and northeastern China, and dry conditions over the Yangtze River basin, southeastern TP, and southern Japan (Figure 4A).
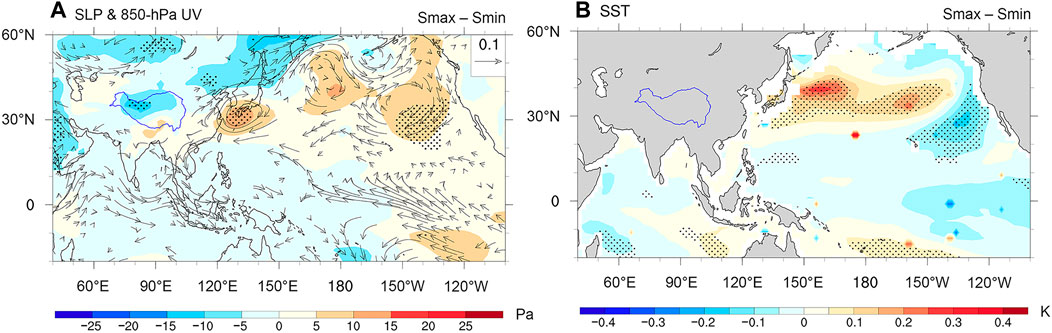
FIGURE 7. Composite differences in (A) JJA mean 850-hPa wind (vectors, m s−1) and precipitation (shading, mm day−1) and (B) sea surface temperature (SST, K) between the 11-year Smax and Smin phases from the ensemble-mean result of four TSI experiments in the CESM‒LME. The black dots denote significance at the 90% confidence level (two-tailed Student’s t-test).
To explore whether the negative PDO-like SST pattern could induce this anomalous atmospheric circulation and precipitation over East Asia, we examined the PDO mode and its net effect in the CTRL experiment (Supplementary Figure S6). The EOF first mode of North Pacific SST anomalies showed a negative PDO pattern and its explained variance was approximately 40.6% (Supplementary Figure S6), similar to that in the observations (Sun et al., 2022a). We then analyzed the climatic impact of the negative PDO using the regression map of surface air temperature, 850-hPa winds, and precipitation on the associated principal component 1 (PC1). We found a remarkable warm anomaly over the mid-latitude central and western North Pacific, and a cold anomaly along the west coast of North America (Supplementary Figure S6B), inducing a large-scale North Pacific anticyclonic anomaly (Supplementary Figure S6C). Meanwhile, mid-latitude Asian continental warming causes a drop in SLP, which leads to an SLP gradient between the mid-latitude Asian continent and western North Pacific. This enhances the southwesterly flow over eastern China, which induces dry conditions over southern Japan, southern China, and the southeastern TP. The anomalous precipitation, low-level circulation and surface air temperature over East Asia caused by the negative PDO in the CTRL experiment (Supplementary Figure S6) are similar to the result under the 11-year solar cycle from the TSI experiments (Figures 4, 7). This means that when solar irradiance induces a negative PDO-like SST pattern, this SST pattern can further contribute to the drying over the Yangtze River basin and southeastern TP, and can also further enhance the land–sea thermal contrast leading to the strengthening of the Indian monsoon. A schematic diagram of the mechanism of TP precipitation variation under the 11-year solar cycle is shown in Figure 8.
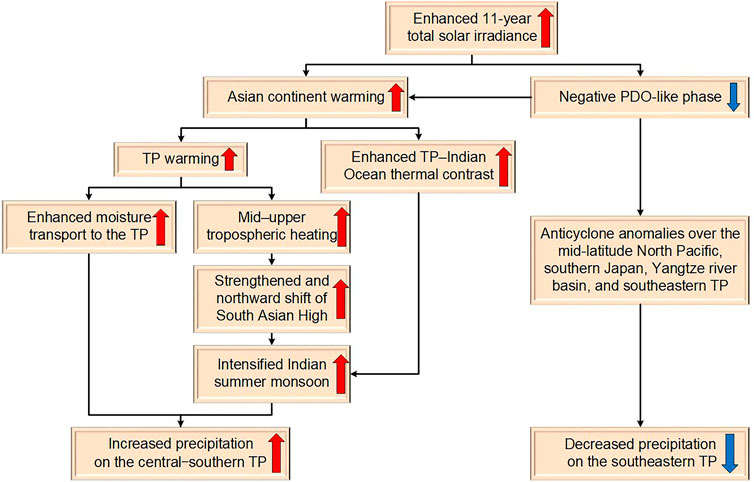
FIGURE 8. Schematic diagram of the mechanism responsible for the change in TP precipitation under the 11-year solar cycle.
4 Discussion and conclusion
This study investigated the response of precipitation over the TP to the 11-year solar cycle during the past millennium. On the basis of observations during the period 1901–2013, proxy-based reconstructions over the past five centuries, and other high-resolution reconstructions, we found a significant quasi-11-year cycle of TP precipitation. The TSI sensitivity experiments from the CESM‒LME showed that this quasi-11-year cycle is modulated by the 11-year solar activity cycle. Meanwhile, observations and reconstructions demonstrated a significant summer wet condition over the central‒southern TP, accompanied by a dry condition over the southeastern TP, during peaks in the 11-year solar cycle; this was also captured by the TSI sensitivity experiments. Modeling results showed that, under solar maxima, a significant surface warming occurs over the Asian continent, especially for the TP region, causing a strengthened TP–Indian Ocean thermal contrast, which enhances the ISM. The TP heating induces mid‒upper tropospheric warming, which causes a strengthening and northward shift of the SAH; this further intensifies the ISM. The enhanced ISM transports more water vapor from the Indian Ocean to the northern Indian subcontinent, which rises upon reaching the central‒southern TP, substantially increasing precipitation in this region. A negative PDO-like SST pattern occurs under solar maxima, leading to a significant SLP gradient between the anomalous mid-latitude Asian continental low and North Pacific high; this induces a large-scale anticyclonic anomaly over the mid-latitude North Pacific, southern Japan, Yangtze River basin, and southeastern TP, substantially decreasing precipitation over the southeastern TP.
Many early studies have demonstrated a dipole pattern of precipitation anomalies over the northern and southern TP on the inter annual time scale (Li et al., 2021). However, the EOF mode (Figure omitted) shows that on the decadal time scale, the main precipitation mode exhibits an east–west dipole pattern. Meanwhile, the climatological mean precipitation suggests that, precipitation over the northern TP is basically below 1.5 mm day–1, while precipitation over the southern TP is even more than 6 mm day–1 (Figure 1). The large precipitation magnitude might lead to a stronger decadal variability of precipitation over the southern TP. However, under the influence of the 11-year solar activity cycle, the GPCC and RAP data show a “dry–wet–dry” zonal tripolar pattern over the southern TP (Figures 2A–C), while the TSI experiments show a “wet–dry” zonal dipole pattern over the central‒southern and southeastern TP (Figure 2D). We postulate that the bias in precipitation over the southwestern TP may be associated with the model’s uncertainty in simulating the precipitation over the western TP, which is a common problem in GCMs (e.g., Zhu et al., 2020). This type of model deficiency limits our understanding of the mechanisms responsible for TP precipitation variability. Meanwhile, there are two potential mechanisms that can explain the influence of solar activity on the climate system, namely, the “top-down” stratospheric ozone mechanism (Haigh, 1996) and “bottom-up” coupled air‒sea mechanism (Meehl et al., 2008). In this paper, only the latter mechanism is considered; however, the former mechanism might also contribute to the decadal precipitation variability over the TP under the 11-year solar cycle. Thus, further development of high-resolution models and improvement of the model physics and parameters will be critical to understanding the response of the TP climate to external forcing (i.e., solar activity).
Data availability statement
Publicly available datasets were analyzed in this study. This data can be found here: https://www.cesm.ucar.edu/community-projects/lme/data-sets https://psl.noaa.gov/data/gridded/data.gpcc.html https://psl.noaa.gov/data/gridded/data.noaa.ersst.v5.html https://www.metoffice.gov.uk/hadobs/hadisst/https://www.ncei.noaa.gov/access/paleo-search/.
Author contributions
YH: data curation, formal analysis, investigation, visualization, writing—original draft; WS (corresponding author): conceptualization, methodology, validation, supervision, writing—review and editing; JL: conceptualization, funding acquisition, project administration, resources, supervision; DC: conceptualization, writing—review and editing, funding acquisition; LN: methodology, supervision; ZP: visualization.
Funding
Our study was supported by the National Natural Science Foundation of China (Grant Numbers 42130604, 42105044, 41971108, and 42111530182) and Swedish STINT (Grant Number CH 2019-8377).
Acknowledgments
We thank the CESM‒LME, GPCC, ERSST, HadISST, RAP, and other reconstruction teams (Table 1) for providing simulation, observation, and reconstruction data.
Conflict of interest
The authors declare that the research was conducted in the absence of any commercial or financial relationships that could be construed as a potential conflict of interest.
Publisher’s note
All claims expressed in this article are solely those of the authors and do not necessarily represent those of their affiliated organizations, or those of the publisher, the editors and the reviewers. Any product that may be evaluated in this article, or claim that may be made by its manufacturer, is not guaranteed or endorsed by the publisher.
Supplementary material
The Supplementary Material for this article can be found online at: https://www.frontiersin.org/articles/10.3389/feart.2023.1137205/full#supplementary-material
References
Breitenmoser, P., Beer, J., Brönnimann, S., Frank, D., Steinhilber, F., and Wanner, H. (2012). Solar and volcanic fingerprints in tree-ring chronologies over the past 2000years. Palaeogeogr. Palaeoclimatol. Palaeoecol. 313–314, 127–139. doi:10.1016/j.palaeo.2011.10.014
Cai, Y., Zhang, H., Cheng, H., An, Z., Lawrence Edwards, R., Wang, X., et al. (2012). The Holocene Indian monsoon variability over the southern Tibetan Plateau and its teleconnections. Earth Planet. Sci. Lett. 335–336, 135–144. doi:10.1016/j.epsl.2012.04.035
Chen, Q., Ge, F., Jin, Z., and Lin, Z. (2022). How well do the CMIP6 HighResMIP models simulate precipitation over the Tibetan Plateau? Atmos. Res. 279, 106393. doi:10.1016/j.atmosres.2022.106393
Chiodo, G., Oehrlein, J., Polvani, L. M., Fyfe, J. C., and Smith, A. K. (2019). Insignificant influence of the 11-year solar cycle on the North atlantic oscillation. Nat. Geosci. 12, 94–99. doi:10.1038/s41561-018-0293-3
Cook, E. R., Anchukaitis, K. J., Buckley, B. M., D'arrigo, R. D., Jacoby, G. C., and Wright, W. E. (2010). Asian monsoon failure and megadrought during the last millennium. Science 328, 486–489. doi:10.1126/science.1185188
Feng, L., and Zhou, T. (2012). Water vapor transport for summer precipitation over the Tibetan Plateau: Multidata set analysis. J. Geophys. Res.-Atmos. 117, D20114. doi:10.1029/2011jd017012
Haigh, J. D. (1996). The impact of solar variability on climate. Science 272, 981–984. doi:10.1126/science.272.5264.981
Huang, B., Thorne, P., Banzon, V., Boyer, T., Chepurin, G., Lawrimore, J., et al. (2017). Extended reconstructed Sea Surface temperature, version 5 (ERSSTv5): Upgrades, validations, and intercomparisons. J. Clim. 30, 8179–8205. doi:10.1175/JCLI-D-16-0836.1
Hurrell, J. W., Holland, M., Gent, P., Ghan, S., Kay, J., Kushner, P., et al. (2013). The community earth system model: A framework for collaborative research. Bull. Am. Meteorol. Soc. 94, 1339–1360. doi:10.1175/BAMS-D-12-00121.1
Jin, C., Liu, J., Wang, B., Yan, M., and Ning, L. (2019). Decadal variations of the East Asian summer monsoon forced by the 11-year insolation cycle. J. Clim. 32, 2735–2745. doi:10.1175/JCLI-D-18-0288.1
Jin, C., Wang, B., and Liu, J. (2020). Emerging pacific quasi-decadal oscillation over the past 70 years. Geophys. Res. Lett. 48, 1–11. doi:10.1029/2020GL090851
Li, L., Zhang, R., Wen, M., and Lv, J. (2021). Regionally different precipitation trends over the Tibetan plateau in the warming context: A perspective of the Tibetan plateau vortices. Geophys. Res. Lett. 48 (11), e2020GL091680. doi:10.1029/2020GL091680
Li, Z., and Xiao, Z. (2022). The role of Tibetan plateau–Indian Ocean thermal contrast in the significant increasing precipitation over the southern Tibetan plateau in may after the mid-1990s. J. Clim. 35, 4061–4075. doi:10.1175/jcli-d-21-0619.1
Liu, B., Wu, G., Mao, J., and He, J. (2013). Genesis of the South Asian high and its impact on the asian summer monsoon onset. J. Clim. 26, 2976–2991. doi:10.1175/JCLI-D-12-00286.1
Liu, Y., Chen, H., Li, H., Zhang, G., and Wang, H. (2021). What induces the interdecadal shift of the dipole patterns of summer precipitation trends over the Tibetan Plateau? Int. J. Climatol. 41, 5159–5177. doi:10.1002/joc.7122
Liu, F., Gao, C., Chai, J., Robock, A., Wang, B., Li, J., et al. (2022). Tropical volcanism enhanced the East Asian summer monsoon during the last millennium. Nat. Commun. 13, 3429. doi:10.1038/s41467-022-31108-7
Ma, H., Wang, R., Lai, A., Li, X., Wang, F., Zhou, Z., et al. (2021). Solar activity modulates the El Niño-Southern Oscillation-induced precipitation anomalies over southern China in early spring. Int. J. Climatol. 41, 6589–6601. doi:10.1002/joc.7214
Meehl, G., and Arblaster, J. (2009). A lagged warm event–like response to peaks in solar forcing in the pacific region. J. Clim. 22, 3647–3660. doi:10.1175/2009JCLI2619.1
Meehl, G., Arblaster, J., Branstator, G., and Van Loon, H. (2008). A coupled air sea response mechanism to solar forcing in the pacific region. J. Clim. 21, 2883–2897. doi:10.1175/2007JCLI1776.1
Meehl, G., Arblaster, J., Matthes, K., Sassi, F., and Van Loon, H. (2009). Amplifying the pacific climate system response to a small 11-year solar cycle forcing. Science 325, 1114–1118. doi:10.1126/science.1172872
Misios, S., Mitchell, D., Gray, L., Tourpali, K., Matthes, K., Hood, L., et al. (2015). Solar signals in CMIP-5 simulations: Effects of atmosphere-ocean coupling. Q. J. R. Meteorol. Soc. 142, 928–941. doi:10.1002/qj.2695
Misios, S., Gray, L., Knudsen, M., Karoff, C., Schmidt, H., and Haigh, J. (2019). Slowdown of the Walker circulation at solar cycle maximum. Proc. Natl. Acad. Sci. 116, 7186–7191. doi:10.1073/pnas.1815060116
Otto-Bliesner, B., Brady, E., Fasullo, J., Jahn, A., Landrum, L., Stevenson, S., et al. (2015). Climate variability and change since 850 CE: An ensemble approach with the community earth system model. Bull. Am. Meteorol. Soc. 97, 735–754. doi:10.1175/BAMS-D-14-00233.1
Rayner, N. A., Parker, D., Horton, E. B., Folland, C., Alexander, L., Rowell, D., et al. (2003). Global analyses of sea surface temperature, sea ice, and night marine air temperature since the late Nineteenth Century. J. Geophys. Res. 108, 4407. doi:10.1029/2002JD002670
Sano, M., Ramesh, R., and Sukumar, R. (2012). Increasing aridity over the past 223 Years in the Nepal himalaya inferred from a tree-ring δ18O chronology. Holocene 22, 809–817. doi:10.1177/0959683611430338
Sano, M., Dimri, A. P., Ramesh, R., Xu, C., Li, Z., and Nakatsuka, T. (2017). Moisture source signals preserved in a 242-year tree-ring δ 18 O chronology in the Western Himalaya. Glob. Planet. Change 157, 73–82. doi:10.1016/j.gloplacha.2017.08.009
Schmidt, G., Jungclaus, J., Ammann, C., Bard, E., P, B., Crowley, T., et al. (2011). Climate forcing reconstructions for use in PMIP simulations of the Last Millennium (v1.0). Geosci. Model. Dev. 4, 33–45. doi:10.5194/gmd-4-33-2011
Schneider, U., Becker, A., Finger, P., Meyer-Christoffer, A., and Ziese, M. (2018). GPCC full data monthly product version 2018 at 1.0°: Monthly land-surface precipitation from rain-gauges built on GTS-based and historical data. doi:10.5676/DWD_GPCC/FD_M_V2018_100
Shen, T., Sun, W., Liu, J., Wang, B., Chen, D., Ning, L., et al. (2022). Secular changes of the decadal relationship between the northern hemisphere land monsoon rainfall and Sea Surface temperature over the past millennium in climate model simulations. J. Geophys. Res.-Atmos. 127, e2022JD037065. doi:10.1029/2022JD037065
Shi, H., and Wang, B. (2019). How does the Asian summer precipitation-ENSO relationship change over the past 544 years? Clim. Dyn. 52, 4583–4598. doi:10.1007/s00382-018-4392-z
Shi, F., Zhao, S., Guo, Z., Goosse, H., and Yin, Q. (2017). Multi-proxy reconstructions of May–September precipitation field in China over the past 500 years. Clim. Past. 13, 1919–1938. doi:10.5194/cp-13-1919-2017
Shi, C., Daux, V., Li, Z., Wu, X., Fan, T., Ma, Q., et al. (2018a). The response of relative humidity to centennial-scale warming over the southeastern Tibetan Plateau inferred from tree-ring width chronologies. Clim. Dyn. 51, 3735–3746. doi:10.1007/s00382-018-4107-5
Shi, H., Wang, B., Cook, E., Liu, J., and Liu, F. (2018b). Asian summer precipitation over the past 544 Years reconstructed by merging tree rings and historical documentary records. J. Clim. 31, 7845–7861. doi:10.1175/JCLI-D-18-0003.1
Shi, H., Wang, B., Liu, J., and Liu, F. (2019). Decadal–Multidecadal variations of asian summer rainfall from the little ice age to the present. J. Clim. 32, 7663–7674. doi:10.1175/JCLI-D-18-0743.1
Sun, W., Liu, J., Wang, B., Chen, D., and Gao, C. (2022a). Pacific multidecadal (50–70 year) variability instigated by volcanic forcing during the Little Ice Age (1250–1850). Clim. Dyn. 59, 231–244. doi:10.1007/s00382-021-06127-7
Sun, W., Liu, J., Wang, B., Chen, D., Wan, L., and Wang, J. (2022b). Holocene multi-centennial variations of the asian summer monsoon triggered by solar activity. Geophys. Res. Lett. 49, e2022GL098625. doi:10.1029/2022GL098625
Sun, W., Wang, B., Liu, J., and Dai, Y. (2022c). Recent changes of pacific decadal variability shaped by greenhouse forcing and internal variability. J. Geophys. Res.-Atmos. 127, e2021JD035812. doi:10.1029/2021JD035812
Tan, L., Cai, Y., Cheng, H., Edwards, L. R., Lan, J., Zhang, H., et al. (2018). High resolution monsoon precipitation changes on southeastern Tibetan Plateau over the past 2300 years. Quat. Sci. Rev. 195, 122–132. doi:10.1016/j.quascirev.2018.07.021
Treydte, K., Schleser, G., Helle, G., Frank, D., Winiger, M., Haug, G., et al. (2006). The twentieth century was the wettest period in northern Pakistan over the past Millennium. Nature 440, 1179–1182. doi:10.1038/nature04743
Van Loon, H., Meehl, G., and Shea, D. (2007). Coupled air-sea response to solar forcing in the Pacific region during northern winter. J. Geophys. Res. 112, D02108. doi:10.1029/2006JD007378
Vieira, L., Solanki, S., Krivova, N., and Usoskin, I. (2011). Evolution of the solar irradiance during the Holocene. Astron. Astrophys. 531, A6. doi:10.1051/0004-6361/201015843
Wang, S.-Y., Hakala Assendelft, K., Gillies, R., and Capehart, W. (2014). The Pacific Quasi-Decadal Oscillation (QDO) - an important precursor toward anticipating major flood events in the Missouri River Basin? Geophys. Res. Lett. 41, 991–997. doi:10.1002/2013GL059042
Wang, J., Yang, B., and Ljungqvist, F. (2020). Moisture and temperature covariability over the southeastern Tibetan plateau during the past nine centuries. J. Clim. 33, 6583–6598. doi:10.1175/JCLI-D-19-0363.1
Wei, W., Zhang, R., Wen, M., Kim, B.-J., and Nam, J.-C. (2015). Interannual variation of the South Asian high and its relation with Indian and east Asian summer monsoon rainfall. J. Clim. 28, 2623–2634. doi:10.1175/JCLI-D-14-00454.1
Wernicke, J., Hochreuther, P., Grießinger, J., Zhu, H., Wang, L., and Brauning, A. (2016). Multi-century humidity reconstructions from the southeastern Tibetan Plateau inferred from tree-ring δ18O. Glob. Planet. Change 149, 26–35. doi:10.1016/j.gloplacha.2016.12.013
White, W., and Liu, Z. (2008). Resonant excitation of the quasi-decadal oscillation by the 11-year signal in the Sun's irradiance. J. Geophys. Res. 113, C01002. doi:10.1029/2006JC004057
Wu, G., Duan, A., Liu, Y., Mao, J., Ren, R., Bao, Q., et al. (2015). Tibetan Plateau climate dynamics: Recent research progress and outlook. Natl. Sci. Rev. 2, 100–116. doi:10.1093/nsr/nwu045
Wu, G. (2020). Land–air coupling over the Tibetan Plateau and its climate impacts. Natl. Sci. Rev. 7, 485. doi:10.1093/nsr/nwaa012
Xu, H., Sheng, E., Lan, J., Yu, K., and Che, S. (2014). Decadal/multi-decadal temperature discrepancies along the eastern margin of the Tibetan Plateau. Quat. Sci. Rev. 89, 85–93. doi:10.1016/j.quascirev.2014.02.011
Xu, C., Sano, M., Dimri, A. P., Ramesh, R., Nakatsuka, T., Shi, F., et al. (2017). Decreasing Indian summer monsoon in northern Indian sub-continent during the last 180 years: Evidence from five tree cellulose oxygen isotope chronologies. Clim. Past. Discuss. 14, 653–664. doi:10.5194/cp-2016-132
Xue, J., Ning, L., Liu, Z., Qin, Y., Chen, K., Yan, M., et al. (2022). The combined influences of Solar Radiation and PDO on Precipitation over Eastern China during the last millennium. Clim. Dyn. 60, 1137–1150 doi:10.1007/s00382-022-06372-4
Yadav, R., and Bhutiyani, M. (2013). Tree-ring-based snowfall record for cold arid Western Himalaya, India since A.D. 1460. J. Geophys. Res. Atmos. 118, 7516–7522. doi:10.1002/jgrd.50583
Yang, B., Qin, C., Wang, J., He, M., Melvin, T., Osborn, T., et al. (2014). A 3,500-year tree-ring record of annual precipitation on the northeastern Tibetan Plateau. Proc. Natl. Acad. Sci. U. S. A. 111, 2903–2908. doi:10.1073/pnas.1319238111
Yang, B., Qin, C., Osborn, T., Trouet, V., Ljungqvist, F., Esper, J., et al. (2021). Long-term decrease in Asian monsoon rainfall and abrupt climate change events over the past 6,700 years. Proc. Natl. Acad. Sci. 118, e2102007118. doi:10.1073/pnas.2102007118
Yao, T., Thompson, L., Yang, W., Yu, W., Gao, Y., Guo, X., et al. (2012). Different Glacier status with atmospheric circulations in Tibetan plateau and surroundings. Nat. Clim. Change 2, 663–667. doi:10.1038/nclimate1580
Yao, T., Wu, F., Ding, L., Sun, J., Zhu, L., Piao, S., et al. (2015). Multispherical interactions and their effects on the Tibetan plateau's Earth system: A review of the recent researches. Natl. Sci. Rev. 2, 468–488. doi:10.1093/nsr/nwv070
Yao, T., Bolch, T., Chen, D., Gao, J., Immerzeel, W. W., Piao, S., et al. (2022). The imbalance of the Asian water tower. Nat. Rev. Earth Environ. 3, 618–632. doi:10.1038/s43017-022-00299-4
Yue, S., Wang, B., Yang, K., Xie, Z., Lu, H., and He, J. (2021). Mechanisms of the decadal variability of monsoon rainfall in the southern Tibetan Plateau. Environ. Res. Lett. 16, 014011. doi:10.1088/1748-9326/abcb36
Zhao, L., Wang, J., and Zhao, H. (2012). Solar cycle signature in decadal variability of monsoon precipitation in China. J. Meteorol. Soc. Jpn. 90, 1–9. doi:10.2151/jmsj.2012-101
Keywords: Tibetan Plateau, decadal variability of precipitation, 11-year solar cycle, Tibetan Plateau-Indian Ocean thermal contrast, South Asian High, Pacific Decadal Oscillation
Citation: Hu Y, Sun W, Liu J, Chen D, Ning L and Peng Z (2023) Decadal variability of precipitation over the Tibetan Plateau modulated by the 11-year solar cycle over the past millennium. Front. Earth Sci. 11:1137205. doi: 10.3389/feart.2023.1137205
Received: 04 January 2023; Accepted: 06 February 2023;
Published: 16 February 2023.
Edited by:
Ziniu Xiao, Institute of Atmospheric Physics (CAS), ChinaReviewed by:
Huopo Chen, Institute of Atmospheric Physics (CAS), ChinaKe Fan, School of Atmospheric Sciences, Sun Yat-sen University, China
Copyright © 2023 Hu, Sun, Liu, Chen, Ning and Peng. This is an open-access article distributed under the terms of the Creative Commons Attribution License (CC BY). The use, distribution or reproduction in other forums is permitted, provided the original author(s) and the copyright owner(s) are credited and that the original publication in this journal is cited, in accordance with accepted academic practice. No use, distribution or reproduction is permitted which does not comply with these terms.
*Correspondence: Weiyi Sun, d2VpeWlzdW5AbmpudS5lZHUuY24=