 Shuai Wu1,2*
 Jianfa Wu1,2Yong Liu3Xuefeng Yang1,2Juan Zhang4Jian Zhang1,2Deliang Zhang1,2Bing Zhong5Dongchen Liu1,2
- 1Shale Gas Research Institute, PetroChina Southwest Oil and Gasfield Company, Chengdu, Sichuan, China
- 2Key Laboratory of Shale Gas Evaluation and Production in Sichuan Province, Chengdu, Sichuan, China
- 3Gas Field Development Management Department, PetroChina Southwest Oil and Gasfield Company, Chengdu, Sichuan, China
- 4Exploration and Development Research Institute, PetroChina Southwest Oil and Gasfield Company, Chengdu, Sichuan, China
- 5Technical Consulting Center, PetroChina Southwest Oil and Gasfield Company, Chengdu, Sichuan, China
Imbibition and flowback of fracturing fluid usually occur in the shale matrix after hydraulic fracturing, which significantly impacts shale gas production and environmental protection. The rocks of deep shale gas reservoirs are under high-temperature and high-temperature conditions. There are rich micro-nano pores with various pore structures in deep shale. In addition, the flowback behavior is significantly affected by the imbibition behavior because the flowback begins after the end of the imbibition. Therefore, an accurate pore-scale description of the coupled imbibition-flowback behavior is crucial to understand the flowback mechanism and its impacts. In this paper, a pseudo-potential lattice Boltzmann method is employed to simulate the coupled imbibition-flowback behavior in a digital shale core, where the digital core is reconstructed by Markov Chain-Monte Carlo method based on scanning microscope images of deep shale cores. The microcosmic mechanism of the imbibition and flowback is studied under deep shale conditions. The influence of some factors, such as pore structure, fluid viscosity, wettability, and flowback pressure difference, on the flowback behavior of fracturing fluid is investigated. It is found that the fracturing fluid advances almost uniformly throughout the pore space during the imbibition process. The fracturing fluid is easy to adsorb on the pore wall, and the shale gas is located in the middle of the pore space. The viscous fingering is clearly observed during the flowback process, where shale gas flows through large pores to form a flow channel, and the fracturing fluid stays in tiny pores. The flowback rate increases gradually with the flowback time and eventually tends to be almost constant. The wettability, flowback pressure difference, and pore structure significantly influence the flowback behavior, while the fracturing fluid viscosity has a smaller effect on the flowback process.
1 Introduction
As an unconventional gas resource with massive reserves, shale gas has received wide attention since it entered the commercial development stage (Zou et al., 2015a; Zou et al., 2016). According to the US Energy Information Administration (EIA) forecast, shale gas reserves in China account for about 20% of the world, ranking first globally (Ma et al., 2017), and thus shale gas has a broad development prospect in China (Dong et al., 2015; Hao et al., 2017; Sun et al., 2020). In this decade, shale gas production in China has grown steadily every year, but it mainly comes from middle and shallow shale gas reservoirs with a depth of smaller than 3,500 m. Deep shale gas reservoirs with a depth of over 3,500 m have received particular attention and have been regarded as the new growth point for China’s shale gas production in the future (Ma et al., 2021). Deep shale gas reservoirs are difficult to exploit because of the deep shale’s low porosity and ultra-low permeability. Horizontal well drilling technology (Nie et al., 2013) and hydraulic fracturing technology (Rongved et al., 2019) are the key technologies for the commercial development of shale gas reservoirs. Fracturing technology has been continuously improved and developed in recent years (Wang et al., 2015; Li et al., 2018; Cheng et al., 2019; Wu et al., 2022; Yang et al., 2022). After hydraulic fracturing, the flowback stratagem of fracturing fluid is one of the critical factors for shale gas production (Wang et al., 2020a; Qu et al., 2021).
The flowback rate of fracturing fluid is generally low and varies significantly for different shale gas reservoirs (Lutz et al., 2013; Vengosh et al., 2014; Gao et al., 2017). Compared with conventional gas reservoirs, deep shale gas reservoirs under high-temperature and high-temperature conditions have rich micro-nano pores with various pore structures (Guo et al., 2014; Chen et al., 2019), which affects the gas-liquid flow law and the flowback characteristics of gas wells. Because the flowback characteristics of gas wells are the macroscopic manifestation of the microcosmic mechanism of the imbibition and flowback, it is crucial to clarify the microcosmic mechanism of imbibition and flowback of fracturing fluid under reservoir conditions for the efficient development of deep shale gas reservoirs (Zheng et al., 2021a; Qu et al., 2021; Shao et al., 2022; Xu et al., 2022).
Lattice Boltzmann method (LBM) is considered as a powerful tool for simulating many complex flows such as multiphase flows (Wang et al., 2023), multicomponent flows (Ren et al., 2019), suspended particle flows (Jiang et al., 2022), blood flows (Cherkaoui et al., 2022), liquid slip flows (Ren et al., 2023), turbulent flows (Kareem and Asker, 2022), nanofluid heat flows (Khan et al., 2022), and so on. Recently LBM has been widely used to simulate pore-scale flows of multiphase fluid in porous media because it is easy to deal with complex geometric boundaries and the interactions between multiphase fluid and fluid and between fluid and solid (Ansumali and Karlin, 2005; Chikatamarla and Karlin, 2009; Zhang et al., 2009). At present, LBM models used for multiphase flow simulations mainly include pseudo-potential model (Shan and Chen, 1993), color gradient model (Gunstensen et al., 1991), free energy model (Swift et al., 1995) and phase field model (Shao et al., 2013). Combined with digital core technology (Zhu et al., 2012), LBM is widely used to study the seepage mechanism of multiphase fluid in porous media (Cantisano et al., 2013). Furthermore, compared with LBM, the molecular dynamics method is also a powerful tool to study the microcosmic mechanisms (Huang et al., 2020; Huang et al., 2021a; Huang et al., 2021b). But molecular dynamics is subjected to expensive computational costs, and so it is usually applied to multiphase flows in a simple nanoscale pore structure rather than in porous media with complex pore structure. In recent years, with the wide application of hydraulic fracturing technology in the development of unconventional oil and gas reservoirs (Zou et al., 2015b; Zhang et al., 2018; Li et al., 2022), some scholars have begun to use LBM to study the microscopic imbibition and flowback mechanism of fracturing fluid. In 2015, Zhang et al., 2015 used LBM to simulate the process of gas flooding in saturated water cores based on digital shale cores with a porosity of 16.5% and confirmed that most of the water would remain in the pores and could not be discharged. In 2018, Zheng et al., 2018 used LBM to simulate the influence of wettability heterogeneity distribution on the propagation and distribution of fracturing fluid based on a digital shale core with a porosity of 26.98%. In 2020, Wang et al., 2020b used LBM to simulate the process of water imbibition and oil displacement under the action of capillary force based on the tight sandstone with porosity ranging from 10.3% to 18.6% and studied the influence of pore structure and wettability on spontaneous imbibition. In 2021, Zheng et al., 2021b used LBM to simulate the imbibition and displacement of heavy oil under reservoir conditions based on the digital core of tight sandstone with a porosity of 9.47% and analyzed the distribution law of the oil-water phase. Zhang et al., 2021 developed a pseudopotential-based lattice Boltzmann (LB) method to simulate gas/water two-phase flow at pore scale and simulate gas/water two-phase flow in dual-wettability nanoporous media.
Although some scholars use LBM to simulate the imbibition (or flowback) process of fracturing fluid, they only simulate a single imbibition (or flowback) process and do not study the coupled imbibition-flowback process. The imbibition process affects the flowback behavior because the gas-liquid saturation distribution at the beginning of flowback is determined by the gas-liquid saturation distribution after imbibition. It is necessary to simulate the coupled imbibition-flowback process to thoroughly investigate the flowback mechanism of fracturing fluid. In addition, the porosity of the digital core used to simulate the imbibition (or flowback) process of fracturing fluid is relatively large, resulting in the connectivity of the pore structure being good, which is inconsistent with the actual pore structure of deep shale.
In this work, we reconstruct a digital core of deep shale, use LBM to simulate the coupled imbibition-flowback process of fracturing fluid, study the microcosmic mechanism of the imbibition and flowback, and analyze the influence law of critical parameters on the flowback of fracturing fluid under reservoir conditions.
2 Lattice Boltzmann model
The three-dimensional nineteen-discrete-velocity (D3Q19) pseudo-potential model with multiple relaxation times (MRT) (Shan and Chen, 1993; Zheng et al., 2018) is carried out to simulate the imbibition and flowback processes of fracturing fluid. The MRT model has much better numerical stability than the Bhatnagar-Gross-Krook (BGK) model in the simulation of the flows involving complex boundaries such as porous media flow. In the pseudo-potential model,
where
The collision operator
where
where
The conversion matrix
The external force operator
where
Let
Fluid density
In the pseudo-potential model, the total force
where
3 3D digital core reconstruction for deep shale gas reservoirs
Compared with the other reconstruction methods, Markov Chain-Monte Carlo (MCMC) method (Wu et al., 2006) has higher computational efficiency and can obtain the pore structure of porous media with good connectivity. Therefore, the MCMC method is used to reconstruct the shale digital core in this study. Deep shale cores are from Luzhou block in southern Sichuan. The scanning electron microscope (SEM) scanning image of the deep shale core is shown in Figure 1A. The SEM scanning image is denoised by the median filter algorithm (Dong and Blunt, 2009). The images before and after denoising are shown in Figure 1A and Figure 1B, respectively. It is obvious that the median filter algorithm can obtain a clearer grayscale image. Then the grayscale image is converted to a binarization image, shown in Figure 2, by the Otsu algorithm (Otsu, 1979). The conditional probabilities in three orthogonal directions are obtained by the traversing algorithm. Based on the conditional probabilities, a 3D digital core is reconstructed by the MCMC method. Figure 3 shows the reconstructed 3D digital cores of deep shale with and without isolated pores. The size of the digital core is
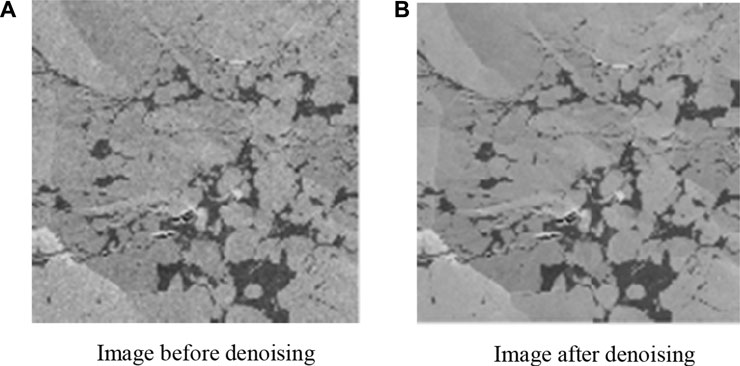
FIGURE 1. SEM scanning images of deep shale core in Luzhou blockflow (A) before denoising and (B) after denoising.
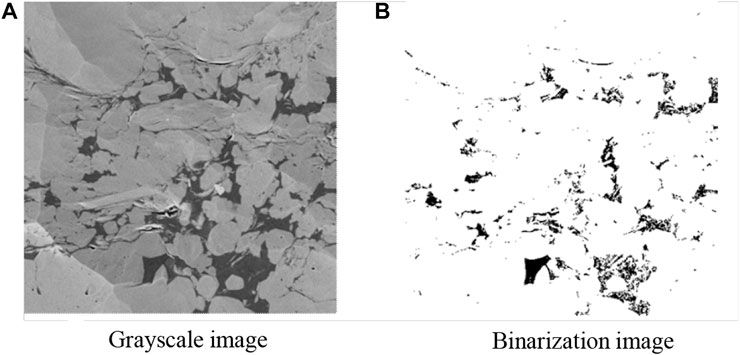
FIGURE 2. Grayscale image (A) and binarization image (B) of deep shale core in Luzhou blockflow.
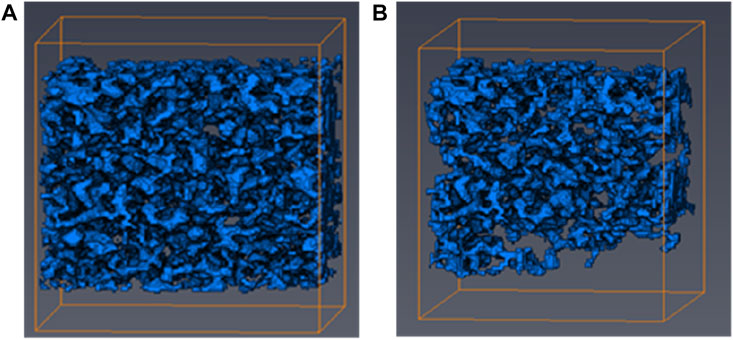
FIGURE 3. 3D digital cores of deep shale (A) with isolated pores and (B) without isolated pores.
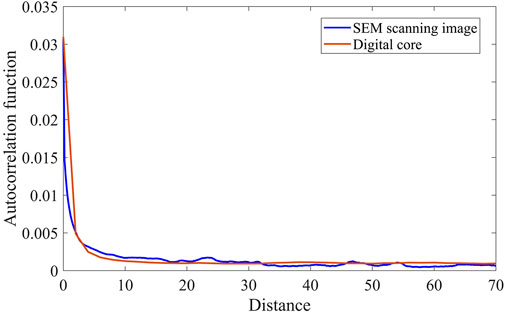
FIGURE 4. Comparison between autocorrelation functions of SEM scanning image and digital core.
4 Microcosmic imbibition mechanism of fracturing fluid
According to the reservoir condition of Luzhou block in southern Sichuan, the basic parameters of LBM simulation are set as follows: the reservoir pressure
In the simulation of the imbibition process, the pore space of the digital core is fully saturated with shale gas (i.e., methane). The fracturing fluid (i.e., water) derived by the capillary force infiltrates into the digital core and replaces the shale gas. The driving force in the imbibition process is the capillary force, which is related to the size of the pore throat. The stopping time of the simulation is 6 million time steps when the stable distribution of the two-phase fluid in the digital core can be obtained. Figure 5 shows the gas-liquid distribution in shale at different time steps and the water saturation versus time steps in the imbibition process. It is seen that the fracturing fluid advances almost uniformly throughout the pore space during the imbibition process. More liquid phase is distributed near the inlet than near the outlet. Water saturation increases with time, but the imbibition rate decreases until it finally becomes almost zero. This observation is because capillary force is the driving force in the imbibition process, and the greater the distance of fracturing fluid penetrating the core, the larger the viscous resistance of fluid migration to be overcome. Therefore, the imbibition rate gradually decreases with time, and eventually, the imbibition becomes equilibrium.
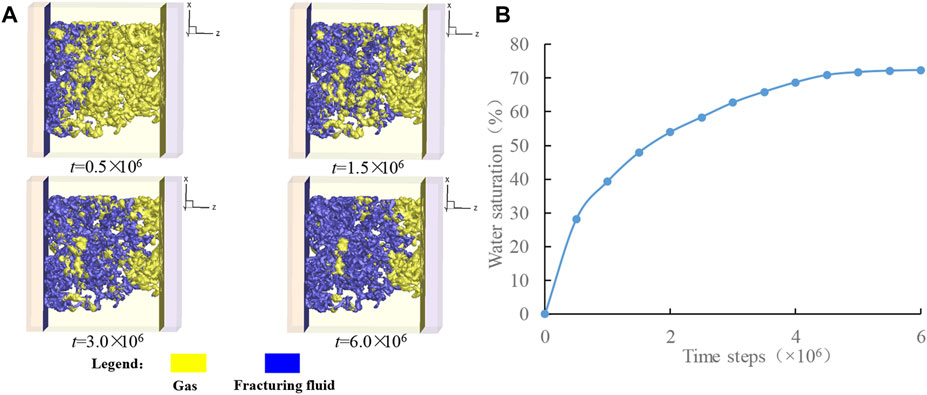
FIGURE 5. The gas-liquid distribution in shale at different time steps (A) and the water saturation versus time steps (B) in the imbibition process.
Figure 6 shows the slice diagrams of gas-liquid distribution at the equilibrium state (
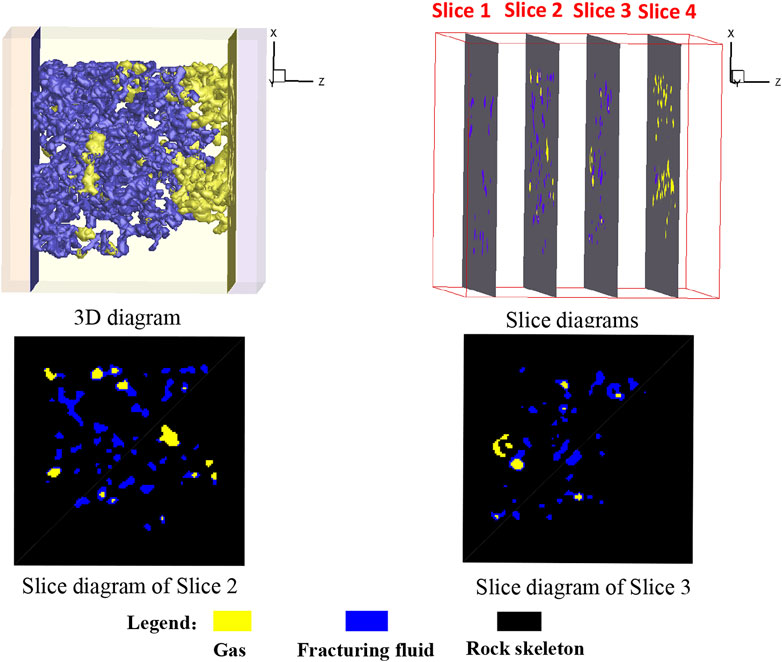
FIGURE 6. Slice diagrams of gas-liquid distribution at the equilibrium state (
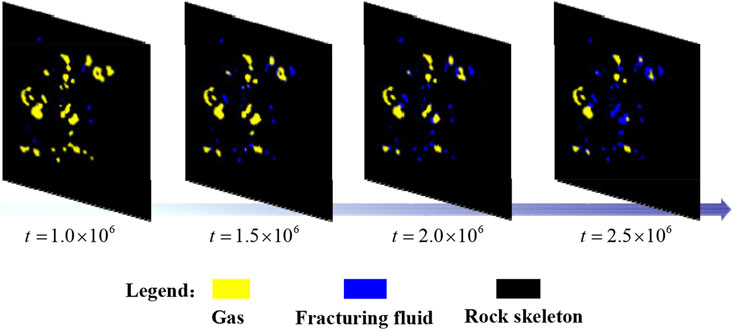
FIGURE 7. Gas-liquid distribution of slice 3 in Figure 6 at different time steps.
5 Microcosmic flowback mechanism of fracturing fluid
The flowback of fracturing fluid is simulated by LBM. the gas-liquid distribution in the digital core at the initial moment of the flowback process is the same as that at the end of the imbibition process, shown in Figure 6. The shale gas is injected continuously at the right outlet, and thus the shale gas displaces the fracturing liquid from right to left. The flowback pressure difference is set as 3.0 MPa. The boundary conditions and the basic parameters are the same as those applied in the case of the imbibition process. The stopping time of the simulation is 4 million time steps when the gas-liquid distribution in the digital core almost tends to be stable.
Figure 8 shows the gas-liquid distribution in shale at different time steps and the water saturation, gas saturation, and flowback rate versus time steps in the flowback process. It is seen that the viscous fingering is clearly observed during the flowback process, where shale gas flows through large pores to form a flow channel, and the fracturing fluid stays in tiny pores, resulting in a low flowback rate of the fracturing fluid. The flowback rate increases gradually with the flowback time and eventually tends to be almost constant.
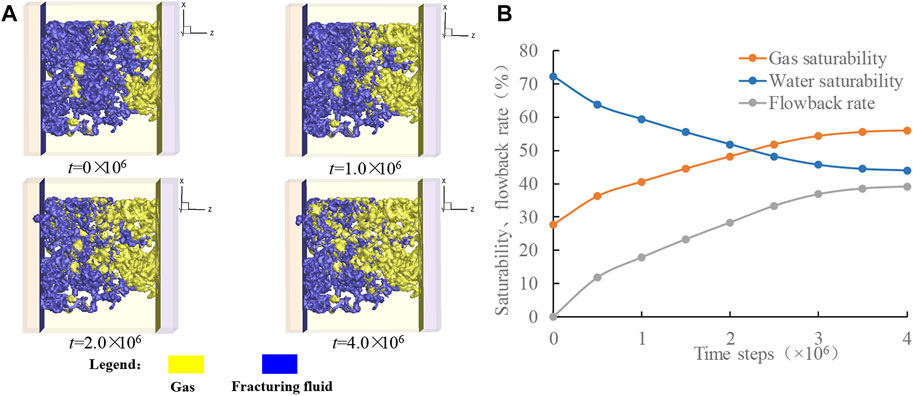
FIGURE 8. The gas-liquid distribution in shale at different time steps (A) and the water saturation, gas saturation, and flowback rate versus time steps (B) in the flowback process.
Figure 9 shows slice diagrams of gas-liquid distribution at the equilibrium state (
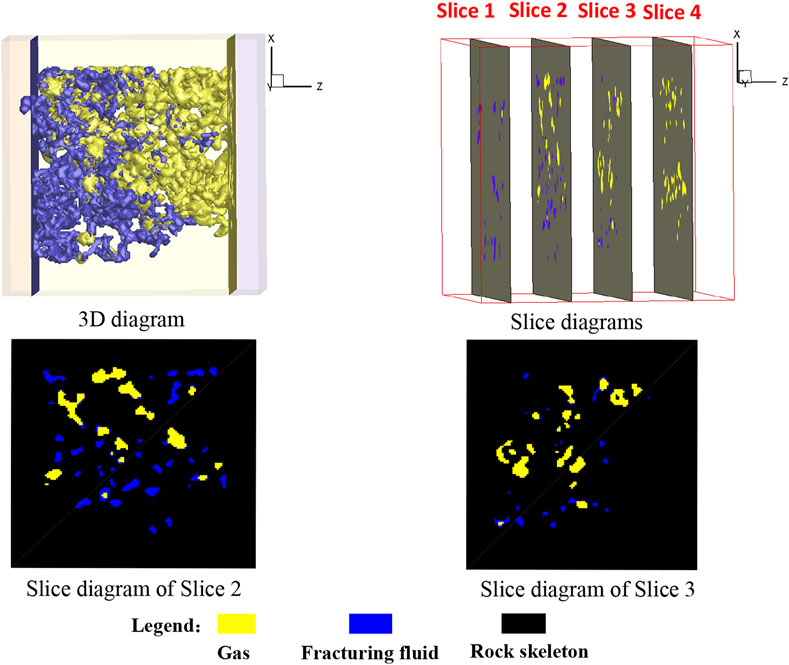
FIGURE 9. Slice diagrams of gas-liquid distribution at the equilibrium state (
Figure 10 shows the gas-liquid distribution of slice 2 in Figure 9 at different time steps. It is seen that with the increase of time, the proportion of the area occupied by the gas phase in the slice gradually increases, and the increased gas phase was mainly concentrated in the large pores of the slice.
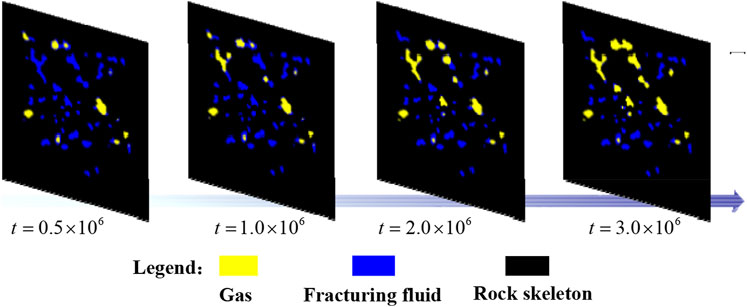
FIGURE 10. Gas-liquid distribution of slice 2 in Figure 9 at different time steps.
6 Sensitivity analysis for imbibition and flowback of fracturing fluid
In this section, based on the LBM simulations of the imbibition and flowback processes, the influence of the wettability, flowback pressure difference, pore structure, and fracturing fluid viscosity, on the imbibition and flowback behaviors are studied in detail. The simulation conditions and basic parameters are the same as those applied in imbibition and flowback cases in section 4 and 5, respectively.
6.1 Wettability of fracturing fluid
The fracturing fluid is driven by capillary force to enter the pore and to replace the gas in shale in the imbibition process, while the capillary force is the resistance in the flowback process. Because the capillary force is related to the wettability of fracturing fluid, the fluid distribution and flowback rate are usually affected by the wettability. The LBM is used to simulate the imbibition and flowback processes under different contact angles.
Figure 11 shows the gas-liquid distribution at the equilibrium state (
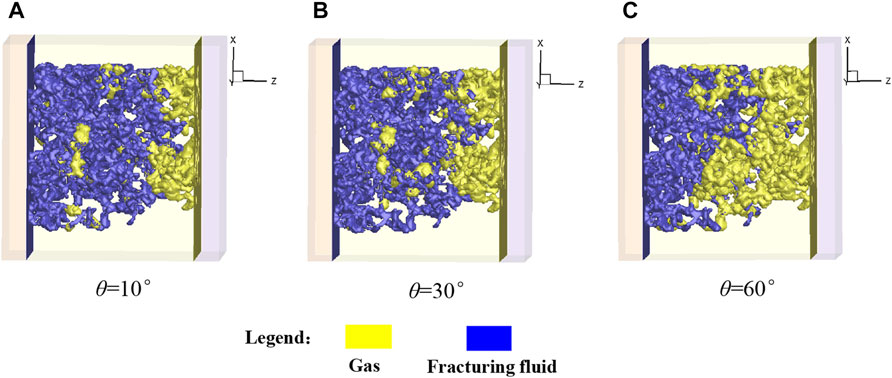
FIGURE 11. Gas-liquid distribution at the equilibrium state (
Figure 12 shows the water saturation versus time steps in the imbibition process under different contact angles. It is observed that under different wetting conditions, the imbibition effect of the fracturing fluid gradually weakens with time, and eventually tends to the imbibition equilibrium. However, with the decrease of the contact angle, the stronger the imbibition effect of the fracturing fluid is, the higher the final water saturation of the core at the equilibrium state is.
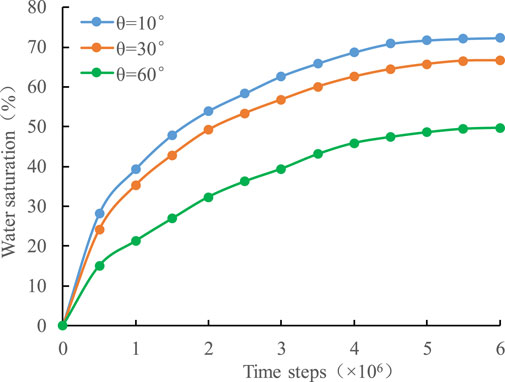
FIGURE 12. The water saturation versus time steps in the imbibition process under different contact angles.
In the simulation of the flowback process under contact angles
Figure 13 shows the gas-liquid distribution at the equilibrium state (
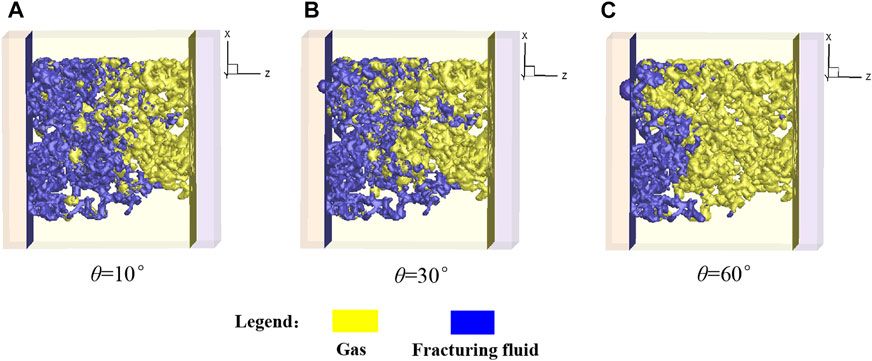
FIGURE 13. Gas-liquid distribution at the equilibrium state (
Figure 14 shows the flowback rate versus time steps and the water saturation versus time steps in the flowback process under different contact angles. It is clear that with the increase of time, the water saturation in core gradually decreases, and the flowback rate gradually increases and finally reaches stability. With the increase of the contact angle, the flowback rate increases significantly. At the equilibrium state (i.e.,
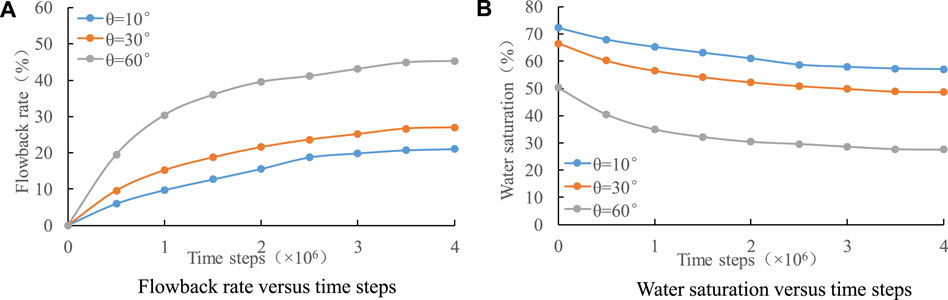
FIGURE 14. The flowback rate versus time steps (A) and the water saturation versus time steps (B) in the flowback process under different contact angles.
6.2 Flowback pressure difference
The effect of flowback pressure difference on the flowback process is investigated in this section. The gas-liquid distribution in the digital core at the initial moment of the flowback process is the same as that at the end of the imbibition process, shown in Figure 6. The flowback pressure differences are set as
Figure 15 shows the gas-liquid distribution at the equilibrium state (
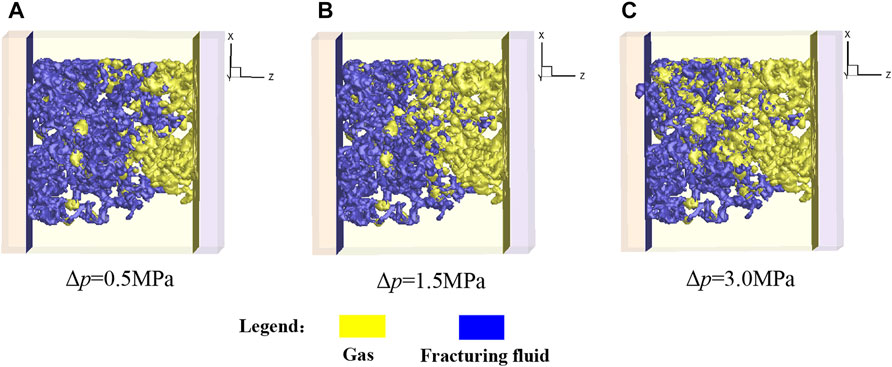
FIGURE 15. Gas-liquid distribution at the equilibrium state (
Figure 16 shows the flowback rate versus time steps and the water saturation versus time steps in the flowback process under different flowback pressure differences. It is seen that with the increase of the flowback pressure difference, the flowback rate increases significantly. At the equilibrium state (i.e.,
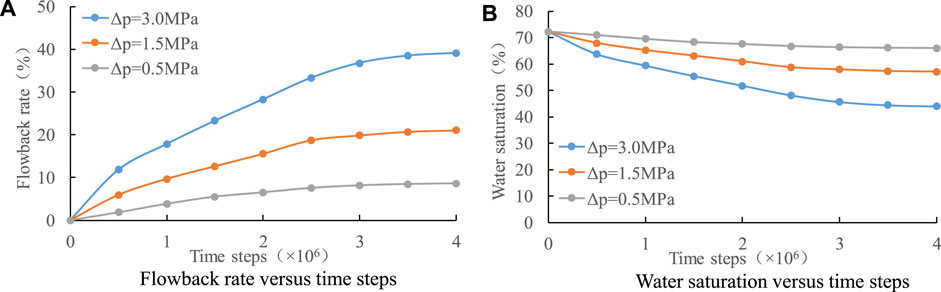
FIGURE 16. The flowback rate versus time steps (A) and the water saturation versus time steps (B) in the flowback process under different flowback pressure differences.
6.3 Pore structure
In order to study the effect of the pore structure on the imbibition and flowback behaviors of the fracturing fluid, another digital core with a tighter pore structure is reconstructed by the MCMC method. The digital core reconstructed in Section 3 is labeled as Core 1 and the new digital core here is labeled as Core 2 (shown in Figure 18). The permeabilities of the two cores are calculated by the LBM. The porosity and permeability of Core 1 are 5.09% and 4.0×10⁻⁴ mD, respectively. The porosity and permeability of Core 2 are 3.90% and 2.3×10⁻⁴ mD, respectively. Obviously, the porosity and permeability of Core 2 are lower than that of Core 1. The pore size distribution of the two cores is shown in Figure 17, which demonstrates that Core 2 has much tighter than Core 1.
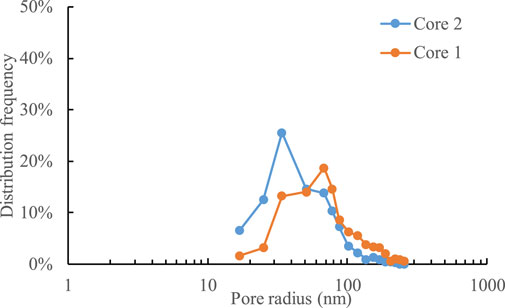
FIGURE 17. The pore size distribution of the two digital cores.
Figure 18 shows the gas-liquid distribution at the equilibrium state (
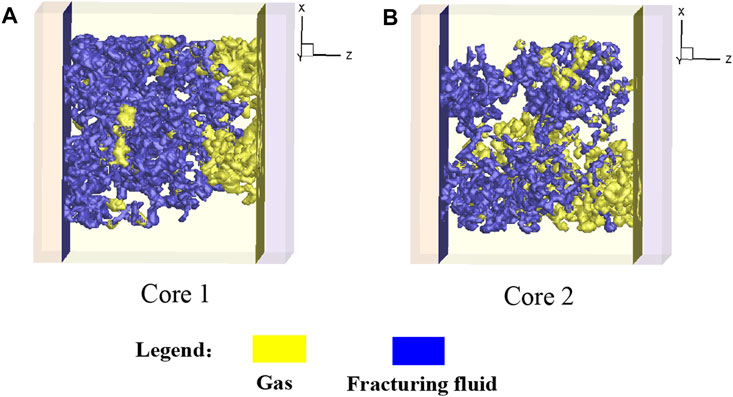
FIGURE 18. Gas-liquid distribution at the equilibrium state (
Figure 19 shows the water saturation versus time steps in the imbibition process under different pore structures. It is interesting that the tighter the pore structure is, the greater the imbibition capillary force is, the stronger the imbibition effect becomes, and the more the fracturing fluid intrudes into the core in the early stage. However, the tight pore structure leads to the increase of gas-water two-phase flow resistance, and the equilibrium time of the imbibition is shortened, and the final imbibition amount is reduced.
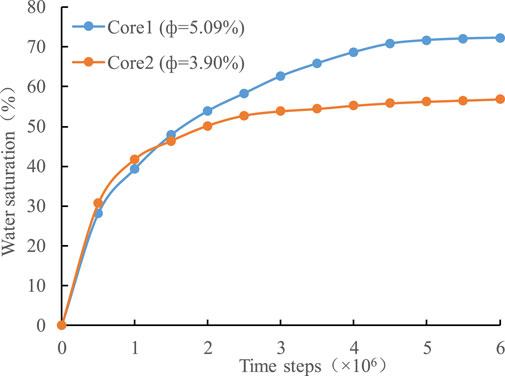
FIGURE 19. The water saturation versus time steps in the imbibition process under different pore structures.
Figure 20 shows the gas-liquid distribution at the equilibrium state (
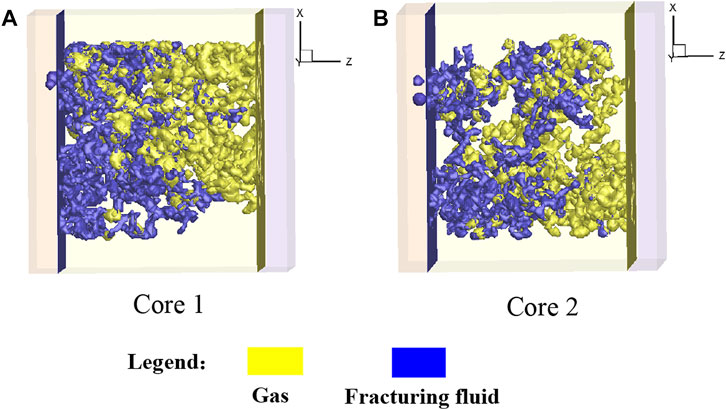
FIGURE 20. Gas-liquid distribution at the equilibrium state (
Figure 21 shows the flowback rate versus time steps and the water saturation versus time steps in the flowback process under different pore structures. It is seen that as the pore structure becomes tighter, the flowback rate decreases. At the equilibrium state (i.e.,
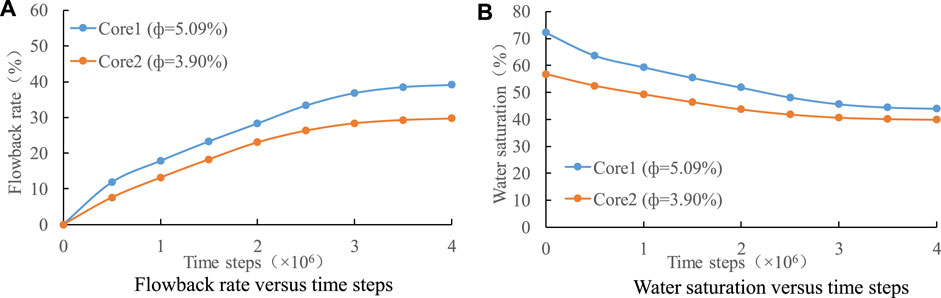
FIGURE 21. The flowback rate versus time steps (A) and the water saturation versus time steps (B) in the flowback process under different pore structures.
6.4 Fracturing fluid viscosity
Figure 22 shows the gas-liquid distribution at the equilibrium state (
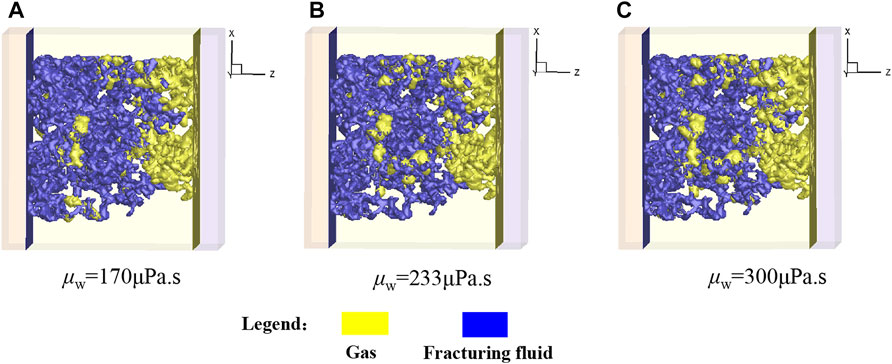
FIGURE 22. Gas-liquid distribution at the equilibrium state (
Figure 23 shows the water saturation versus time steps in the imbibition process under different fracturing fluid viscosities. It is seen that with the decrease of fracturing fluid viscosity, the faster the imbibition speed of fracturing fluid is, and the earlier the imbibition equilibrium is reached.
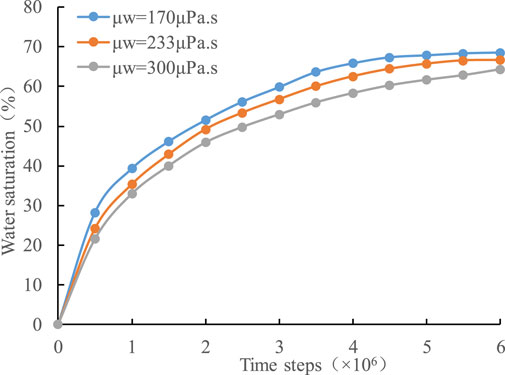
FIGURE 23. The water saturation versus time steps in the imbibition process under different fracturing fluid viscosities.
Figure 24 shows the gas-liquid distribution at the equilibrium state (
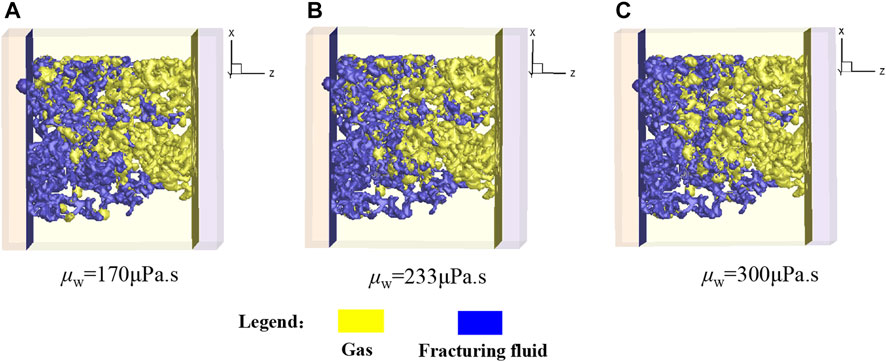
FIGURE 24. Gas-liquid distribution at the equilibrium state (
Figure 25 shows the flowback rate versus time steps and the water saturation versus time steps in the flowback process under different fracturing fluid viscosities. It is seen that as the fracturing fluid viscosity increases, the flowback rate decreases. At the equilibrium state (i.e.,
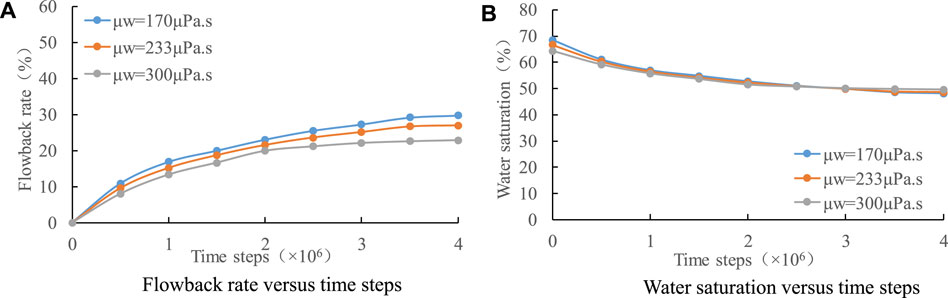
FIGURE 25. The flowback rate versus time steps (A) and the water saturation versus time steps (B) in the flowback process under different fracturing fluid viscosities.
7 Conclusion
In this paper, based on the SEM images of deep shale cores in Luzhou block, a 3D digital core was reconstructed by using the MCMC method. The LBM simulation of the imbibition and flowback processes in the reconstructed core was carried out, and the micro-mechanism of the imbibition and flowback of fracturing fluid was deeply studied. At the same time, the influence law of related parameters on the imbibition and flowback of the fracturing fluid was analyzed. The main results and understandings are as follows.
(1) In the imbibition process of the fracturing fluid, the distribution of the liquid phase near the inlet is more than that at the outlet, the imbibition rate gradually weakens with time, and finally the imbibition tends to be balanced. The fracturing fluid shows a uniform invasion, and the fracturing fluid is easily adsorbed on the pore wall, and the gas phase is located in the central position of the pore.
(2) In the flowback process of the fracturing fluid, the viscous fingering is obvious, the gas flows through the large pore channels, and the fracturing fluid stays in small pores, resulting in a low flowback rate of the fracturing fluid; The flowback rate gradually increases with the flowback time, and finally the flowback rate tends to be constant.
(3) The wettability, flowback pressure difference, and pore structure significantly influence the flowback behavior, while the fracturing fluid viscosity has a smaller effect on the flowback process. The pore structure becomes tighter, the flowback pressure difference becomes smaller, the contact angle becomes larger, and the viscosity of the fracturing fluid becomes larger, resulting a smaller flowback rate of the fracturing fluid.
Data availability statement
The original contributions presented in the study are included in the article/supplementary material, further inquiries can be directed to the corresponding author.
Author contributions
SW, conceptualization, methodology, software, writing—original draft preparation; JW, writing—review and editing, supervision; YL, methodology; XY, data curation; JuZ, visualization; JiZ, writing—review and editing; DZ, methodology, software; BZ, supervision; DL, writing—original draft preparation.
Conflict of interest
Authors SW, JW, YL, XY, JuZ, JiZ, DZ, BZ, and DL were employed by PetroChina Southwest Oil and Gasfield Company.
Publisher’s note
All claims expressed in this article are solely those of the authors and do not necessarily represent those of their affiliated organizations, or those of the publisher, the editors and the reviewers. Any product that may be evaluated in this article, or claim that may be made by its manufacturer, is not guaranteed or endorsed by the publisher.
References
Ansumali, S., and Karlin, I. (2005). Consistent lattice Boltzmann method. Phys. Rev. Lett. 95, 260605. doi:10.1103/physrevlett.95.260605
Cantisano, M., Restrepo, D., Cespedes, S., Toelke, J., Grader, A., Suhrer, M., et al. (2013). “Relative permeability in a shale formation in Colombia using digital rock physics,” in SPE/AAPG/SEG Unconventional Resources Technology Conference, Denver, Colorado, USA, August 12–14, 2013.
Chen, D., Zhang, J., Lan, B., Wang, X., and Wang, Z. (2019). Influence of sedimentary environment on the shale gas reservoir of Sahai formation in Fuxin Basin, northeast China. Energy Sources, Part A Recovery, Util. Environ. Eff. 41, 1949–1959. doi:10.1080/15567036.2018.1548506
Cheng, W., Jiang, G., Xie, J., Wei, Z., Zhou, Z., and Li, X. (2019). A simulation study comparing the Texas two-step and the multistage consecutive fracturing method. Petroleum Sci. 16, 1121–1133. doi:10.1007/s12182-019-0323-9
Cherkaoui, I., Bettaibi, S., Barkaoui, A., and Kuznik, F. (2022). Magnetohydrodynamic blood flow study in stenotic coronary artery using lattice Boltzmann method. Comput. Methods Programs Biomed. 221, 106850. doi:10.1016/j.cmpb.2022.106850
Chikatamarla, S., and Karlin, I. (2009). Lattices for the lattice Boltzmann method. Phys. Rev. E 79, 046701. doi:10.1103/physreve.79.046701
Dong, D., Guan, Q., Wang, S., Huang, J., Wang, Y., and Zhang, C. (2015). Shale gas in China: Reality and dream. Energy Explor. Exploitation 33, 397–418. doi:10.1260/0144-5987.33.3.397
Dong, H., and Blunt, M. (2009). Pore-network extraction from micro-computerized-tomography images. Phys. Rev. E 80, 036307. doi:10.1103/physreve.80.036307
Gao, J., Wang, X., He, S., Guo, X., Zhang, B., and Chen, X. (2017). Geochemical characteristics and source correlation of natural gas in Jurassic shales in the North Fuling area, Eastern Sichuan Basin, China. J. Petroleum Sci. Eng. 158, 284–292. doi:10.1016/j.petrol.2017.08.055
Gunstensen, A. K., Rothman, D. H., Zaleski, S., and Zanetti, G. (1991). Lattice Boltzmann model of immiscible fluids. Phys. Rev. A 43, 4320–4327. doi:10.1103/physreva.43.4320
Guo, X., Hu, D., Li, Y., Liu, R., and Wang, Q. (2014). Geological features and reservoiring mode of shale gas reservoirs in Longmaxi Formation of the Jiaoshiba area. Acta Geol. Sinica-English Ed. 88, 1811–1821. doi:10.1111/1755-6724.12347
Hao, Z., Fei, H., Hao, Q., and Liu, L. (2017). China's shale gas geological investigation and prospecting have made significant progress. Acta Geol. Sin. 91, 727–728. doi:10.1111/1755-6724.13128
Huang, L., Khoshnood, A., and Firoozabadi, A. (2020). Swelling of Kimmeridge kerogen by normal-alkanes, naphthenes and aromatics. Fuel 267, 117155. doi:10.1016/j.fuel.2020.117155
Huang, L., Ning, Z., Lin, H., Zhou, W., Wang, L., Zou, J., et al. (2021). High-pressure sorption of methane, ethane, and their mixtures on shales from Sichuan Basin, China. Energy and Fuels 35, 3989–3999. doi:10.1021/acs.energyfuels.0c04205
Huang, L., Zhou, W., Xu, H., Wang, L., Zou, J., and Zhou, Q. (2021). Dynamic fluid states in organic-inorganic nanocomposite: Implications for shale gas recovery and CO2 sequestration. Chem. Eng. J. 411, 128423. doi:10.1016/j.cej.2021.128423
Jiang, M., Li, J., and Liu, Z. (2022). A simple and efficient parallel immersed boundary-lattice Boltzmann method for fully resolved simulations of incompressible settling suspensions. Comput. Fluids 237, 105322. doi:10.1016/j.compfluid.2022.105322
Kareem, W. A., and Asker, Z. M. (2022). Simulations of isotropic turbulent flows using lattice Boltzmann method with different forcing functions. Int. J. Mod. Phys. C 33, 2250145. doi:10.1142/s0129183122501455
Khan, N. H., Paswan, M. K., and Hassan, M. A. (2022). Natural convection of hybrid nanofluid heat transport and entropy generation in cavity by using lattice Boltzmann method. J. Indian Chem. Soc. 99, 100344. doi:10.1016/j.jics.2022.100344
Li, N., Xie, H., Gao, Z., and Li, C. (2022). Study on the hydraulic fracturing failure behaviour of granite and its comparison with gas fracturing. Sustainability 14, 14593. doi:10.3390/su142114593
Li, Y., Yang, S., Zhao, W., Li, W., and Zhang, J. (2018). Experimental of hydraulic fracture propagation using fixed-point multistage fracturing in a vertical well in tight sandstone reservoir. J. Petroleum Sci. Eng. 171, 704–713. doi:10.1016/j.petrol.2018.07.080
Lutz, B., Lewis, A., and Doyle, M. (2013). Generation, transport, and disposal of wastewater associated with Marcellus shale gas development. Water Resour. Res. 49, 647–656. doi:10.1002/wrcr.20096
Ma, X., Wang, H., Zhou, S., Shi, Z., and Zhang, L. (2021). Deep shale gas in China: Geological characteristics and development strategies. Energy Rep. 7, 1903–1914. doi:10.1016/j.egyr.2021.03.043
Ma, Z., Pi, G., Dong, X., and Chen, C. (2017). The situation analysis of shale gas development in China-based on structural equation modeling. Renew. Sustain. Energy Rev. 67, 1300–1307. doi:10.1016/j.rser.2016.06.085
Nie, G. M., Guo, D., Wang, Y., and Cheng, X. (2013). Research and application of the deep horizontal drilling and completion technology for Liaohe oilfield buried hill reservoir. Appl. Mech. Mater. 241, 1396–1399. doi:10.4028/www.scientific.net/amm.241-244.1396
Otsu, N. (1979). A threshold selection method from gray-level histograms. IEEE Trans. Syst. man, Cybern. 9, 62–66. doi:10.1109/tsmc.1979.4310076
Qu, Z., Wang, J., Guo, T., Shen, L., Liao, H., Liu, X., et al. (2021). Optimization on fracturing fluid flowback model after hydraulic fracturing in oil well. J. Petroleum Sci. Eng. 204, 108703. doi:10.1016/j.petrol.2021.108703
Ren, J., Wang, S., Wu, Q., and Song, Y. (2023). Axisymmetric lattice Boltzmann model for liquid flows with super-hydrophobic cylindrical surfaces. Eur. J. Mech./B Fluids 98, 120–142. doi:10.1016/j.euromechflu.2022.12.001
Ren, J., Zheng, Q., Guo, P., Peng, S., Wang, Z., and Du, J. (2019). Pore-scale lattice Boltzmann simulation of two-component shale gas flow. J. Nat. Gas Sci. Eng. 61, 46–70. doi:10.1016/j.jngse.2018.11.011
Rongved, M., Holt, R., and Larsen, I. (2019). The effect of heterogeneity on multiple fracture interaction and on the effect of a non-uniform perforation cluster distribution. Geomechanics Geophys. Geo-Energy Geo-Resources 5, 315–332. doi:10.1007/s40948-019-00113-4
Shan, X., and Chen, H. (1993). Lattice Boltzmann model for simulating flows with multiple phases and components. Phys. Rev. E 47, 1815–1819. doi:10.1103/physreve.47.1815
Shao, J., Shu, C., Wu, J., and Chew, Y. (2013). A stencil adaptive phase-field lattice Boltzmann method for two dimensional incompressible multiphase flows. Int. J. Numer. Methods Fluids 72, 671–696. doi:10.1002/fld.3759
Shao, J., You, L., Kang, Y., Chen, M., and Tian, J. (2022). Salinity of flowback fracturing fluid in shale reservoir and its reservoir damage: Experimental and field study. J. Petroleum Sci. Eng. 211, 110217. doi:10.1016/j.petrol.2022.110217
Sun, H., Zhou, D., Cai, X., Wang, F., Feng, D., and Lu, T. (2020). Progress and prospects in shale gas development of Sinopec. China Pet. Explor. 25, 14. doi:10.3969/j.issn.1672-7703.2020.02.002
Swift, M., Osborn, W., and Yeomans, J. (1995). Lattice Boltzmann simulation of nonideal fluids. Phys. Rev. Lett. 75, 830–833. doi:10.1103/physrevlett.75.830
Vengosh, A., Jackson, R. B., Warner, N., Darrah, T. H., and Kondash, A. (2014). A critical review of the risks to water resources from unconventional shale gas development and hydraulic fracturing in the United States. Environ. Sci. Technol. 48, 8334–8348. doi:10.1021/es405118y
Wang, F., Chen, Q., Lyu, X., and Zhang, S. (2020). Fracturing-fluid flowback simulation with consideration of proppant transport in hydraulically fractured shale wells. ACS omega 5, 9491–9502. doi:10.1021/acsomega.0c00714
Wang, H., Liao, X., and Ding, H. (2015). Monitoring and evaluating the volume fracturing effect of horizontal well. J. Nat. gas Sci. Eng. 22, 498–502. doi:10.1016/j.jngse.2015.01.005
Wang, S., Chen, L., Feng, Q., Chen, L., Fang, C., and Cui, R. (2023). Pore-scale simulation of gas displacement after water flooding using three-phase lattice Boltzmann method. Capillarity 6, 19–30. doi:10.46690/capi.2023.02.01
Wang, Y., Sun, Y., Liang, D., and Cai, J. (2020). Simulation study on spontaneous imbibition of tight sandstone based on digital core and lattice Boltzmann method. Petroleum Sci. Bull. 5, 458–466. (Chinese).
Wu, K., Van, D., Couples, G., Jiang, Z., Ma, J., and Sorbie, K. (2006). 3D stochastic modelling of heterogeneous porous media-applications to reservoir rocks. Transp. porous media 65, 443–467. doi:10.1007/s11242-006-0006-z
Wu, L., Zhang, J., Jia, D., Wang, S., and Yan, Y. (2022). Performance evaluation of multistage fractured horizontal wells in tight gas reservoirs at Block M, Ordos Basin. Energies 15, 613. doi:10.3390/en15020613
Xu, R., Yang, S., Xiao, Z., and Jin, Y. (2022). Quantitatively study on imbibition of fracturing fluid in tight sandstone reservoir under high temperature and high pressure based on NMR technology. J. Petroleum Sci. Eng. 208, 109623. doi:10.1016/j.petrol.2021.109623
Yang, Y., Xie, L., He, B., and Zhao, P. (2022). Numerical study on the use of alternating injection hydraulic fracturing technology to optimize the interaction between hydraulic fracture and natural fracture. Front. Earth Sci. 10, 422. doi:10.3389/feart.2022.873715
Zhang, J., Yan, G., and Dong, Y. (2009). A new lattice Boltzmann model for the Laplace equation. Appl. Math. Comput. 215, 539–547. doi:10.1016/j.amc.2009.05.047
Zhang, L., Kang, Q. J., Yao, J., Gao, Y., Sun, H., Liu, H., et al. (2015). Pore scale simulation of liquid and gas two-phase flow based on digital core technology. Sci. China Technol. Sci. 58, 1375–1384. doi:10.1007/s11431-015-5842-z
Zhang, R., Zheng, X., Li, S., Jin, K., Zheng, H., and Wang, L. (2018). Environmentally friendly hydraulic fracturing and water-free fracturing technologies. Int. J. Oil, Gas Coal Technol. 17, 375–390. doi:10.1504/ijogct.2018.10012095
Zhang, T., Javadpour, F., Li, J., Zhao, Y., Zhang, L., and Li, X. (2021). Pore-scale perspective of gas/water two-phase flow in shale. SPE J. 26, 828–846. doi:10.2118/205019-pa
Zheng, H., Liao, R., Cheng, N., and Shi, S. (2021). Microscopic mechanism of fracturing fluid imbibition in stimulated tight oil reservoir. J. Petroleum Sci. Eng. 202, 108533. doi:10.1016/j.petrol.2021.108533
Zheng, J., Ju, Y., and Wang, M. (2018). Pore-scale modeling of spontaneous imbibition behavior in a complex shale porous structure by pseudopotential lattice Boltzmann method. J. Geophys. Res. Solid Earth 123, 9586–9600. doi:10.1029/2018jb016430
Zheng, J., Lei, W., Ju, Y., and Wang, M. (2021). Investigation of spontaneous imbibition behavior in a 3D pore space under reservoir condition by lattice Boltzmann method. J. Geophys. Res. Solid Earth 126, e2021JB021987. doi:10.1029/2021jb021987
Zhu, B., Cheng, H., Qiao, Y., Liu, C., Shi, Y., Zhang, K., et al. (2012). Porosity and permeability evolution and evaluation in anisotropic porosity multiscale-multiphase-multicomponent structure. Chin. Sci. Bull. 57, 320–327. doi:10.1007/s11434-011-4874-4
Zou, C., Dong, D., Wang, Y., Li, X., Huang, J., Wang, S., et al. (2015). Shale gas in China: Characteristics, challenges and prospects (I). Petroleum Explor. Dev. 42, 753–767. doi:10.1016/S1876-3804(15)30072-0
Zou, C., Dong, D., Wang, Y., Li, X., Huang, J., Wang, S., et al. (2016). Shale gas in China: Characteristics, challenges and prospects (II). Petroleum Explor. Dev. 43, 182–196. doi:10.1016/S1876-3804(16)30022-2
Keywords: imbibition and flowback, lattice Boltzmann method, deep shale, digital core, microcosmic mechanism
Citation: Wu S, Wu J, Liu Y, Yang X, Zhang J, Zhang J, Zhang D, Zhong B and Liu D (2023) Lattice Boltzmann modeling of the coupled imbibition-flowback behavior in a 3D shale pore structure under reservoir condition. Front. Earth Sci. 11:1138938. doi: 10.3389/feart.2023.1138938
Received: 06 January 2023; Accepted: 20 February 2023;
Published: 08 March 2023.
Edited by:
Jiazheng Qin, Southwest Petroleum University, ChinaReviewed by:
Junjie Ren, Southwest Petroleum University, ChinaQiang Chen, Chongqing University, China
Liang Huang, Chengdu University of Technology, China
Copyright © 2023 Wu, Wu, Liu, Yang, Zhang, Zhang, Zhang, Zhong and Liu. This is an open-access article distributed under the terms of the Creative Commons Attribution License (CC BY). The use, distribution or reproduction in other forums is permitted, provided the original author(s) and the copyright owner(s) are credited and that the original publication in this journal is cited, in accordance with accepted academic practice. No use, distribution or reproduction is permitted which does not comply with these terms.
*Correspondence: Shuai Wu, d3VzaHVhaV8yMDIwQHBldHJvY2hpbmEuY29tLmNu