 Kuo Zhou
 Lingkun Ran
 Wancheng Zhang2
 Haiwen Liu
- 1Laboratory of Cloud Precipitation Physics and Severe Storms, Institute of Atmospheric Physics, Chinese Academy of Sciences, Beijing, China
- 2Yunnan Institute of Meteorological Science, Kunming, China
- 3Hebei Insititute of Meteorological Science, Shijiazhuang, China
- 4Guizhou Meteorological Service Center, Guiyang, China
- 5Department of Aviation Meteorology, Civil Aviation University of China, Tianjin, China
A severe convection process occurred in southern Xinjiang during June 15–17, 2021. Here, the convection initiation mechanism is revealed by analyzing the impacts of three-dimensional divergence (
1 Introduction
Located in the middle of Eurasia, Xinjiang is not directly affected by the monsoon system. It features a typical continental arid and semiarid climate (Wang et al., 2013). However, extreme rainfall events have occurred frequently in recent years (Wang et al., 2017). The annual precipitation can reach 700 mm in favorable terrain conditions in Xinjiang. Unstable stratification, water vapor, and dynamic lifting are three conditions required for the formation of convective weather, among which the first two conditions are generally easy to meet. Therefore, the key to the formation of convective weather is the dynamic lifting condition (Doswell, 2001; Weckwerth et al., 2008; Alexander, 2018).
Deep convective systems are accompanied by intense convergent airflow in lower layers and divergent airflow in higher layers. The contributions from divergence include water vapor transport (Ziegler et al., 1997; Masunaga, 2013), pumping effects (Kalthoff et al., 2009; Ueno et al., 2009) and stimulating gravity waves during geostrophic adjustment (He et al., 2022; Polichtchouk et al., 2022). The dynamic mechanisms for convection initiation can be studied by analyzing divergence development with the divergence equation and its expanded theories (Ulanski and Garstang, 1978; Sun, 1989). Early studies concentrated mainly on horizontal divergence and the factors affecting horizontal divergence (Stevens, 1979; Wang and Sun, 1988; Businger et al., 2001; Chen et al., 2009). The mass field is changed by precipitation during deep convection (Gao et al., 2004). Therefore, additional source and sink terms are introduced into the mass continuity equation, and the three-dimensional divergence is not zero. The convergence and divergence motions in the wind field can be reflected by three-dimensional divergence. In addition, the mass forcing effects are implicitly included in three-dimensional divergence. The effects from the dynamic field and mass field are included in three-dimensional divergence, which is a more comprehensive physical quantity than horizontal divergence (Yang and Gao, 2007).
A series of studies on the convection cell structure (Zhuang et al., 2006), water vapor transport (Zhou et al., 2019), mesoscale convergence line (Huang et al., 2021), and vertical motion equation (Zhou et al., 2022) have been conducted to enhance the understanding of deep convection in Xinjiang. Overall, deep convections in Xinjiang are formed under complicated terrain conditions, and the initiation mechanisms need further analysis. Compared to horizontal divergence, the effects of three-dimensional divergence on convection initiation are still not clear. Based on the above considerations, the effects of three-dimensional divergence on the local pressure, vertical pressure gradient force and vertical velocity are analyzed to reveal the mechanism of convection initiation in Xinjiang during June 15–17, 2021.
2 Synoptic overview
A severe convection process occurred in southern Xinjiang during June 15–17, 2021. Daily precipitation at the Hetian station exceeded 45.5 mm, breaking the local daily precipitation record. Luopu County experienced daily precipitation over 100 mm, reaching a rainstorm level (Zhou et al., 2022). The surface wind speed increased gradually after 0600 UTC on 15 June 2021 at the Hetian automatic weather station and reached a maximum of 6 m s-1 at 1200 UTC on 15 June 2021 (Figure 1), indicating that convection developed during this period.
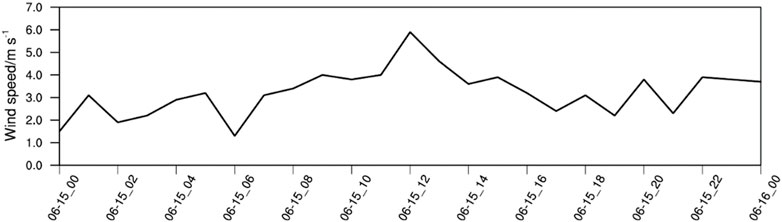
FIGURE 1. Time series of the observed surface wind speed at the Hetian automatic weather station (units: m s−1).
The 200-hPa trough line was located in Central Asia, and Xinjiang was in front of the upper trough at 0000 UTC on 15 June 2021. The jet stream center was to the north of Qinghai Province. Southern Xinjiang was on the right side of the upper jet stream entrance, leading to divergence flows in higher layers (Figure 2A). The central Asia trough at 500 hPa deepened westward and then turned into a horizontal trough. Westerly and southerly winds dominated the southern Xinjiang region (Figure 2B). A high-pressure system near the eastern Aral Sea (60°E, 52°N) and a low-pressure system over the northeastern Altai Mountains (100°E, 55°N) developed robustly at 700 hPa (Figure 2C). The strong northerly wind between these two systems flowed into southern Xinjiang and turned into a northeasterly wind on the windward slope of the Kunlun Mountains. The configuration of synoptic systems at the upper level, middle level and lower level was favorable to convection initiation in southern Xinjiang.
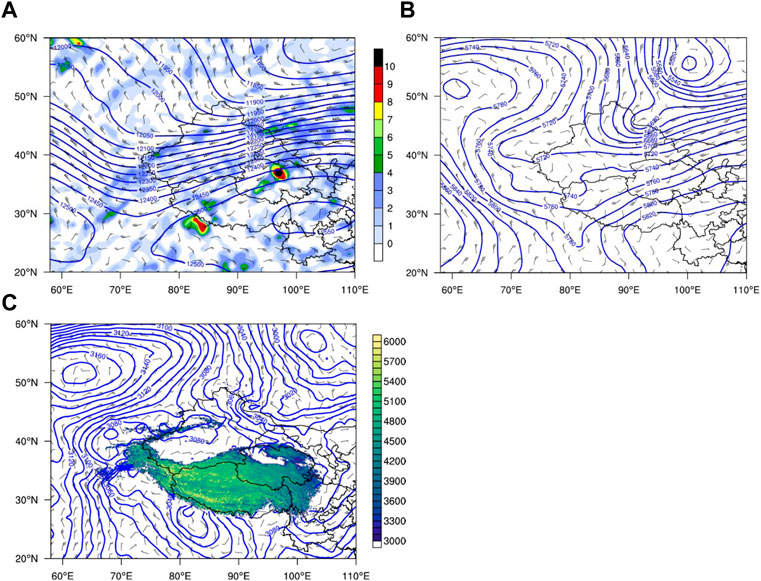
FIGURE 2. (A) Horizontal divergence (shadings, units: 10–5 s-1), geopotential heights (blue contours, units: gpm) and wind fields (wind barbs, units: m s−1) at 200 hPa, and geopotential heights (blue contours, units: gpm) and wind fields (wind barbs, units: m s−1) at (B) 500 hPa and (C) 700 hPa at 0000 UTC on 15 June 2021. In Fig. c, the shaded areas denote the topographical height (units: m).
3 Numerical simulation and three-dimensional divergence
The convection initiation process was simulated using the WRF (V4.4) model and the NCEP (National Centers for Environmental Prediction) operational assimilation system GSI (Gridpoint Statistical Interpolation, Version 3.7). The background field and lateral boundary of the model were obtained from the NCEP global forecast system (GFS) analysis field and forecast field (0.5°×0.5°). The model cold start time was 1200 UTC on 13 June 2021. The three-dimensional variational scheme was used to assimilate the satellite observations and conventional data in the GDAS (Global Data Assimilation System) every 6 h. After two assimilation cycles, a 48-h forecast was carried out from 0000 UTC on 14 June 2021. The horizontal resolution of the model was 3 km (901×901 grid points) with a total of 61 vertical levels. The model top was fixed at 50 hPa. The WSM6 cloud microphysics scheme (Hong et al., 2006a), RRTMG longwave radiation and shortwave radiation scheme (Iacono et al., 2008), Noah land surface model (Tewari et al., 2004), and YSU planetary boundary layer scheme (Hong et al., 2006b) were adopted.
The observed precipitation data were obtained from the CLDAS (China Meteorological Administration Land Data Assimilation System) hourly merged precipitation grid dataset (0.05°×0.05°). The observed rain belts extended from northwest to southeast along the Kunlun Mountains. The simulated precipitation center (79°E, 37°N) was located west of the observed precipitation center (80°E, 37°N). This discrepancy may have resulted from the initial fields, approximations and parameterizations of the model, but the overall precipitation area was consistent with the observations (Figure 3B). The domain-mean precipitation value was calculated within the red rectangular box in Figure 3A. The precipitation increased gradually after 0700 UTC on 15 and entered the mature stage at 1600 UTC on 15. The simulated precipitation was weaker than the observation, while the precipitation evolution agreed well with the observation (Figure 3C). The linear correlation coefficient between the observed and simulated precipitation was 0.967. A two-tailed sample t-test on the significance of the correlation coefficient was conducted with 23 degrees of freedom, and the critical correlation coefficient at the 1% significance level was 0.505. Therefore, the relations between the observed and simulated precipitation were statistically significant. The convection initiation mechanism was then analyzed based on these simulation results.
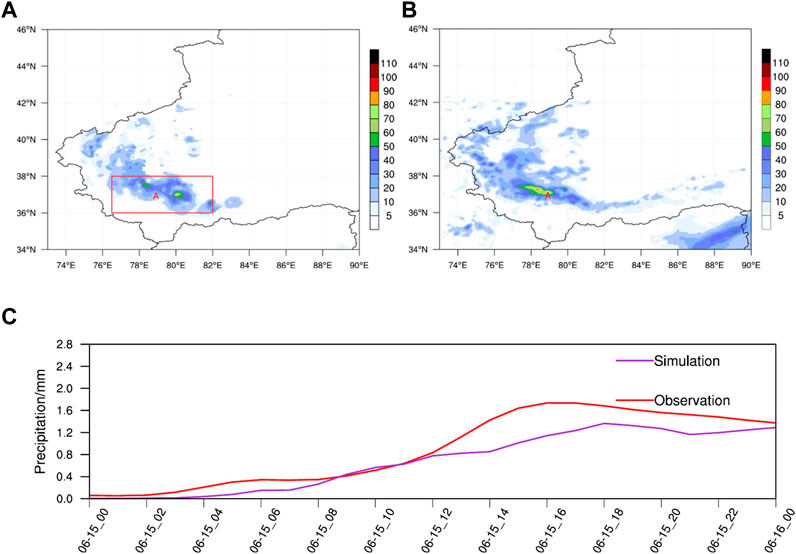
FIGURE 3. (A) Observed and (B) simulated 24-h accumulated precipitation (units: mm) at 0000 UTC on 16 June 2021 and (C) time series of the simulated and observed domain-mean hourly precipitation. The red rectangular box in panel a denotes the area where the domain-mean value was calculated in panel (C). The “A” labels in panels (A, B) denote the convection initiation position.
The primary convection cell was in the initiation stage at 0700 UTC on 15 June 2021 (Figure 4). Convergence motions were dominant in horizontal divergence (
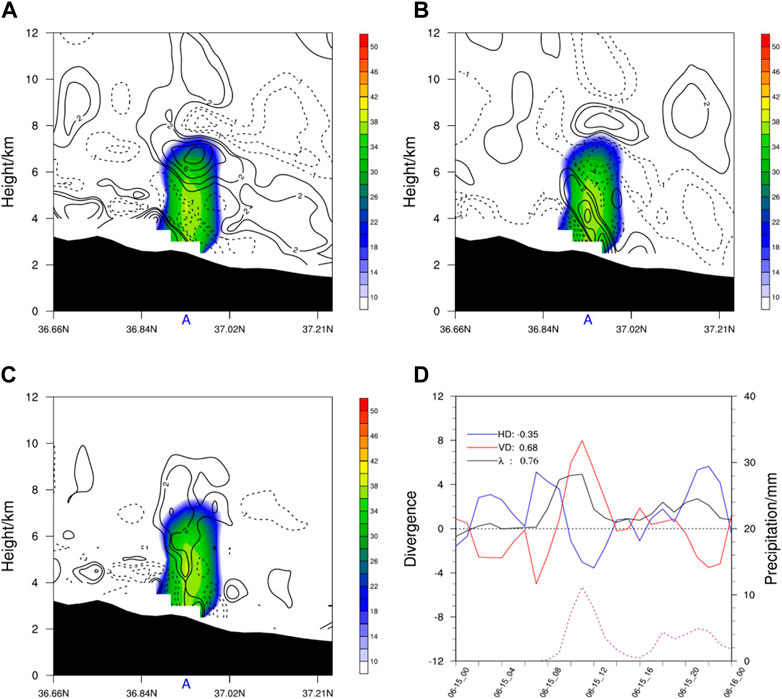
FIGURE 4. Cross sections of reflectivity (shadings, units: dBZ) and (A) horizontal divergence (black contours, units: 10–4 s-1, dotted line for negative value), (B) vertical divergence (black contours, units: 10–4 s-1), and (C) three-dimensional divergence (black contours, units: 10–4 s-1) along 78.91°E at 0700 UTC on 15 June 2021; (D) time series of domain-mean horizontal divergence (blue line, units: 10–4 s-1), vertical divergence (red line, units: 10–4 s-1), and three-dimensional divergence (black line, units: 10–4 s-1) integrated from 2 km to 7 km and hourly precipitation (purple dotted line, units: mm). “A” denotes the convection position. The values on the right side of the legend denote the linear correlation coefficient between divergence and simulated precipitation in panel (D). The values in panel d are averaged within 30×30 km around 79°E, 37.15°N.
4 Pressure tendency equation analysis
Yang and Gao (2007) noted that the three-dimensional divergence not only included the convergence and divergence effects of the wind field but also considered the effects of mass forcing. The variations in local pressure can be affected by three-dimensional divergence. Therefore, a pressure tendency equation that included the effects of three-dimensional divergence forcing was derived. The mass continuity equation and thermodynamic equation in Cartesian coordinates are expressed as follows:
where
where
Taking Eqs 3, 4 into Eq. 2 and using the mass continuity Eq. 1, one can obtain the pressure tendency equation as follows:
where
The left-hand side term in Eq. 6 is the local change in pressure. On the right-hand side of Eq. 6, according to the order, the terms are the zonal pressure advection term, meridional pressure advection term, vertical pressure advection term, three-dimensional divergence forcing term and diabatic forcing term. Eq. 6 can be used to analyze the effect of three-dimensional divergence on the pressure change.
All the terms in Eq. 6 were calculated using simulation data. The vertical pressure advection term and three-dimensional divergence forcing term were predominant in affecting pressure change during the convection initiation stage (Figures 5C, D). The other terms were 1–2 orders of magnitude smaller (Figures 5A, B, E). The vertical pressure advection term had positive contributions at 2–6 km at point A (Figure 5C). This indicated that the pressure or air mass was transported upward, leading to stronger local pressure in the upper layers (Liu and Liu, 2011). The three-dimensional divergence forcing term and
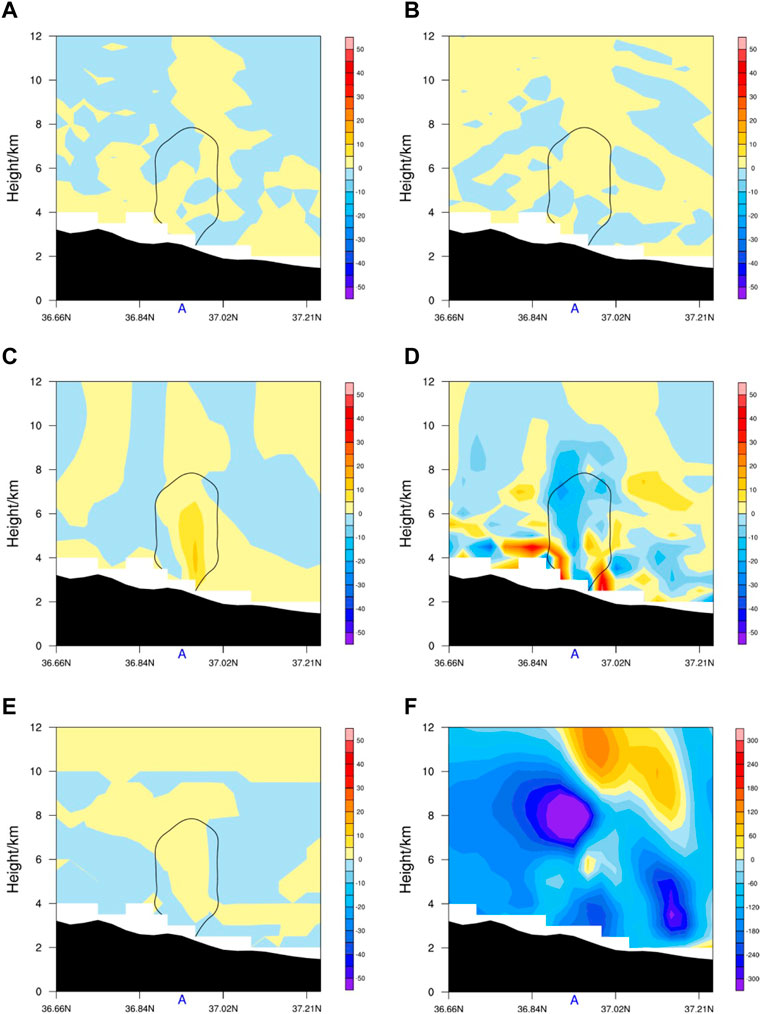
FIGURE 5. Cross sections of the (A) zonal pressure advection term (shadings, units: kg m−1 s−3), (B) meridional pressure advection term (shadings, units: kg m−1 s−3), (C) vertical pressure advection term (shadings, units: kg m−1 s−3), (D) three-dimensional divergence forcing term (shadings, units: kg m−1 s−3), (E) diabatic forcing term (shadings, units: kg m−1 s−3), and (F) pressure change after 6 s (shadings, units: Pa) along 78.91°E at 0700 UTC on 15 June 2021. The black solid line denotes the hydrometeor mixing ratio of 0.2 g kg−1 in panels (A–E).
5 Vertical pressure gradient force equation analysis
The vertical pressure gradient force can accelerate or decelerate the atmospheric vertical motion, resulting in the triggering or inhibition of convection. The vertical pressure gradient force can be expressed in Cartesian coordinates as follows:
Taking
The left-hand side term in Eq. 8 is the local change in the vertical pressure gradient force. The terms on the right-hand side of Eq. 8 are the advection term of the vertical pressure gradient force, coupled term of the three-dimensional divergence and vertical pressure gradient force, vertical gradient of the three-dimensional divergence term, pressure advection term caused by vertical wind shear, and vertical gradient of the diabatic term.
Equation 8 was calculated based on simulation data. The results show that the vertical gradient of the three-dimensional divergence term was 1–2 orders of magnitude greater than those of the other terms. As shown in Figure 6A, the negative values of the three-dimensional divergence term were mainly below 4 km and above 7 km, and positive values were identified on both sides of point A. Two positive centers were located at point B at 5 km and point C at 4 km (Figure 6A). Divergence motions of
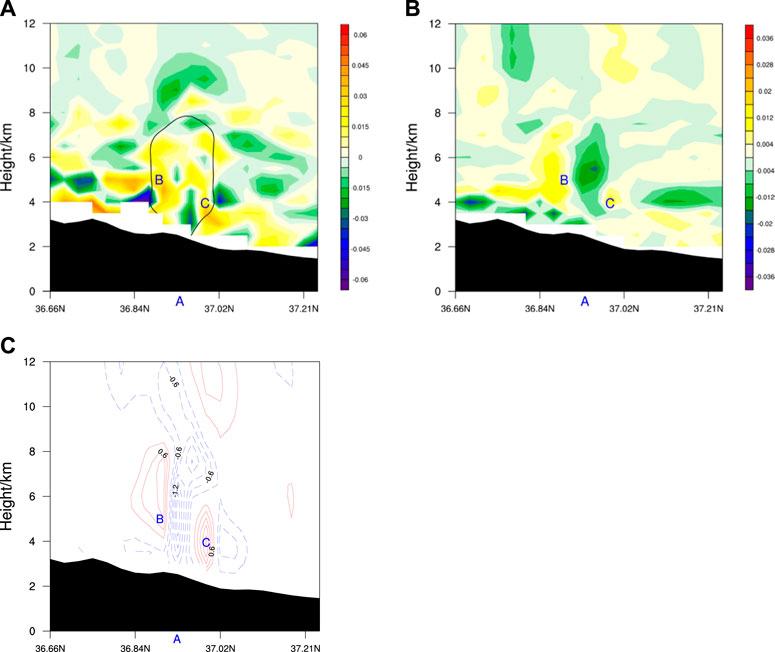
FIGURE 6. Cross sections of (A) the vertical gradient term of three-dimensional divergence (shadings, units: m s-3), (B) vertical pressure gradient force change (shadings, units: m s−2) and (C) vertical velocity change (shadings, units: m s−1) after 6 s along 78.91°E at 0700 UTC on 15 June 2021. The labels “B” and “C” denote the positions corresponding to positive changes in VPGF and vertical velocity, respectively.
The local change in the vertical pressure gradient force (
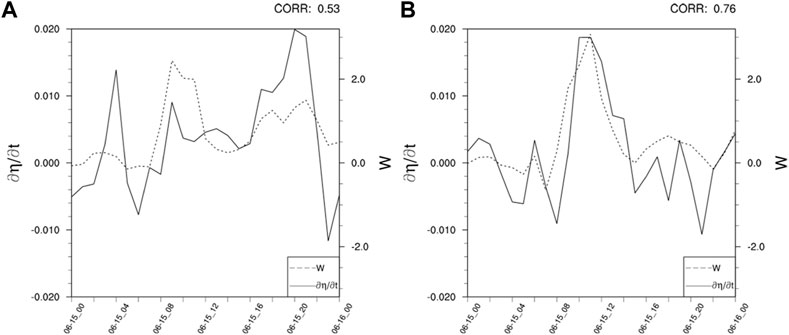
FIGURE 7. Time series of the domain mean of the local vertical pressure gradient force change (black solid line, units: m s−3) and vertical velocity change (black dotted line, units: m s−1) integrated from (A) 3 km–5 km and from (B) 5 km–7 km. The values were averaged within 30 km × 30 km around 79°E, 37.15°N.
6 Convection initiation mechanism in southern Xinjiang
The pressure at the windward slope of the Kunlun Mountains was strengthened by the convergence of
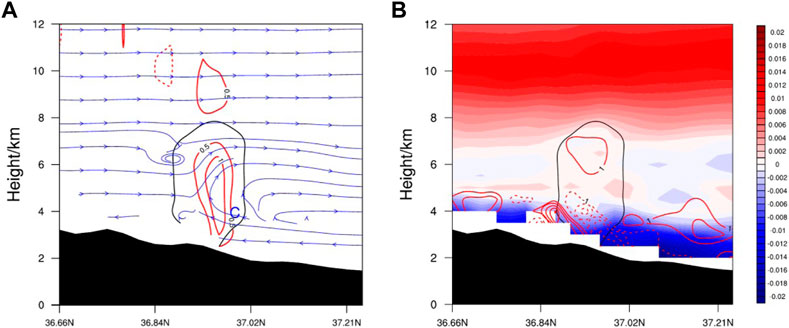
FIGURE 8. Cross sections of (A) the vertical velocity (red contours, units: m s−1) and streamlines, (B) atmospheric stratification stability (shadings, units: km−1) and water vapor flux divergence (red contours, units: 10–6 g cm−2 hPa−1 s−1) along 78.91°E at 0700 UTC on 15 June 2021.
According to the analyses above, a schematic of convection initiation in southern Xinjiang was built. As shown in Figure 9, The strong northerly wind was blocked by the Kunlun Mountains, resulting in three-dimensional convergence at 3 km (
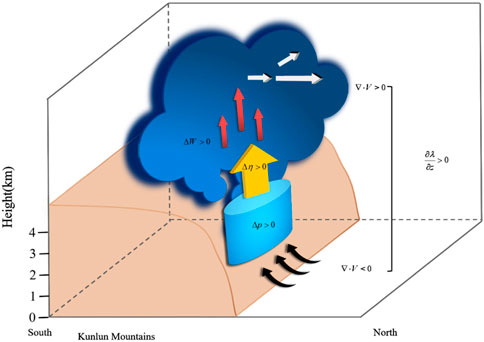
FIGURE 9. Schematic of convection initiation in southern Xinjiang.
The upward VPGF provided dynamic uplift conditions for air parcels. The vertical acceleration increased, and the upward motions were strengthened (
7 Conclusion and discussion
A severe convection process occurred in southern Xinjiang during June 15–17, 2021, resulting in heavy precipitation. The WRF model and GSI assimilation system were used here to perform a high-resolution simulation of this convection. The observed precipitation area, magnitude and evolution trend were well-captured by the simulation data. On this basis, the effects of three-dimensional divergence on convection initiation were fully considered. The impacts of three-dimensional divergence on the pressure and vertical pressure gradient force were analyzed to reveal the convection initiation mechanism. The preliminary conclusions are summarized as follows.
The horizontal divergence and vertical divergence had opposite phase distributions, and both had strong centers away from the convection. The three-dimensional divergence, by contrast, agreed well with the convection position and precipitation evolution.
A pressure tendency equation including the forcing effects from three-dimensional divergence was derived based on the mass continuity equation and thermodynamic equation in Cartesian coordinates. The pressure change was dominated by the vertical pressure advection term and three-dimensional divergence forcing term. The negative pressure change tendency was weakened because of convergence motions from three-dimensional divergence, and a positive pressure change appeared in local areas. The mass field was adjusted by three-dimensional divergence, resulting in a local pressure change.
The vertical pressure gradient force can be affected by pressure changes, thus further impacting the vertical velocity. The vertical pressure gradient force equation was derived herein using the mass continuity equation and pressure tendency equation. The vertical gradient of the three-dimensional divergence term was the dominant term affecting the local change in the vertical pressure gradient force, which was determined by the pressure and vertical gradient of
The local change term on left hand side of the derived equations still had some imbalances with the forcing terms on right hand side. This was mainly aroused by the calculation errors, equation approximation and model errors. But the local change of pressure and VPGF was overall consistent with the spatial distribution mode of the main forcing terms on right hand side of the equations.
Data availability statement
The raw data supporting the conclusion of this article will be made available by the authors, without undue reservation.
Author contributions
KZ and LR contributed to conception and design of the study. WZ and LT organized the database. LC and HL performed the data assimilation. KZ wrote the first draft of the manuscript. LR, WZ and LT reviewed and modified the manuscript.
Funding
This research was funded by the Strategic Priority Research Program of the Chinese Academy of Sciences (Grant XDA17010105), and the National Natural Science Foundation of China (42075008). This work was supported by the National Key Scientific and Technological Infrastructure project “Earth System Numerical Simulation Facility” (EarthLab).
Conflict of interest
The authors declare that the research was conducted in the absence of any commercial or financial relationships that could be construed as a potential conflict of interest.
Publisher’s note
All claims expressed in this article are solely those of the authors and do not necessarily represent those of their affiliated organizations, or those of the publisher, the editors and the reviewers. Any product that may be evaluated in this article, or claim that may be made by its manufacturer, is not guaranteed or endorsed by the publisher.
References
Alexander, L. S., Sills, D. M. L., and Taylor, P. A. (2018). Initiation of convective storms at low-level mesoscale boundaries in southwestern Ontario. Weather Forecast 33 (2), 583–598. doi:10.1175/WAF-D-17-0086.1
Businger, S., Adams, M. E., Koch, S. E., and Kaplan, M. L. (2001). Extraction of geopotential height and temperature structure from profiler and rawinsonde winds. Mon. Weather Rev. 129 (7), 1729–1739. doi:10.1175/1520-0493(2001)129<1729:EOGHAT>2.0.CO;2
Chen, Z. M., Yang, K. Q., and Wu, H. Y. (2009). Mechanism of heavy rainfall maintenance and increment in convergence excited by coupling forces between dynamic and thermodynamic fields (in Chinese with English abstract). ACTA Phys. SIN-CH 58 (6), 4362–4371. doi:10.3321/j.issn:1000-3290.2009.06.116
Gao, S. T., Zhou, Y. S., Cui, X. P., and Dai, G. P. (2004). Impacts of cloud-induced mass forcing on the development of moist potential vorticity anomaly during torrential rains. Adv. Atmos. Sci. 21 (06), 923–927. doi:10.1007/BF02915594
He, Y., Zhu, X. Q., Sheng, Z., He, M. Y., and Feng, Y. T. (2022). Observations of inertia gravity waves in the western pacific and their characteristic in the 2015/2016 quasi-biennial oscillation disruption. J. Geophys. Res-Atmos. 127 (22). doi:10.1029/2022JD037208
Hong, S.-Y., Lim, K.-S., Kim, J.-H., Lim, J.-O. J., and Dudhia, J. (2006a). The WRF single-moment 6-class microphysics scheme (WSM6). J. Korean Phys. Soc. 42, 129–151.
Hong, S.-Y., Noh, Y., and Dudhia, J. (2006b). A new vertical diffusion package with an explicit treatment of entrainment processes. Mon. Weather Rev. 134, 2318–2341. doi:10.1175/MWR3199.1
Huang, X., Zhou, Y. S., Ran, L. K., Kalim, U., and Zeng, Y. (2021). Analysis of the environmental field and unstable conditions on a rainstorm event in the Ili Valley of Xinjiang (in Chinese with English abstract). Chin. J. Atmos. Sci. 45 (1), 148–164. doi:10.3878/j.issn.1006-9895.1912.19219
Iacono, M. J., Delamere, J. S., Mlawer, E. J., Shephard, M. W., Clough, S. A., and Collins, W. D. (2008). Radiative forcing by long-lived greenhouse gases: Calculations with the AER radiative transfer models. J. Geophys. Res-Atmos. 113–D13103. doi:10.1029/2008JD009944
Kalthoff, N., Adler, B., Barthlott, C., Corsmeier, U., Mobbs, S., Crewell, S., et al. (2009). The impact of convergence zones on the initiation of deep convection: A case study from COPS. Atmos. Res. 93 (4), 680–694. doi:10.1016/j.atmosres.2009.02.010
Masunaga, H. (2013). A satellite study of tropical moist convection and environmental variability: A moisture and thermal budget analysis. J. Atmos. Sci. 70 (8), 2443–2466. doi:10.1175/JAS-D-12-0273.1
Polichtchouk, I., Wedi, N., and Kim, Y. H. (2022). Resolved gravity waves in the tropical stratosphere: Impact of horizontal resolution and deep convection parametrization. Q. J. Roy. METEOR. Soc. 148 (742), 233–251. doi:10.1002/qj.4202
Stevens, D. E. (1979). Vorticity, momentum and divergence budgets of synoptic-scale wave disturbances in the tropical eastern Atlantic. Mon. Wea. Rev. 107 (5), 535–550. doi:10.1175/1520-0493(1979)107<0535:vmadbo>2.0.co;2
Sun, S. Q. (1989). The application of divergence variation to analysis and forecasting of mesoscale convective systems (in Chinese with English abstract). Meteor. Mon. 15 (1), 3–8. doi:10.7519/j.issn.1000-0526.1989.1.001
Tewari, M., Chen, F., Wang, W., Dudhia, J., Lemone, M. A., Mitchell, K. E., et al. (2004). “Implementation and verification of the unified noah land-surface model in the wrf model,” in Proceedings of the 20th Conference on Weather Analysis and Forecasting/16th Conference on Numerical Weather Prediction, Seattle, WA, USA, January 2004 (American Meteorological Society), 11–15.
Ueno, K., Takano, S., and Kusaka, H. (2009). Nighttime precipitation induced by a synoptic-scale convergence in the central Tibetan Plateau. J. Meteor. Soc. Jpn. 87 (3), 459–472. doi:10.2151/jmsj.87.459
Ulanski, S. L., and Garstang, M. (1978). The role of surface divergence and vorticity in the life cycle of convective rainfall. Part I: Observation and analysis. J. Atmos. Sci. 35 (6), 1047–1062. doi:10.1175/1520-0469(1978)035<1047:TROSDA>2.0.CO;2
Wang, H. J., Chen, Y. N., and Chen, Z. S. (2013). Spatial distribution and temporal trends of mean precipitation and extremes in the arid region, northwest of China, during 1960-2010. Hydrol. Process. 27 (12), 1807–1818. doi:10.1002/hyp.9339
Wang, Y. J., Zhou, B. T., Qin, D. H., Wu, J., Gao, R., and Song, L. C. (2017). Changes in mean and extreme temperature and precipitation over the arid region of northwestern China: Observation and projection. Adv. Atmos. Sci. 34 (3), 289–305. doi:10.1007/s00376-016-6160-5
Wang, Z. X., and Sun, S. Q. (1988). The relationship between environmental vorticity and divergence field associated with heavy rain systems (in Chinese with English abstract). Acta Meteorol. Sin. 46 (04), 110–114. doi:10.11676/qxxb1988.063
Weckwerth, T. M., Murphey, H. V., Flamant, C., Goldstein, J., and Pettet, C. R. (2008). An observational study of convection initiation on 12 June 2002 during IHOP_2002. Mon. Wea. Rev. 136 (7), 2283–2304. doi:10.1175/2007MWR2128.1
Yang, S., and Gao, S. T. (2007). Three-dimensional divergence equation and its diagnosis analysis to storm rainfall system (in Chinese with English abstract). Chin. J. Atmos. Sci. 31 (1), 167–179. doi:10.3878/j.issn.1006-9895.2007.01.17
Zhou, K., Ran, L. K., Cai, R., and Chen, L. (2022). Diagnostic analysis of terrain following vertical motion equation in southern Xinjiang extreme rainstorms (in Chinese with English abstract). Chin. J. Atmos. Sci. 46 (3), 745–761. doi:10.3878/j.issn.1006-9895.2201.21194
Zhou, Y., Xie, Z., and Liu, X. (2019). An analysis of moisture sources of torrential rainfall events over Xinjiang, China. J. Hydrometeorol. 20 (10), 2109–2122. doi:10.1175/JHM-D-19-0010.1
Zhuang, W., Liu, L. P., and Wang, N. (2006). Study on three-dimensional wind fields of mesoscale convective systems in Xinjiang (in Chinese with English abstract). J. Appl. Meteor. Sci. 17 (04), 444–451. doi:10.11898/1001-7313.20060408
Keywords: three-dimensional divergence, pressure, vertical pressure gradient force, vertical velocity, convection initiation
Citation: Zhou K, Ran L, Zhang W, Tian L, Chen L and Liu H (2023) The effect analysis of three-dimensional divergence and its vertical gradient on convection initiation. Front. Earth Sci. 11:1143767. doi: 10.3389/feart.2023.1143767
Received: 13 January 2023; Accepted: 11 April 2023;
Published: 25 April 2023.
Edited by:
Yanping Li, University of Saskatchewan, CanadaReviewed by:
Mingxuan Chen, China Meteorological Administration, ChinaZheng Sheng, National University of Defense Technology, China
Copyright © 2023 Zhou, Ran, Zhang, Tian, Chen and Liu. This is an open-access article distributed under the terms of the Creative Commons Attribution License (CC BY). The use, distribution or reproduction in other forums is permitted, provided the original author(s) and the copyright owner(s) are credited and that the original publication in this journal is cited, in accordance with accepted academic practice. No use, distribution or reproduction is permitted which does not comply with these terms.
*Correspondence: Lingkun Ran, cmxrQG1haWwuaWFwLmFjLmNu