 Tao Xie
 Ying Han
 Qing Ye
 Yan Xue
- China Earthquake Networks Center, Beijing, China
China has been conducting fixed continuous apparent resistivity observations since 1967. Up to June 2022, 45 earthquakes with magnitudes of MS6.0–6.9 have occurred within a range of approximately 250 km from normal operating stations. Through literature investigation and data analysis, monitoring stations counted 61 short-medium-term apparent resistivity anomalous changes (i.e., 44 decrease changes, 15 increase changes, and 2 perturbance changes) appearing before 39 of these earthquakes. In this study, we utilize a fault virtual dislocation model to understand the relative deformations around the epicenters before these earthquakes. The comparison results showed that 36 of the 44 decrease changes were in areas with compression enhancement and that 9 of the 15 increase changes were in areas with relative dilatancy. The results from rock petrophysical experiments and the resistivity model of the cracked medium showed decreased changes in the resistivity of water-bearing geomaterials during the successive loading of compressive stress, while the resistivity showed increased changes during the stress unloading process. Moreover, 45 of the 61 apparent resistivity anomalies were consistent with the mechanism of resistivity change under stress. These apparent resistivity anomalous changes before earthquakes may be related to the seismogenic processes such that the resistivity change is caused by medium deformation.
1 Introduction
Earthquakes are natural hazards that humans face. Earthquake prediction has long been a goal of seismologists. It has been well accepted from the view of mechanics that an earthquake is a result of fault instability and rupture when continuous stress accumulation on a fault exceeds the fault strength (Chen, 2009). Until failure, rocks under stress loading often undergo stages of elastic deformation, inelastic deformation, and final rupture. Recent studies have found a brief sub-instable stage before the final fault rupture (Ma et al., 2012; Ma and Guo, 2014; Ma, 2016), where the mechanical state on a fault transfers from a stage of stress accumulation to a sub-instable stage of both irreversible deformation and stress release before the final rupture. Studies on the sub-instable stage utilized the migration of small earthquakes on the fault plane, cross-fault baseline and level, rate of crustal movement, water levels of confined aquifers near the fault zone, etc. (e.g., Wang et al., 2018; Zhang et al., 2020; Huang et al., 2021; Wang et al., 2021; Ma et al., 2022). The continuous accumulation of stress on a fault at the late seismogenic stage ought to be accompanied by stratum deformation and changes in physical property parameters. Although multiple anomalies before earthquakes have been reported in the relevant literature (e.g., Cicerone et al., 2009 and references therein), some anomalies do not pass the statistical tests (Wyss, 1991; Wyss, 1997; Wyss and Booth, 1997). The possible reasons include the complexity of the seismogenic environment and the diverse sources in the changes of geophysical data.
Electrical resistivity is an important physical property of rocks and soils. It is mainly governed by mineral composition, crack ratio, crack structure, water salinity in cracks, water saturation, temperature, etc. (Nover, 2005). Experiments have verified the relative dilatancy and crack growth under continuous stress loading up to failure (e.g., Ashby and Hallam, 1986; Bobet and Einstein, 1998; Amann et al., 2014), as well as the decreased electrical resistivity in water-bearing specimens (Brace et al., 1965; Yamazaki, 1966; Jouniaux et al., 2006). In China, apparent resistivity has been continuously monitored at permanent stations since 1967 (He and Shen, 2000; Monitoring and Forecasting Department of CEA, 2010). At present, the monitoring network comprises 89 permanent stations. These stations are distributed in the main seismicity regions of China, including the North-south seismic belt, Xinjiang, North China, and Northeast China. Previous studies reported that electrical resistivity anomalous changes were observed in a short-medium time scale before more than 50 MS≥6.0 earthquakes inside or near the monitoring network (e.g., Qian et al., 1998; Wang et al., 2002; Du, 2011; Xie et al., 2022). However, the mechanisms of the anomalous changes in apparent resistivity before the earthquakes were not well discussed.
If the change in stress accumulation is the major reason for apparent resistivity changes before earthquakes, the background of stress and/or strain changes in the areas around the epicenters should be considered (Wu et al., 2009). The relatively spatial distribution characteristics of stress accumulation and strain can be estimated by the coseismic slips through the FVD model (Zhao et al., 1996; Xie et al., 2020a). A total of 16 earthquakes of MS≥7.0 have occurred with a distance <∼400 km away from the monitoring network since 1969 (Xie et al., 2022). Anomalous changes in apparent resistivity were observed before 13 of these 16 earthquakes. Decrease changes in apparent resistivity were observed before 12 earthquakes in areas with compression enhancement, while increase changes were observed in areas with relative dilatancy. These examples seem to present a phenomenon consistent with the results from rock petrophysical experiments, where the resistivity decreases when the rock specimens are compressed and increases when the pre-loaded stress is released. However, more cases are needed to further verify the relationship between apparent resistivity changes and area deformation.
In this study, we first introduce the measurements of apparent resistivity in China. Second, we describe the apparent resistivity changes before the earthquakes of MS6.0–6.9 that have occurred on the Chinese mainland since 1971. Then, we present the comparison results between the apparent resistivity changes and the relative deformation characteristics (i.e., compression enhancement and relative dilatancy) in the areas around the epicenters, based on the FVD model. Finally, we try to connect the mesoscale mechanism of resistivity change under stress to the macroscale phenomenon of apparent resistivity changes before earthquakes. We hope that these studies on the relationship between apparent resistivity changes and relative deformation around epicenters will help to clearly understand these anomalies.
2 Apparent resistivity observation
The Schlumberger array is a traditional method widely utilized to monitor the changes in apparent resistivity at stations in China. The first station went into operation in April 1967. Currently, 89 stations are placed in seismic zones of the main active faults (Figure 1). Each station contains two or three arrays placed in different directions to monitor the electrical resistivity in those directions (Figure 2). The current electrodes are installed at distances ranging from hundreds of meters to 2.4 km. The detection range in depth roughly equals the distance of the current electrodes in terms of the resistivity meter resolution (Zhao and Qian, 1982; Du et al., 2008). In general, the main detection ranges in depth are below the groundwater level at most stations. Considering the non-uniformity of the strata in both horizontal and vertical directions, the measured data are a kind of comprehensive reflection of the true stratum resistivity in a scale ranging from hundreds of meters to kilometers. The position and electrode spacing of each array are fixed to continuously monitor the apparent resistivity changes over time within the fixed detection volume.
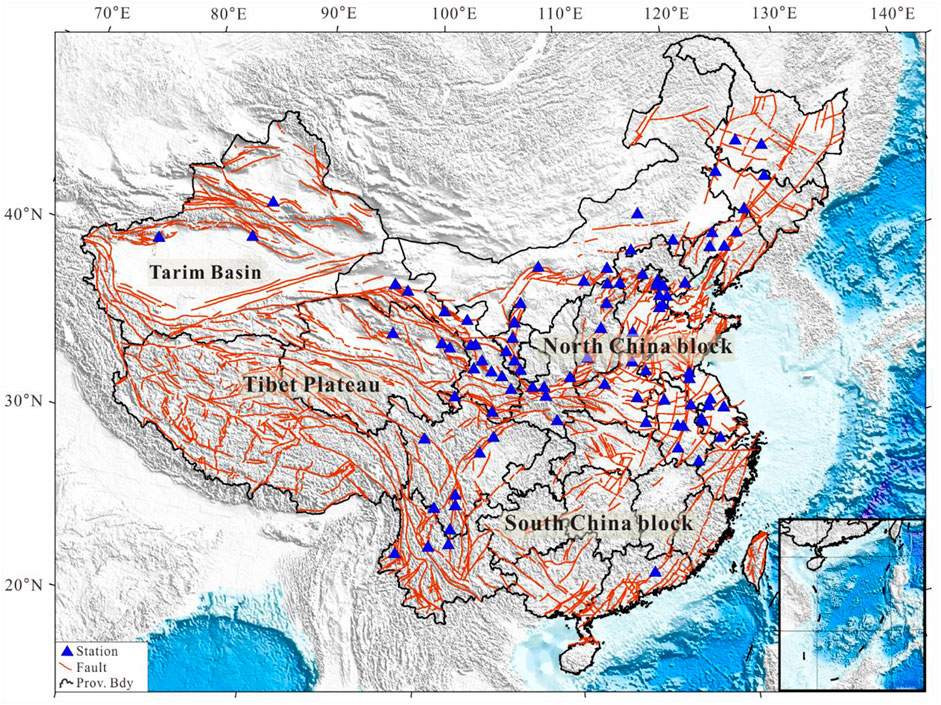
FIGURE 1. Spatial distribution of current apparent resistivity stations in China.
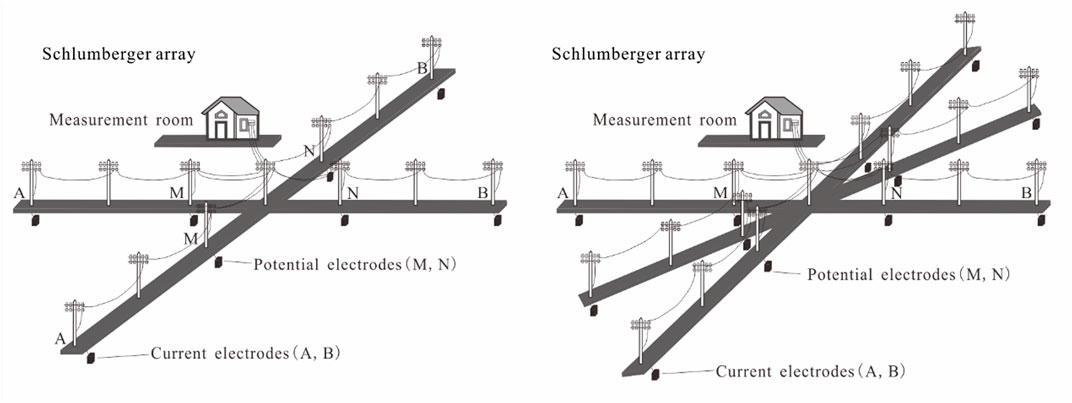
FIGURE 2. Schematic diagram showing the Schlumberger monitoring arrays used in the apparent resistivity stations in China.
A direct current I is alternately applied to the underground stratum through current electrodes A and B (Figure 2). The electrical potential difference
3 Apparent resistivity changes
Apparent resistivity usually shows steady trend changes with clear annual shapes, lasting >3 years. In a certain year, the original trend changes transform into new steady trend changes (e.g., the rate of the trend changes increases, decreases, or even reverses direction). The short-medium-term anomalies associated with earthquakes often last several months to approximately 2 years. The anomalies usually show continuous decrease or increase changes, deviating from the previous years’ background variation ranges. These decrease or increase changes are usually accompanied by distortions in annual variation shape (Qian et al., 1998; Wang et al., 2002; Du, 2011). The amplitudes of these anomalous changes often exceed 1% after eliminating the annual variations (Du et al., 2017). Another type of anomaly is the changes in the amplitudes of annual variation. Apparent resistivity data do not show an obvious decrease or increase changes after the elimination of annual variations. However, the amplitudes of annual variations significantly increase, decrease, and the annual shapes may even disappear. The impending anomalies are usually characterized by acceleration or unstable perturbation changes.
A total of 45 earthquakes of MS6.0–6.9 (not including MS≥6.0 aftershocks of MS≥7.0 within 3 months) occurred within approximately 250 km of the monitoring stations between 1971 and June 2022 (Figure 3). Apparent resistivity showed anomalies before 39 of these earthquakes (Table 1). The stations counted 61 anomalies. Some examples of these apparent resistivity anomalies are shown in Figure 4. No obvious apparent resistivity changes were observed before the 1993 MS6.3 Pu’er earthquake, the 2014 MS6.1 Yingjiang earthquake, the 2021 MS6.0 Luxian earthquake, the 2022 MS6.9 Menyuan earthquake, the 2022 MS6.0 Delingha earthquake, and the 2022 MS6.0 Maerkang earthquake. The Chuxiong station suffered serious disturbance from building works in the monitoring field from 1992 to 1995, just before the 1993 MS6.3 Pu’er earthquake. The Chuxiong station stopped measurement in 1995. The measuring arrays at the Tengchong and Chengdu stations were rebuilt in 2013 and 2021, respectively. The new arrays did not provide enough long-time monitoring data as a background reference for data analysis before the 2014 Yingjiang earthquake and the 2021 Luxian earthquake. Regrettably, the stations of Lanlongkou and Baishuihe near the events were seriously disturbed by environmental factors in their own monitoring fields before the 2022 Menyuan and Delingha earthquakes. The stations of Shandan, Wuwei, and Yumen only showed steady trend changes. No obvious short-medium-term anomalous changes appeared.
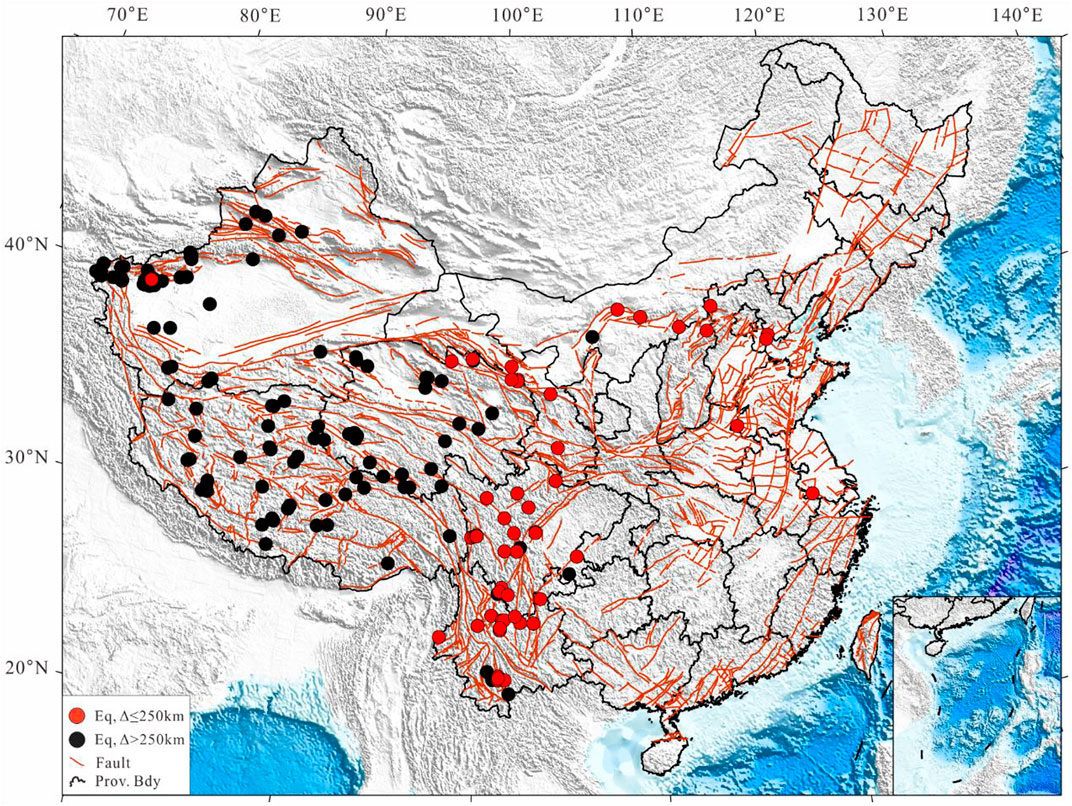
FIGURE 3. Spatial distributions of the MS6.0–6.9 shallow earthquakes detected in China from 1971 to June 2022. △, distance from a monitoring station to the epicenter of an earthquake.

TABLE 1. Changes in apparent resistivity before the 45 earthquakes of MS6.0–6.9.
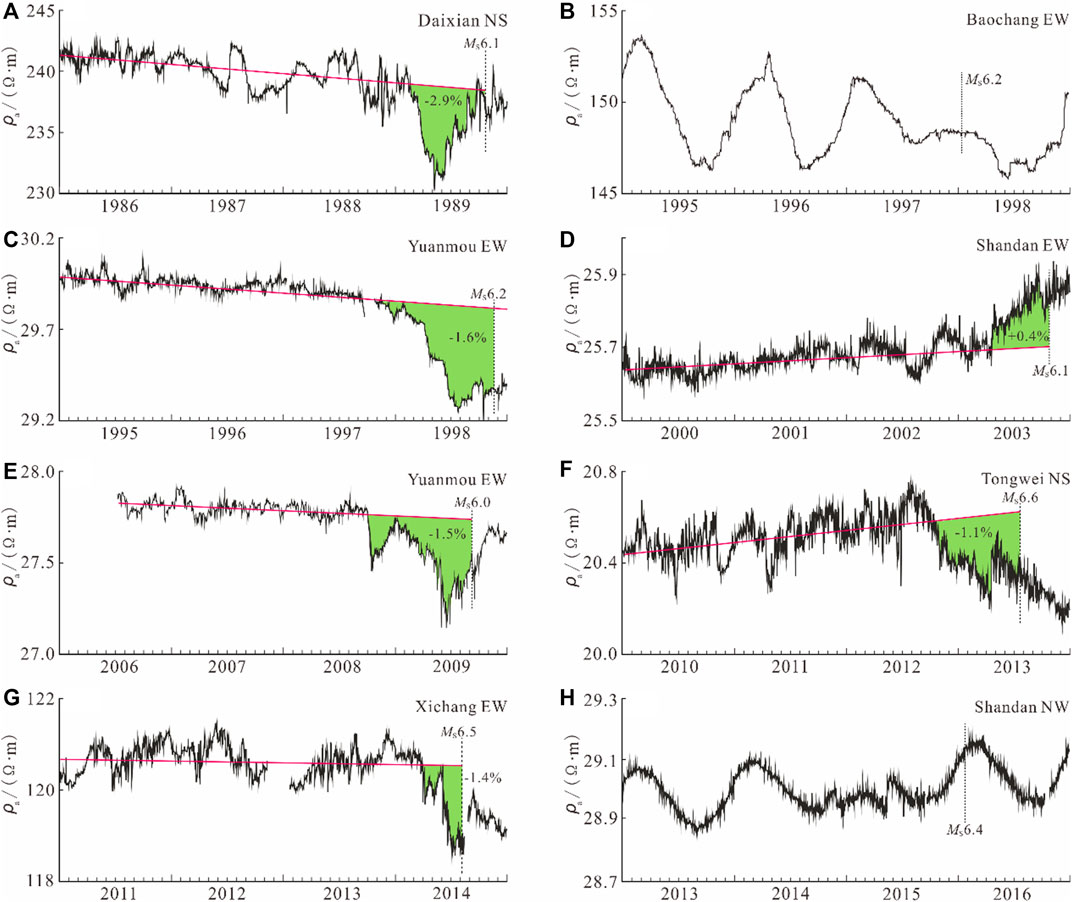
FIGURE 4. Apparent resistivity changes before some earthquakes of MS6.0–6.9. Red lines are linear trends predicted from data before the anomalies appeared; green shadows are anomalies of decrease and increase changes. (A) Decrease change at the Daixian station before the 1989 MS6.1 Datong earthquake. (B) Distortion in the annual shape at the Baochang station before the 1998 MS6.2 Zhangbei earthquake. (C) Decrease change at the Yuanmou station before the 1998 MS6.2 Ninglang earthquake. (D) Increase change at the Shandan station before the 2003 MS6.1 Shandan earthquake. (E) Decrease change of the Yuanmou station before the 2009 MS6.0 Yaoan earthquake. (F) Decrease change of the Tongwei station before the 2013 MS6.6 Minxian earthquake. (G) Decrease change of the Xichang station before the 2014 MS6.5 Ludian earthquake. (H) Distortion in the annual shape of the Shandan station before the 2016 MS6.4 Menyuan earthquake.
4 FVD model
From a view of mechanics, an earthquake is the result of fault rupture when the long-term accumulation of tectonic stress on a fault exceeds the fault strength. The strain energy accumulates in the form of medium deformation before an earthquake occurs. Part of the strain energy is released in the form of fault dislocation, resulting in coseismic slips on the fault plane (Reid, 1911; Chen, 2009). Before an earthquake occurs, it is usually difficult to identify the additional deformation which is presumed to be caused by the seismogenic process and to be superimposed on the regional deformation. However, the release of this additional deformation can be found through the coseismic slips (Shan et al., 2023). Restoring these coseismic slips to the stage when the fault rupture had not yet occurred would help reveal the distribution characteristics of this additional deformation. This is the basic principle of the FVD model.
The apparent resistivity stations are often tens to hundreds of kilometers away from an earthquake. Whether or how an area where a station is located is affected by the seismogenic process should be considered. The deformation characteristics of compression enhancement and relative dilatancy around an earthquake play the role of connecting the mesoscale mechanism of resistivity change to apparent resistivity changes far away from the epicenter. The FVD model is a compromise approach to obtaining the relative deformation around an earthquake (Zhao et al., 1996; Xie et al., 2020a).
4.1 Methodology
The relative changes of area deformation can be estimated by the FVD model. In the FVD model, the coseismic slips are loaded with equal but opposite magnitudes. Figure 5 is a schematic diagram of the FVD model for the three types of faults. For an earthquake containing both normal and strike-slip components or both thrust and strike-slip components, the virtual displacements can be decomposed into two directions parallel and orthogonal to the fault strike on the fault plane. A well-established technique, i.e., the Deformation and Stress-Change Software from Coulomb 3.3 (Lin and Stein, 2004; Toda et al., 2005), is used to calculate the area deformation in the FVD model. In the calculation of the FVD model used in the present study, Young’s modulus E = 7.5 × 10¹⁰ Pa, the Poisson’s ratio σ = 0.25, the shear modulus G = 3 × 10¹⁰ Pa, and the fault friction coefficient μ = 0.4 (Shen et al., 2009). Information on fault dips, strikes, and rakes was obtained from focal mechanism solutions. Parts of the focal mechanisms were obtained from the Harvard CMT Catalog (https://www.globalcmt.org/CMTsearch.html) and USGS Catalog (https://www.usgs.gov/programs/earthquake-hazards/earthquakes). The fault plane parameters (i.e., rupture length, rupture width, and slip displacement) were estimated from the empirical relationships (Wells and Coppersmith, 1994). The basic information, focal mechanisms, and fault plane parameters of the 45 earthquakes are shown in Table 2.
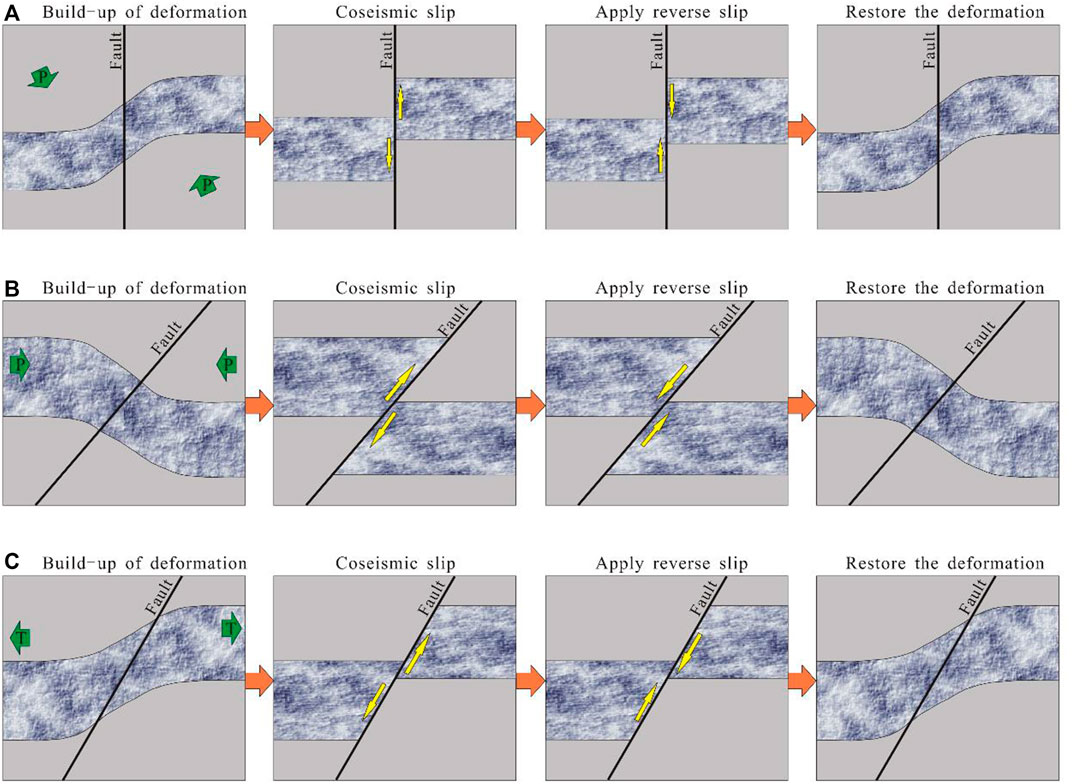
FIGURE 5. Schematic diagram of the FVD model. (A) Strike-slip fault; (B) thrust fault; (C) normal fault.

TABLE 2. Focal mechanisms and coseismic slip models of the 45 earthquakes of MS6.0–6.9.
In a compressive tectonic region, compressive areas from the FVD model can be seen as areas with compression enhancement. The dilatant areas from the FVD model cannot be distinguished between absolutely dilatant areas and compressive areas. However, they can be regarded as relatively dilatant areas where the original extensive stress is enhanced, or the original compressive stress is released to some extent. The situation is reversed in a dilatant tectonic region. However, neither the regional absolute stress level nor the general mathematic relationship between crack activities and stress level has been well-determined. We can only qualitatively discuss the relationship between apparent resistivity changes and the relative deformation characteristics.
4.2 Results
Wang and Shen (2020) presented the crustal deformation of the Chinese mainland based on GPS data from 1991 to 2016 (Figure 6). The deformation rate in the eastern region of China (longitude ≥ 107°E) is low. The Yunnan Province mainly shows dilatant deformation. Sichuan Province contains both dilatant and compressive deformation areas. The compressive deformation is mainly found in the northwestern region of China. Considering the spatial distributions of earthquakes occurring within 250 km from the monitoring stations (Figure 3), the 45 earthquakes were divided into four groups according to their occurrence in the eastern region, the Yunnan Province, the Sichuan Province, and the northwestern region.
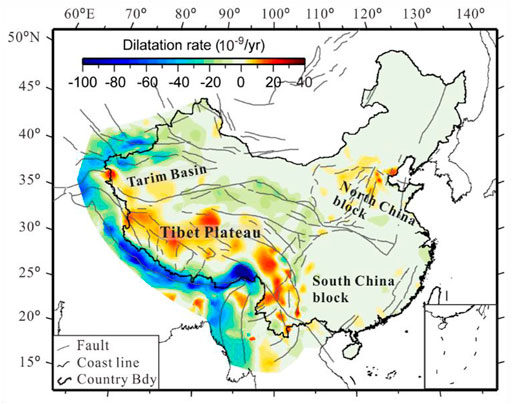
FIGURE 6. Dilatation rate derived from interpolation of GPS velocities (Wang and Shen, 2020).
According to the results from experiments and resistivity models (Brace et al., 1965; Yamazaki, 1966; Jouniaux et al., 2006; Xie et al., 2020b), apparent resistivity changes related to an earthquake are expected to follow an anomaly mechanism in which decrease changes appear in areas with compression enhancement while increase changes appear in areas with relative dilatancy. We will discuss the relationship between apparent resistivity changes before the 39 earthquakes and the relative deformation characteristics.
4.2.1 Eastern region
There were nine earthquakes in the eastern region of China. Apparent resistivity anomalies appeared before all of them. The stations counted 14 anomalies. The relative deformations near the epicenters before the nine earthquakes are shown in Figure 7. The apparent resistivity recorded at the Baotou station showed perturbance variation before the 1996 Baotou earthquake. Perturbance changes in apparent resistivity before earthquakes are usually caused by an instability of the spontaneous electric field (Du et al., 2017). These changes are not suitable for the discussion on the mechanism between apparent resistivity change and area deformation. Eleven of the remaining 13 anomalies were consistent with the anomaly mechanism. The two inconsistent anomalies were 1) the decrease change at the Xuzhuanzi station before the 1976 Ninghe earthquake and 2) the increase change at the Wujiahe station before the 1996 Baotou earthquake. The Xuzhuanzi station is in an area with relative dilatancy (Figure 7B), while the Wujiahe station is at the edge of an area with compression enhancement (Figure 7H). Among the nine earthquakes, the apparent resistivity changes before seven earthquakes were fully consistent with the anomaly mechanism, the changes before one earthquake are partially consistent with this mechanism (the 1976 Ninghe earthquake), and the changes before the final earthquake (the 1996 Baotou earthquake) were inconsistent with this mechanism.
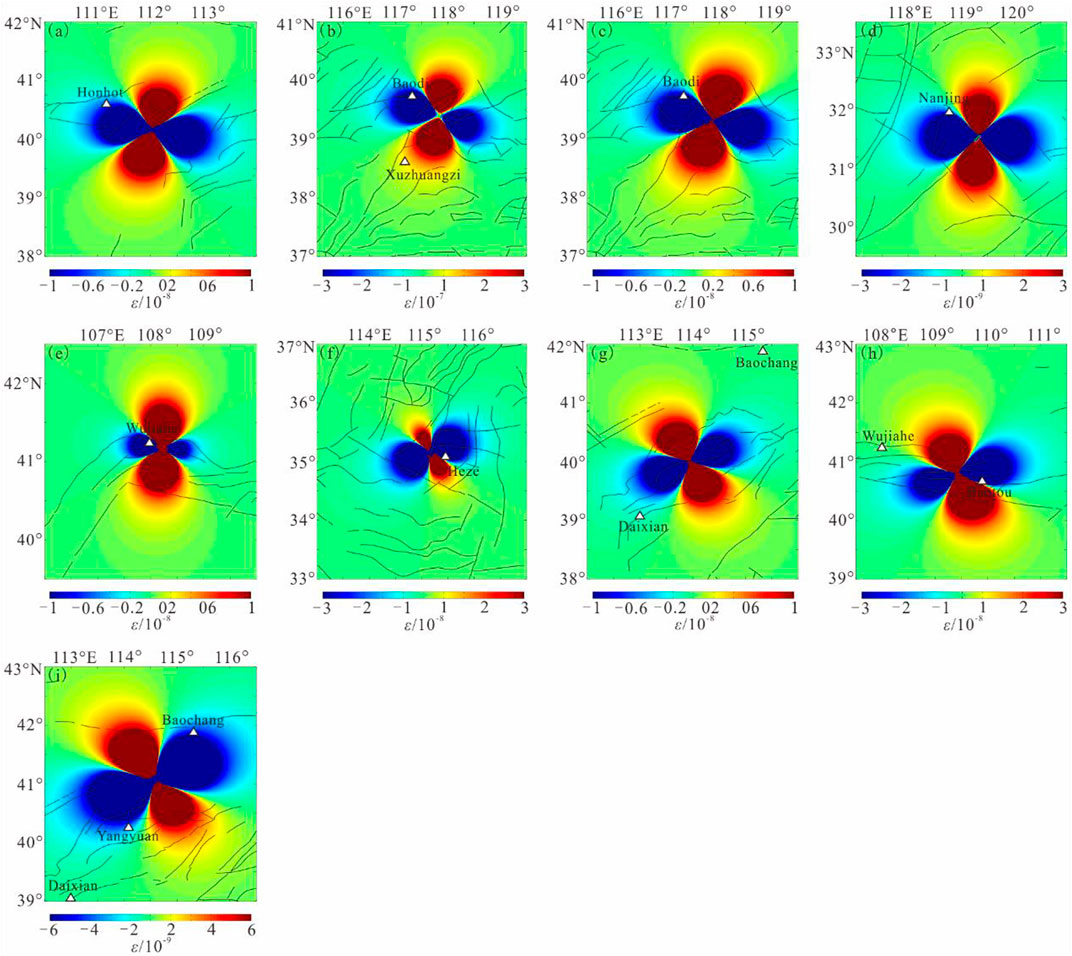
FIGURE 7. Results of the FVD model for the nine earthquakes of MS6.0–6.9 occurring in the eastern region of China (negative compression). White triangles, apparent resistivity stations. (A) The 1976 MS6.2 Horinger earthquake. (B) The 1976 MS6.9 Ninghe earthquake. (C) The 1977 MS6.2 Hangu earthquake. (D) The 1979 MS6.0 Liyang earthquake. (E) The 1979 MS6.0 Wuyuan earthquake. (F) The 1983 MS6.0 Heze earthquake. (G) The 1989 MS6.1 Datong earthquake. (H) The 1996 MS6.4 Baotou earthquake. (I) The 1998 MS6.2 Zhangbei earthquake.
4.2.2 Yunnan Province
There were 15 earthquakes in the Yunnan Province of China. No anomalies were recorded before the 1993 Pu’er earthquake and the 2014 Yingjiang earthquake. The other 13 earthquakes were preceded by 24 apparent resistivity anomalies. The relative deformations before the 15 earthquakes are shown in Figure 8. The apparent resistivity changes before seven earthquakes (the 1971 Pu’er earthquake, the 1979 Pu’er earthquake, the 1985 Luquan earthquake, the 1995 Wuding earthquake, the 1998 Ninglang earthquake, the 2003 Dayao earthquake, and the 2014 Ludian earthquake) were fully consistent with the anomaly mechanism. The changes in apparent resistivity before two earthquakes (i.e., the 2000 and 2009 Yaoan earthquakes) were partially consistent with the anomaly mechanism. Both Yuanmou and Hongge stations showed decrease changes in apparent resistivity before the 2000 Yaoan earthquake. The Yuanmou station is in an area with relative dilatancy. Both stations in Yuanmou and Hongge are also in areas with relative dilatancy before the 2009 Yaoan earthquake. The Yuanmou station showed a decrease change. The apparent resistivity changes before four earthquakes (i.e., the 1976 Ninglang earthquake, the 1981 Pu’er earthquake, the 2001 Yongsheng earthquake, and the 2021 Yangbi earthquake) were inconsistent with the anomaly mechanism. The stations with decrease changes were in areas with relative dilatancy, while the stations with increase changes were in areas with relative compression before the four earthquakes. In this study, 14 of the 24 anomalies were consistent with the anomaly mechanism, while the other 10 anomalies were not. Taking the 2003 Dayao earthquake as an example, three stations (i.e., the Honge, the Yuanmou, and the Xichang) are within 250 km from the epicenter (Figure 9A). Both Hongge and Xichang stations are in areas with relative dilatancy (Figure 8K) and showed increase changes (Figures 9B,C). The Yuanmou station showed decrease change (Figure 9D) and is in an area with compression enhancement (Figure 8K).
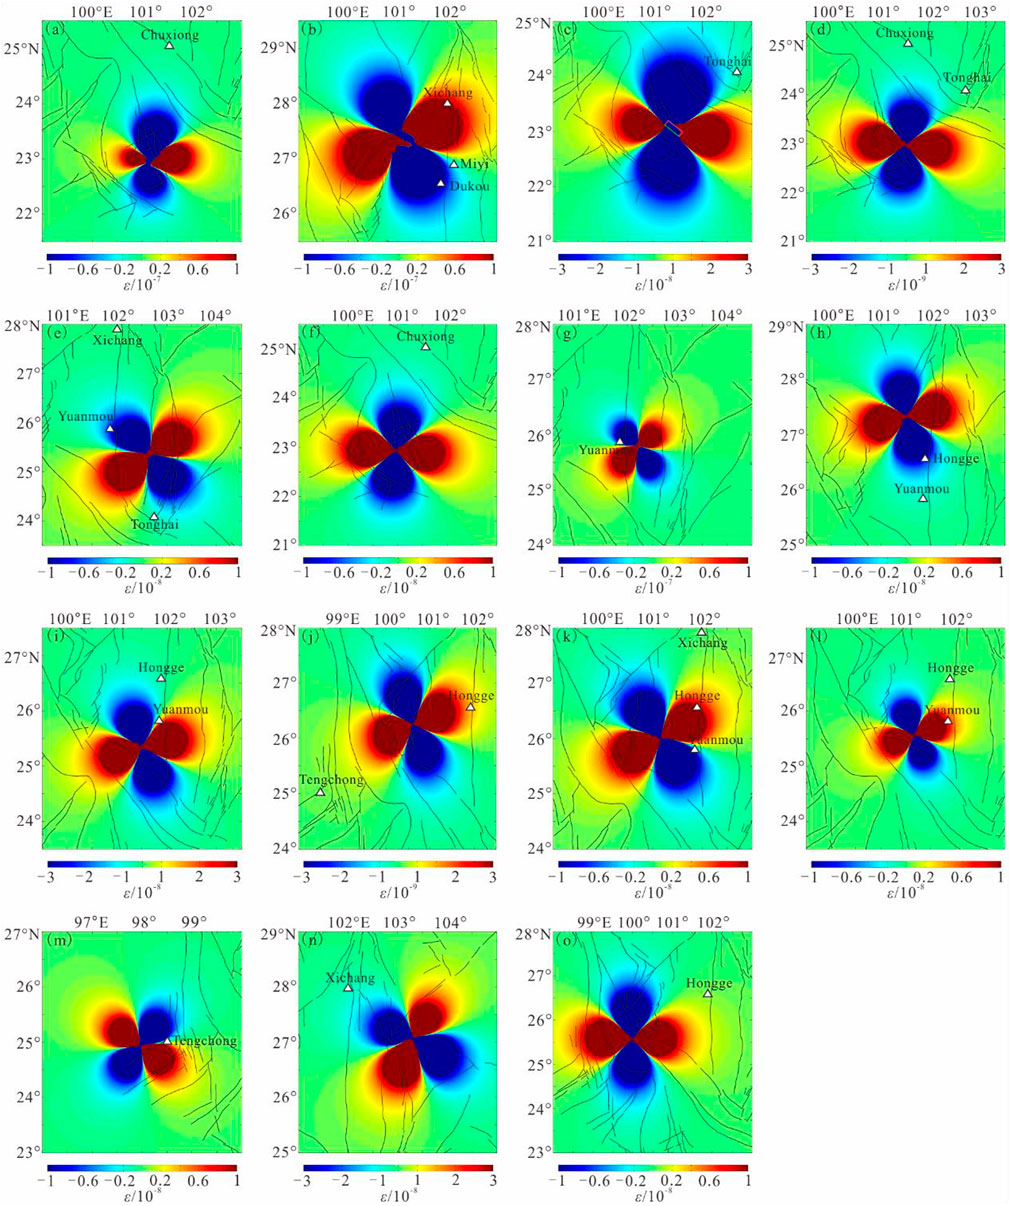
FIGURE 8. Results of the FVD model for the 15 earthquakes of MS6.0–6.9 occurring in Yunnan Province. White triangles, apparent resistivity stations. (A) The 1971 MS6.7 Pu’er earthquake. (B) The 1976 MS6.9 and MS6.8 Ninglang earthquakes. (C) The 1979 MS6.8 Pu’er earthquake. (D) The 1981 MS6.0 Pu’er earthquake. (E) The 1985 MS6.2 Luquan earthquake. (F) The 1993 MS6.3 Pu’er earthquake. (G) The 1995 MS6.5 Wuding earthquake. (H) The 1998 MS6.2 Ninglang earthquake. (I) The 2000 MS6.5 Yaoan earthquake. (J) The 2001 MS6.0 Yongsheng earthquake. (K) The MS6.2 Dayao earthquake on July 21, 2003. (L) The 2009 MS6.0 Yaoan earthquake. (M) The 2014 MS6.1 Yingjiang earthquake. (N) The 2014 MS6.5 Ludian earthquake. (O) The 2021 MS6.4 Yangbi earthquake.
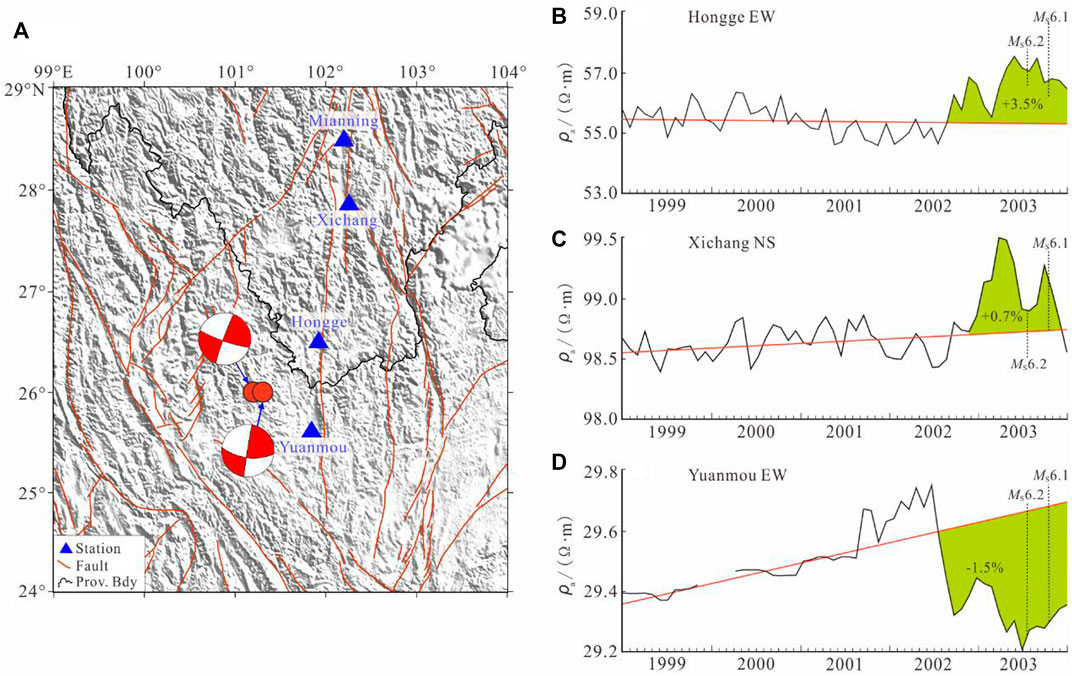
FIGURE 9. Apparent resistivity changes before the 2003 MS6.2 and MS6.1 Dayao earthquakes. The relatively regular annual variations in apparent resistivity data are eliminated. (A) Distribution of apparent resistivity stations. (B) Apparent resistivity data of the Hongge station. (C) Apparent resistivity data of the Xichang station. (D) Apparent resistivity data of the Yuanmou station.
4.2.3 Sichuan Province
There were 12 earthquakes in Sichuan Province. No obvious anomalies appeared before the 2021 Luxian and 2022 Maerkang earthquakes. However, the other 10 earthquakes were preceded by 14 apparent resistivity anomalies. The relative deformations before the 12 earthquakes are shown in Figure 10. Among the 14 anomalies, 12 were consistent with the anomaly mechanism. The two inconsistent anomalies were 1) an increase change at the Hongge station before the 2008 Panzhihua earthquake and 2) a decrease in the amplitude of annual variation at the Jiangyou station before the 2022 Lushan earthquake. The Hongge station is in an area with relative compression, while the Jiangyou station is in an area with relative dilatancy. It did not show an expected increase change. Among the 10 earthquakes with preceding anomalies, the apparent resistivity changes before eight earthquakes were fully consistent with the anomaly mechanism, and the other two earthquakes ( the 2008 Panzhihua earthquake and the 2022 Lushan earthquake) were partially consistent with this mechanism.
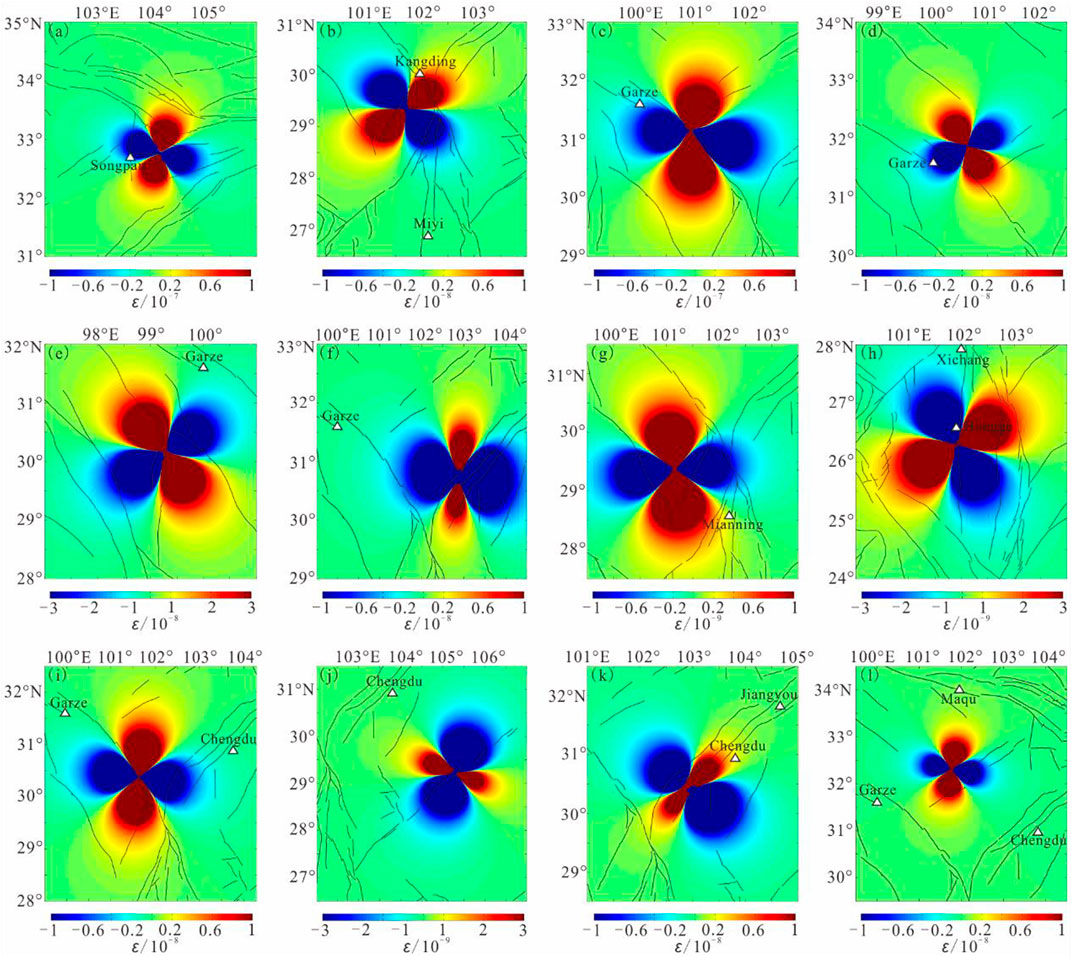
FIGURE 10. Results of the FVD model for the 12 earthquakes of MS6.0–6.9 occurring in Sichuan Province. White triangles, apparent resistivity stations. (A) The 1973 MS6.5 Nanping earthquake. (B) The 1975 MS6.2 Jiulong earthquake. (C) The 1981 MS6.9 Daofu earthquake. (D) The 1982 MS6.0 Garze earthquake. (E) The MS6.6 Batang earthquake on April 16, 1989. (F) The 1989 MS6.5 Xiaojin earthquake. (G) The 2001 MS6.0 Yajiang earthquake. (H) The 2008 MS6.1 Panzhihua earthquake. (I) The 2014 MS6.3 Kangding earthquake. (J) The 2021 MS6.0 Luxian earthquake. (K) The 2022 MS6.1 Lushan earthquake. (L) The 2022 MS6.0 Maerkang earthquake.
4.2.4 Northwestern region
There have been 9 earthquakes in the northwestern region of China. Apparent resistivity only showed steady trend changes before the 2022 Menyuan earthquake and the 2022 Delingha earthquake. Other 7 earthquakes are preceded by 9 short-medium-term apparent resistivity anomalous changes. The relative deformation before the 9 earthquakes is shown in Figure 11. The three arrays at the Tianshui station showed perturbance variations before the 2013 Minxian earthquake. The rest 8 apparent resistivity changes are consistent with the anomaly mechanism.
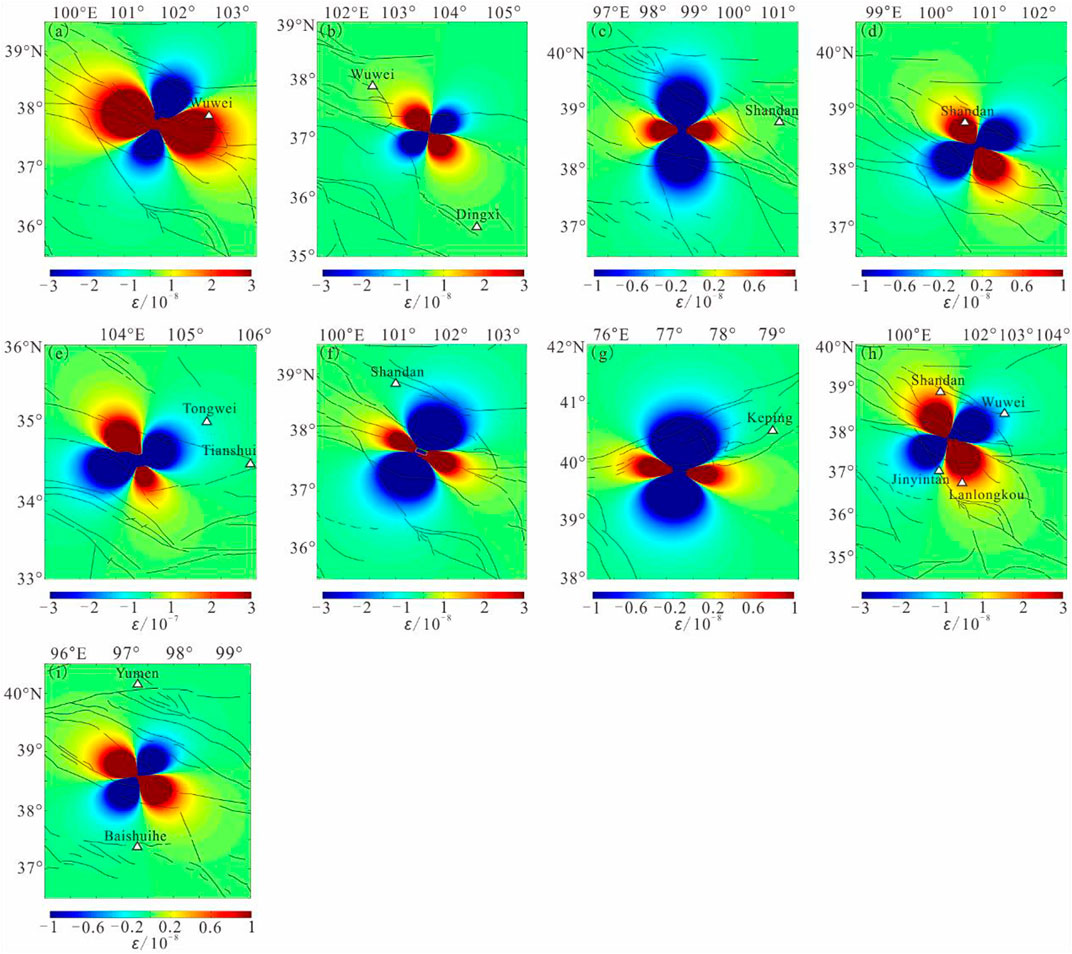
FIGURE 11. Results of the FVD model for the nine earthquakes of MS6.0–6.9 occurring in the northwestern region of China. White triangles, apparent resistivity stations. (A) The 1986 MS6.5 Menyuan earthquake. (B) The 1990 MS6.1 Jingtai earthquake. (C) The 1993 MS6.0 Qilian earthquake. (D) The 2003 MS6.1 Shandan earthquake. (E) The 2013 MS6.6 Minxian earthquake. (F) The 2016 MS6.4 Menyuan earthquake. (G) The 2020 MS6.4 Jiashi earthquake. (H) The 2022 MS6.9 Menyuan earthquake. (I) The 2022 MS6.0 Delingha earthquake.
5 Discussion
The interpretation of these apparent resistivity changes before earthquakes relies on the knowledge of the relationships between medium resistivity change and the factors affected by the seismogenic process. The monitoring arrays and detection volumes are fixed. The constituent geomaterials within the detection volume were unchanged. In general, during a period of several months to approximately 2 years, the temperature of the underground stratum stays relatively constant at a depth range of tens of meters to kilometers in non-geothermal areas. The main detection range of apparent resistivity observation is below the underground water level. The water has enough time to flow into or out of the interconnected cracks. The water saturation is also relatively stable. Therefore, micro-crack activities in the shallow stratum, caused by stress accumulation around the fault zone, are considered the main reason for changes in apparent resistivity in the late seismogenic stage (Scholz et al., 1973; Mjachkin et al., 1975; Du, 2011). The background of strain variations should be taken as a reference if strain changes are the major reason for anomalous changes in apparent resistivity before an earthquake. At least four aspects should be considered, including 1) the mesoscale relationship between resistivity change and deformation in experiments, 2) the theoretic explanation for the experiment results, 3) the background of deformation variations before an earthquake, and 4) the agreement of anomalies with the anomaly mechanism.
Experiments and theoretical studies have revealed the behaviors of micro-cracks under continuous stress loading (Glover et al., 1994; Xue et al., 2014; Liu et al., 2019). For medium containing initial cracks, the total volume behaves with relative dilatancy as the compressive stress exceeds a certain degree, under the condition of low confining pressure. Volume dilatancy means the continuous appearance and growth of new cracks. Whatever the initial crack distribution, the final new crack system will be roughly along the direction of the maximum compressive stress. During this process, the results from experiments showed that the resistivity of the water-bearing medium demonstrated decrease changes (Brace et al., 1965; Yamazaki, 1966; Zhao et al., 1983; Jouniaux et al., 2006). When the applied compressive stress is gradually relieved, the resistivity behavior shows increase changes. New cracks and the relative dilatancy of the shallow stratum with low confining pressure can occur due to the re-movement of the loose material particles under relatively low stress (Ma, 1982). The main detection range of the apparent resistivity observation in China is the shallow stratum, i.e., within approximately 1 km from the ground surface for most stations (Zhao and Qian, 1982; Du et al., 2008).
To explain the resistivity changes observed in the experiments, Xie et al. (2020b) proposed an approximately effective resistivity tensor for a cracked medium, as well as the relationship between resistivity and crack changes. The results from the resistivity model showed increase changes in resistivity and apparent resistivity for dry medium and decrease changes for water-bearing medium, for cracks growing along the minimum electrical axis.
This study identified 39 earthquakes with apparent resistivity anomalies. According to the results from the aforementioned FVD model, the apparent resistivity changes before 29 earthquakes were fully consistent with the anomaly mechanism, while the anomalous changes before five earthquakes were partially consistent with this mechanism. The anomalous changes before the remaining five earthquakes were not. The earthquake consistency rate was approximately 74% (i.e., 29/39). Among the 61 anomalies, 45 were consistent with the anomaly mechanism, while the remaining 16 were not. The anomaly consistency rate was also about 74% (i.e., 45/61). Xie et al. (2022) analyzed the 16 earthquakes of MS≥7.0 occurring within approximately 400 km of the monitoring network. Only three earthquakes had no obvious apparent resistivity changes before them. Among the 38 anomalous changes in apparent resistivity, 36 occurred before 12 earthquakes, consistent with the anomaly mechanism. The earthquake and anomaly consistency rates were approximately 92% (i.e., 12/13) and 95% (i.e., 36/38), respectively.
The build-up of stress on a fault applies extra deformation in its vicinity, which is connected to the apparent resistivity changes far away from the epicenter to the mesoscale mechanism of resistivity changes under stress. Among the 61 anomalies before the 39 MS6.0–6.9 earthquakes, 36 of the 44 with decrease changes were located in areas with relative compression. Nine of the 15 with increase changes were located in areas with relative dilatancy. Compared with the remaining MS≥7.0 earthquakes, the earthquake and anomaly consistency rates of MS6.0–6.9 earthquakes were significantly lowered. One possible reason is that earthquakes of MS≥7.0 have higher stress levels and larger affecting areas. Thus, they have more significant control over the deformation characteristics of the surrounding strata.
However, the reduced earthquake and anomaly consistency rates may imply diverse sources in these anomalies and reveal the complexity of understanding the relationship between apparent resistivity changes and the seismogenic process. An anomalous change may be more likely to be affected by a lower magnitude but closer earthquake, or by regional changes in tectonic stress that are not enough to cause an earthquake. Most of the apparent resistivity changes that were not consistent with the anomaly mechanism occurred in Yunnan Province. Active faults are distributed nearly all over the province, accompanied by many moderate earthquakes of MS5.0–5.9. The apparent resistivity changes before an earthquake of MS6.0–6.9 may also be affected by the seismogenic processes of moderate earthquakes that are closer to the stations. Du (2011) processed the apparent resistivity data from more than 30 years and observed that only approximately 38% of anomalies were followed by earthquakes. The remaining 62% of apparent resistivity anomalies would raise many false alarms, although some of these anomalies might be caused by disturbance factors that occurred too long ago to be verified in detail.
6 Conclusion
Through literature investigation and data analysis, we teased out the apparent resistivity anomalies before 45 earthquakes of MS6.0–6.9 occurring within 250 km from the stations. These anomalies included 44 decrease changes, 15 increase changes, and 2 perturbance variations that appeared before 39 of these earthquakes. Then, the FVD model was used to calculate the relative deformation of the vicinity areas of these earthquakes. In this study, 36 of the 44 decrease changes were in areas with relative compression, while nine of the 15 increase changes were in areas with relative dilatancy. The results from the experiments and theoretical analyses verified the crack activities induced by stress, as well as the accompanying resistivity changes. The mesoscale mechanism of resistivity changes can be connected to the macroscale phenomena of apparent resistivity changes through the deformation characteristics in the vicinity of the earthquake. Therefore, changes in apparent resistivity before an earthquake might be related to a late-stage seismogenic process by a mechanism in which the resistivity change is caused by medium deformation.
However, apparent resistivity changes before some earthquakes did not follow the anomaly mechanism. In addition, some stations did not show short-medium-term anomalous changes before earthquakes, although they were placed in areas with relative compression or relative dilatancy. The reasons for this phenomenon require further in-depth analysis. It should be noted that more apparent resistivity changes are not followed by earthquakes, which will raise false alarms. It is extremely important to carefully eliminate false anomalies caused by environmental factors in the monitoring field and by failures of the measuring system when making predictions based on apparent resistivity changes.
Data and Resources: Some of the apparent resistivity data were obtained from the China Earthquake Networks Center database. The remaining data on apparent resistivity anomalies were obtained from the references cited in Table 1. The focal mechanisms were from the Harvard CMT catalog, the USGS catalog, and the references cited in Table 2.
Data availability statement
The raw data supporting the conclusions of this article will be made available by the authors, without undue reservation.
Author contributions
TX performed the analysis of the FVD model and wrote the manuscript. YH and QY organized the apparent resistivity data. YX organized the focal mechanisms. All authors contributed to the article and approved the submitted version.
Funding
This work is supported by the National Natural Science Foundation of China (Grants Number 42104075) and the Beijing Natural Science Foundation, China (Grants Number 8212045).
Acknowledgments
We thank Professor Haikun Jiang, CENC, China, for the helpful insights on the use of the FVD model. We are also grateful to Professor Xuebin Du, GEA, China, for the helpful discussions on apparent resistivity changes.
Conflict of interest
The authors declare that the research was conducted in the absence of any commercial or financial relationships that could be construed as a potential conflict of interest.
Publisher’s note
All claims expressed in this article are solely those of the authors and do not necessarily represent those of their affiliated organizations, or those of the publisher, the editors, and the reviewers. Any product that may be evaluated in this article, or claim that may be made by its manufacturer, is not guaranteed or endorsed by the publisher.
References
Amann, F., Undul, O., and Kaiser, P. K. (2014). Crack initiation and crack propagation in heterogeneous sulfate-rich clay rocks. Rock Mech. Rock Eng. 47 (5), 1849–1865. doi:10.1007/s00603-013-0495-3
Ashby, M. F., and Hallam, S. D. (1986). The failure of brittle solids containing small cracks under compressive stress states. Acta Metall. 34 (3), 497–510. doi:10.1016/0001-6160(86)90086-6
Bobet, A., and Einstein, H. H. (1998). Fracture coalescence in rock-type materials under uniaxial and biaxial compression. Int. J. Rock Mech.Min. Sci. 35 (7), 863–888. doi:10.1016/S0148-9062(98)00005-9
Brace, W. F., Orange, A. S., and Madden, T. R. (1965). The effect of pressure on the electrical resistivity of water-saturated crystalline rocks. J. Geophys. Res. 70 (22), 5669–5678. doi:10.1029/JZ070i022p05669
Che, S., Jiang, H. K., Fu, H., Yang, M. L., and Ma, H. S. (2014). Earthquake cases in China (2003∼2006). Beijing: Seismological Press. (In Chinese and English Abstract).
Chen, Q. F., Zheng, D. L., and Che, S. (2002a). Earthquake cases in China (1992∼1994). Beijing: Seismological Press. (In Chinese and English Abstract).
Chen, Q. F., Zheng, D. L., Che, S., and Huang, W. B. (2008). Earthquake cases in China (2000∼2002). Beijing: Seismological Press. (In Chinese and English Abstract).
Chen, Q. F., Zheng, D. L., and Gao, R. S. (2002c). Earthquake cases in China (1997∼1999). Beijing: Seismological Press. (In Chinese and English Abstract).
Chen, Q. F., Zheng, D. L., Liu, G. P., and Li, M. (2002b). Earthquake cases in China (1995∼1996). Beijing: Seismological Press. (In Chinese and English Abstract).
Chen, Y. T. (2009). Earthquake prediction: Retrospect and prospect. Sci. China Earth Sci. 39 (12), 1633–1658. (In Chinese and English Abstract).
Chung, W. Y., Wei, B. Z., and Brantley, B. J. (1995). Faulting mechanisms of the Liyang, China, earthquake of 1974 and 1979 from reginal and teleseismic wave froms – evidence of tectonic inversion under a fault-bounded basin. Bull. Seismo. Soc. Amer. 85 (2), 560–670. doi:10.1785/BSSA0850020560
Cicerone, R. D., Ebel, J. E., and Britton, J. (2009). A systematic compilation of earthquake precursors. Tectonophysics 476, 371–396. doi:10.1016/j.tecto.2009.06.008
Du, X. B., Sun, J. S., and Chen, J. Y. (2017). Processing methods for the observation data of georesistivity in earthquake prediction. Acta seismo. Sin. 39 (4), 531–548. (In Chinese and English Abstract). doi:10.11939/jass.2017.04.008
Du, X. B. (2011). Two types of changes in apparent resistivity in earthquake prediction. Sci. China Earth Sci. 54 (1), 145–156. (In Chinese and English Abstract). doi:10.1007/s11430-010-4031-y
Du, X. B., Ye, Q., Ma, Z. H., Li, N., Chen, J. Y., and Tan, D. C. (2008). The detection depth of symmetric four-electrode resistivity observation in/near the epicentral region of strong earthquakes. Chin. J. Geophys. 51 (6), 1220–1228. (In Chinese and English Abstract). doi:10.1002/cjg2.1319
Glover, P. W. J., Meredith, P. G., Sammons, P. R., and Murrel, S. A. F. (1994). Ionic surface electrical conductivity in sandstone. J. Geophys. Res. 99 (B11), 21635–21650. doi:10.1029/94jb01474
Guo, X. Y., Yin, H. Q., Wang, Z. J., and Yang, H. (2021). Earthquake centroid, seismic moment tensor and dynamic environment analysis of the MS6.4 earthquake sequence in Yangbi, Yunnan on May 21, 2021. Seismo. Geol. 43 (4), 806–826. (In Chinese and English Abstract). doi:10.3969/j.issn.0253-4967.2021.04.005
He, S. G., and Shen, Q. X. (2000). Geoelectrical observation technology. Beijing: Seismological Press. (In Chinese).
Huang, Y., Chen, J., Jin, M. P., Li, X. B., Cha, W. J., Wang, J., et al. (2021). Seismic characteristics in the meta-instability stage of the 2021 Yangbi, Yunnan MS6.4 earthquake. Earthq. Res. 44 (3), 357–366. (In Chinese and English Abstract).
Jiang, H. K., Fu, H., and Yang, M. L. (2018). Earthquake cases in China (2007∼2010). Beijing: Seismological Press. (In Chinese and English Abstract).
Jiang, H. K., Fu, H., and Yang, M. L. (2019a). Earthquake cases in China (2013). Beijing: Seismological Press. (In Chinese and English Abstract).
Jiang, H. K., Fu, H., and Yang, M. L. (2019b). Earthquake cases in China (2014∼2015). Beijing: Seismological Press. (In Chinese and English Abstract).
Jouniaux, L., Zamora, M., and Reushle, T. (2006). Electrical conductivity evolution of non-saturated carbonate rocks during deformation up to failure. Geophys. J. Int. 167 (2), 1017–1026. doi:10.1111/j.1365-246X.2006.03136.x
Liang, S. S., Zou, L. Y., Liu, Y. Q., and Zhang, X. M. (2022). Determination of the focal mechanism solutions of the earthquakes with MS≥4.0 occurred in the mainland of China during February to March 2022. Prog. Earthq. Sci. 52 (4), 183–189. (In Chinese and English Abstract). doi:10.19987/j.dzkxjz.2022-056
Lin, J., and Stein, R. S. (2004). Stress triggering in thrust and subduction earthquakes, and stress interaction between the southern San Andreas and nearby thrust and strike-slip faults. J. Geophys. Res. 109 (B2), B02303. doi:10.1029/2003JB002607
Liu, H. D., Li, L. D., Zhao, S. L., and Hu, S. H. (2019). Complete stress-strain constitutive model considering crack model of brittle rock. Environ. Earth Sci. 78 (21), 629. doi:10.1007/s12665-019-8643-z
Ma, J., and Guo, Y. S. (2014). Accelerated synergism prior to fault instability: Evidence from laboratory experiments and an earthquake case. Seismo. Geol. 36 (3), 547–561. (In Chinese and English Abstract). doi:10.3969/j.issn.0253-4967.2014.03.001
Ma, J. L., and Ma, G. F. (1998). Studies of geophysical field features before the Baotou earthquake. North China Earthq. Sci. 16 (1), 61–67. (In Chinese and English Abstract). doi:10.3969/j.issn.1004-1869-B.2009.01.011
Ma, J. (2016). On “whether earthquake precursors help for prediction do exist&rdquo;. Chin. Sci. Bull. 61 (4-5), 409–414. (In Chinese and English Abstract). doi:10.1360/N972015-01239
Ma, J. (1982). Rock mechanics and earthquake prediction. Earthq. Sci. Res. 2 (4), 37–42. (In Chinese and English Abstract).
Ma, J., Sherman, S. I., and Guo, Y. S. (2012). Identification of meta-instable stress state based on experimental study of evolution of the temperature field during stick-slip instability on a 5° bending fault. Sci. China Earth Sci. 42 (5), 633–645. (In Chinese and English Abstract). doi:10.1007/s11430-012-4423-2
Ma, Y. C., Yan, R., Wang, G. C., Yu, H. Z., Li, M. X., Ding, Z. H., et al. (2022). Groundwater level changes before the 1976 Tangshang MS7.8 earthquake and its relation with the earthquake nucleation process. Chin. J. Geophys. 65 (4), 1325–1335. (In Chinese and English Abstract). doi:10.6038/cjg2022P0165
Mjachkin, V. I., Brace, W. F., Sobolev, G. A., and Dieterich, J. H. (1975). Two models for earthquake forerunners. Pure Appl. Geophys. 113, 169–181. doi:10.1007/BF01592908
Monitoring and Forecasting Department of CEA (2010). Theoretical basis and observation technology of seismic electromagnetism. Beijing: Seismological Press. (In Chinese).
Nover, G. (2005). Electrical properties of crustal and mantle rocks - a review of laboratory measurements and their explanation. Surv. Geophys. 26 (5), 593–651. doi:10.1007/s10712-005-1759-6
Qian, F. Y., Lu, Z. Y., and Ding, J. H. (1998). Electromagnetic analysis and prediction methods. Beijing: Seismological Press. (In Chinese).
Qian, F. Y., and Zhao, Y. L. (1980). Ten examples of changes in Earth-resistivity prior to strong earthquakes. Acta seismo. sini. 2 (2), 186–197. (In Chinese and English Abstract).
Reid, H. H. (1911). The elastic-rebound theory of earthquakes. Univ. Calif. Pub. Bull. Dept. Geol. 6, 413–444.
Scholz, C. H., Sykes, L. R., and Aggarwal, Y. P. (1973). Earthquake prediction: A physical basis. Science 181, 803–810. doi:10.1126/science.181.4102.803
Shan, X. J., Li, Y. C., Gao, Z. Y., Hua, J., Huang, X., Gong, W. Y., et al. (2023). Coseismic deformation of the 2022 Luding MS6.8 earthquake and seismic potential along adjacent major faults. Chin. Sci. Bull. 68 (8), 944–953. (In Chinese and English Abstract). doi:10.1360/TB-2022-0954
Shen, Z. K., Sun, J. B., Zhang, P. Z., Wan, Y. G., Wang, M., Bürgmann, R., et al. (2009). Slip maxima at fault junctions and rupturing of barriers during the 2008 Wenchuan earthquake. Nat. Geosci. 2 (10), 718–724. doi:10.1038/ngeo636
Toda, S., Stein, R. S., Richards-Dinger, K., and Bozkurt, S. B. (2005). Forecasting the evolution of seismicity in southern California: Animations built on earthquake stress transfer. J. Geophys. Res. 110 (B5), B05S16. doi:10.1029/2004jb003415
Wang, J., Qin, B. Y., and Dong, Q. Z. (1992). A study on the fracture process of the Menyuan M6.4 earthquake occurred on August 26, 1986. North China Earthq. Sci. 10 (2), 25–33. (In Chinese and English Abstract).
Wang, K. Y., Guo, Y. S., and Feng, X. D. (2018). Sub-instability stress state prior to the 2008 Wenchuan earthquake from temporal and spatial stress evolution. Chin. J. Geophys. 61 (5), 1883–1890. (In Chinese and English Abstract). doi:10.6038/cjg2018M0225
Wang, K. Y., Jin, M. P., Huang, Y., Dang, W. J., Li, W. T., Zhuo, Y. Q., et al. (2021). Temporal and spatial evolution of the 2021 Yangbi (Yunnan China) MS6.4 earthquake sequence. Seismo. Geol. 43 (4), 1030–1039. (In Chinese and English Abstract). doi:10.3969/j.issn.0253-4967.2021.04.019
Wang, M., and Shen, Z. K. (2020). Present-day crustal deformation of continental China derived from GPS and its tectonic implications. J. Geophys. Res. Solid Earth 125, e2019JB018774. doi:10.1029/2019JB018774
Wang, Z. L., Zheng, D. L., and Yu, S. R. (2002). Geoelectric resistivity precursor anomalies of earthquake. Beijing: Seismological Press. (In Chinese).
Wang, Z. X., Bai, Y. G., Li, Y. Q., and Guo, X. Z. (1999). Research on geoelectric precursor prior to the Datong-Yanggao earthquake. Earthq. Res. Shanxi 27 (3-4), 21–24. (In Chinese and English Abstract).
Wells, D. L., and Coppersmith, K. J. (1994). New empirical relationships among magnitude, rupture length, rupture width, rupture area, and surface displacement. Bull. Seismo. Soc. Amer. 84 (4), 974–1002. doi:10.1007/BF00808290
Wu, Z. L., Jiang, C. S., Peng, H. S., and Zhu, C. Z. (2009). The physics of earthquake prediction. Physics 38 (4), 233–237. (In Chinese and English Abstract).
Wyss, M., and Booth, D. C. (1997). The IASPEI procedure for the evaluation of earthquake precursors. Geophys. J. Int. 131, 423–424. doi:10.1111/j.1365-246X.1997.tb06587.x
Wyss, M. (1991). Evaluation of proposed earthquake precursors. Washington DC: AGU, 94. doi:10.1029/90eo10300
Wyss, M. (1997). Second round of evaluations of proposed earthquake precursors. Pure Appl. Geophys. 149, 3–16. doi:10.1007/BF00945158
Xie, T., Xue, Y., and Lu, J. (2022). Changes in apparent resistivity and its possible reasons before earthquakes of MS≥7.0 in China. Chin. J. Geophys. 65 (8), 3064–3077. (In Chinese and English Abstract). doi:10.6038/cjg2022P0345
Xie, T., Ye, Q., and Lu, J. (2020b). Electrical resistivity of three phase cracked rock soil medium and its anisotropic changes caused by crack changes. Geomat. Nat. Haz. Risk 11 (1), 1599–1618. doi:10.1080/19475705.2020.1801527
Xie, T., Yu, C., Wang, Y. L., Li, M., and Lu, J. (2020a). Apparent resistivity variations before 2008 Wenchuan MS8.0 earthquake based on fault virtual dislocation model. Earthq. Res. China. 36 (3), 492–501. (In Chinese and English Abstract). doi:10.3969/j.issn.1001-4683.2020.03.012
Xu, Y. C., Guo, X. Y., and Feng, L. L. (2022). Relocation and focal mechanism solutions of the MS6.9 Menyuan earthquake sequence on January 8, 2022, in Qinghai province. Acta seismo. sini. 44 (2), 195–210. (In Chinese and English Abstract). doi:10.11939/jass.20220008
Xue, L., Qin, S. Q., Sun, Q., Wang, Y., Lee, L. M., and Li, W. (2014). A study on crack damage stress thresholds of different rock types based on uniaxial compression tests. Rock Mech. Rock Eng. 47 (4), 1183–1195. doi:10.1007/s00603-013-0479-3
Yamazaki, Y. (1966). Electrical conductivity of strained rocks. The second paper. Further experiments on sedimentary rocks. Bull. Earthq. Res. Inst. 44 (4), 1553–1570.
Yi, G. X., Zhao, M., Long, F., Liang, M. J., Wang, M. M., Zhou, R. J., et al. (2021). Characteristics of the seismic sequence and seismogenic environment of the MS6.0 Sichuan Luxian earthquake on September 16, 2021. Chin. J. Geophys. 64 (12), 4449–4461. (In Chinese and English Abstract). doi:10.6038/cjg2021O0533
Zhang, W. T., Ji, L. Y., Zhu, L. Y., Jiang, F. Y., and Xu, X. X. (2021). A typical thrust rupture event occurring in the foreland basin of the southern Tianshan: The 2020 Xinjiang Jiashi MS6.4 earthquake. Seismo. Geol. 43 (2), 394–409. (In Chinese and English Abstract). doi:10.3969/j.issn.0253-4967.2021.02.009
Zhang, X., Jia, P., Liu, X., Xu, J., Wan, Y. K., Wang, L., et al. (2020). Cross-fault short-term and impending anomalies before the Minxian-Zhangxian strong earthquake and the characteristics of meta-instable state. Seismo. Geol. 42 (5), 1206–1210. (In Chinese and English Abstract). doi:10.3760/cma.j.cn.441530-20191119-00486
Zhang, Z. C., Luo, L. G., Li, H. H., Chen, L. D., and Li, X. H. (1988). Earthquake cases in China (1966∼1975). Beijing: Seismological Press. (In Chinese and English Abstract).
Zhang, Z. C., Luo, L. G., Li, H. H., Chen, L. D., and Li, X. H. (1990a). Earthquake cases in China (1976∼1980). Beijing: Seismological Press. (In Chinese and English Abstract).
Zhang, Z. C., Luo, L. G., Li, H. H., Chen, L. D., and Li, X. H. (1990b). Earthquake cases in China (1981∼1985). Beijing: Seismological Press. (In Chinese and English Abstract).
Zhang, Z. C., Zheng, D. L., and Xu, J. H. (1999). Earthquake cases in China (1986∼1988). Beijing: Seismological Press. (In Chinese and English Abstract).
Zhang, Z. C., Zheng, D. L., and Xu, J. H. (2000). Earthquake cases in China (1989∼1991). Beijing: Seismological Press. (In Chinese and English Abstract).
Zhao, H. Y., and Qian, J. D. (1982). Theoretical discussion and calculation about detective depth and detective range in Earth resistivity method. Northwest. Seismo. J. 4 (1), 40–56. (In Chinese and English Abstract).
Zhao, Y. L., Lu, J., Li, Z. N., Qian, F. Y., and Zhang, H. K. (1996). The strain-apparent resistivity anomalies of Tangshan earthquake based on virtual dislocation model. Acta seismo. sini. 18 (1), 78–82. (In Chinese and English Abstract).
Zhao, Y. L., Qian, F. Y., Yang, T. C., and Liu, J. Y. (1983). Experimental in situ of electrical resistivity changes. Acta seismo. sini. 5 (2), 217–225. (In Chinese and English Abstract).
Keywords: apparent resistivity, China mainland, earthquakes of Ms6.0–6.9, anomalies, fault virtual dislocation model
Citation: Xie T, Han Y, Ye Q and Xue Y (2023) Changes and mechanisms of apparent resistivity before earthquakes of MS6.0–6.9 on the Chinese mainland. Front. Earth Sci. 11:1187660. doi: 10.3389/feart.2023.1187660
Received: 16 March 2023; Accepted: 06 June 2023;
Published: 20 June 2023.
Edited by:
Chen Chieh-Hung, China University of Geosciences Wuhan, ChinaReviewed by:
Peng Han, Southern University of Science and Technology, ChinaZhanghui An, China Earthquake Administration, China
Majid Khan, University of Science and Technology Beijing, China
Copyright © 2023 Xie, Han, Ye and Xue. This is an open-access article distributed under the terms of the Creative Commons Attribution License (CC BY). The use, distribution or reproduction in other forums is permitted, provided the original author(s) and the copyright owner(s) are credited and that the original publication in this journal is cited, in accordance with accepted academic practice. No use, distribution or reproduction is permitted which does not comply with these terms.
*Correspondence: Tao Xie, eHRhb2xha2VAMTYzLmNvbQ==