 Dingyong Liang1,2,3
 Guoqiang Xu1,4*Fanglei Gao3Ling Wen1,2*Liyun Jia5Li Liu6Dongfeng Jiao1Chaoyun Yang1Shuzhuang Wu7*
- 1Hainan Key Laboratory of Marine Geological Resources and Environment, Haikou, China
- 2Comprehensive Institute of Geological Investigation of Hainan Province, Haikou, China
- 3Hainan Geological Survey, Haikou, China
- 4Sanya Exploration Institute of Hydrogeology and Engineering Geology, Sanya, China
- 5Institute of Geomechanics, Chinese Academy of Geological Sciences, Beijing, China
- 6Hainan Geology Detection and Research Centre, Haikou, China
- 7Institute of Earth Sciences, University of Lausanne, Lausanne, Switzerland
Identifying the sources of sediments is of great significance in reconstructing Holocene paleoclimate evolution in the Beibu Gulf and in understanding the characteristics of regional responses to changes in global climate. The Holocene paleoclimatic evolutionary history of the Beibu Gulf was investigated by chronological, geochemical, and mineralogical means using the sediments of Core KZK01 from the eastern part of the Beibu Gulf. The rare earth element (REE) distribution curves, (Gd/Yb)N and (La/Yb)N discriminant diagram, and (Gd/Lu)N and ∑LREE/∑HREE discriminant diagram indicated that the detrital materials in the eastern part of the Beibu Gulf primarily originated from Hainan Island and its proximal sources, with considerable contributions from Taiwan and Pearl River materials. Source analysis of clay minerals showed that Luzon Island was the main source of smectite, followed by Hainan Island. Rivers in Taiwan were the main sources of illite in the study area, followed by the Red River. The Red River was the main contributor of chlorite, followed by the Pearl River. Kaolinite mainly originated from Hainan Island and Guangxi. Coastal currents, surface currents, and warm currents were the main drivers of material transport. Paleoclimatic variations since the Holocene in the Beibu Gulf were divided into three stages: 12–9 cal kyr BP, 9–1.3 cal kyr BP, and 1.3 cal kyr BP to the present. During different stages of climatic evolution, drought was often accompanied by cold and humidity coexisted with warmth, and cold-dry-warm-humid alternation is characterized by significant phases. The illite crystallinity clearly recorded the extreme cold events, such as Bond Events (except Bond6) and the Younger Dryas, and the change trend was essentially consistent with the regional climate record, reflecting the control of global climate change on the process of land–sea interaction in the tropical region. Furthermore, it highlights the great potential of illite crystallinity as a proxy indicator for reconstructing the surface chemical weathering processes of the region.
Introduction
The coastal-shelf zone, with its high sedimentation rate and rich material sources, provides an important record of paleoenvironmental changes, and is an extremely important environmental unit in the “source to sink” system of continental margins (Chen et al., 2017a; Tian et al., 2021). The Beibu Gulf is a large semi-enclosed bay on a shelf that is bounded by land on three sides and that opens southward to the South China Sea (Huang et al., 2022; Figure 1). It receives sediments from Hainan, Guangxi, the Pearl River, Taiwan, Vietnam, and the Red River and other source areas, and the combined influence of the multi-level current system, the East Asian monsoon, and hydrodynamic conditions make the sediment transportation and deposition process in the bay very complex (Zhou et al., 2014; Zhang et al., 2015; Liu et al., 2016). Identifying the sources of sediments is of great significance in reconstructing the evolution of sedimentary environments and paleoclimate reconstruction (Thilakanayaka et al., 2019; Liu et al., 2021). However, geochemical information can be lost during weathering and denudation as well as during the deposition of sediments from different source areas, and multiple methods should be adopted for comprehensive source analysis (Cao et al., 2018; Xu and Jiang, 2019). Clay minerals, rare earth elements (REEs), and trace elements are chemically stable and are less prone to elemental fractionation during surface weathering, denudation, and transport, and these can serve as good indicators of the characteristics of the sediment source areas as well as the climate and environment in the source areas (Wei et al., 2004). To date, analyses of clay minerals and elemental geochemistry have been successfully used to trace the origins of sediments derived from terrestrial sources (Wan et al., 2007; Jiang et al., 2016; Liu et al., 2016). Although sedimentological studies have been carried out in the Beibu Gulf in recent years (Jin et al., 2019; Tian et al., 2023), most of these studies have focused on the surface sediment sources (Dou et al., 2012; Cui et al., 2015; Jin et al., 2019), sediment transport and depositional patterns (Chen and Shi, 2019), and effects of human activities on the depositional environment (Chen et al., 2021). The impacts on the material source variability since the Holocene have not been sufficiently investigated.
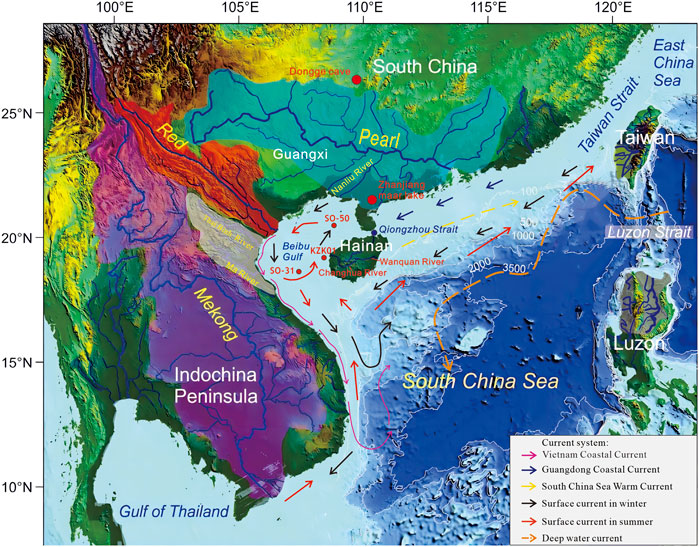
FIGURE 1. Location and surroundings of the study area. The topography around western Hainan Island, catchment systems on the surrounding continent, and oceanic current systems are redrawn from Liu et al. (2016). Winter and summer currents in the Beibu Gulf are drawn from Wu et al. (2008) and Chen et al. (2009). The Vietnam Coastal Current is drawn from Chen et al. (2012). The Guangdong Coastal Current is drawn from Yang et al. (2003). The South China Sea Warm Current is drawn from Liu et al. (2010), Liu et al. (2016). The catchment of the Red River is shaded red. The Pearl River catchment is shaded blue. The Mekong River catchment is shaded purple. The catchment of the Vietnam rivers is shaded white. The catchment of the southwest Taiwan rivers is shaded yellow. The catchment of the Luzon rivers is shaded grey.
Previous studies on paleoclimate change have used sporulation records to reveal that the strength of the Asian monsoon and the inner circulation of the Beibu Gulf underwent several changes during the Middle to Late Holocene (Li et al., 2010). Furthermore, these studies have revealed an enhancement in the modification effect of human activities on natural vegetation during the Late Holocene (Li et al., 2006). Yang et al. (2019) inverted sea surface temperature (SST) changes in the Beibu Gulf region over 10,000 years based on the SO-31 pore organic temperature scale U37K and recorded eight temperature change events of regional significance. In general, there is still a lack of research on the sedimentary environment and climate records in the Beibu Gulf, and few studies have attempted to reconstruct the paleoclimate evolution history since the Holocene using sedimentological, mineralogical, and geochemical indexes. Moreover, comparisons between different climate records are not satisfactory, so additional regional evidence is needed to improve the theoretical research system. The considerable carbon reservoir effect of the ocean results in the radiocarbon ages of marine samples usually being hundreds of years older than those of terrestrial samples, and ΔR correction is required to compare marine and terrestrial samples (Southon et al., 2002; Yu et al., 2010; Bolton et al., 2016). Many previous climate comparison studies have not performed ΔR correction (Li et al., 2010; Chen et al., 2015; Du et al., 2020; Wang et al., 2020; Cao et al., 2021; Kaboth-Bahr et al., 2021), which may have led to biases when comparing marine and terrestrial samples. Therefore, in this work, we used the Core KZK01 from the eastern part of the Beibu Gulf and performed systematic chronological, geochemical, and mineralogical studies to qualitatively identify the characteristics of changes in sediment sources since the beginning of the Holocene, and on this basis, we reconstructed the Holocene paleoclimate evolution in the Beibu Gulf. The results of this work are expected to provide theoretical support to improve our understanding of the characteristics of regional responses to changes in global climate instability since the beginning of the Holocene.
Study area
The study area is located in the northwestern part of the South China Sea. The eastern part of the target area is adjacent to Hainan, the northern part is connected to Guangxi, the western part is close to Vietnam, the southern part is directly within the hinterland of the South China Sea, and the northeastern part of the target area is connected to the northeastern part of the South China Sea through the Qiongzhou Strait. The seafloor topography gradually decreases from north to south, and the isobaths are roughly parallel to the coastline. The water depth in the western part of the target area ranges from 20 to 60 m, with an average depth of 40 m (Huang et al., 2022; Figure 1). Numerous rivers empty into the northern part of the South China Sea, among which the Red River delivers approximately 130 × 106 t of terrestrial particulate matter to the Beibu Gulf annually (Milliman and Farnsworth, 2011), making it the most important contributor of sedimentary material. In addition, this part of the sea receives sediments from the Vietnamese coast and rivers in Hainan and Guangxi. The Pearl River also delivers a certain amount of terrestrial material to the northeastern part of the Beibu Gulf through the Qiongzhou Strait (Tang et al., 2003; Dou et al., 2012). The main rock types in the upper reaches of the Changhua River and Hainan Island are granites, shallow metamorphic rocks, basalts and terrestrial clastic rocks (Li et al., 2017). Around the Beibu Gulf are carbonate rocks, quartzite, metamorphosed sandstone, slate, terrestrial clastic rocks, granite, granitic porphyry, basalt, and loose sediments (Huang et al., 2022).
The study area has a tropical and subtropical maritime monsoon climate, which is mainly controlled by the East Asian low-latitude monsoon, with the southwest monsoon prevailing in summer and the northeast monsoon prevailing in winter. Owing to the influence of the East Asian monsoon, ocean currents, seawater temperature differences, and topography and geomorphology, the circulation in the study area is perennially anticlockwise (Wu et al., 2008; Chen et al., 2009). The water desalination of the Red River has caused the Vietnamese coastal stream to maintain an overall north to south flow throughout the year (Chen et al., 2012). River sediments along South China follow the littoral flow from northeast to southwest across the Qiongzhou Strait to integrate into the counterclockwise circulation (Yang et al., 2003). In addition, the South China Sea Warm Current is found to the northeast of Hainan Island and it flows along the 100 m isobath into the northeastern part of the South China Sea throughout the year (Liu et al., 2016; Figure 1).
Materials and methods
Core KZK01 (19°12′58.08″N, 108°33′05.78″E, Figure 1) was obtained in April 2020 from the waters to the west of Hainan Island using the drill core method. The water depth is 12.6 m, the length of the core is 20 m, and the coring rate is 95%. The sediments mainly consist of interbedded sand and mud. Forty-six samples were obtained from the entire core at 30–40 cm intervals, and these samples were analyzed for age, grain size, major elements, REEs, and clay minerals.
Particle size was analyzed according to the GB/T 12763.8.6.3–200+7 standard. Hydrogen peroxide (10 ml) was added to 10–20 g of the samples to remove organic matter. Then, 15 ml of 15% acetic acid was added to remove carbonates from the samples. The samples were boiled with 300 ml of (NaPO3)6, cooled, and placed on a shaking table for 24 h. The samples were tested using a laser particle size analyzer (UltimaⅣ-185). The grain resolution was 0.01Φ, the measurement range was 0.02–2 000 μm, and the relative error of repeated measurement was less than 1%.
Analyses of major and trace rare earth elements were conducted in accordance with the GB/T20260.8-2006 standard. Major element analysis was conducted using X-ray fluorescence spectrometry (XRF; ZSX-Primus II), and the mass loss during combustion was determined using gravimetry. Rare earth and trace element analysis was performed using inductively coupled plasma mass spectrometry (ICP-MS; Thermo Field iCAP Qc).
A Rigaku Ultima IV-185 diffraction analyzer was used for X-ray diffraction (XRD) analysis of clay minerals, and the K-value method was used as the quantitative analysis method. Clay minerals were identified and interpreted using XRD patterns obtained from the three main directional slices. Semi-quantitative calculation of the crest parameters was performed using Jade 6 software. The relative content of the clay minerals was mainly determined based on the ratio of the diffraction peak area of the crystal plane. Smectite was determined based on the 1.7 nm (001) crystal plane and illite was determined based on the 1 nm (001) crystal plane. Kaolinite (001) and chlorite (002) were determined based on the 0.7 nm superimposed peak. The contents of clay minerals, smectite, and illite were calculated by multiplying by the weight coefficients of 1, 4, and 2, respectively. The content of kaolinite and chlorite was determined by fitting the ratio of the peak area between 0.357 nm and 0.354 nm. The crystallinity index of illite was expressed using the full-width at half-maximum (FWHM) of the diffraction peak at 10 Å on the curve. The crystallinity index was negatively correlated with the crystallinity. The aforementioned tests were conducted at the Key Laboratory of Marine Geological Resources and Environment of Hainan Province.
Six samples were collected for 14C dating from Core KZK01. The samples include relatively intact shells, foraminifera, and organic matter. 14C measurements were carried out using accelerator mass spectrometry (AMS) in Beta Laboratory, United States. The OSL dating sample was obtained from the fine sand layers, and the experiment was carried out using a Riso TL/OSL-DA-20 thermoluminescent/optometric instrument at the Laboratory of the Three Gorges Research Center for Geological Hazards of the Yangtze River, Ministry of Education, China University of Geosciences (Wuhan).
Results
Age framework
The results of the dating of the six samples are shown in Table 1. The AMS 14C ages were calibrated to calendar ages using the MARINE 20 calibration curve (Heaton et al., 2020). We adopted the average reservoir age (−15 ± 38 years) around the South China Sea for the last thousand years (Southon et al., 2002; Dang et al., 2004; Fallon and Guilerson, 2008; Bolton et al., 2016). Yu et al. (2010) revealed that significant fluctuations in radiocarbon marine reservoir ages and regional marine reservoir corrections occurred in the South China Sea during the Holocene. Therefore, reservoir age corrections of 89 ± 59 years and 151 ± 85 years were applied for the periods between 2–3.5 kyr and 3.5–13 kyr BP, respectively (Table 2). The Bayesian age-depth model of core KZK01 was calculated using the R program BACON (Blaauw and Christen, 2011; Figure 2).
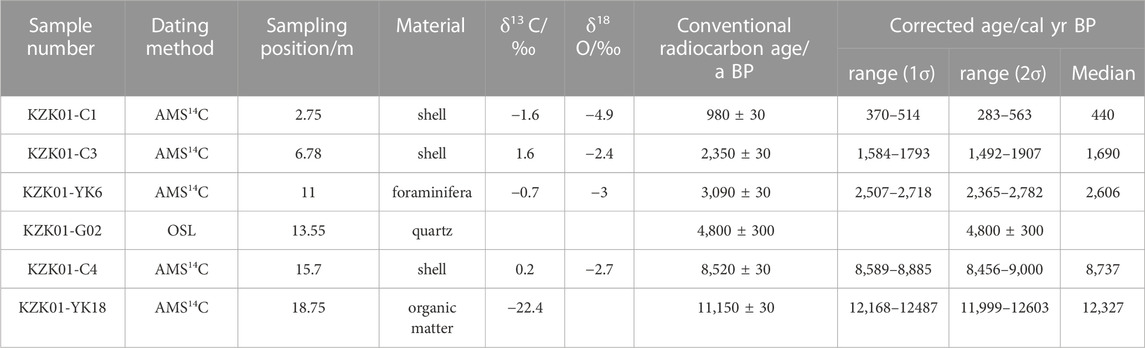
TABLE 1. AMS14C and OSL dating results for Core KZK01.
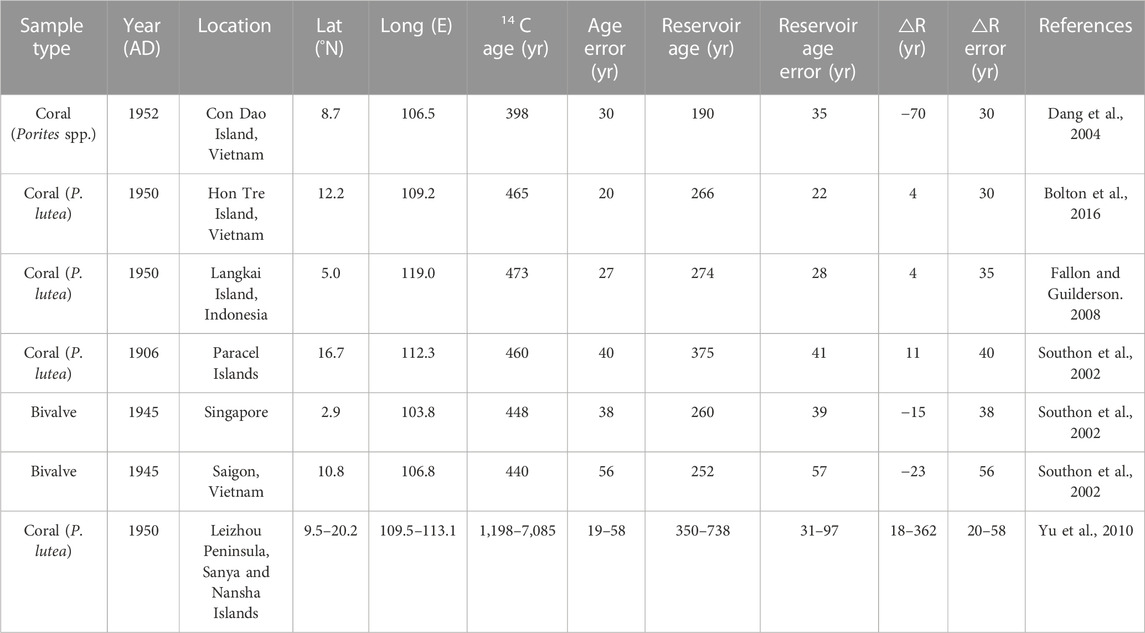
TABLE 2. Reservoir ages around the South China Sea.
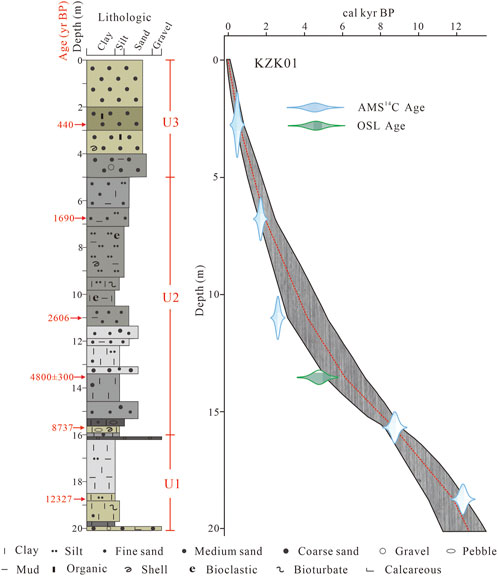
FIGURE 2. Age-depth model of Core KZK01 (Liang et al., 2023). The upper panels depict the MCMC iterations (left), the prior (green curves) and posterior (grey histograms) distributions for the accumulation rate (middle panel), and the memory (right panel). The bottom panel shows the calibrated 14C and OSL dates (transparent blue) and the age-depth model (darker greys indicate more likely calendar ages; grey stippled lines show 95% confidence intervals; the red curve shows the single ‘best’ model based on the mean age for each depth).
Characteristics of grain size and major elements
The grain size of KZK01 sediments is heterogeneous, with the mean grain size (Mz) ranging from 1.93 to 7.23 Φ (mean value: 4.89 Φ). the mean sorting coefficient (δi) is 1.74 φ, and the mean skewness (Ski) is 0.17. The major geochemical element composition of the sediments was dominated by SiO2 and Al2O3, with the sum of the two accounting for more than 70% of the total chemical composition (Table 3) (see Supplemental Text for detail). The grain size and major composition varied significantly from bottom to top, and three sedimentary stages (U1, U2, and U3) could be distinguished from bottom to top (Figure 3). The three stages are described briefly below:
• U1 (12–9 cal kyr BP): the overall grain size in this stage was fine, with the average Mz value being 7 and δi value reaching 1.67. The grain size did not vary much. The contents of SiO2, K2O, Na2O, and CaO tended to increase upward, whereas the contents of the other major elements tended to decrease upward.
• U2 (9–1.3 cal kyr BP): the grain size in this stage was coarser than that in the previous stage, with the average Mz value being 5.43 and Ski value being 0.18. The contents of major elements fluctuated greatly, reflecting a relatively turbulent depositional environment.
• U3 (1.3–0 cal kyr BP): the grain size in this stage was the coarsest, with the average Mz value reaching 2.11 and δi value being 1.33. The higher contents of SiO2 and K2O and the significantly lower contents of the rest of the major elements indicated the presence of a clear fault (Figure 3).
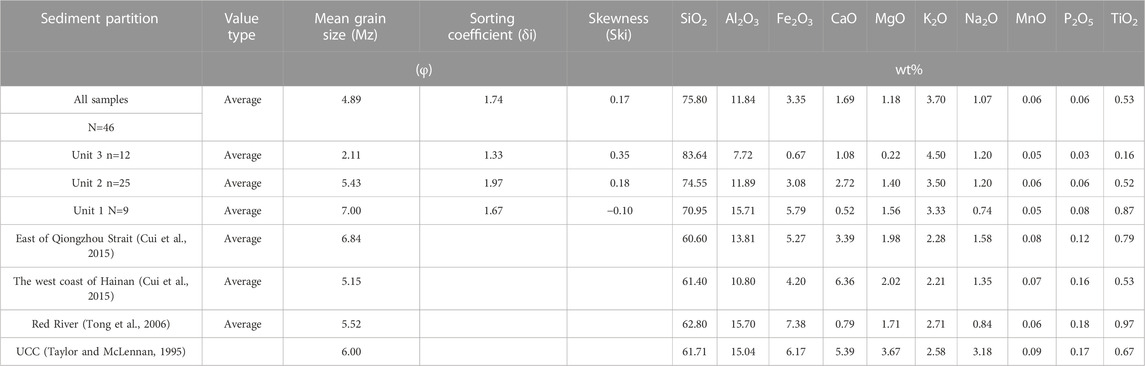
TABLE 3. Granularity and macroelement concentrations in Core KZK01 sediments.
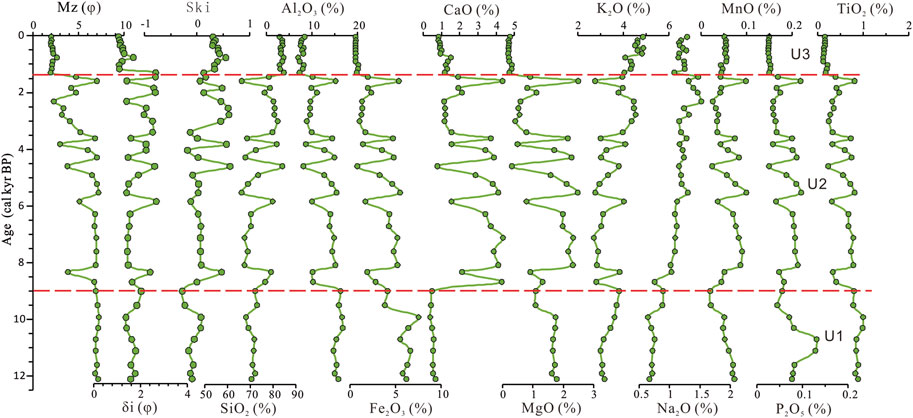
FIGURE 3. Grain size parameters and variations of major elements in Core KZK01.
Characteristics of REE
The REE contents and major rare earth indicators of KZK01 sediments are shown in Figure 4 and the same three sedimentary stages (i.e., U1, U2, and U3) can be distinguished based on the vertical distribution of REEs. In U1, the average ∑REE value is high, reaching 233.15 (Table 4). ∑LREE/∑HREE (La/Yb)N, and (La/Sm)N exhibit an obvious increasing trend. In U2, the ∑REE value is lower than that in the previous stage. The major rare earth indicators, such as ∑LREE/∑HREE (La/Yb)N, (La/Sm)N, (Gd/Lu)N, Ce/Ce*, and Eu/Eu*, are higher than those in the previous stage, and the values exhibit a tendency to increase. In U3, clear faults are seen separating this stage from the previous stage, indicating substantial changes in the sedimentary environment.
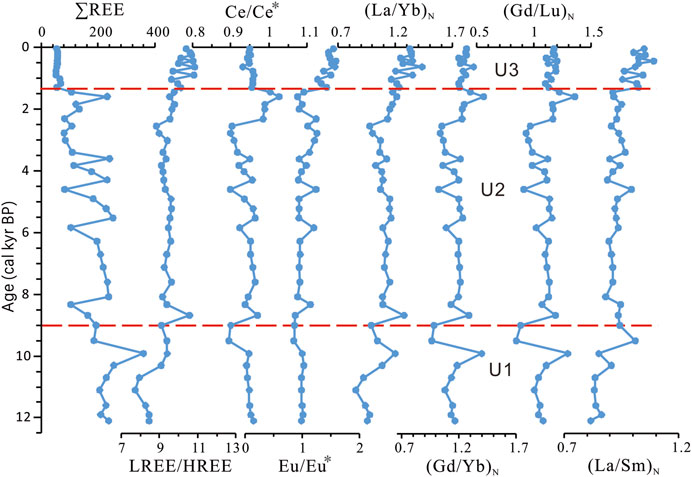
FIGURE 4. Vertical variations in rare earth elements in Core KZK01 sediments.
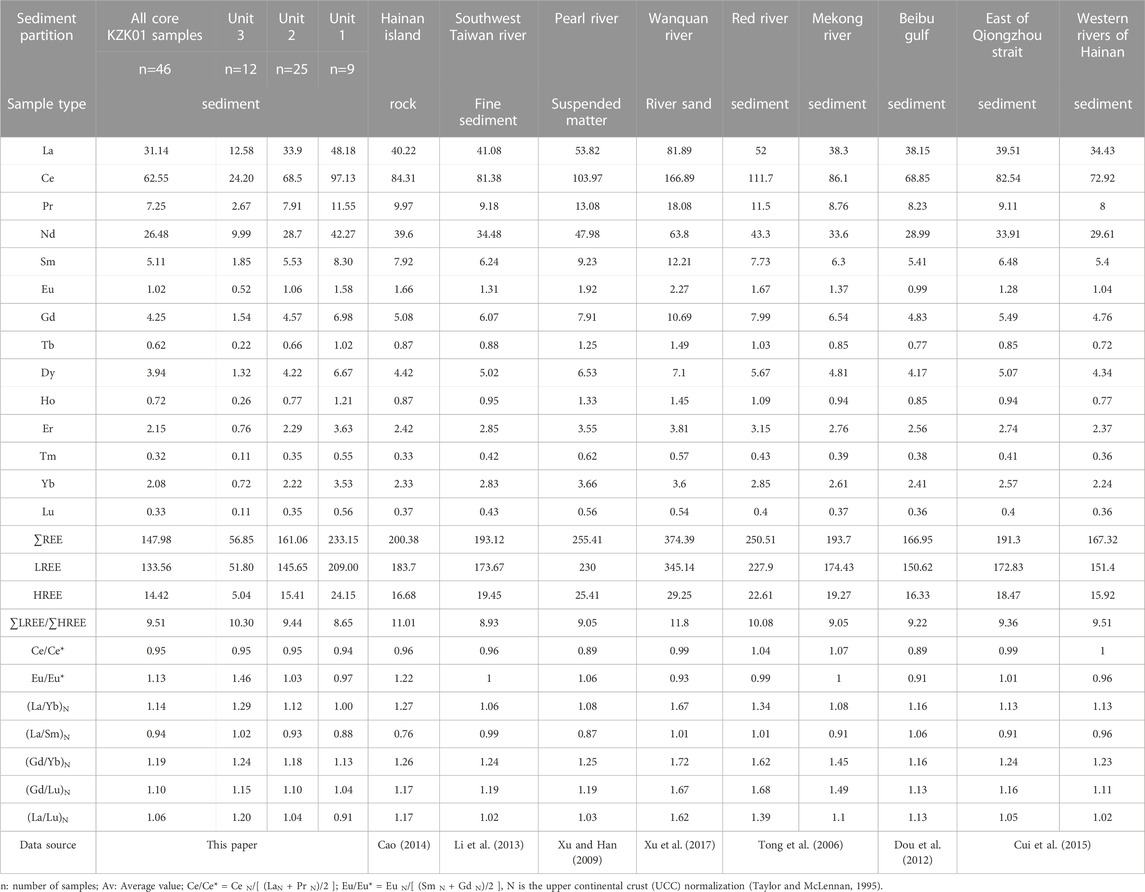
TABLE 4. Comparison of the average REE contents in Core KZK01 with the values from the surrounding areas and river sediments.
The composition of the Upper Continental Crust (UCC) was used to normalize the REEs in the KZK01 sediments. The distribution curves of U1 (Figure 5A) and U2 (Figure 5B) were relatively smooth and similar, with ∑LREE/∑HREE ratios of 8.65 and 9.44, respectively, which were similar to that of the UCC (9.45). The distribution curve of U3 (Figure 5C) showed a right-dipping negative slope pattern with a high left and a low right, and Eu exhibited a clear negative anomaly.
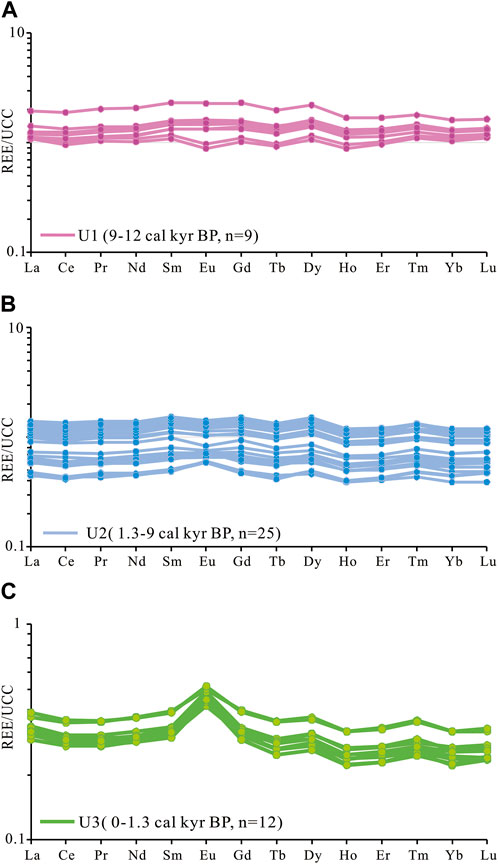
FIGURE 5. UCC-normalized distribution patterns of REE for different stages in Core KZK01. (A) Plot of REE for U1 stage. (B) Plot of REE for U2 stage. (C) Plot of REE for U3 stage.
Characteristics of clay minerals
The clay minerals in Core KZK01 consisted mainly of illite, with moderate amounts of smectite, kaolinite, and chlorite. The average contents of illite, smectite, kaolinite, and chlorite were 60%, 21.15%, 10.48%, and 8.37%. The chemical index of illite varied from 0.03 to 0.89, with an average value of 0.26. The crystallinity of illite ranged from 0.16° to 0.27°Δ2θ, with an average value of 0.2°Δ2θ (Table 5). The vertical variation of the clay minerals was consistent with the variation observed in grain size, constants, and REEs, with significant variations at 9 cal kyr BP and 1.3 cal kyr BP. The same three sedimentary stages (i.e., U1, U2, and U3) could be distinguished. In U1, the smectite content, illite content, and illite crystallinity values tended to increase upward, whereas the kaolinite and chlorite contents decreased (Figure 6). In U2, the illite content, smectite content, illite chemical index, and smectite/(illite + chlorite) ratio decreased steadily, whereas the kaolinite and chlorite contents slowly increased. In U3, the lithology was coarse-medium sand with very low clay mineral content, which differed significantly from that of U2.
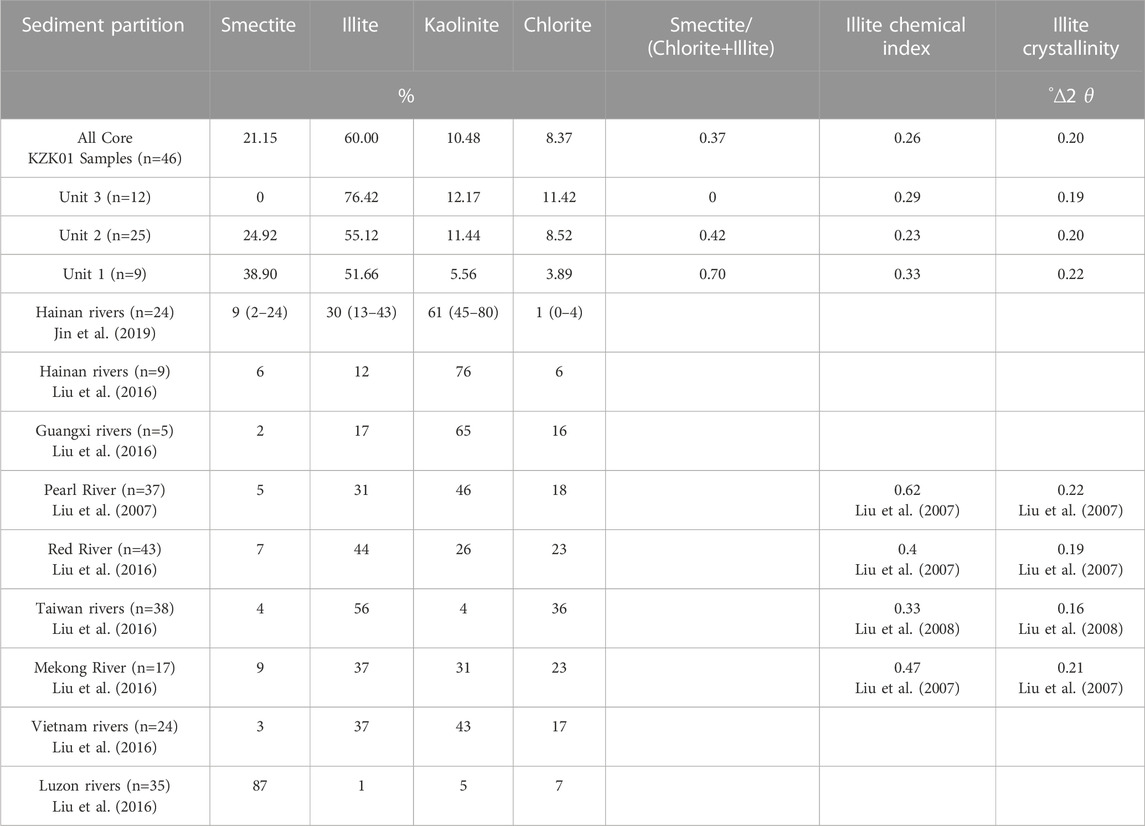
TABLE 5. Clay mineral assemblages and their average amounts (with ranges) in the study area and the surrounding potential source rivers.
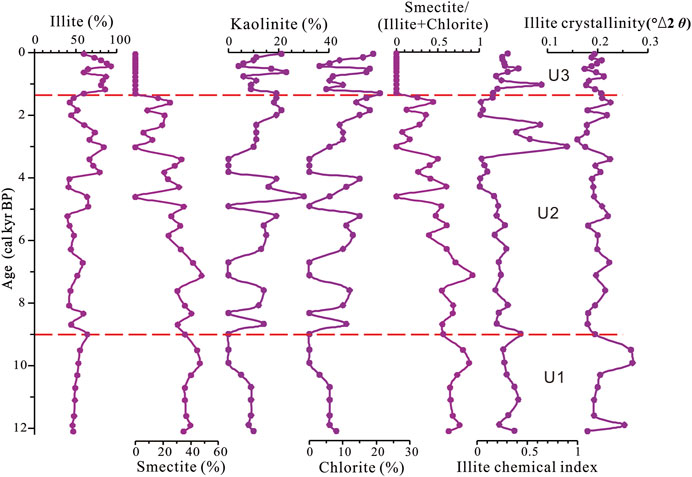
FIGURE 6. Variations in clay mineral assemblages, illite crystallinity, and illite chemical index in Core KZK01.
Discussion
Sediment provenance in the eastern part of the Beibu Gulf
REEs have similar chemical properties and low solubilities, and fractionation rarely occurs during the weathering of rocks and migration of terrigenous sediments. Weathered material typically inherits the REE characteristics of the parent rock. Therefore, the REE parameters of sediments are widely used to identify provenance (Mi et al., 2017; Su et al., 2017). ∑LREE/∑HREE and (La/Yb)N values are indicators of REE fractionation. The correlation coefficients between the mean grain size and ∑LREE/∑HREE (r = 0.35, Figure 7A) and SiO2 and (La/Yb)N (r = 0.20, Figure 7B) in the study area are low, indicating that (La/Yb)N and ∑LREE/∑HREE can eliminate the effects of sediment grain size and better preserve the chemical composition characteristics of the source rocks. Therefore, (La/Yb)N and ∑LREE/∑HREE ratios are effective indicators for provenance tracing.

FIGURE 7. (A) Plot of grain sizes vs. ΣLREE/ΣHREE ratios of the analyzed samples from Core KZK01. (B) Plot of SiO2 vs. (La/Yb)N ratios of the analyzed samples from Core KZK01.
The REE distribution patterns in the sediments of Core KZK01 were compared with those in the sediments from the Mekong River, Red River, Pearl River, Changhua River, rivers in southwest Taiwan, eastern part of the Qiongzhou Strait and western part of Hainan Island, in addition to the surface sediments of the Beibu Gulf, as these are potential source areas for the Core KZK01 sediments. This comparison yielded valuable insights into the sedimentary processes and sedimentary provenance of the study region. We found that the REE patterns of U1 (mean) and U2 (mean) were closer to those of the nearshore sediments from the western part of Hainan Island, sediments from the eastern mouth of the Qiongzhou Strait, surface sediments from the Beibu Gulf, and river sediments from the southwestern part of Taiwan (Figure 8A); they exhibited a difference from those of other source areas (Figure 8B). Moreover, the partition curves of the sediments from the eastern mouth of the Qiongzhou Strait had the highest degree of similarity to those of U1 and U2. This indicated that during the period from 1.3 to 12 cal kyr BP, sediments from nearshore rivers and nearshore erosion on Hainan Island, sand transport from the Qiongzhou Strait, and sediments from rivers in Taiwan that were transported by ocean currents were the main sources of detrital material in Beibu Bay and that east-to-west sand transport in the Qiongzhou Strait may have been the most important source and sink pathway. These results are consistent with those of the material source analysis of SO-50 sediments in the Beibu Gulf by Zhang et al. (2018). The partitioning curve of U3 had an obvious left-high-right-low right-slope, and the partitioning curve was very similar to that of the parent rock on Hainan Island (Figure 8C) and differs greatly from those of other neighboring potential source areas (Figure 8D). This suggested that the sediments in the study area were mainly influenced by terrestrial material from Hainan Island during the last 1.3 cal kyr BP. This result is consistent with those of a previous study of clastic minerals in the Beibu Gulf (Dou et al., 2012) and analyses of sediment grain size trends (Xu et al., 2010).
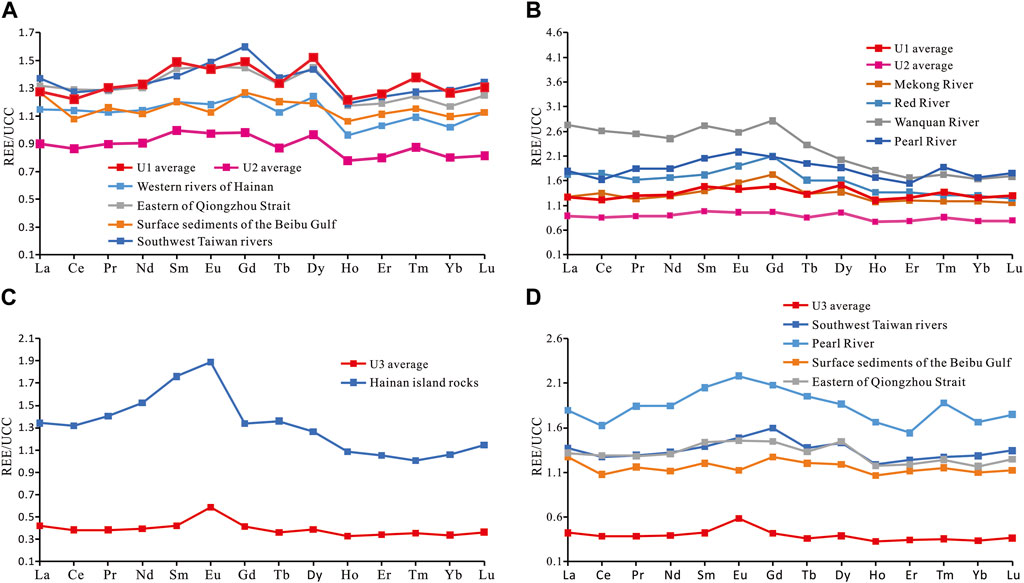
FIGURE 8. Comparison between Core KZK01 and the surrounding potential provenance areas with the upper continental crust normalized REE. (A) Plot of REE for U1, U2 stages and similar provenance areas. (B) Plot of REE for U1, U2 stages and unsimilar provenance areas. (C) Plot of REE for U3 stage and similar provenance areas. (D) Plot of REE for U3 stage and unsimilar provenance areas.
Scatter plots of UCC-normalized REE fractionation parameters can be used for further source identification (Dou et al., 2010). Comparison of (La/Yb)N (Figure 9A) and (Gd/Yb)N and LREE/HREE and (Gd/Lu)N (Figure 9B) for different source areas and shelves in the northern South China Sea showed that the U1 stage sediments in Core KZK01 were similar to those from the southwestern rivers of Taiwan, the Beibu Gulf, the Pearl River, and the eastern part of the Qiongzhou Strait. The U2 stage sediments were similar to those from the Beibu Gulf, the western rivers of Hainan Island, the eastern part of the Qiongzhou Strait, and Taiwan and the Pearl River. Stage U3 sediments were similar to the parent rock on Hainan Island and sediments from the western rivers of Hainan Island. Core KZK01 sediments differed greatly in REE characteristics from sediments of the Red River and Mekong River. The southwestern rivers of Taiwan, Pearl River, and Beibu Gulf contributed the most to the sediments deposited in the U1 stage. The Beibu Gulf, rivers of western Hainan Island, and eastern part of the Qiongzhou Strait contributed the most to the sediments deposited in the U2 stage, whereas the contribution of the Pearl River and the rivers in Taiwan gradually decreased. The southwestern rivers of Hainan Island and the parent rock of Hainan Island contributed the most to the sediments deposited during the U3 stage. Recent studies have found that sediments from the rivers in Taiwan and the Pearl River can be transported to the southeast Qiongnan shelf, thousands of meters away, or even to the Xisha Trough, which is thousands of kilometers away, under the action of the Guangdong littoral current and the deep-water currents during the winter (Liu et al., 2016; Yan et al., 2016; Xu et al., 2017; Xu et al., 2021). This further supports the contribution of sediments from the Pearl River and the rivers in Taiwan to the shelf and slope of the northwestern part of the South China Sea.
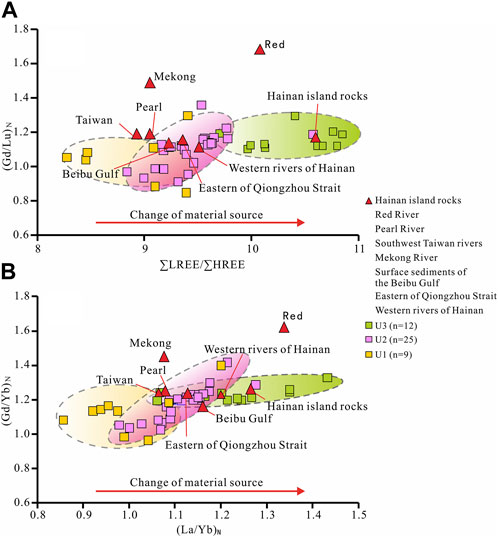
FIGURE 9. (A) (Gd/Lu)N and ∑LREE/∑HREE provenance discriminant diagram; (B) (Gd/Yb)N and (La/Yb)N provenance discriminant diagram. The red line indicates the change in terrigenous clasts provenance.
Sources of clay minerals
The use of clay minerals in marine sediments to study paleoclimate requires knowledge of the main source areas and transport pathways of each mineral (Gingele et al., 1998). The clay minerals in Core KZK01 originate from terrestrial sources, and the effects of secondary and diagenetic effects on these clay minerals is negligible. The main source areas in the study area include the Pearl River, the Red River, the Mekong River, the rivers of Hainan Island, the rivers of Guangxi, the rivers of Taiwan, and the rivers of northern Vietnam. Sediments exported from small rivers along the coast of Vietnam are mainly transported southward by the Vietnamese coastal current (Figure 1), and it is difficult for them to reach the study area, so their contribution to Core KZK01 is negligible. Coastal erosion in marine areas such as the Qiongzhou Strait and the western part of the Leizhou Peninsula may also provide a small amount of sediments (Xu et al., 2010), but the amount of these sediments and their clay mineral fractions are not known, so their contribution is ignored in this study.
The Red River is the largest source of sediments in the Beibu Gulf, delivering approximately 130 × 106 t of suspended sediment (Milliman and Syvitski, 1992). Illite (44%) is the main clay mineral, followed by kaolinite (26%), chlorite (23%), and smectite (7%) (Liu et al., 2007). The Mekong River transports approximately 160 × 106 t of suspended sediments to the South China Sea annually (Milliman and Syvitski, 1992). The clay minerals in these sediments are also dominated by illite, with an average content of 37% (Table 6), followed by kaolinite (31%), chlorite (23%), and smectite (approximately 10%) (Liu et al., 2016). The Pearl River transports 84.3 × 10⁶ t of suspended sediments to the South China Sea every year (Zhang et al., 2012). The clay minerals in the Pearl River sediments are mainly kaolinite (average of 46%, the same as below), followed by chlorite (31%), illite (18%), and smectite (5%). The Changhua River and Nandu River are the largest rivers on Hainan Island, and their annual average sediment transport is approximately 1.18 × 10⁴ t (Milliman and Farnsworth, 2011), which is lower than that of the Red River (130 × 106 t) and Mekong River (160 × 106 t). The fluvial sediments in Guangxi and Hainan have similar clay mineral assemblages. Taiwan is the main source of sediments in the South China Sea (Milliman and Farnsworth, 2011), with 176 × 106 t of suspended sediments flowing into the South China Sea from Taiwan every year (Dadson et al., 2003). These sediments are rich in illite (average: 56%; some sediments contain 66% illite) and chlorite (36%), with less smectite and kaolinite. Approximately 130 × 106 t of suspended matter is directly imported from Luzon Island every year (Milliman and Syvitski, 1992). Smectite is the predominant clay mineral, with an average content of 87%, whereas the average contents of illite, kaolinite, and chlorite are generally less than 10% (Liu et al., 2016).
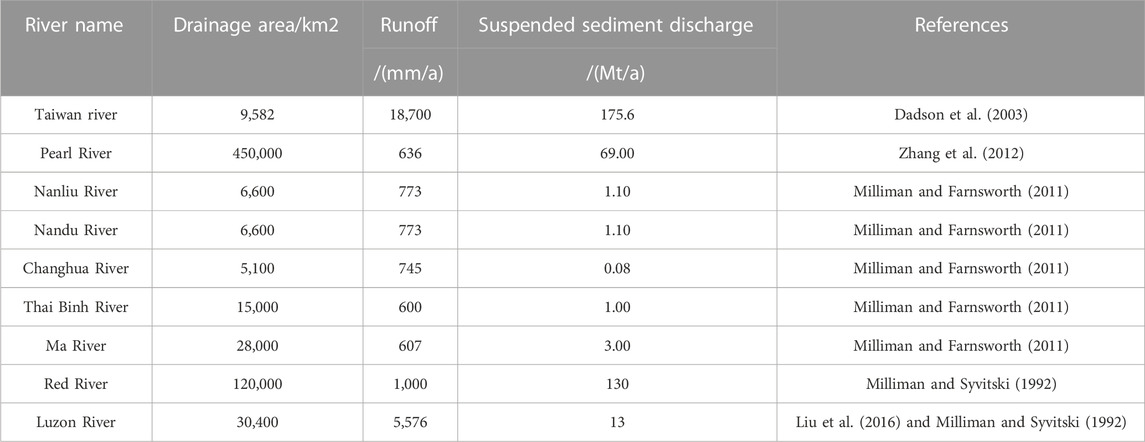
TABLE 6. Drainage area, runoff, and suspended discharge of potential source rivers in the study area.
Comparison of the clay mineral assemblage of Holocene samples from Core KZK01 with those in modern surface sediment samples from the aforementioned potential source areas showed that the clay minerals in the core originated from multiple sources (Figure 10A). The average smectite content of the study core was 21.15%, whereas the smectite content was less than 10% in all potential source areas except Luzon. It was found that differential sedimentation and sorting of clay minerals may have contributed to the high relative smectite content in marine sediments (Chen et al., 2017b). Since the average particle size of smectite (0.4 μm) is much smaller than that of illite (2–4 μm), chlorite (1–10 μm), and kaolinite (1–2 μm), the physical sorting effect of particle size will cause illite, chlorite, and kaolinite to preferentially undergo deposition close to the estuary, whereas smectite is easily transported to areas further away from the estuary.
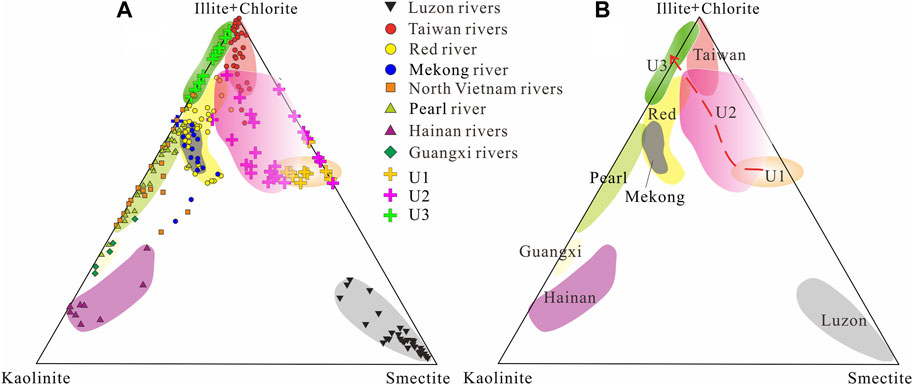
FIGURE 10. Ternary diagram of the major clay mineral groups illite + chlorite, kaolinite, and smectite. (A) Core KZK01 and surrounding fluvial surface samples. Areas defined by different shades of color show nine major drainage systems with potential fluvial sediment discharge. (B) The red dashed line indicates the change in clay mineral provenance of Core KZK01. Clay mineral data for the Pearl River are taken from Liu et al. (2007), and data for other surrounding potential provenances are taken from Liu et al. (2016).
In general, the smectite content exhibits enrichment as the distance from the estuary increases, a trend that has been confirmed in studies of clay minerals in the Beibu Gulf, (Jin et al., 2019), the northeastern part of the South China Sea (Liu J. G et al., 2010), and the Mississippi River (Johnson and Kelley, 1984). Thus, Luzon may be the main source area of smectite in the eastern part of the Beibu Gulf. Clay minerals exported from Luzon Island were carried into the South China Sea by a branch of Kuroshio as well as the north-east oriented deep South China Sea Current, and the contents of illite, chlorite, and kaolinite, which had large grain sizes, decreased rapidly as the transportation distance increased, owing to their large grain sizes. In contrast, smectite was more readily suspended in seawater owing to its small grain size, and its relative content gradually increased as the transportation distance increased. Subsequently, these suspended clay minerals were driven by the winter surface currents and littoral currents to the Beibu Gulf (Liu et al., 2016), where they were transported toward the northeast under the influence of counterclockwise circulation in the Beibu Gulf and eventually gradually settled in the eastern part of the Beibu Gulf (Figure 1).
In addition, Quaternary basaltic volcanic rocks are distributed across large areas in the northern part of Hainan Island (Liang et al., 2021). Chemical weathering of volcanic rocks, which can occur as long as there is a sufficient supply of water and does not depend on specific climatic conditions, is an important source of smectite (Liu et al., 2007), For example, up to 40% of smectite develops in Iceland near the North Pole and in the islands of West Antarctica (Rateev et al., 1969). The average smectite content of sediments from the rivers in Hainan is 6%–9% (Liu et al., 2016; Jin et al., 2019). The detrital material transported by the Nandujiang River is transported by littoral currents and surface currents through the Qiongzhou Strait and deposited in the Beibu Gulf (Figure 1); sediments from the Wanquanhe River can also be transported into the Beibu Gulf through littoral currents. However, the sediment flux of rivers in Hainan is very low (1–2 Mt/a), and its contribution to the sediments in the Beibu Gulf is very limited. Therefore, smectite mainly originates from Luzon Island, followed by Hainan Island.
The illite content at the study site is 52%–76%, and the average content of illite in the Pearl River, Taiwan River, Mekong River, and Red River is 31%–56% (Table 5). Thus, the illite in the study area could potentially originate from all of these source areas. Although the composition of clay minerals in the Thai Binh River and Ma River in northern Vietnam is dominated by illite (average: 54%) (Liu et al., 2016), the sediment transport of these rivers is too low (∼4 Mt/a) (Milliman and Farnsworth, 2011), and the contribution of illite to the study area is limited compared with the contributions of the Red River and the rivers in Taiwan. The illite content of rivers in Luzon Island, Hainan, and Guangxi ranges from 1% to 17% (Table 5), and the contribution of these sources to the illite in this area is the lowest. The provenance of illite minerals can be further determined by comparing the illite petrochemical indices and crystallinity of these potential provenance samples (Gingele et al., 2001). The illite crystallinity index can be used to reflect the degree of crystallization of illite—the smaller the crystallinity index, the better the degree of crystallization (Ehrmann, 1998). The results (Figure 11; Table 5) show that the crystallinity index of illite in Core KZK01 is 0.2° Δ2 θ, indicating that the illite in the Beibu Gulf has excellent crystallinity and is rich in aluminum, meaning that it originates from areas in which chemical weathering is dominant. This value is very similar to the crystallinity indexes of Red River illite (average of 0.19° Δ2 θ) and Pearl River illite (average of 0.17° Δ2 θ) (Liu et al., 2007). The mineralogical characteristics of illite from most Taiwanese river samples and some Red River samples are in good agreement with those from the research station. However, the illite geochemical index (average 0.62) and crystallinity (average 0.22° Δ2 θ) of the Pearl River are significantly larger than those from the study area, indicating that illite from the Pearl River does contribute to the illite in the eastern part of the Beibu Gulf. Therefore, we conclude that the rivers in Taiwan are the most likely sources of the illite in Core KZK01, followed by the Red River. A small amount of illite also originates from rivers in Hainan.
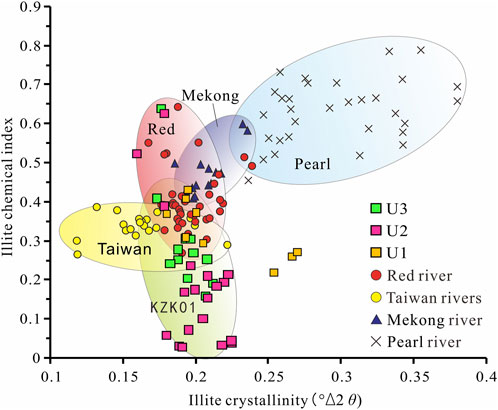
FIGURE 11. Comparison of illite chemical index and crystallinity index in Core KZK01. Data for the Pearl River, Red River, and Mekong River are taken from Liu et al. (2007). Data for the Taiwan rivers are taken from Liu et al. (2008).
The average chlorite content in the study area is 8.4%, and the chlorite contents of all potential source areas are within the range of 10%–30% (Table 5), with no obvious differences. The source areas cannot be determined from the mineral assemblage. It is generally accepted that chlorite in the South China Sea indicates climatic conditions characterized by strong physical weathering (Boulay et al., 2005). A previous study on clay mineral assemblage characteristics of Core MD05-2901 in the northern part of the South China Sea found that chlorite was mainly supplied by the Mekong River and the Red River (Liu et al., 2007). Jin et al. (2019) suggested that chlorite in surface clay minerals in the Beibu Gulf mainly came from the Red River and the Pearl River. Therefore, we concluded that the chlorite in Core KZK01 was mainly supplied by the Red River, followed by the Pearl River. The clay mineral composition of the rivers in Guangxi and Hainan is not dominated by chlorite with average chlorite contents of only 16% and 6%, respectively. Moreover, the rivers in Guangxi and Hainan discharge less than 3 Mt/a of suspended sediment annually (Table 6), and their contributions to the chlorite in the study area are limited compared with those of the Red River (130 Mt/a) and the Pearl River (69 Mt/a).
Kaolinite is formed as a result of intense chemical weathering and leaching of rocks in a warm and humid acidic environment. The spatial distribution of kaolinite in marine surface sediments is closely related to the supply of terrigenous materials and the climate (Aoki, 1976). Kaolinite is prone to flocculation when it enters alkaline seawater from rivers (Liu Z. F et al., 2010), so a large amount of kaolinite is deposited in the estuary and coastal zone. Previous studies have found that the kaolinite content is very high in the northern part of the Beibu Gulf (Jin et al., 2019), especially near Guangxi, the Qiongzhou Strait, and Hainan Island, and that the coastal area with high kaolinite contents runs parallel to the coastline. Hainan Island and Guangxi are located in tropical and subtropical regions, respectively, with a warm and humid climate, stable structure, and dominant chemical weathering, which are very conducive to the formation and preservation of kaolinite. Therefore, the clay minerals in sediments from the rivers of Hainan Island and Guangxi are mainly composed of kaolinite, with average contents of 76% and 65%, respectively (Table 5). Kaolinite is deposited in the Beibu Gulf when these rivers empty into the sea. Therefore, we inferred that Hainan Island and Guangxi are the main sources of kaolinite.
Terrigenous source shifts in response to paleoclimatic and sea level changes
The Beibu Gulf region has experienced significant provenance changes during the Holocene. Past changes in paleoclimate and relative sea level may have played a crucial role in shaping the provenance of sediments deposited in the gulf.
Illite crystallinity and the smectite/(chlorite + illite) ratio are often used as indicators of climate change (He et al., 2022). During the deposition of U1 (12–9 cal kyr BP), the mean value of illite crystallinity was 0.22°Δ2θ, which was greater than the mean value of 0.20°Δ2θ during the deposition of U2 (Table 5), indicating that the climate was more temperate and humid during the U1 stage. During this period, illite crystallinity and the montmorillonite/(chlorite + illite) ratio increased (Figures 12A,B), the East Asian summer monsoon intensified (Figure 12E), rainfall increased, and the warm and humid climate was conducive to the formation of smectite. In addition, although the sea level has risen (Figure 12G), the Qiongzhou Strait had not yet opened (Ni et al., 2014), which hindered the transportation of sediments from the regions to the east of the strait into the study area. The detrital material during this phase mainly transported from nearby sources, and the fine-grained material was likely to be transported to Luzon sediments via the South China Sea Warm Current. The variation trend of illite crystallinity was similar to the trend observed for the strength of East Asian summer winds in Dongge Cave (Wang et al., 2005; Dykoski et al., 2005; Figure 12E), the trend observed for the strength East Asian winter winds in Huguangyan Maar Lake (Yancheva et al., 2007; Figure 12F), as well as the trend of change in the sporadic wetness index (Zhao et al., 2009) in the Chinese monsoon area. The illite crystallinity index during the deposition of U1 clearly records extreme cold events such as Bond8, Bond7, Bond5 (Bond et al., 2001), and the Younger Dryas events, reflecting the regional response to global climate change.
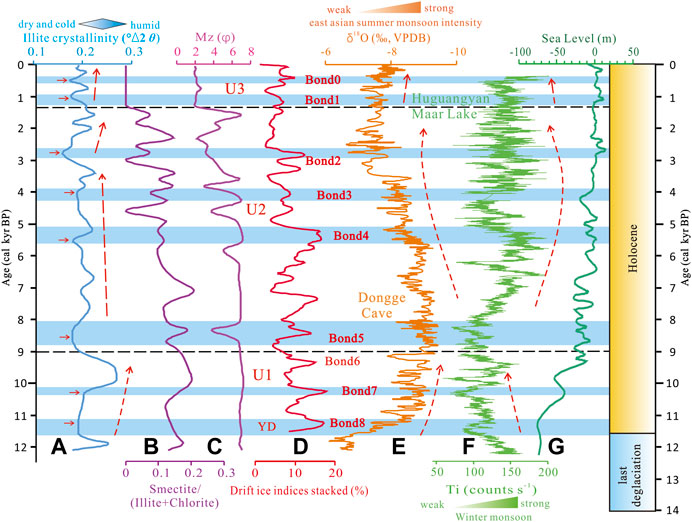
FIGURE 12. Comparison of elemental ratios with global climate change in Core KZK01. (A), (B), (C) Data are from this study; (D) Stacked drift ice indices. According to Bond et al. (2001), the ages of Bond 0, 1, 2, 3, 4, 5, 6, 7, and 8 events are 0.42, 1.26, 2.87, 4.13, 5.53, 8.47, 9.38, 10.29 and 11.34 cal kyr BP, respectively; (E) Oxygen isotope data of stalagmites in South China, according to Dykoski et al. (2005) and Wang et al. (2005); (F) Ti element intensity for Guangdong Huguangyan Maar Lake, from Yancheva et al. (2007); (G) relative sea level of the northwestern part of the South China Sea, from Siddall et al. (2003). The red dashed lines with arrows in the figure indicate long-period climate trends, and (A) demonstrates a synchronous trend with (E) and (F).
During the deposition of U2 (9–1.3 cal kyr BP), frequent changes in lithology occurred (Figure 12C), indicating a more turbulent depositional environment. The smectite/(illite + chlorite) ratio and illite crystallinity decreased relative to the previous phase and exhibited a trend of decreasing values. During this period, the East Asian summer monsoon weakened, the winter monsoon strengthened, and the sea level continued to rise (Figure 12G). At the same time, the Qiongzhou Strait opened (Ni et al., 2014; Cui et al., 2015), and the southwest coastal current strengthened, which increased the transport of sedimentary material from Taiwan. However, this trend changed at 2.78 cal kyr BP, when the climate changed from dry and cold to warm and humid. This is consistent with the Ti element intensity observed in Guangdong Huguangyan Maar Lake, stacked curves of drift ice and oxygen isotopes in Dongge Cave in South China (Figures 12D–F), and the relative rise in sea level of the northwestern part of the South China Sea since 2.78 cal kyr BP (Siddall et al., 2003; Figure 12g). Illite crystallinity is particularly sensitive to the record of cold events, and the Bond2, Bond3, and Bond4 cold events recorded in the North Atlantic ice floe debris elicited a relatively good response in the study area, indicating that illite crystallinity is a good proxy for reconstructing climate.
During the deposition of U3 (1.3 cal kyr BP to the present), the mean value of illite crystallinity was 0.17°–0.18° Δ2 θ before and after the 1.3 ka point, indicating a dry and cold climate dominated by physical erosion at this time. A previous study showed that the sea level along the northern coast of the South China Sea began to fall around 1.2 ka (Duong et al., 2020), the average age of the Late Holocene outcrops of beach rocks on Weizhou Island in the northern part of the Beibu Gulf was 1.3 ka, and the analysis of fossilized mangrove sporophytes showed a rapid sea recession in Qinzhou Bay at 1.1 ka (Xia et al., 2019). At this time, the shoreline of the Beibu Gulf underwent comprehensive repair and consolidation, and the present-day appearance of the Beibu Gulf took form (Huang et al., 2022). After the Late Holocene ice advance peaked at 1.3 kyr, the illite crystallinity curve continued to rise, which corresponded well with the precipitation record represented by the oxygen isotope curves of Dongge Cave stalagmites (Dykoski et al., 2005; Wang et al., 2005). This indicated a reversal of the climate change trend from dry and cold to warm and wet, which is also corroborated by the Ti intensity curves of the Huguangyan Maar Lake (Siddall et al., 2003). Moreover, sporulation characteristics showed that the sporulation content of woody and herbaceous plants remained essentially unchanged compared with that in the previous period and that the abundance of ferns was slightly increased (Lv et al., 2003), suggesting that the climate has improved since 1.3 kyr.
Conclusion
Comparison of the REE partition curves in the study area with those of the potential source areas indicates that the rivers of southwestern Hainan Island and the eastern part of the Qiongzhou Strait contribute the most to the detrital sediments in the study area. In addition, some of the fine-grained sediments may originate in the Pearl River Basin and northwestern Taiwan. The (Gd/Yb)N and (La/Yb)N discriminant diagram and (Gd/Lu)N and ∑LREE/∑HREE discriminant diagram further show that the clastic sediments in the U1 stage mainly originated in the eastern part of the Qiongzhou Strait, the Beibu Gulf, the southwestern rivers of Taiwan, and the Pearl River. The clastic sediments in the U2 stage mainly originated in the Beibu Gulf, the southwestern rivers of Hainan Island, and the eastern part of the Qiongzhou Strait, and the Pearl River and the rivers of Taiwan made medium contributions. The contributions of the Pearl River and rivers in Taiwan to the material gradually decreased during this period. The clastic sediments in the U3 stage essentially originated from Hainan Island.
Clay minerals in Core KZK01 mainly consist of illite (mean content of 60%), smectite (mean content of 21.2%), kaolinite (mean content of 10.5%) and chlorite (mean content of 8.4%). The characteristics of the clay minerals in the study area indicate that they originate from multiple sources. Smectite mainly comes from Luzon Island, followed by Hainan Island. The rivers in Taiwan are the most likely sources of illite in the study area, followed by the Red River; a small amount of illite comes from the rivers in Hainan. Chlorite, like illite, is mainly supplied by the Red River, with the Pearl River contributing to a lesser extent. Kaolinite is mainly supplied from Hainan Island and Guangxi River.
Since the Holocene, the evolution of the climate in the Beibu Gulf can be divided into three stages: U1 (12–9 cal kyr BP), U2 (9–1.3 cal kyr BP), and U3 (1.3 cal kyr BP to the present). During different climate evolution stages, drought was often accompanied by cold and humidity often coexisted with warmth. Moreover, there was clear alternation of cold-dry and warm-humid phases. The illite crystallinity clearly records extreme cold events such as the Bond (except Bond6) and the Younger Dryas events, reflecting the regional response to global climate change. The trend of illite crystallinity curves was essentially consistent with the regional climate reconstruction record. This showed the potential for using illite crystallinity as a proxy indicator for reconstructing regional surface chemical weathering processes.
Data availability statement
The original contributions presented in the study are included in the article/Supplementary Material, further inquiries can be directed to the corresponding authors.
Author contributions
DL and GX designed the study. LL and DL took the samples. DL, SW, LJ, FG, and LW, wrote the manuscript. GX, DJ, CY, and LW conceptualized the study. FG, SW, and GX contributed to the data analysis. DL, LW, and LJ performed the investigation validation. All authors contributed to the article and approved the submitted version.
Funding
This work was funded by the Hainan Key Laboratory of Marine Geological Resources and Environment Project (ZZ [2020] 2019256-02; 22-HNHYDZZYHJKF022), the NSFC project (grants 42272222) and by the Institute of Geomechanics, Chinese Academy of Geological Sciences superintendent fund with grant no. DZLXJK202211, and the Deutsche Forschungsgemeinschaft (WU 1062 1-1).
Acknowledgments
The authors would like to thank the MJEditor (www.mjeditor.com) for its linguistic assistance during the preparation of this manuscript. The manuscript was greatly improved by constructive comments from three reviewers and editor Basilios Tsikouras, thank you.
Conflict of interest
The authors declare that the research was conducted in the absence of any commercial or financial relationships that could be construed as a potential conflict of interest.
Publisher’s note
All claims expressed in this article are solely those of the authors and do not necessarily represent those of their affiliated organizations, or those of the publisher, the editors and the reviewers. Any product that may be evaluated in this article, or claim that may be made by its manufacturer, is not guaranteed or endorsed by the publisher.
Supplementary material
The Supplementary Material for this article can be found online at: https://www.frontiersin.org/articles/10.3389/feart.2023.1192206/full#supplementary-material
References
Aoki, S. (1976). Clay mineral distribution in sediments of the gulf of Thailand and the South China sea. J. Oceanogr. 32, 169–174. doi:10.1007/bf02107271
Blaauw, M., and Christen, J. A. (2011). Flexible paleoclimate age-depth models using an autoregressive gamma process. Bayesian Anal. 6, 457–474. doi:10.1214/ba/1339616472
Bolton, A., Goodkin, N. F., Druffel, E. R. M., Griffin, S., and Murty, S. A. (2016). Upwelling of pacific intermediate water in the South China Sea Revealed by coral radiocarbon record. Radiocarbon 58, 37–53. doi:10.1017/rdc.2015.4
Bond, G., Kromer, B., Beer, J., Muscheler, R., Evans, M. N., Showers, W., et al. (2001). Persistent solar influence on North Atlantic climate during the Holocene. Science 294, 2130–2136. doi:10.1126/science.1065680
Boulay, S., Colin, C., Trentesaux, A., Frank, N., and Liu, Z. F. (2005). Sediment sources and East Asian monsoon intensity over the last 450 ky: mineralogical and geochemical investigations on south China sea sediments. Palaeogeogr. Palaeoclimatol. Palaeoecol. 228, 260–277. doi:10.1016/j.palaeo.2005.06.005
Cao, L. C. (2014). Provenance evolution since neogene in the yinggehai and qiongdongnan basins: evidence from REE. Heavy mineral and zircon U-Pb ages. [dissertation/master's thesis]. Wuhan: China University of Geosciences.
Cao, L., Liu, J., Xu, X., Qiao, Y., Khan, M. H. R., and Tan, L. (2021). The influence of mesoscale eddies on sedimentary processes in the western South China Sea since 32 kyr BP. Mar. Geol. 441, 106621. doi:10.1016/j.margeo.2021.106621
Cao, Y. C., Xu, Q. S., and Wang, J. (2018). Research progress of source-sink systems in sedimentary basin. Earth Sci. Front. 25, 116–131. (in Chinese). doi:10.13745/j.esf.sf.2018.5.30
Chen, B., and Shi, M. C. (2019). Advances in study of Beibu gulf circulation. Guangxi Sci. 26, 595–603. (in Chinese). doi:10.13656/j.cnki.gxkx.20200103.001
Chen, C. L., Li, P. L., Shi, M. C., Zuo, J. C., Chen, M. X., and Sun, H. P. (2009). Numerical study of the tides and residual currents in the Qiongzhou Strait. Chin. J. Oceanol. Limnol. 27, 931–942. doi:10.1007/s00343-009-9193-0
Chen, C. S., Lai, Z. G., Beardsley, R. C., Xu, Q. C., Lin, H. C., and Viet, N. T. (2012). Current separation and upwelling over the southeast shelf of Vietnam in the South China Sea. J. Geophys. Res. Oceans 117, C03033. doi:10.1029/2011JC007150
Chen, H., Harff, J., Qiu, Y., Osadczuk, A., Zhang, J., Tomczak, M., et al. (2015). Last glacial cycle and seismic stratigraphic sequences offshore western hainan island, NW south China sea. Geol. Soc. Spec. Publ. 429, 99–121. doi:10.1144/SP429.9
Chen, J. F., Zhai, W. D., Wang, B., Li, D. W., Xiong, T. Q., Jin, H. Y., et al. (2021). A review of the carbon cycle in river-estuary-coastal ocean continuum. J. Mar. Sci. 39, 11–21. (in Chinese).
Chen, Q., Kissel, C., and Liu, Z. F. (2017a). Late quaternary climatic forcing on the terrigenous supply in the northern South China sea: input from magnetic studies. Earth Planet Sci. Lett. 471, 160–171. doi:10.1016/j.epsl.2017.04.047
Chen, Q., Liu, Z. F., and Kissel, C. (2017b). Clay mineralogical and geochemical proxies of the East Asian summer monsoon evolution in the South China sea during late quaternary. Sci. Rep. 7, 42083. doi:10.1038/srep42083
Cui, Z. A., Lin, J. Q., Gan, H. Y., Liu, W. T., and Zhang, L. (2015). Geochemical characteristics of the surface sediments in the eastern Beibu gulf, south China sea. Mar. Sci. 39, 103–111. doi:10.11759/hykx20140905001
Dadson, S. J., Hovius, N., Chen, H., Dade, W. B., Hsieh, M. L., Willett, S. D., et al. (2003). Links between erosion, runoff variability and seismicity in the Taiwan orogen. Nature 426, 648–651. doi:10.1038/nature02150
Dang, P. X., Mitsuguchi, T., Kitagawa, H., Shibata, Y., and Kobayashi, T. (2004). Marine reservoir correction in the South of Vietnam estimated from an annually-banded coral. Radiocarbon 46, 657–660. doi:10.1017/s0033822200035712
Dou, Y. G., Li, J., Zhao, J. T., Hu, B. Q., and Yang, S. Y. (2012). Distribution, enrichment and source of heavy metals in surface sediments of the eastern Beibu Bay, South China Sea. Mar. Pollut. Bull. 67, 137–145. doi:10.1016/j.marpolbul.2012.11.022
Dou, Y. G., Yang, S. Y., Liu, Z. X., Clift, P. D., Shi, X. F., Yu, H., et al. (2010). Provenance discrimination of siliciclastic sediments in the middle okinawa trough since 30ka: constraints from rare earth element compositions. Mar. Geol. 275, 212–220. doi:10.1016/j.margeo.2010.06.002
Du, S. H., Xiang, R., Liu, J. G., Yan, H. Q., Sha, L. B., Liu, J. P., et al. (2020). Variable Kuroshio current intrusion into the northern South China sea over the last 7.3 kyr. Palaeogeogr. Palaeoclimatol. Palaeoecol. 562, 110093. doi:10.1016/j.palaeo.2020.110093
Duong, N. T., Lieu, N. T. H., Cuc, N. T. T., Saito, Y., Huong, N. T. M., Phuong, N. T. M., et al. (2020). Holocene paleoshoreline changes of the Red River delta, Vietnam. Rev. Palaeobot. Palynol. 278, 104235. doi:10.1016/j.revpalbo.2020.104235
Dykoski, C. A., Edwards, R. L., Hai, C., Yuan, D. X., Cai, Y. J., Zhang, M. L., et al. (2005). A high resolution, absolute-dated Holocene and deglacial Asian monsoon record from Dongge Cave. China. Earth Planet. Sci. Lett. 233, 71–86. doi:10.1016/j.epsl.2005.01.036
Ehrmann, W. (1998). Implications of late Eocene to early Miocene clay mineral assemblages in McMurdo Sound (Ross Sea, Antarctica) on paleoclimate and ice dynamics. Palaeogeogr. Palaeoclimatol. Palaeoecol. 139, 213–231. doi:10.1016/S0031-0182(97)00138-7
Fallon, S. J., and Guilderson, T. P. (2008). Surface water processes in the Indonesian throughflow as documented by a high-resolution coral Δ14C record. J. Geophys. Res. 113, C09001. doi:10.1029/2008jc004722
Gingele, F. X., Deckker, P. D., and Hillenbrand, C. D. (2001). Clay mineral distribution in surface sediments between Indonesia and NW Australia: source and transport by ocean currents. Mar. Geol. 179, 135–146. doi:10.1016/S0025-3227(01)00194-3
Gingele, F. X., Müller, P. M., and Schneider, R. R. (1998). Orbital forcing of freshwater input in the Zaire Fan area-clay mineral evidence from the last 200 kyr. Palaeogeogr. Palaeoclimatol. Palaeoecol. 138, 17–26. doi:10.1016/s0031-0182(97)00121-1
He, L., Liu, Z. F., Lv, X., and Ma, P. F. (2022). Clay mineral assemblages of the oceanic red beds in the northern South China Sea and their responses to the Middle Miocene Climate Transition. Sci. China Earth Sci. 52, 920–931. doi:10.1360/SSTe-2021-0117
Heaton, T. J., Peter, K., Martin, B., Bard, E., Reimer, R. W., Austin, W. E. N., et al. (2020). Marine20-The marine radiocarbon age calibration curve (0-55,000 CAL BP). Radiocarbon 0, 1–42. doi:10.1017/RDC.2020.68
Huang, X. Q., Cui, Z. A., Lin, H., Xia, Z., and Zhang, S. Z. (2022). The driving factors on climatic and palaeo-ecological evolution of Beibu gulf since Holocene. Acta Geosci. Sin. 43, 129–143. (in Chinese). doi:10.3975/cagsb.2021.042501
Jiang, H. C., Guo, G. X., Cai, X. M., Thompson, J. A., Xu, H. Y., Zhong, N., et al. (2016). Geochemical evidence of windblown origin of the late cenozoic lacustrine sediments in Beijing and implications for weathering and climate change. Palaeogeogr. Palaeoclimatol. Palaeoecol. 446, 32–43. doi:10.1016/j.palaeo.2016.01.017
Jin, H. L., Wan, S. M., Zhang, J., Song, Z. H., Zhao, D. B., Huang, J., et al. (2019). Distribution and provenance of clay minerals in surface sediments of the Beibu Gulf, the South China Sea. Mar. Geol. 43, 75–84. (in Chinese).
Johnson, A. G., and Kelley, J. T. (1984). Temporal, spatial, and textural variation in the mineralogy of Mississippi river suspended sediment. J. Sediment. Res. 54, 67–72. doi:10.1306/212F83A5-2B24-11D7-8648000102C1865D
Kaboth-Bahr, S., Bahr, A., Yamoah, K. A., Chuang, C. K., Li, H. C., Su, C. C., et al. (2021). Rapid humidity changes across the Northern South China Sea during the last ∼40 kyrs. Mar. Geol. 440, 106579. doi:10.1016/j.margeo.2021.106579
Li, C. S., Shi, X. F., Kao, S. J., Liu, Y. G., Lyu, H. H., Zou, J. J., et al. (2013). Rare earth elements in fine-grained sediments of major rivers from the high-standing island of Taiwan. J. Asian Earth Sci. 69, 39–47. doi:10.1016/j.jseaes.2013.03.001
Li, S. X., Yun, P., Lin, Y. H., and Chen, Z. P. (2017). China regional Geology. Beijing: Hainan Chronicle Geological Press. (in Chinese).
Li, Z., Saito, Y., Matsumoto, E., Wang, Y. j., Tanabe, S., and Vu, Q. Lan. (2006). Climate change and human impact on the song hong (Red River) delta, Vietnam, during the Holocene. Quat. Int. 144, 4–28. doi:10.1016/j.quaint.2005.05.008
Li, Z., Zhang, Y. L., Li, Y. X., and Zhao, J. (2010). Palynological records of Holocene monsoon change from the gulf of tonkin (beibuwan), northwestern south China sea. Quat. Res. 74, 8–14. doi:10.1016/j.yqres.2010.04.012
Liang, D. Y., Wu, S. Z., Xu, G. Q., Xia, C. J., Gao, F. L., and Lin, Y. H. (2023). Paleoenvironmental changes in the coastal zone of the northwest South China Sea during the last 13 kyr. Sci Rep. 13, 13540. doi:10.1038/s41598-023-40721-5
Liang, D. Y., Xu, G. Q., Xiao, Y., Chen, X. Q., Li, S. X., and Ruan, M. (2021). Neogene-Quaternary strata structure and sedimentary evolution mode of northern Hainan Island. J. Stratigr. 45, 554–566. (in Chinese).
Liu J. G, J. G., Chen, M. H., Chen, Z., and Yan, W. (2010). Clay mineral distribution in surface sediments of the South China Sea and its significance for in sediment sources and transport. Chin. J. Oceanol. Limnol. 28, 407–415. doi:10.1007/s00343-010-9057-7
Liu, X. S., Chen, X. G., Sun, K., and Li, C. F. (2021). Provenance of U1431 sediments from the eastern subbasin of the South China Sea since middle miocene. Earth Sci. 46, 1008–1022. doi:10.3799/dqkx.2020
Liu, Z. F., Zhao, Y. L., Colin, C., Stattegger, K., Wiesner, M. G., Huh, C. A., et al. (2016). Source-to-sink transport processes of fluvial sediments in the South China Sea. Earth-Sci Rev. 153, 238–273. doi:10.1016/j.earscirev.2015.08.005
Liu, Z. F., Colin, C., Huang, W., Le, K. P., Tong, S. Q., Chen, Z., et al. (2007). Climatic and tectonic controls on weathering in south China and indochina Peninsula: clay mineralogical and geochemical investigations from the Pearl, red, and Mekong drainage basins: controls on weathering in S. China. Geochem. Geophys. Geosyst. 8, Q05005. doi:10.1029/2006GC001490
Liu, Z. F., Colin, C., Li, X. J., Zhao, Y. L., Tuo, S. T., Chen, Z., et al. (2010). Clay mineral distribution in surface sediments of the northeastern south China sea and surrounding fluvial drainage basins: source and transport. Mar. Geol. 277, 48–60. doi:10.1016/j.margeo.2010.08.010
Liu, Z. F., Tuo, S. T., Colin, C., Liu, J. T., Huang, C. Y., Selvaraj, K., et al. (2008). Detrital fine-grained sediment contribution from Taiwan to the northern South China Sea and its relation to regional ocean circulation. Mar. Geol. 255, 149–155. doi:10.1016/j.margeo.2008.08.003
Lv, H. Y., Liu, J. Q., Chu, G. Q., Gu, Z. Y., Negendank, J., Schettler, G., et al. (2003). A study of pollen and environment in the Huguangyan maar lake since the last glaciation. Acta Palaeontol. Sin. 42, 284–291. (in Chinese). doi:10.3969/j.issn.0001-6616.2003.02.013
McLennan, S. M., and Taylor, S. R. (1991). Sedimentary rocks and crustal evolution: tectonic setting and secular trends. J. Geol. 99, 1–21. doi:10.1086/629470
Mi, B. B., Liu, S. F., Shi, X. F., Li, X. Y., Pan, H. J., Chen, M. T., et al. (2017). A high resolution record of rare earth element compositional changes from the mud deposit on the inner shelf of the East China sea: implications for paleoenvironmental changes. Quat. Int. 447, 35–45. doi:10.1016/j.quaint.2016.09.056
Milliman, J. D., and Farnsworth, K. L. (2011). River discharge to the coastal ocean: A global synthesis. Cambridge: Cambridge University Press.
Milliman, J. D., and Syvitski, J. P. M. (1992). Geomorphic/tectonic control of sediment discharge to the ocean: the importance of small mountainous rivers. J. Geol. 100, 525–544. doi:10.1086/629606
Ni, Y. G., Endler, R., Xia, Z., Endler, M., Harff, J., Gan, H. Y., et al. (2014). The “butterfly delta” system of Qiongzhou Strait: morphology, seismic stratigraphy and sedimentation. Mar. Geol. 355, 361–368. doi:10.1016/j.margeo.2014.07.001
Rateev, M. A., Gorbunova, Z. N., Lisitzyn, A. P., and Nosov, G. L. (1969). The distribution of clay minerals in the oceans. Sedimentology 13, 21–43. doi:10.1111/j.1365-3091.1969.tb01119.x
Siddall, M., Rohling, E. J., Almogi-Labin, A., Hemleben, C., Meischner, D., Schmelzer, I., et al. (2003). Sea-level fluctuations during the last glacial cycle. Nature 423, 853–858. doi:10.1038/nature01690
Southon, J., Kashgarian, M., Fontugne, M., Metivier, B., and W-S Yim, W. (2002). Marine reservoir corrections for the Indian ocean and southeast asia. Radiocarbon 44, 167–180. doi:10.1017/s0033822200064778
Su, N., Yang, S. Y., Guo, Y. L., Yue, W., Wang, X. D., Yin, P., et al. (2017). Revisit of rare earth element fractionation during chemical weathering and river sediment transport. Geochem Geophys 18, 935–955. doi:10.1002/2016GC006659
Tian, C. J., Cai, G. Q., Li, M. K., and Zhao, Li. (2021). Paleoclimatic and paleoenvironmental changes recorded by elemental geochemistry in the northwestern south China Sea since the Past∼55 ka. Earth Sci. 46, 975–985. (in Chinese). doi:10.3799/dqkx.2020.276
Tang, D. L., Kawamura, H., Lee, M. A., and Dien, T. V. (2003). Seasonal and spatial distribution of chlorophyll-a concentrations and water conditions in the Gulf of Tonkin, South China Sea. Remote Sens. Environ. 85, 475–483. doi:10.1016/s0034-4257(03)00049-x
Taylor, S. R., and McLennan, S. M. (1995). The geochemical evolution of the continental crust. Rev. Geophys. 33, 241–265. doi:10.1029/95rg00262
Thilakanayaka, V., Chuanxiu, L., Xiang, R., Devendra, D., Dasanayaka, S., Jiang, W., et al. (2019). Sediment provenance of the nansha trough since 40 ka B.P. in the South China sea: evidence from δ 13Corg, TOC and pollen composition. Front. Earth Sci. 7, 110. doi:10.3389/feart.2019.00110
Tian, X., Zhang, X., Wang, J., Sun, Z., Liu, M., Zhao, J., et al. (2023). Provenance and paleoenvironmental significance of sediments in the Beipo seamount of the northern South China Sea during the last deglaciation. Front. Mar. Sci. 10, 1110188. doi:10.3389/fmars.2023.1110188
Tong, S. Q., Liu, Z. F., Khanh, P. L., and Huang, W. (2006). Chemical weathering in the Red River Basin: records of major and trace elemental geochemistry. Bull. Mineralogy, Petrology Geochem. 25, 218–225. (in Chinese). doi:10.3969/j.issn.1007-2802.2006.03.002
Wan, S. M., Li, A. C., Clift, P. D., and Stuut, J. W. (2007). Development of the East asian monsoon: mineralogical and sedimentologic records in the northern South China Sea since 20 Ma. Palaeogeogr. Palaeoclimatol. Palaeoecol. 254, 561–582. doi:10.1016/j.palaeo.2007.07.009
Wang, X., Wang, Y., Tan, M., and Cai, F. (2020). Deep-water deposition in response to sea-level fluctuations in the past 30 kyr on the northern margin of the South China Sea. Deep Sea Res. Part I Oceanogr. Res. Pap. 163, 103317. doi:10.1016/j.dsr.2020.103317
Wang, Y. L., Cheng, H., Edwards, R. L., He, Y. Q., Kong, X. G., An, Z. S., et al. (2005). The Holocene asian monsoon: links to solar changes and North Atlantic climate. Science 308, 854–857. doi:10.1126/science.1106296
Wei, G. J., Liu, Y., Li, X. H., Shao, L., and Fang, D. Y. (2004). Major and trace element variations of the sediments at ODP Site 1144, South China Sea, during the last 230 ka and their paleoclimate implications. Palaeogeogr. Palaeoclimatol. Palaeoecol. 212, 331–342. doi:10.1016/s0031-0182(04)00329-3
Wu, D. X., Wang, Y., Lin, X. P., and Yang, J. Y. (2008). On the mechanism of the cyclonic circulation in the Gulf of Tonkin in the summer. J. Geophys. Res. 113, C09029. doi:10.1029/2007jc004208
Xia, P., Meng, X. W., Li, Z., Zhi, P. Y., Zhao, M. W., and Wang, E. K. (2019). Late Holocene mangrove development and response to sea level change in the northwestern South China Sea. Acta Oceanol. Sin. 38, 111–120. doi:10.1007/s13131-019-1359-9
Xu, F. J., Hu, B. Q., Dou, Y. G., Liu, X. T., Wan, S. M., Xu, Z. K., et al. (2017). Sediment provenance and paleoenvironmental changes in the northwestern shelf mud area of the South China Sea since the mid-Holocene. Cont. Shelf Res. 144, 21–30. doi:10.1016/j.csr.2017.06.013
Xu, F. J., Hu, B. Q., Zhao, J. T., Liu, X. T., Xu, K. H., Xiong, Z. F., et al. (2021). Provenance and weathering of sediments in the deep basin of the northern South China Sea during the last 38 kyr. Mar. Geol. 440, 106602. doi:10.1016/j.margeo.2021.106602
Xu, J., and Jiang, Z. X. (2019). Provenance analysis of clastic rocks: current research status and prospect. J. Palaeogeogr. 21, 379–396. (in Chinese).
Xu, Z. F., and Han, G. L. (2009). Rare earth elements (REE) of dissolved and suspended loads in the Xijiang River, South China. Appl. Geochem. 24, 1803–1816. doi:10.1016/j.apgeochem.2009.06.001
Xu, Z. W., Wang, Y. P., Li, Y., Ma, F., Zhang, F., and Ye, C. J. (2010). Sediment transport patterns in the eastern Beibu Gulf based on grain-size multivariate statistics and provenance analysis. Acta Oceanol. Sin. 32, 67–78. (in Chinese).
Yan, H. M., Tian, X., Xu, F. J., Hu, B. Q., Yang, Y. M., Feng, J. W., et al. (2016). Sediment provenance of offshore mud area of the eastern Hainan island in South China Sea since the Mid-Holocene. Haiyang Xuebao 38, 97–106. (in Chinese). doi:10.3969/j.issn.0253-4193.2016.07.009
Yancheva, G., Nowaczyk, N. R., Mingram, J., Dulski, P., Schettler, G., Negendank, J. W., et al. (2007). Influence of the intertropical convergence zone on the East Asian monsoon. Nature 445, 74–77. doi:10.1038/nature05431
Yang, B., Yin, Y., Gao, S., Jia, P. H., and Xia, Z. (2019). A Holocene U37K based paleo-sea surface temperature reconstruction, the Beibu Gulf, Southwestern China. J. Nanjing Univ. Nat. Sci. 55, 320–331. (in Chinese).
Yang, S. Y., Bao, X. W., Chen, C. S., and Chen, F. (2003). Analysis on characteristics and mechanism of current system in west coast of Guangdong Province in the summer. Acta Oceanol. Sin. 25, 1–8. (in Chinese). doi:10.3321/j.issn:0253-4193.2003.06.001
Yu, K. F., Hua, Q., Zhao, J. X., Hodge, E., Fink, D., and Barbetti, M. (2010). Holocene marine 14C reservoir age variability: evidence from 230Th-dated corals in the South China sea. Paleoceanography 25, PA3205. doi:10.1029/2009PA001831
Zhang, A. M., Chen, M., Gan, H. Y., Chen, Q. M., Lan, B. B., and Fang, Q. (2018). Geochemical characteristics and sediment provenance of Core SO-50 sediments in the Beibu Gulf. Haiyang Xuebao 40, 107–117. (in Chinese).
Zhang, W., Wei, X. Y., Zheng, J. H., Zhu, Y. L., and Zhang, Y. J. (2012). Estimating suspended sediment loads in the Pearl River Delta region using sediment rating curves. Cont. Shelf Res. 38, 35–46. doi:10.1016/j.csr.2012.02.017
Zhang, Y. W., Liu, Z. F., Zhao, Y. L., Wang, W. G., Li, J., and Xu, J. (2015). Mesoscale eddies transport deep-sea sediments. Sci. Rep. 4, 5937. doi:10.1038/srep05937
Zhao, Y., Yu, Z. C., Chen, F. H., Zhang, J. W., and Yang, B. (2009). Vegetation response to Holocene climate change in monsoon-influenced region of China. Earth Sci. Rev. 97, 242–256. doi:10.1016/j.earscirev.2009.10.007
Keywords: Beibu Gulf, provenance, geochemistry, paleoclimate, Holocene
Citation: Liang D, Xu G, Gao F, Wen L, Jia L, Liu L, Jiao D, Yang C and Wu S (2023) Holocene sediment source analysis and paleoclimatic significance of core KZK01 from the eastern part of the Beibu Gulf. Front. Earth Sci. 11:1192206. doi: 10.3389/feart.2023.1192206
Received: 23 March 2023; Accepted: 30 August 2023;
Published: 11 September 2023.
Edited by:
Basilios Tsikouras, Universiti Brunei Darussalam, BruneiReviewed by:
Zhifu Wei, Institute of Geology and Geophysics (CAS), ChinaJianping Zhou, The University of Sydney, Australia
Afshin Zohdi, University of Zanjan, Iran
Copyright © 2023 Liang, Xu, Gao, Wen, Jia, Liu, Jiao, Yang and Wu. This is an open-access article distributed under the terms of the Creative Commons Attribution License (CC BY). The use, distribution or reproduction in other forums is permitted, provided the original author(s) and the copyright owner(s) are credited and that the original publication in this journal is cited, in accordance with accepted academic practice. No use, distribution or reproduction is permitted which does not comply with these terms.
*Correspondence: Guoqiang Xu, eGdxNjUzMTE4QDE2My5jb20=; Ling Wen, NTQxMzgyMDdAcXEuY29t; Shuzhuang Wu, c2h1emh1YW5nd3VAZ21haWwuY29t