 Janine Birnbaum1*
 Einat Lev1
 Pedro A. Hernandez2,3José Barrancos2,3Germán D. Padilla2,3
 María Asensio-Ramos2David Calvo2Fátima Rodríguez2Nemesio M. Pérez2,3
 Luca D’Auria2,3
 Sonia Calvari4
- 1Lamont-Doherty Earth Observatory, Columbia University, New York City, NY, United States
- 2Instituto Volcanológico de Canarias (INVOLCAN), Tenerife, Canary Islands, Spain
- 3Instituto Tecnológico y de Energías Renovables (ITER), Tenerife, Canary Islands, Spain
- 4Instituto Nazionale di Geofisica e Vulcanologia (INGV), Catania, Italy
The 2021 eruption at Tajogaite (Cumbre Vieja) volcano (La Palma, Spain) was characterized by Strombolian eruptions, Hawaiian fountaining, white gas-dominated and grey ash-rich plumes, and lava effusion from multiple vents. The variety of eruptive styles displayed simultaneously and throughout the eruption presents an opportunity to explore controls on explosivity and the relationship between explosive and effusive activity. Explosive eruption dynamics were recorded using ground-based thermal photography and videography. We show results from the analysis of short (
1 Introduction
The 2021 eruption of Cumbre Vieja volcano, La Palma, Canary Islands, Spain, was the longest and most damaging eruption on the island in the historical record. The eruption lasted 85 days, destroyed more than 2,800 buildings, and buried nearly 1,000 ha of agricultural land beneath lava and ash, and built the Tajogaite volcano cinder cone (Carracedo et al., 2022). Eruptive activity was characterized by simultaneous effusive and explosive Strombolian, lava fountaining and intermittent phreatic explosions from multiple vents located along northwest-southeast trending fissures. The sustained wide range of eruptive behavior during this eruption provides a valuable opportunity to investigate the relationships between activity at multiple vents with different eruptive styles at a range of different time scales. Our goal is to identify processes that control the eruption dynamics and search for possible precursors of eruption changes.
In this paper we present analyses from thermal videos and images recorded at different distances from the eruptive vents to track the plume dimensions, velocity, and flux over time. We compare our measurements with ash plume height estimated by the Volcanic Ash Advisory Centre (VAAC) Toulouse, SO2 flux from the Aura Ozone Monitoring Instrument (OMI), effusive time-averaged discharge rate (TADR) (Plank et al., 2023), seismicity (long-period and very-long-period tremor) recorded at the PLPI station located 5 km south of the eruptive center, and volume estimates of the tephra blanket (Bonadonna et al., 2022; Bonadonna et al., 2023). We evaluate temporal variability in explosivity to understand the transport of gas and magma in the shallow sub-surface and to identify short-term precursors to increases in explosive activity.
2 Eruption timeline
La Palma is the northwestern-most island in the Canary Archipelago, whose origin is thought to be the result of a mantle plume under the African Plate, erupting through Jurassic oceanic crust (Longpré and Felpeto, 2021, and references therin). There have been six previous eruptions on La Palma since the 16th century (1,585, 1,646, 1,677–1,678, 1712, 1949, and 1971), primarily characterized by both explosive and effusive character that built monogenetic cinder cones along fissures 0.2–4.2 km in length, and, in all six cases, produced lava flows that reached the ocean (Longpré and Felpeto, 2021). Eruptions typically show only short precursory activity with four eruptions having only 1–7 days of felt seismicity, and have eruption durations from 24 to 84 days (Longpré and Felpeto, 2021).
The Tajogaite eruption was preceded by increased seismicity from October 2017 to August 2021, interpreted as intrusions at mantle (15–30 km) depth (D’Auria et al., 2022; Longpré, 2021; Oterino et al., 2022), which were also associated with changes in 3He/4He in a cold mineral spring (Padrón et al., 2022), and changes in soil Radon and Thoron concentrations (Torres-González et al., 2020). Immediate precursors to the 2021 eruption began September 11 with shallow seismicity and ground deformation (Longpré, 2021; D’Auria et al., 2022; De Luca et al., 2022).
On September 19, the eruption began with the opening of two closely-spaced (∼ 50 m), elongate, northwest-southeast trending fissures (N 120°–140°), angled approximately 45° to the slope, resulting in several vents (typically 5–8) at different altitudes between approximately 840 and 1,100 m above sea level (a.s.l.). The two fissures merged, building a single edifice that persistently hosted multiple vents. Vents were characterized by different styles of activity despite separation by only tens to hundreds of meters (Carracedo et al., 2022; Civico et al., 2022; Romero et al., 2022). The lower vents sourced lava flows that covered 12 km2. The higher altitude portion of the fissure hosted a dynamic number of vents exhibiting lava fountaining, Strombolian, and occasional phreatic explosions (PEVOLCA, 2021; Romero et al., 2022). Explosive activity from the upper vents produced pyroclastic material that built the majority of the Tajogaite volcano edifice which reached a total volume by the end of the eruption of 36.5 ± 0.3 Mm3 with a maximum height of 187 m (Civico et al., 2022; Romero et al., 2022). The overall average effusion rate for the eruption was 24.1 m3/s, which is at the high end of, but within prior estimates for effusion rates of historical La Palma eruptions, but was characterized by greater explosivity than had been identified in the historical record, reaching a Volcanic Explosivity Index (VEI) of 3 (Longpré, 2021; Longpré and Felpeto, 2021).
In the early phase of the eruption, the cone grew rapidly and experienced frequent small-scale failures and opening of new vents. On September 25, there was a large collapse of the edifice which resulted in rafted material, and was associated with increased explosive activity that ejected tephra containing white xeno-pumice fragments (Pankhurst et al., 2022; Romero et al., 2022). Plume heights were variable, ranging between 1,500 and 5,500 m a.s.l. (PEVOLCA, 2021; Volcanic Ash Advisory Center, 2021). SO2 emissions reached a maximum of 36 kilotons/day (OMI). Lava effusion sourced primarily a’a’ lava flows up to 15 m thick, but with occasional resurfacing by highly fluid lavas (PEVOLCA, 2021; Castro and Feisel, 2022; Di Fiore et al., 2023). The composition of the erupted material evolved over the first 20 days of the eruption to become increasingly mafic from a tephrite to basanite accompanied by a decrease of amphibole and xeno-pumice and an increase in olivine phenocrysts (Day et al., 2022).
In late October to November, the overall height of the gas-and-ash plume decreased to a more consistent value between 2,500 and 3,500 m a.s.l., along with a decrease in reported edifice collapses, and decreasing SO2 emissions (PEVOLCA, 2021; Volcanic Ash Advisory Center, 2021). In the final weeks of the eruption (approximately November 27 to December 12), explosive activity intensified, accompanied by collapses of the edifice and frequent changes in the active vents. The final day of the eruption on December 13 had the highest plume, estimated to have reached 7,700 m a.s.l (PEVOLCA, 2021; Volcanic Ash Advisory Center, 2021). A gradual decrease in eruption intensity followed by a final period of vigorous activity was also observed in the 1,585 Jedey and 1949 San Jaun eruptions on La Palma (Longpré and Felpeto, 2021).
3 Methods
3.1 Daily videos
Thermal infrared (IR) videos were collected nearly daily throughout the eruption (September 19 to December 13) from various opportunistic locations with distances between 500 and 4,800 m from the main explosive vents and at a variety of viewing angles with respect to the fissure strike. Observation locations are shown by green circles in Figure 1. Temporal coverage of the eruption is shown in Figure 2. Videos were recorded at frame rates between 8.7 and 21.5 fps, with 50% of the videos between 18.1 and 18.9 fps. Recordings range from 59 s to 4 min in length of which we use the first 2000 frames (approximately 2 minutes) in our analysis. The thermal video camera is a FLIR T660 with focal length 24.5 mm, and resolution of 640 x 480 pixels which correspond to spatial resolutions between 0.5 and 4.4 m.
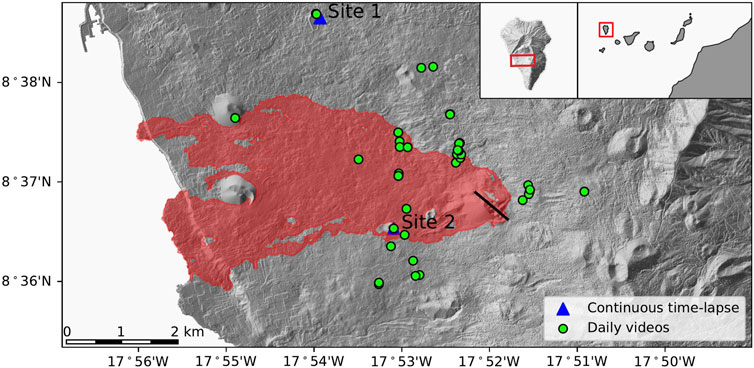
FIGURE 1. Map of eruption site and observation locations. Final outline of the lava flows from the eruption in red over the post-eruptive topography from Copernicus Emergency Management Service website (https://emergency.copernicus.eu/). The eruptive fissure is shown with a solid black line. Daily thermal video camera observation locations are shown by green circles. Continuous time-lapse thermal camera observation locations are shown in blue triangles.
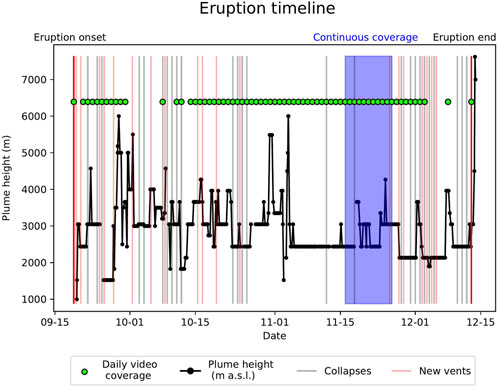
FIGURE 2. Eruption timeline and thermal video coverage. Green circles indicate dates with short thermal videos and the blue region highlights continuous coverage. Black line marks the plume height as reported by the Toulouse Volcanic Ash Advisory Centre Volcanic Ash Advisory Center, 2021, and gray and red vertical lines indicate days with collapses of the edifice or the opening of new vents (shifted 12 h to improve visibility), and solid red lines that indicate the beginning and end of the eruption.
Much of the low-intensity explosive behavior of the volcano fell along a continuum between unsteady Hawaiian fountaining and rapid Strombolian explosions, in which pulses of material are closely spaced in time, and generally an explosion or pulse of material is released before ejecta from the previous explosion has reached the ground (Walker et al., 2023). In most cases, it is difficult to determine precisely which end-member style is displayed in a given video because of the overlap in their characteristics, and in some cases co-existing vents displaying different behavior (Taddeucci et al., 2023). As a result, we treat all explosive behavior in the same way: we manually identify the location of the vent responsible for the largest high-temperature plume visible in the thermal images. In some images we can also identify the location of secondary high-temperature explosive plumes and occasionally effusive vents. In each analyzed frame, we identify the high-temperature plume area by thresholding pixel brightness above a manually-set value for each video chosen to isolate the same features in each video based on the judgement of the authors. IR brightness is sensitive to the distance to the target, as well as other factors such as ambient weather conditions (humidity), and images are automatically scaled during recording, which prevents the use of a constant threshold value. We find that for videos taken from more than ∼3 km distance, it is not possible to restrict the analysis to only the center of the plume, so we filter videos taken from more distal sites (n=3). Plume radius is estimated in each video by one-half the width of the high temperature region just above the vent. In cases with multiple vents, we sum together each vent. We also estimate the fountain height from videos, but in many cases the high-temperature fountain is partially obscured by the convective plume from another vent or extends beyond the field of view of the camera. As a result, these measurements come with greater uncertainty and can be found by the interested reader in the supplementary material (Supplementary Figure S1).
3.2 November 16th-26th time-lapse photography
We analyze continuous time-lapse thermal photographs collected between November 16 to 26 from two cameras that recorded several images each minute. These continuous data were telemetered in real-time through the cellular network and were immediately publicly available through the AVERT project data portal at https://avert.ldeo.columbia.edu. The cameras were operated primarily from two locations: Site 1 is located 4.8 km from the vent to the northwest, and looks almost parallel to the strike of the fissure, site 2 is located 1.8 km from the vent to the southwest and looks almost perpendicular to the strike of the fissure. Both continuous sites are indicated by blue triangles in Figure 1.
Camera 1 is a Calibir GXM 640 by Teledyne with a 19 mm effective focal length lens which has a horizontal FOV of 32.4° and vertical FOV of 24.4° and resolution of 640 x 480 pixels. It was operated intermittently with coverage primarily on November 25 and 26 and recorded between 1 and 60 frames per minute viewing the volcano from Site 1 (pixel size of 4.2 m). Camera 2 is a FLIR SC325 with a 18 mm focal length lens with a 25° by 18.8° FOV and resolution of 640 x 480 pixels. Camera 2 operated continuously from Site 1 (pixel size of 3.3 m) from November 16 to November 21 and was restarted on November 22 following an approximately 24 h gap, until approximately 9:00 local time on November 23. The camera was then moved to Site 2 (pixel size of 1.2 m), and operation resumed at 17:00 on November 23 until 23:00 on November 25 when inclement weather obscured the view and disrupted the camera’s functioning. During the period November 16 to 21, the camera collected a 5-image burst once per minute at a frame rate of 60 fps, and during the period November 22 to 25, collected a 3-image burst once per minute at 60 fps.
Once per minute, we measured the apparent plume radius and height of the high-temperature lava fountaining or gas-and-ash jet. The plume area is selected using a manual threshold as described for the videos above. In the case of the time-lapse photography, the fountain height was more consistently visible, and those results are presented in the main text below. Additionally, we measured the apparent area of fresh lava present on the edifice, below the level of the vent. We filtered for the presence of clouds based on a threshold on the variance in the temperature field above the vent.
3.3 Velocimetry
In daily videos and in photo bursts from Camera 2, we used a Python implementation of Optical Flow to calculate velocities in the plume. We choose frames spaced approximately 0.25 and 0.05 s apart for the videos and Camera 2 respectively. Because the velocities are variable across the plume, we take a mean, weighted by the pixel brightness, to find a velocity representative of the fast-moving high-temperature center, averaged over a vertical ten pixel region closest to the base of the visible plume. Mean velocities presented below indicate the time-mean of the spatial mean. We find a maximum velocity value in time by taking the 98% percentile value with time; we exclude the highest possible values as some of the recordings show brief skips that anomalously increase the measured velocities between frames but these generally impact
3.4 Periodicity analysis
We analyzed the frequency content of velocity using the Lomb-Scargle least-squares spectral analysis and the Continuous Wavelet Transform (CWT) using a Morelet wavelet, both of which can identify non-stationary periodicities in time series and of which the former is particularly well suited for data that are unevenly sampled or have data gaps. Both methods have been previously applied to understand periodicity in volcanic gas plumes (Pering et al., 2019). We apply both methods to video data and the Lomb-Scargle analysis only for the continuous time-lapse data. Given the data gaps in the time-lapse data, we test the effect of the data gaps by performing the analysis on synthetic time series with known periodicities and the same temporal gaps, results of which can be found in the supplementary material (Supplementary Figure S3). In the video data we also look for the distribution of inter-explosion times in the time series of velocity using a peak finding algorithm from the Python Scipy library.
3.5 Comparison with other datasets
We searched for correlations between plume radius, velocity, and flux in the high temperature plume with remote and satellite-based observations of daily plume height and SO2 flux, effusive time-averaged discharge rate (TADR), long-period (LP) (1–5 Hz) and very-long-period (VLP) (0.4–0.7 Hz) tremor, and changes in vent geometry though collapses of the edifice or opening of new vents. Plume height data are from the Toulouse Volcanic Ash Advisory Centre which provided estimates of the maximum height of the ash plume at least four times per day over the course of the eruption through a combination of satellite data and aircraft pilot observations (Volcanic Ash Advisory Center, 2021). SO2 data are from the Aura Ozone Monitoring Instrument (OMI) level 2 sulphur dioxide (SO2) total column product (https://so2.gsfc.nasa.gov/). TADR comes from thermal satellite imaging by Plank et al. (2023) and is resampled using a linear interpolation to daily resolution. Tremor data are from the PLPI station located about 5 km south of the eruptive center, sampled at 50 s period. We find dates with reported cone collapses or opening of new vents from the daily reports issued by the Plan de Emergencias Volcánicas de Canarias (PEVOLCA) (PEVOLCA, 2021).
4 Results
4.1 Variability on a day-weeks timescale
We measured plume radius, velocity, and apparent volume flux from thermal camera videos in the near-vent region. An example calculation is shown in Figure 3. The median apparent plume radius through time in the region just above the vent is 32 m, with 25th and 75th quartiles of 25 m and 37 m, respectively, with a maximum of 42 m. Over the course of the eruption the mean radius is 40 m and ranges up to 125 m. In some cases, this radius is the sum of two or more high-temperature vents when viewed from an angle with respect to the fissure direction, as is the case in Figure 3.
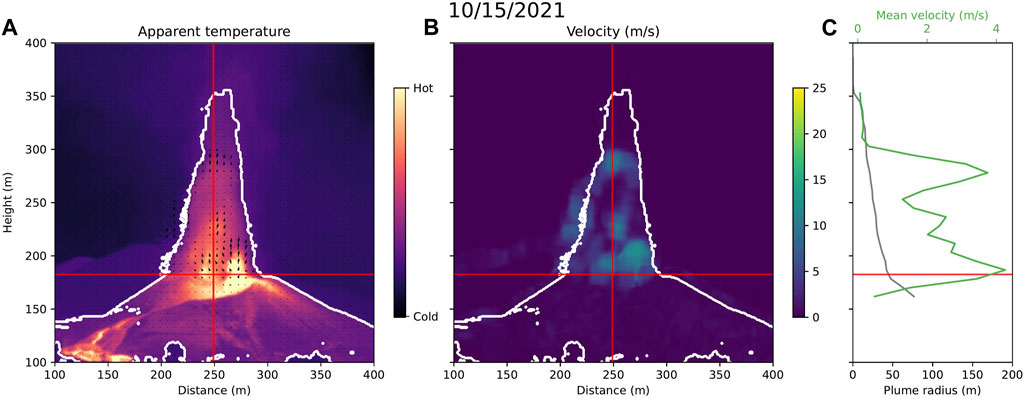
FIGURE 3. Example of thermal video processing for velocity and plume radius. (A) an example thermal image from November 23 taken 1 km away from the vent. Color indicates apparent temperature with a white contour showing the manually-applied threshold for the high-temperature gas-jet region of the lava fountain. Black arrows indicate the velocity calculated using Optical Flow. (B) velocity magnitude noting that because of the low variation in texture within the plume, we track the ascent of each pulse of material rather than individual pyroclasts. (C) plume radius and weighted spatial mean velocity of the high temperature material with height. All panels share a vertical axis and the horizontal red line indicates the height from which we extract the velocity and flux value, averaging over five pixels on each side. (A–B) vertical red line showing the location for extracting temperature with height in Figure 9.
Time-averaged velocities vary between 0.9 and 24.4 m/s with a mean of 6.3 m/s, and 25th, 50th, and 75th quartiles of 2.6 m/s, 4.4 m/s, and 8.0 m/s, respectively, and maximum velocities in each video between 3.1 m/s and 46.4 m/s with a median of 13.9 m/s (Figure 4). Depending on the viewing location of the camera and the behavior during a given recording, these velocities capture variously the vortex speed of the gas-thrust and convective portions of the ash-rich plumes, or of unsteady fountaining. These velocities fall within typical velocities for the ascent of type 2 (ash-rich) Strombolian explosions (e.g., Bombrun et al., 2015; Patrick, 2007; Patrick et al., 2007; Taddeucci et al., 2012, and references therin) and are low, but within the ranges of lava fountain ascent velocities measured at Etna of up to ≈250 m/s (e.g., Bonaccorso et al., 2014; Mereu et al., 2020), Figure 5and that expected for lava fountains of height 100–500 m (Supplementary Figure S1) based on the relationship
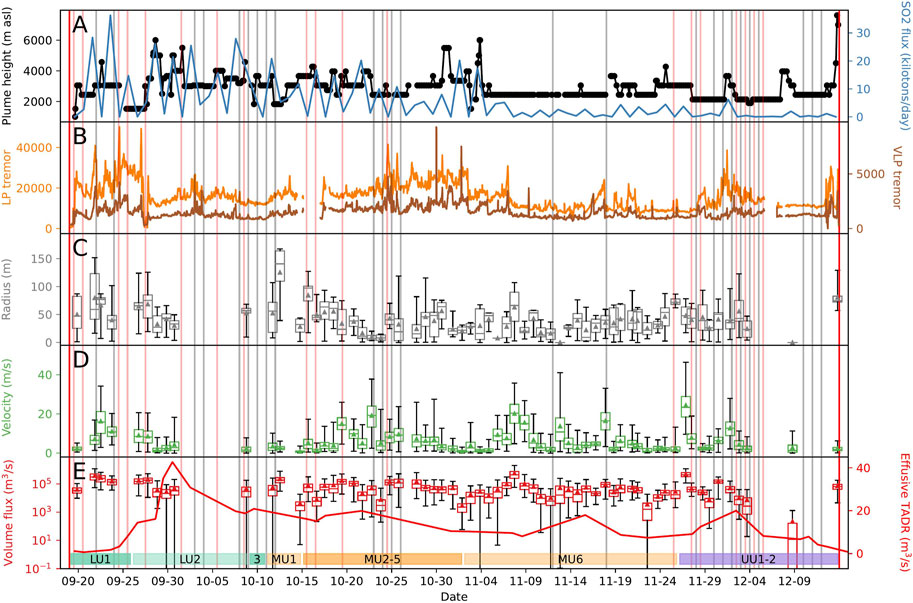
FIGURE 4. (A) VAAC plume heights (m (A) s.l) in black and SO2 mass flux (tons/day) in blue (Volcanic Ash Advisory Center, 2021), (B) LP and VLP tremor in olive and brown, respectively, (C) plume radius (m) from daily thermal camera videos in gray, (D) velocity (m/s) in green, (E) apparent volume flux (m3/s) in red. Lower bars in C-E indicate one standard deviation in time and upper bars indicate the maximum value. Beginning and end of eruption in dark red, edifice collapses in light gray and new vents in light red as reported by PEVOLCA (2021).
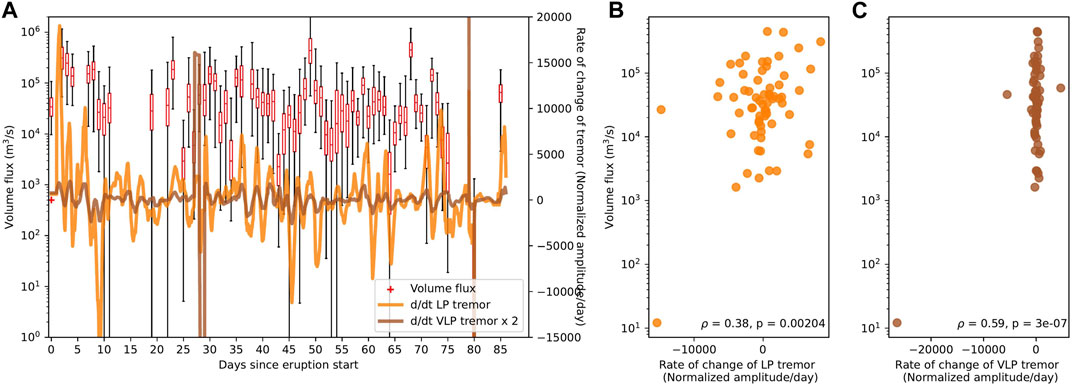
FIGURE 5. Cross correlations between thermal video-derived velocity rate of change and daily mean of LP (orange) and VLP (brown) tremor. (A) Timeline of velocity (red), rate of change of LP (orange) and VLP (brown) tremor. (B) LP and (C) VLP tremor.
Assuming a cylindrical plume, we calculate apparent volume flux in the plume from measured plume radius and velocity (Figure 4). The mean apparent volume flux is 8.2 × 10⁴ m3/s with 50% of the values falling between 2.5 × 10⁴ m3/s and 9.3 × 10⁴ m3/s. This value represents the apparent flux of the mixture of hot gas and tephra with a substantial thermal signal. To estimate the mass flux of solid material, we use estimates of the mass fraction of gas in the plume of other Type 2 Strombolian eruptions in the range 0.11–0.38 (Blackburn et al., 1976) to 0.67–0.95 (Rose et al., 1980; Patrick, 2007). Assuming a rock density of 2,770 kg/m3 (Bonadonna et al., 2022) and an air density of 1 kg/m3, we estimate mean mass eruption rate should be approximately 5 × 10³–2 × 10⁶ kg/s or 2–400 m3/s of dense rock equivalent (DRE) volume. This agrees with the finding of Taddeucci et al. (2023) who measure mass flux of lapilli to bomb-sized pyroclasts between 0.2–200 × 103 kg/s during campaigns from September 22 to October 1 and November 5 to 9. Additionally, it is likely that at least some of the material in the plume then falls back into the vent and is recycled during the next explosion. The volume of the cinder cone from DEM differencing is 36.5 Mm3 (Civico et al., 2022), which suggests an average volume eruption rate of scoriaceous material should be approximately 5 m3/s, not including the ash that was widely distributed. Assuming the volume fraction of gas in scoria to be 0.5–0.75 and packing of tephra in the cone to be 0.65–0.8 (Bonadonna et al., 2022), suggests a dense rock equivalent flux of ∼0.5–2 m3/s or
We compare measurements of the explosive activity with observations of volcanic tremor. There is no significant correlation between radius, velocity, or flux with the daily mean of LP or VLP tremor, or the ratio of LP/VLP tremor. However, we do find a correlation between volume flux and the rate of change of the daily mean of LP tremor (ρ=0.38, p=0.0020), and VLP tremor (ρ=0.59, p=3 × 10⁻⁷). That is, on days when volcanic tremor is increasing, volume fluxes are high, and on days when volcanic tremor is decreasing, explosive volume flux is low. This finding is consistent with volcanic tremor representing a shallow (∼100s–1000s of meters depth) resonating source produced by changes in pressurization or flow of gas and magma in the subsurface (Chouet, 1996; Cannata et al., 2009).
We do not find correlations between instantaneous vent conditions and the daily estimates of plume height, SO2 flux, or effusive TADR, despite moderate correlations between SO2 flux and plume height (ρ=0.27, p=0.026) and the daily mean of LP tremor (ρ=0.27, p=0.029). We expect that plume height should be related to the velocity or mass eruption rate of the vent, but the lack of correlation suggests that plume height in this eruption may have been controlled by other factors such as atmospheric conditions, as suggested by Bonadonna et al. (2022) or complicated coupling between fountaining behavior and the convective plume given the hybrid eruption style and frequent multiple vents (Snee et al., 2021).
Bonadonna et al. (2022) give a detailed stratigraphy of the tephra blanket over the course of the eruption, and use the tremor record combined with visible observations of the eruptive column and dated syn-eruptive tephra collection to constrain the timing of deposition. The tephra is divided into lower (LU1-3), middle (MU1-6), and upper (UU1-2) units. The deposition of LU1 occurred between September 19 and September 24–26 and is dominated by lapilli and has the lowest density of the eruption, and is further divided into sublayers (LU1.1–1.6) with varying proportions of lapilli and ash. During this time, we observe increasing velocities with time and unstable vent radius. After the major collapse on Sept. 25, there is a transition to LU2 which is characterized by an increase in density due to a decrease in the proportion of frothy glass. We observe at the beginning of this time period a decrease in the velocity at the vent which is inversely correlated with an increase in the effusive flux. We do not have detailed thermal video coverage of the end of this time period. Throughout the deposition of the LU, the cone underwent changes in vent geometry including the opening of new vents and partial collapses of the cone which are often associated with short-duration (
The MU was deposited between October 10–12 and November 25–27 and is characterized by an increase in the relative proportion of ash to lapilli, a decrease in vesicularity, and an increase in density from 926 ± 93 to 1,386 ± 137 kg/m3 (Bonadonna et al., 2022). In the thermal video record, the time of this transition is marked by a sharp increase in the radius of the vent that decreases over the following ≈12 days while the velocity is less stable and increases towards the end of this window. During this time, several new vents opened, coinciding with days with a sharp increase in velocity. The beginning and ending of this period was marked by edifice collapses. After October 26, we see an increase in the radius of the eruptive plume and an abrupt end to the edifice collapses and opening of new vents.
Between October 26 and November 25, there is a period of relative stability with very few collapses and no new vents. Explosive volume flux varies in pulses lasting ∼3–8 days, primarily driven by changes in velocity with radius remaining nearly constant or occasionally increasing together with velocity. The overall fluxes during this period are similar to the earlier and later phases of the eruption, which is also found by (Bonadonna et al., 2022) from volume estimates of the tephra blanket. We identify a pulse of increased volume flux following November 2–4, which was also found by Bonadonna et al. (2022, 2023).
On November 25, a low-altitude vent reopened and was the source of Hawaiian lava fountaining reaching ∼250 m high for
4.2 Variability on a hours-days timescale
In the continuous coverage from Camera 2, we find mean fountain heights of 124 ± 92 m, up to a maximum of 634 m. Although the continuous time series are disrupted by periods of clouds obscuring the vent, a camera outage, and a change in location, we clearly see variability over the course of the 10 days of continuous coverage. The 1-h rolling mean of apparent plume radius varies by a factor of 2.0 between the mean and maximum values. Fountain height varies by a factor of 6.8 between the mean and maximum values from 1.8 km viewing distance, and by a factor of 2.4 from 4.8 km distance. When viewed from the distal location, the fountain height is often obscured by convection in the plume, while views from the more proximal site likely give a better estimate of the fountain height and reflect real variability in fountain height.
In some images of the vent, we can also see the appearance of an increase in high-temperature (fresh) lava on the edifice, which likely reflects a transient increase in the effusive eruption rate. This signal decreases as the overspill of lava cools over a period of a few hours. In Figure 6 we show time series for three such events on November 19, 21, and 25. In each case, immediately following an increase in lava effusion, we identify an increase in the fountain height, column radius, and velocity compared to the preceding hours which continues for several hours, even after the lava effusion rate decreases again.
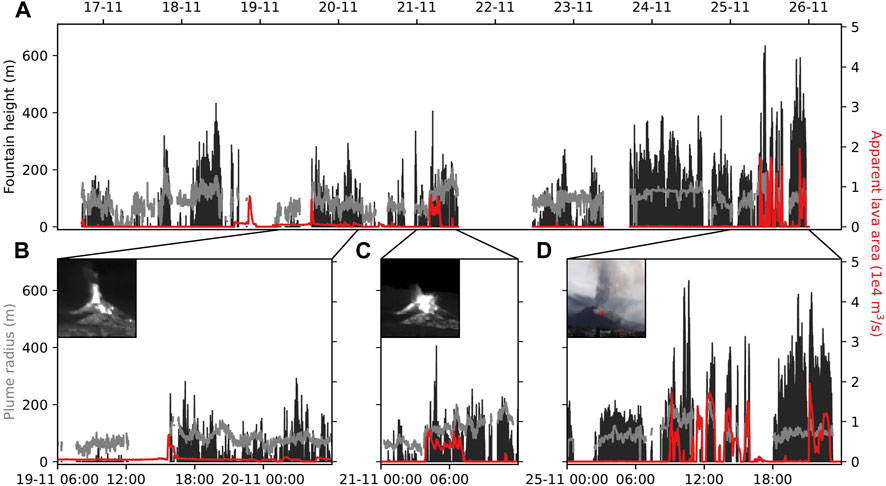
FIGURE 6. (A) Apparent plume area (gray), lava area on the edifice (red), and high-temperature fountain height (black) with one-minute time resolution from Camera 2 from November 16–26. Camera 2 was operated from Site 1 November 16–23 and Site 2 from November 23–25. (B–D) show time intervals in which new lava was visible on the edifice accompanied by an increase in lava fountain height and apparent plume area.
Velocity measurements from time-lapse Camera 2 have a mean of 9.6 m/s, a standard deviation through time of 4.2 m/s, and a maximum of 50.9 m/s. Using a Lomb-Scargle periodicity analysis, we identify periodicities in the explosive activity at 8, 11, and 35 h (Figure 7). Over this time window, we do not find a correlation between a rolling mean or maximum of velocity with estimates of plume height from the VAAC Toulouse.

FIGURE 7. Lomb-Scargle periodicity of (A) continuous radius, velocity, and volume flux data from November 16–25 and (B) LP and VLP tremor from the same date range.
4.3 Variability on a seconds-minutes timescale
Velocities are highly variable in time, characterized by pulses of increased flux of lava/tephra, which take ∼1–10 s to ascend and drive fluctuations in fountain height up to hundreds of meters. The standard deviation of velocity within individual videos are in the range of 0.1–10.5 m/s with a mean of 3.8 m/s, and correlate with the mean velocity to fall between 15% and 355% of the mean value, suggesting a large range in the stability of the explosive activity with videos showing the smallest mean velocities lower stability then those with higher velocity.
Pulses in the velocity directly above the vent occur with a median separation time of 0.7–4.4 s, with minimum separation times 0.46–1.14 s, and maximum separation times between 1.91 and 59.2 s. The median separation time between pulses is nearly stationary over the course of the eruption, but occasionally show trends over times scales of ≈5 days of increasing inter-explosion times during times of decreasing velocity and flux (Figure 8). Our results agree with inter-explosion times measured from visible camera observations of explosive activity showed median inter-explosion times of 2.16–14.08 s recorded on October 24–29 (Bonadonna et al., 2023), and mean time between pulses of 0.4–10 s from September 22 to October 1 and November 5 to 9, which also showed an inverse relationship between inter-explosion time and velocity (Taddeucci et al., 2023). This separation time is similar to that observed in the 1973 Eldfell eruption of Heimaey which showed 1–3 s pulsing times ejected up to 250 m above the crater rim during sustained Strombolian activity (Self et al., 1974), Etna volcano during Strombolian activity in July 2012 (median separation time of 2.4 s) and lava fountaining in April 2012 (1.6 s) (Dominguez et al., 2016), and hybrid unsteady Hawaiian and Strombolian activity (0.4–2.9 s) at basaltic fissures during the 2018 eruption of Kileaua (Walker et al., 2023). Dominguez et al. (2016) demonstrate that inter-explosion repose time correlates with magma viscosity, which may explain why we do not see large variations in this parameter across the course of the eruption despite changing flux rates. Viscosity estimates for this eruption are very low, estimated to be 50–160 Pa⋅s (Castro and Feisel, 2022).
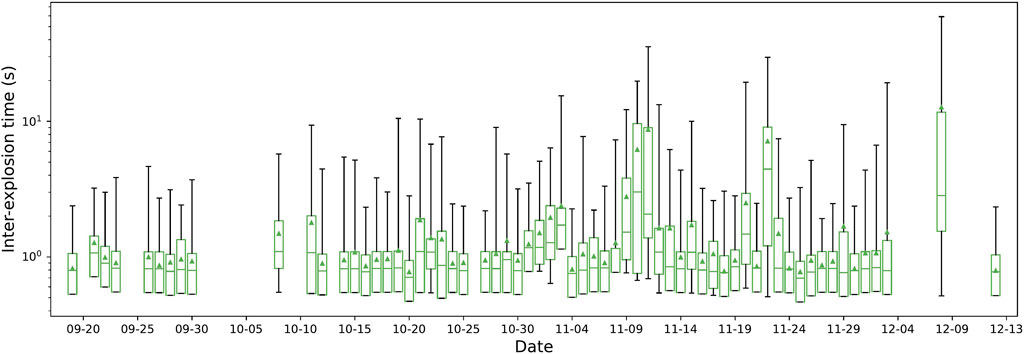
FIGURE 8. Inter-explosion time measured in each video, markers are centered at the mean inter-explosion time, upper error bars are the maximum, and lower error bars are one standard deviation.
In a periodicity analysis example in Figure 9, we show the apparent temperature in a single pixel wide column above the vent through time A), the apparent temperature and velocity just above the vent B) and Continuous Wavelet Transform of velocity C) and Lomb-Scargle periodicity analysis of velocity and temperature D) for an extended time series (250 s compared to typical ≈120 s). We observe periodicities in the temperature above the vent and the velocity at 31 and 41 s. Shorter (13 s) and longer (72 s) periods are less prominent in the temperature above the vent than in the velocity field. Over the course of the eruption, we identify periodicities between 1 and 50 s, with the highest occurrence between 4 and 13 s 47 of 67 videos have at least three identifiable periodicities, a further 19 have two distinct periodicities, and only 6 have one or no significant periodicities. Periodicities longer than approximately 50 s cannot be consistently identified in the videos trimmed to 2 minutes.
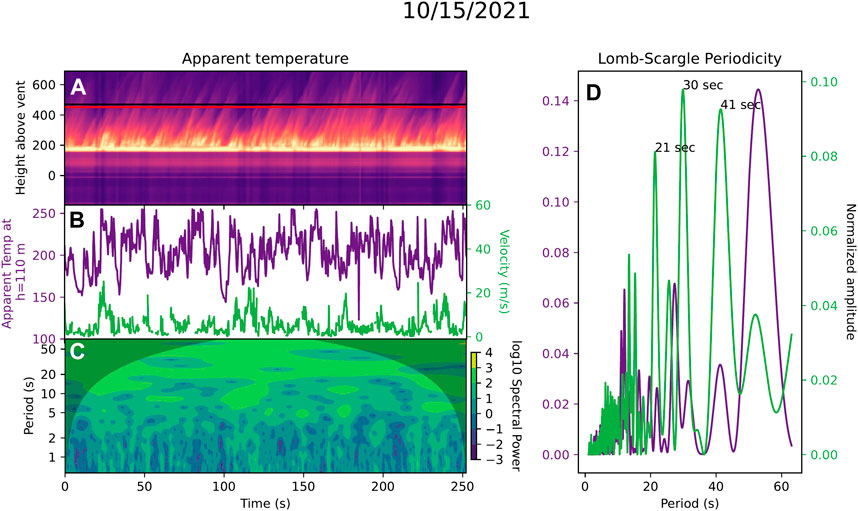
FIGURE 9. Example of thermal video from Figure 3 showing (A) apparent temperature with height in a one pixel column above the vent, through time. (B) Velocity (green) through time extracted at the red line on (A) and apparent temperature (purple) through time extracted at the black line on (A). (C) Continuous Wavelet Transform of the velocity time series, (D) Lomb-Scargle periodogram of the spatially-aggregated velocity (green) and apparent temperature (purple), showing periodicities between 10 and 72 s for velocity and 30 and 50 s for temperature.
Many of the videos show multiple active effusive and explosive vents. While we do not analyze all videos individually, we explore one example from October 15 in further detail (Figure 10). This video looks nearly parallel to the fissure strike, showing a lava flow sourced from a vent not visible behind the edifice, and at least two explosive vents. We analyze the velocity in the gray shaded regions placed at similar heights above two vents to separate behavior of the vents and show that the left vent has a more stable velocity, while the right vent has a larger range of velocities and a distinct 42 s periodicity. Cross correlation between the two time series reveals that the left vent has fluctuations that correlate with the right vent (maximum ρ=0.33, p=1 × 10–16), albeit of smaller magnitude, with a possible delay of 0–5 s.
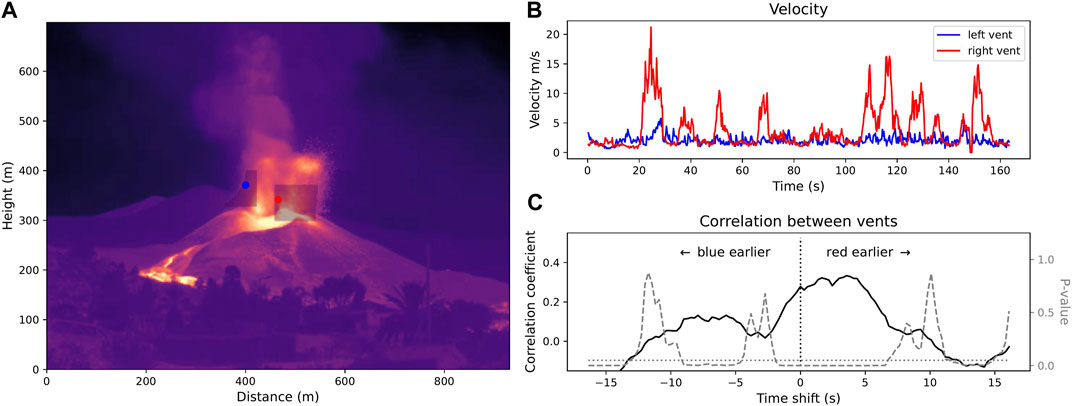
FIGURE 10. Example of a thermal video with multiple active explosive vents. We use the velocity in the shaded regions in (A) to produce time series of velocity for the left (blue) and right (red) vents (B) and show that the velocities from the two vents are correlated, with a potential delay of a few seconds, as shown in the time-shift correlation (C).
5 Discussion
5.1 The influence of viewing location
To evaluate the effect of viewing location on the estimated parameters, we look for correlations between our measurements and the viewing distance and angle in the opportunistic thermal videos. Considering all of the available data, we find a significant correlation between apparent radius and viewing distance (ρ=0.63, p=1 × 10⁻⁸) with viewing distance, where the apparent radii are larger from farther viewing distances. These correlations weaken when considering viewing distances between 580 and 3,000 m. The likely causes for this correlation could be that the threshold for closer videos is chosen to identify the high-temperature gas-jet and lava fountaining regions that are not distinguishable from larger distances, or resolution effects. For this reason, we do not include these videos in the overall eruption coverage because they are not suitable for inter-video comparison.
However, in the case of the time-lapse photography, we have a substantial record taken from a distal location for which data can be compared to one another. We look for differences between velocity observations from time-lapse Camera 2 on subsequent days on November 23–24 and show minor differences between observation locations with mean, maximum, and standard deviations of velocity with time respectively at location 1 (4.5 km): 10.2, 33.7, and 4.1 m/s and from location 2 (1 km): 8.3, 50.8, and 4.2 m/s. There are proportionally more measured velocities less than 10 m/s and fewer measured velocities between 20 and 30 m/s from the more proximal viewing site which may correspond to a decrease in activity (which was also captured in the daily videos), but the highest measured velocities extend to slightly higher values (Figure 11, Supplementary Fig. S4). The greater variability in the measurements from the near-vent location may reflect an improved ability to resolve behaviors in the plume interior that are not visible from the distal sites due to limited image resolution. It is not possible to determine whether this effect is solely a result of changing the viewing distance or reflects a true change in the velocity conditions from 1 day to the next.
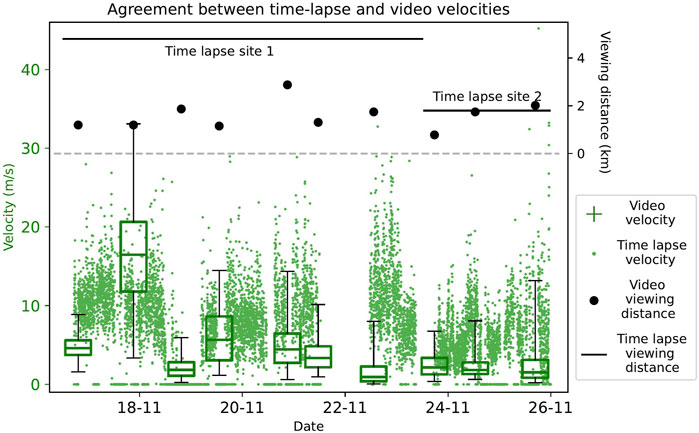
FIGURE 11. Velocity measurements recorded every 1 minute with a frame rate of 60 fps, and an average over 2 minutes measured at a frame rate of 15.7 fps about once per day.
5.2 The influence of temporal resolution
We compare velocity measurements from time-lapse Camera 2 and daily videos recorded in the same time window (Figure 11). The standard deviation of velocity in any given 2-min video typically falls between 38% (5th percentile) and 219% (95th percentile) of the median value. The standard deviation of velocities in the time-lapse data taken from the proximal location is 4.3 m/s which is 99% of the median value, suggesting that the temporal variability over the hours to days timescale, likely driven by changes in flux from the vent, is of the same order as or potentially lower than the variability over any 1–4 min video caused by Strombolian pulsing and unsteady Hawaiian fountaining.
Continuous measurements of velocity (Figure 11) and radius (Figure 12 show reasonable agreement in the day to day variability with measurements from the videos, despite different viewing locations. Median and mean estimates of velocity from the daily videos bracket observations from the time-lapse photography, and we observe a factor of about 2 difference between maximum velocities for the time-lapse cameras (60 fps) and the videos (≈18 fps) that we attribute to the difference in temporal resolution which limits the ability in the lower sampling rate case to capture potentially large instantaneous velocities.
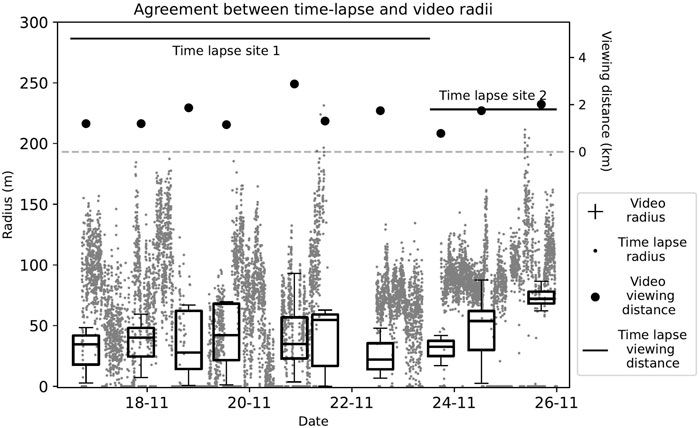
FIGURE 12. Radius measurements recorded every 1 minute with a frame rate of 60 fps, and an average over 2 minutes measured at a frame rate of 15.7 fps about once per day.
5.3 Comparison of visual and thermal imagery
The time-lapse cameras were calibrated for different temperature ranges (Camera 1:
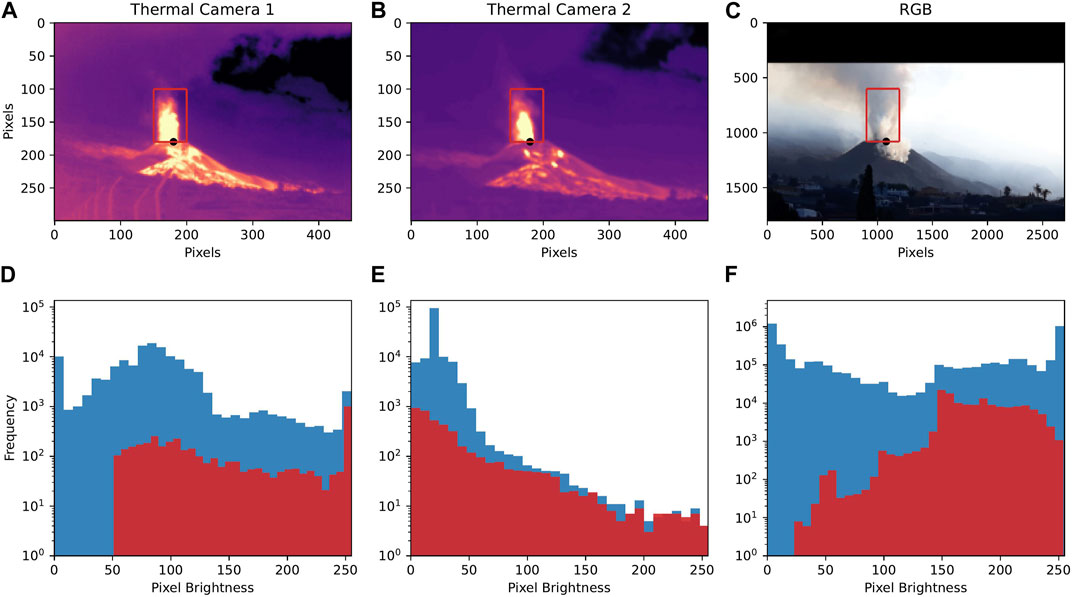
FIGURE 13. (A–C) Example photos from Camera 1, Camera 2, and an RGB image from the same time and location. (D–F) Histograms of pixel brightness for the full image in blue and the boxed plume region in red. Camera 1 is calibrated to a lower temperature range (
5.4 Recommendations for deployment
On the basis of our findings, we suggest that when planning instrument deployment of thermal cameras, it would be preferable to have a small number of repeat sites or locations of continuous measurement located proximal (
Our Continuous Site 2 exemplifies the challenge of finding a site for consistent and repeated recording. Continuous Site 2 was operated from a close-to-ideal site in that it was located only 1,500 m from the volcano and had electrical power to keep the cameras running. However, it was not possible to ensure that the site would remain accessible, as the region accumulated significant ash throughout the eruption. Indeed, the site was not accessible every day because of changing safety restrictions imposed by the civil protection agency, and because the primary road to the south side of the volcano was eventually inundated with lava which greatly increased the travel time to the site. Additionally, this site was on private property used with permission of the landowner who had a personal connection to the response team. During most eruptions, it may be difficult to establish permission while residents are responding to a crisis and evacuating.
Finally, data from equipment that can be deployed for an extended time should be telemetered in real-time to allow for rapid situation monitoring as well as confirmation that equipment is functioning properly. The data from the time-lapse cameras were telemetered in real-time using the cellular network and uploaded to a publicly available website. This allowed for monitoring and data recovery, even when the site was temporarily inaccessible, and the team was rapidly alerted to problems with the deployment.
5.5 Implication for shallow plumbing geometry
Correlations in short-term behavior of different vents suggests shallow connections on the scale of tens to hundreds of meters. In Figure 14, we sketch a simplified geometry in the shallow subsurface and within the volcanic edifice; the edifice profile is a smoothed transect of the edifice along the fissure direction shown in Figure 1 with no vertical exaggeration. The dashed line indicates the pre-eruptive topography. Magma ascends through shallowly connected fractures to multiple vents. Lava effusion occurs at the lower altitude vent(s) sourced from partially outgassed magma, while bubble-rich magma ascends vertically to multiple explosive vents at higher altitude. This geometry has been observed in other hybrid eruptions (e.g. Taddeucci et al., 2004).
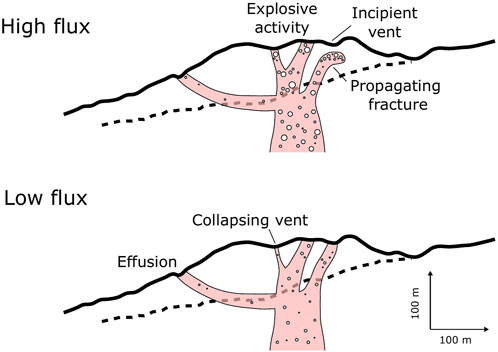
FIGURE 14. Simplified schematic of connected vents in the shallow sub-surface responding to high and low fluxes of gas-rich magma from depth. The elevation profile(solid black line) is taken along a transect across the edifice parallel to the fissure direction from northwest to southeast (Figure 1) taking the maximum altitude over a 150 m wide region shown with no vertical exaggeration. The dashed line shows the pre-eruptive topography along the same profile.
Activity at the explosive vents ranges from Strombolian to unsteady and steady Hawaiian fountaining (Walker et al., 2023). In cases with multiple vents showing unsteady behavior, we observe correlated fluctuations in velocity between vents separated by tens to hundreds of meters. These vents must be connected in the very shallow subsurface, with periodicities controlled by the magma source, for example ascending bubble trains, rather than sealing or backfilling of the vent (Taddeucci et al., 2012; Gaudin et al., 2014; Leduc et al., 2015; Capponi et al., 2016). Differences in steadiness between different vents are likely the result of small differences in the relative proportions of large and small bubbles determined by the partitioning of bubbles in the shallow conduit (Bonadonna et al., 2023; Taddeucci et al., 2023; Walker et al., 2023).
From the hours-days variability observed by the time-lapse cameras, we observe an early transient increase in effusive flux prior to sustained increases in explosive flux. We interpret this to be the result of the ascent of a pulse of gas-rich magma that pushes out partially outgassed magma in the shallow plumbing system to erupt effusively before the gas-rich magma reaches the surface at the higher-altitude explosive vents. Fluctuations in the fraction of gas suspended within the magma could change the relative proportion of effusively and explosively erupted magma, which could be an additional reason that we find an overall poor correlation between effusive discharge rate and explosive flux.
In times of high gas flux, volatile-rich magma increases explosive activity and can cause the propagation of fluid-filled fractures within the edifice that result in new vents opening or the reopening of previous vents, and widen active vents, resulting in wider and higher-velocity plumes and may also act to promote future cone failure (Calvari et al., 2016). The opening of new vents is also accompanied by transient increases in tremor and deeper seismicity Muñoz et al. (2022), which further supports that changes in the vent geometry are driven by changes in pressure and flux of the magma source. At times of rapid variability in flux, transitions between lapilli- and ash-dominated eruptive products, and during the decline in eruptive flux at the end of the eruption, we observe frequent collapses of the edifice which could be driven by opening and closing of fractures in response to changing flux conditions (Houghton and Schmincke, 1989; Calvari and Pinkerton, 2004). Highly variable sealing and opening of vents and reactivation of previous vents was observed during the 2011 eruption at Puyehue-Cordón Caulle in 2011–2012 where two main vents were interpreted to have long-lived high permeability structures with transient connections between sub-vents in the shallow subsurface (Schipper et al., 2013). Despite the very different rheologies of these two systems (basanite to tephrite compared to rhyolite), we observe similar systematics in the spatial and temporal relationships between effusive and various explosive behaviors. This suggests that the localization of gas-rich magma to a combination of long-lived major and short-lived minor transport pathways in the shallow edifice may be ubiquitous in the poorly consolidated material of tephra cones.
6 Conclusion
We measure the apparent radius, velocity, and volume flux of the high temperature gas-and-ash plumes and lava fountaining from near-daily short thermal camera videos and continuous time-lapse thermal images. We highlight variability on the seconds to tens of seconds timescales that reflect pulsing behavior associated with ash-rich Strombolian and steady and unsteady Hawaiian eruptions with stable recurrence times of 0.6 ± 0.3 s and ∼1–40 s periodicities. We observe correlated activity at multiple explosive vents which must be connected in the shallow subsurface, with temporal variability in flux controlled by the gas supply.
Continuous measurements of apparent fountain height, radius, and velocity recorded once per minute over a period of 10 days show fluctuations on the timescales of hours, including increases in effusion rate that precede extended periods of increased explosive activity. Combined with an overall poor correlation between effusive TADR and explosive flux, this finding suggests variability in the proportion of effusively and explosively erupted material, with gas-rich magma preferentially erupting explosively compared to partially outgassed material that takes a lower altitude pathway to erupt effusively.
We find agreement between estimates of volume flux from thermal videography and photography with estimates of erupted material from DEMs and tephra blanket modeling (Bonadonna et al., 2022; Civico et al., 2022), which could be improved by better estimates of the mass ratio of gas to solid material. While TADR shows an initial high eruption rate, followed by a longer period of low effusion rate (Plank et al., 2023), which is common in many eruptions (Wadge, 1981), we find that the apparent erupted volume remains more consistent through time and has some of the highest peaks in the middle and end of the eruption, although we cannot resolve the potential effect of changing mass fraction in the plume, which may be indicated by the transition from lapilli-to ash-dominated tephra (Bonadonna et al., 2022). Changes in explosive style, plume density, and grain size distribution on the hours-months timescales have been documented at other hybrid eruptions (e.g., Etna, Andronico et al., 2009).
Data availability statement
Thermal videos are available online at https://doi.org/10.5281/zenodo.8316425. Thermal time-lapse photos are available online at https://avert.ldeo.columbia.edu/content/data.
Author contributions
JB collected, analysed and interpreted data, and took the lead on drafting the manuscript. EL collected and interpreted data, secured funding for the authors from LDEO, and edited the manuscript. PH, JB, GP, MA-R, DC, FR, NP, and LD collected data and edited the manuscript. SC edited the manuscript. All authors contributed to the article and approved the submitted version.
Funding
Authors from INVOLCAN and ITER acknowledge support under projects VOLRISKMAC (MAC/3.5b/124) and VOLRISKMAC II (MAC2/3.5b/328), financed by the Program INTERREG V-A Spain-Portugal MAC 2014–2020 of the European Commission; Cumbre Vieja Emergencia, financed by the Science and Innovation Ministry, Spanish Government; TFassistance, financed by the Cabildo Insular de Tenerife; and LPvolcano, financed by the Cabildo Insular de La Palma. We are grateful to Antoni Álvarez for his logistical support. Authors from LDEO acknowledge support from the Gordon and Betty Moore Foundation under grant GBMF8995 for the AVERT project, and from NSF under EAR-1654588.
Acknowledgments
We would like to thank two reviewers for their constructive comments that helped improve the quality of the manuscript.
Conflict of interest
The authors declare that the research was conducted in the absence of any commercial or financial relationships that could be construed as a potential conflict of interest.
Publisher’s note
All claims expressed in this article are solely those of the authors and do not necessarily represent those of their affiliated organizations, or those of the publisher, the editors and the reviewers. Any product that may be evaluated in this article, or claim that may be made by its manufacturer, is not guaranteed or endorsed by the publisher.
Supplementary material
The supplementary material for this article can be found online at: https://www.frontiersin.org/articles/10.3389/feart.2023.1193436/full#supplementary-material
References
Andronico, D., Scollo, S., Cristaldi, A., and Ferrari, F. (2009). Monitoring ash emission episodes at Mt. Etna: the 16 november 2006 case study. J. Volcanol. Geotherm. Res. 180, 123–134. doi:10.1016/j.jvolgeores.2008.10.019
Blackburn, E. A., Wilson, L., and Sparks, R. S. (1976). Mechanisms and dynamics of strombolian activity. J. Geol. Soc. 132, 429–440. doi:10.1144/gsjgs.132.4.0429
Bombrun, M., Harris, A., Gurioli, L., Battaglia, J., and Barra, V. (2015). Anatomy of a strombolian eruption: inferences from particle data recorded with thermal video. AGU J. Geophys. Res. Solid Earth 120, 2367–2387. doi:10.1002/2014JB011556
Bonaccorso, A., Calvari, S., Linde, A., and Sacks, S. (2014). Eruptive processes leading to the most explosive lava fountain at Etna volcano: the 23 november 2013 episode. Geophys. Res. Lett. 41, 4912–4919. doi:10.1002/2014GL060623
Bonadonna, C., Pistolesi, M., Biass, S., Voloschina, M., Romero, J., Coppola, D., et al. (2022). Physical characterization of long-lasting hybrid eruptions: the 2021 tajogaite eruption of cumbre vieja (La Palma, canary islands). J. Geophys. Res. Solid Earth 127, 1–31. doi:10.1029/2022JB025302
Bonadonna, C., Pistolesi, M., Dominguez, L., Freret-Lorgeril, V., Rossi, E., Fries, A., et al. (2023). Tephra sedimentation and grainsize associated with pulsatory activity: the 2021 tajogaite eruption of cumbre vieja (La Palma, canary islands, Spain). Front. Earth Sci. 11, 1–24. doi:10.3389/feart.2023.1166073
Calvari, S., Intrieri, E., Di Traglia, F., Bonaccorso, A., Casagli, N., and Cristaldi, A. (2016). Monitoring crater-Wall collapse at active volcanoes: A study of the 12 january 2013 event at stromboli. Bull. Volcanol. 78, 1–16. doi:10.1007/s00445-016-1033-4
Calvari, S., and Pinkerton, H. (2004). Birth, growth and morphologic evolution of the ’Laghetto’ cinder cone during the 2001 Etna eruption. J. Volcanol. Geotherm. Res. 132, 225–239. doi:10.1016/S0377-0273(03)00347-0
Cannata, A., Hellweg, M., Di Grazia, G., Ford, S., Alparone, S., Gresta, S., et al. (2009). Long period and very long period events at Mt. Etna volcano: characteristics, variability and causality, and implications for their sources. J. Volcanol. Geotherm. Res. 187, 227–249. doi:10.1016/j.jvolgeores.2009.09.007
Capponi, A., Taddeucci, J., Scarlato, P., and Palladino, D. M. (2016). Recycled ejecta modulating Strombolian explosions. Bull. Volcanol. 78, 1–13. doi:10.1007/s00445-016-1001-z
Carracedo, J. C., Troll, V. R., Day, J. M., Geiger, H., Aulinas, M., Soler, V., et al. (2022). The 2021 eruption of the cumbre vieja volcanic ridge on La Palma, canary islands. Geol. Today 38, 94–107. doi:10.1111/gto.12388
Castro, J. M., and Feisel, Y. (2022). Eruption of ultralow-viscosity basanite magma at cumbre vieja, La Palma, canary islands. Nat. Commun. 13, 1–12. doi:10.1038/s41467-022-30905-4
Chouet, B. A. (1996). Long-period volcano seismicity: its source and use in eruption forecasting. Nature 380, 309–316. doi:10.1038/380309a0
Civico, R., Ricci, T., Scarlato, P., Taddeucci, J., Andronico, D., Del Bello, E., et al. (2022). High-resolution digital surface model of the 2021 eruption deposit of cumbre Vieja volcano, La Palma, Spain. Sci. Data 9, 1–7. doi:10.1038/s41597-022-01551-8
D’Auria, L., Koulakov, I., Prudencio, J., Cabrera-Pérez, I., Ibáñez, J. M., Barrancos, J., et al. (2022). Rapid magma ascent beneath La Palma revealed by seismic tomography. Sci. Rep. 12, 1–13. doi:10.1038/s41598-022-21818-9
Day, J. M., Troll, V. R., Aulinas, M., Deegan, F. M., Geiger, H., Carracedo, J. C., et al. (2022). Mantle source characteristics and magmatic processes during the 2021 La Palma eruption. Earth Planet. Sci. Lett. 597, 1–13. doi:10.1016/j.epsl.2022.117793
De Luca, C., Valerio, E., Giudicepietro, F., Macedonio, G., Casu, F., and Lanari, R. (2022). Pre- and Co-eruptive analysis of the september 2021 eruption at cumbre Vieja volcano (La Palma, canary islands) through DInSAR measurements and analytical modeling. Geophys. Res. Lett. 49, 1–10. doi:10.1029/2021GL097293
Di Fiore, F., Vona, A., Scarani, A., Giordano, G., Romano, C., Giordano, D., et al. (2023). Experimental constraints on the rheology of lavas from 2021 cumbre vieja eruption (La Palma, Spain). Geophys. Res. Lett. 50, 1–11. doi:10.1029/2022GL100970
Dominguez, L., Pioli, L., Bonadonna, C., Connor, C. B., Andronico, D., Harris, A. J., et al. (2016). Quantifying unsteadiness and dynamics of pulsatory volcanic activity. Earth Planet. Sci. Lett. 444, 160–168. doi:10.1016/j.epsl.2016.03.048
Gaudin, D., Taddeucci, J., Scarlato, P., Moroni, M., Freda, C., Gaeta, M., et al. (2014). Journal of geophysical research: solid Earth. J. Geophys. Res. Solid Earth 119, 5384–5397. doi:10.1002/2014JB011096
Houghton, B. F., and Schmincke, H. U. (1989). Rothenberg scoria cone, East eifel: A complex strombolian and phreatomagmatic volcano. Bull. Volcanol. 52, 28–48. doi:10.1007/BF00641385
Leduc, L., Gurioli, L., Harris, A., Colò, L., and Rose-Koga, E. F. (2015). Types and mechanisms of strombolian explosions: characterization of a gas-dominated explosion at stromboli. Bull. Volcanol. 77, 1–15. doi:10.1007/s00445-014-0888-5
Longpré, M. A., and Felpeto, A. (2021). Historical volcanism in the canary islands; part 1: A review of precursory and eruptive activity, eruption parameter estimates, and implications for hazard assessment. J. Volcanol. Geotherm. Res. 419, 1–23. doi:10.1016/j.jvolgeores.2021.107363
Longpré, M. A. (2021). Reactivation of cumbre vieja volcano. Science 374, 1197–1198. doi:10.1126/science.abm9423
Mereu, L., Scollo, S., Bonadonna, C., Freret-Lorgeril, V., and Marzano, F. S. (2020). Multisensor characterization of the incandescent jet region of lava fountain-fed tephra plumes. Remote Sens. 12, 1–18. doi:10.3390/rs12213629
Muñoz, V., Walter, T. R., Zorn, E. U., Shevchenko, A. V., González, P. J., Reale, D., et al. (2022). Satellite radar and camera time series reveal transition from aligned to distributed crater arrangement during the 2021 eruption of cumbre vieja, La Palma (Spain). Remote Sens. 14, 1–22. doi:10.3390/rs14236168
Oterino, B. B., Alvaraddo, G., Marchamalo, M., Rejas, J. G., Murphy, P., Franco, R., et al. (2022). Temporal and spatial evolution of Cabeza de Vaca 2021 rift eruption (Cumbre Vieja volcano, La Palma, Canary Islands) from geophysical and geodesic paramethers analyses. Res. Square 1, 35. doi:10.21203/rs.3.rs-1704547/v1
Padrón, E., Pérez, N. M., Hernández, P. A., Sumino, H., Melián, G. V., Alonso, M., et al. (2022). Early precursory changes in the 3 He/4 He ratio prior to the 2021 tajogaite eruption at cumbre Vieja volcano, La Palma, canary islands. Geophys. Res. Lett. 49, 1–9. doi:10.1029/2022gl099992
Pankhurst, M. J., Scarrow, J. H., Barbee, O. A., Hickey, J., Coldwell, B. C., Rollinson, G. K., et al. (2022). Rapid response petrology for the opening eruptive phase of the 2021 Cumbre Vieja eruption, La Palma, Canary Islands. Volcanica 5, 1–10. doi:10.30909/vol.05.01.0110
Patrick, M. R., Harris, A. J., Ripepe, M., Dehn, J., Rothery, D. A., and Calvari, S. (2007). Strombolian explosive styles and source conditions: insights from thermal (FLIR) video. Bull. Volcanol. 69, 769–784. doi:10.1007/s00445-006-0107-0
Patrick, M. (2007). The gas content and buoyancy of strombolian ash plumes. J. Volcanol. Geotherm. Res. 166, 1–6. doi:10.1016/j.jvolgeores.2007.06.001
Pering, T. D., Ilanko, T., and Liu, E. J. (2019). Periodicity in volcanic gas plumes: A review and analysis. Geosci. Switz. 9, 1–24. doi:10.3390/geosciences9090394
Plank, S., Shevchenko, A. V., D’Angelo, P., Gstaiger, V., González, P. J., Cesca, S., et al. (2023). Combining thermal, tri-stereo optical and bi-static InSAR satellite imagery for lava volume estimates: the 2021 cumbre vieja eruption, La Palma. Sci. Rep. 13, 1–14. doi:10.1038/s41598-023-29061-6
Romero, J. E., Burton, M., Cáceres, F., Taddeucci, J., Civico, R., Ricci, T., et al. (2022). The initial phase of the 2021 cumbre vieja ridge eruption (canary islands): products and dynamics controlling edifice growth and collapse. J. Volcanol. Geotherm. Res. 431, 1–16. doi:10.1016/j.jvolgeores.2022.107642
Rose, W. I., Chuan, R. L., Cadle, R. D., and Woods, D. C. (1980). Small particles in volcanic eruption clouds. Am. J. Sci. 280, 671–696. doi:10.2475/ajs.280.8.671
Schipper, C. I., Castro, J. M., Tuffen, H., James, M. R., and How, P. (2013). Shallow vent architecture during hybrid explosive-effusive activity at cordón Caulle (Chile, 2011-12): evidence from direct observations and pyroclast textures. J. Volcanol. Geotherm. Res. 262, 25–37. doi:10.1016/j.jvolgeores.2013.06.005
Self, S., Sparks, R. S., Booth, B., and Walker, G. P. (1974). The 1973 Heimaey strombolian scoria deposit, Iceland. Geol. Mag. 111, 539–548. doi:10.1017/S0016756800041583
Snee, E., Degruyter, W., Bonadonna, C., Scollo, S., Rossi, E., and Freret-Lorgeril, V. (2021). A model for buoyant tephra plumes coupled to lava fountains with an application to the 29th of August 2011 paroxysmal eruption at mount Etna, Italy. J. Geophys. Res. Solid Earth 126, 1–27. doi:10.1029/2020JB021360
Taddeucci, J., Alatorre-Ibarguengoitia, M. A., Palladino, D. M., Scarlato, P., and Camaldo, C. (2015). High-speed imaging of strombolian eruptions: gas-pyroclast dynamics in initial volcanic jets. Geophys. Res. Lett. 42, 6253–6260. doi:10.1002/2015GL064874
Taddeucci, J., Pompilio, M., and Scarlato, P. (2004). Conduit processes during the july–august 2001 explosive activity of Mt. Etna (Italy): inferences from glass chemistry and crystal size distribution of ash particles. J. Volcanol. Geotherm. Res. 137, 33–54. doi:10.1016/j.jvolgeores.2004.05.011
Taddeucci, J., Scarlato, P., Andronico, D., Ricci, T., Civico, R., Del Bello, E., et al. (2023). The explosive activity of the 2021 tajogaite eruption (La Palma, canary islands, Spain). Geochem. Geophys. Geosystems 24, 1–21. doi:10.1029/2023GC010946
Taddeucci, J., Scarlato, P., Capponi, A., Del Bello, E., Cimarelli, C., Palladino, D. M., et al. (2012). High-speed imaging of strombolian explosions: the ejection velocity of pyroclasts. Geophys. Res. Lett. 39, 1–6. doi:10.1029/2011GL050404
Torres-González, P. A., Luengo-Oroz, N., Lamolda, H., D’Alessandro, W., Albert, H., Iribarren, I., et al. (2020). Unrest signals after 46 years of quiescence at cumbre vieja, La Palma, canary islands. J. Volcanol. Geotherm. Res. 392, 106757. doi:10.1016/j.jvolgeores.2019.106757
Wadge, G. (1981). The variation of magma discharge during basaltic eruptions. J. Volcanol. Geotherm. Res. 11, 139–168.
Keywords: IR camera, thermal photography, strombolian, Hawaiian fountaining, volcanic plume, velocimetry, Cumbre Vieja volcano
Citation: Birnbaum J, Lev E, Hernandez PA, Barrancos J, Padilla GD, Asensio-Ramos M, Calvo D, Rodríguez F, Pérez NM, D’Auria L and Calvari S (2023) Temporal variability of explosive activity at Tajogaite volcano, Cumbre Vieja (Canary Islands), 2021 eruption from ground-based infrared photography and videography. Front. Earth Sci. 11:1193436. doi: 10.3389/feart.2023.1193436
Received: 24 March 2023; Accepted: 29 August 2023;
Published: 12 September 2023.
Edited by:
Roberto Sulpizio, University of Bari Aldo Moro, ItalyReviewed by:
Marie-Noelle Guilbaud, National Autonomous University of Mexico, MexicoRaffaello Cioni, University of Florence, Italy
Copyright © 2023 Birnbaum, Lev, Hernandez, Barrancos, Padilla, Asensio-Ramos, Calvo, Rodríguez, Pérez, D’Auria and Calvari. This is an open-access article distributed under the terms of the Creative Commons Attribution License (CC BY). The use, distribution or reproduction in other forums is permitted, provided the original author(s) and the copyright owner(s) are credited and that the original publication in this journal is cited, in accordance with accepted academic practice. No use, distribution or reproduction is permitted which does not comply with these terms.
*Correspondence: Janine Birnbaum, amFuaW5lYkBsZGVvLmNvbHVtYmlhLmVkdQ==