 Liwei Han1,2
 Ming Chen
- 1School of Water Conservancy, North China University of Water Resources and Electric Power, Zhengzhou, China
- 2Henan Key Laboratory of Water Environment Simulation and Treatment, Zhengzhou, China
Risk analysis of dam slopes is crucial for ensuring the safety and stability of hydraulic engineering. To improve the accuracy and reliability of risk analysis, we adopt the cloud theory approach and conduct a study on the distribution types of soil shear strength indicators based on indoor geotechnical tests. We propose a “cloud model-Monte Carlo” coupling model that uses the cloud model to describe the uncertainty of risk factors and determine the probability distribution types of shear strength parameters, while the Monte Carlo method is used to simulate random variables in the model. The effectiveness of the proposed model is validated through a risk analysis of a slope of an earth-rock dam, with results showing significantly greater accuracy and reliability compared to traditional methods. The calculation results show that the risk probability corresponding to the design flood level of the dam is 9.01×10⁻⁶, exceeding its allowable risk standard of 0.5×10⁻⁶, hence the need for reinforcement treatment. The proposed model can accurately evaluate the risk of dams and provide the scientific basis for decision-making in dam safety management.
1 Introduction
In recent years, with the continuous acceleration of urbanization and the development of engineering construction, geological disasters have posed a serious threat to people’s life and property safety (Tu et al., 2023). Among them, the slope stability problem has been a hot issue of great concern in geological engineering (Wen et al., 2022). In slope control, the soil shear strength parameter is one of the most important parameters for evaluating the safety of slope engineering. To analyze the risk of dam landslides, Monte Carlo simulation is a widely used method for dam slope risk analysis (Lu et al., 2022), which involves generating random samples of uncertain variables and simulating the dam behavior under different scenarios. However, traditional Monte Carlo simulations assume that the uncertain variables follow a specific probability distribution (Chorol and Gupta, 2023). In contrast, cloud modeling is a novel uncertainty modeling approach (Cheng et al., 2022) that captures the stochasticity and ambiguity in uncertain variables. Therefore, we propose a new approach combining cloud models and Monte Carlo simulations to analyze dam landslide risk. Specifically, we use the cloud model for solving uncertainty problems and Monte Carlo simulation for generating stochastic samples and simulating dam behavior.
In previous studies, conventional methods (Rouzéa and Dattaa, 2016; Wang-Wang et al., 2018; Zhang et al., 2022a) have faced uncertainty issues in parameter selection under limited data conditions, leading to the simultaneous fitting of multiple distribution functions. In contrast, cloud theory can address the uncertainty problem in distribution types. Cloud theory was proposed by Professor Li (Li et al., 2009), which can effectively convert quantitative and qualitative information and visualize it through cloud maps (Ma and Zhang, 2020). Among them, the normal cloud model is the most important type of cloud model and has been widely used in prediction, comprehensive evaluation, data mining, intelligent control, and other fields (Liu et al., 2021; Ruan et al., 2021). Cloud theory has also been extensively applied in the assessment field (Chen et al., 2023; Guojiao et al., 2023). Monte Carlo simulation, as a classic random number simulation method, has been extended to various fields such as medicine (Santos et al., 2022), water conservancy (Vihola et al., 2020), and science and technology materials (Wang et al., 2020). Considering the scalability and reliability of cloud models in fuzzy decision-making fields (Mao et al., 2018; Mao et al., 2022; Yang et al., 2023), we developed a “cloud model-Monte Carlo” coupling model to calculate slope failure probability and perform risk assessment.
Risk analysis originated in the United States (Xie and Sun, 2009) and was first applied in nuclear power plant risk assessment. Risk analysis includes identifying potential hazards (Ge et al., 2020a), assessing their likelihood and consequences, and formulating mitigation measures to reduce risks (Wu et al., 2021; Zhang et al., 2022b). In terms of dam safety, hazardous situations include natural disasters such as floods or earthquakes, as well as human errors or equipment malfunctions. The consequences of these hazards can range from property and economic losses to loss of life and environmental degradation (Ge et al., 2020b; Wu et al., 2020; Ge et al., 2022; Zhang et al., 2023). Various methods such as probabilistic risk assessment and quantitative risk analysis (Li et al., 2018; Wang et al., 2022) can be used for risk assessment. These methods involve collecting design, location, and operation data of the dam, as well as external factors such as weather patterns and geological conditions. Based on these data, mathematical models are established to simulate the performance of the dam under different hazardous situations and estimate associated risks (Li et al., 2021; Wang et al., 2023).
In the past few decades, many studies have focused on developing probabilistic methods to analyze slope stability (Cai et al., 2021; Chakraborty and Dey, 2022) and have demonstrated their superiority in risk assessment. However, many factors need to be considered when evaluating slope stability (Raghuvanshi, 2019; Yang et al., 2021), and simple deterministic methods may not satisfy complex practical situations. This article aims to introduce a probabilistic-based method, where we propose a new approach for slope stability analysis based on the “cloud model-Monte Carlo”. We demonstrate the effectiveness of this method by applying it to a case study of earth-rockfill dams. The proposed method provides an assessment of dam landslide risk and can provide a reference for decision-makers to formulate effective risk management strategies.
2 Materials and methods
2.1 Indoor tests
The experimental parameters employed in this study were derived exclusively from indoor geotechnical tests utilizing remolded soil samples. Sampling was conducted within a rectangular area located in the northeast of Tianshuihu, Pingyu County, China, with dimensions of approximately 500 m in length and 150 m in width. According to the geological profile of the region, the geological structure of the Tianshuihu area is characterized by homogeneous cohesive soils, mainly composed of fourth-quaternary loamy soil and clay. To mitigate uncertainties arising from spatial and temporal factors, sampling depth was limited between half a meter to 1 m, with the obtained soil samples being plastic loamy soil. After the sifting of soil samples, direct shear testing was performed, following the specific steps outlined in Figure 1.
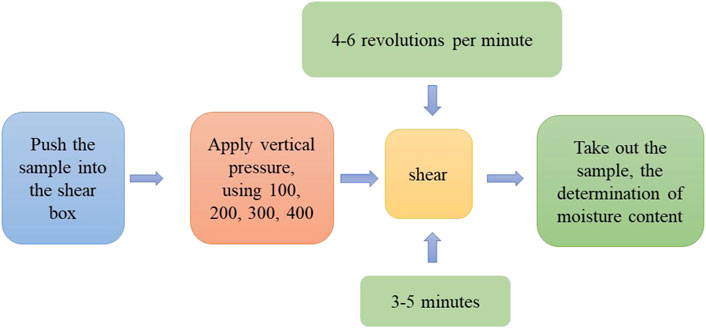
FIGURE 1. Shear test steps.
In this study, 26 sets of powdered clay test data obtained from indoor direct shear tests were selected for the study, including the shear strength index c and the internal friction angle index φ. The specific values are shown in Table 1.
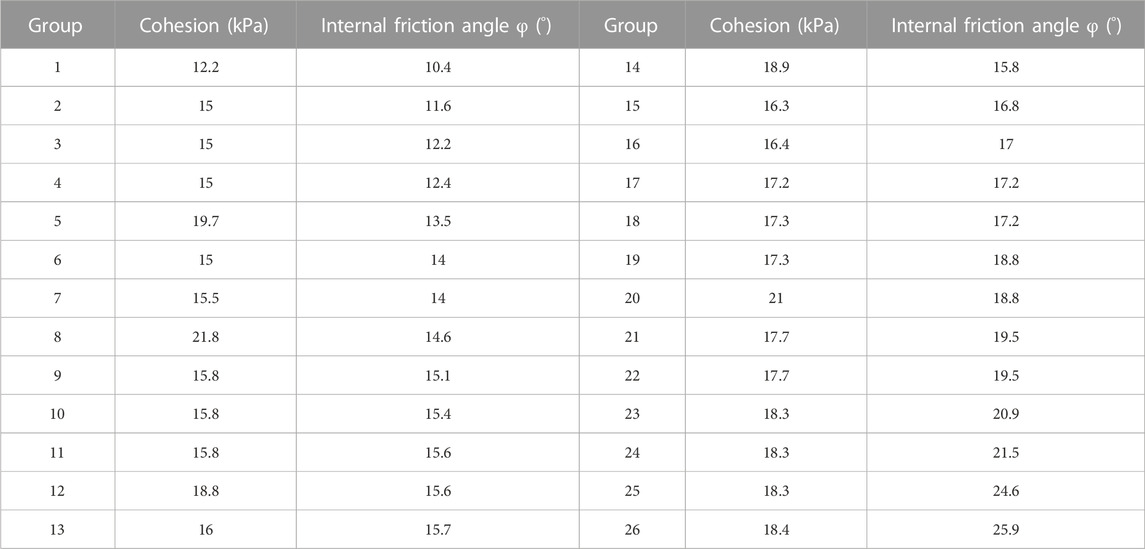
TABLE 1. Record sheet of direct shear test for soil samples (No. 1–26 soil).
2.2 Research overview
The earth-rockfill dam (Yong, 2004) is a rolled clay core wall dam with a maximum dam height of 70 m, a crest width of 12 m, and a base width of 465 m. The normal water level is 185 m, the dead water level is 167 m, the total storage capacity is 1.13 billion m³, and the effective storage capacity is 570 million m³. The upstream slope is from bottom to top at a ratio of 1:4.0, 1:3.5, 1:3.0, 1:2.0, and the downstream slope is from bottom to top at a ratio of 1:4.0, 1:3.0, 1:2.0. Approximately 144 m below the dam base is a thick clay core wall, and the slope is 1:4.0, 1:0.5. Above 144 m, the slope is 1:0.1–1:0.2. The river length above the hub dam site is 120 km, the controlled drainage area is 2,000 square kilometers, the annual average flow rate is 37.8 m³/s, and the annual average runoff volume is 1.2 billion m³. The design flood peak flow rate corresponding to a once-in-a-millennium event is 6,640 m³/s, and the corresponding flood level is 188.1 m. The verification flood peak flow rate corresponding to a once-in-a-ten-thousand-years event is 8,700 m³/s, and the corresponding flood level is 189.5 m.
The analysis object is the unreinforced earth-rockfill dam with an upstream water level of 188.1 m, a downstream water level of 132.0 m, and a dam base elevation of 120.0 m. The non-stochastic mechanical parameters of the dam body are shown in Table 2. In recent years, the reservoir has had many safety hazards: the core wall narrows above the elevation of 144 m, and the slope decreases from the original ratio of 1:0.5 to 1:0.1; starting from an elevation of 150 m, gravelly soil has been used in the core wall, resulting in severe seepage of the dam body, the infiltration line overflows the dam slope, and large-scale mortification occurs on the downstream slope, which affects the stability and safety of the dam body.

TABLE 2. Non-random mechanical parameters of earth and rock dams.
2.3 Model construction
The “cloud theory-Monte Carlo” approach to analyzing the risk of earth and rock dams is shown in Figure 2.
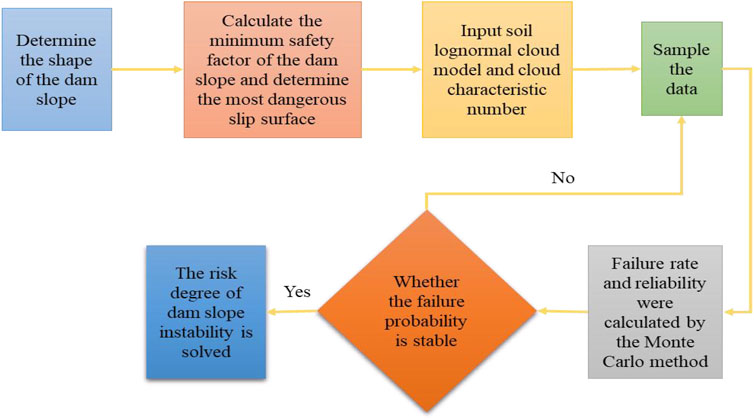
FIGURE 2. Flow chart of the “cloud theory—Monte Carlo” based dam slope instability calculation.
The method proposed in this paper is a cloud model used to determine the type of probability distribution of shear strength parameters. Monte Carlo methods are used to simulate the random variables in the cloud model and to calculate the probability of dam slope failure based on the probability distribution of the random variables.
2.3.1 Basic principles of cloud model
The cloud model, based on fuzzy mathematics and statistical theory, is a powerful tool for describing the randomness and fuzziness between uncertain language and precise numerical values. It has been applied to several uncertain problems and owing to its superiority in handling uncertainty issues, we have incorporated it into our study of inferred soil shear strength distribution indices.
Let U be a quantified domain represented by precise numerical values, and C be a qualitative concept defined on the domain U. If the quantitative value x∈U is a random realization of the qualitative concept C, and satisfies
The cloud model no longer emphasizes precise function representation (Yangping et al., 2019), but instead employs three numerical features to represent the uncertainty of concepts: expectation “Ex”, entropy “En”, and hyper-entropy “He”. “Ex” represents the central position of the concept in the domain and is the value that best represents this qualitative concept. “En” describes the level of discreteness of the qualitative concept, characterizing its randomness and fuzziness. The greater the entropy, the larger the range of acceptable numerical values for the concept, making the concept more macroscopic. “He” is a measure of uncertainty in entropy and is generally determined empirically. According to the 3“En” rule of statistics, the cloud droplets contributing to the concept are typically situated within the interval [Ex-3En, Ex+3En].
2.3.2 Inverse cloud algorithm optimization
The radiation fitting algorithm of the inverse cloud generator is based on the radiative digital characteristics of clouds and their corresponding radiative expectation functions. It expresses the probability distribution characteristics of cloud droplets’ energy radiation over the entire numerical domain space. By following data radiation and improving the inverse cloud generator algorithm based on its fitting, the specific description of the algorithm is as follows:
Input: The coordinates li of each cloud droplet in the numerical domain space along with their respective degree of certainty
Output: The values of Ex, En, and He for the concept, and the number of cloud droplets N.
The estimated value
The cloud droplets with
2.3.3 Cloud model pervasiveness
The geometric shape of the normal cloud has distinct characteristics, with its expectation curve reflecting the shape of the normal cloud. It can be deduced that for any 0<μ≤1, as determined by μ.
As
From
By solving for μ from EX, the expectation curve y of the normal cloud can be obtained.
2.3.4 Calculation of the coefficient of safety for dam slope stability
Because most slope stability analysis problems are super-stationary, SL274-2001(SL274-2001, DAMS, 2002) (Chinese Standards) states that the equations of ultimate equilibrium must be established using the simplified Bishop bar method the Swedish bar method, and the Spencer method.
According to the simplified Bishop’s bar method, the following limiting equation of state is established.
Where,
2.3.5 Calculation of the risk level of the dam slope
2.3.5.1 Calculation of
The number of levels upstream of an earth and rock dam is considered a random variable. Its calculation can be statistically analyzed on a long series of observations of the reservoir water level, which in turn leads to a probability plot of the probability distribution characteristics of the water level. Given a certain water as Zm, the value of
2.3.5.2 Calculation of
According to the previous description,
The specific condition probability density function for the sliding moment L of a dam under a certain water level H, denoted as (l /ℎ) in the formula, is extremely complex, and its solution is very difficult to obtain. Nevertheless, using the Monte Carlo method can yield high results. The solution process for
2.3.6 Coupled “cloud model-Monte Carlo” model for dam slope instability risk analysis
The relationship between the sliding moment S and the anti-slip moment R is a key factor affecting the stability of the dam slope. When S>R, the dam slope becomes unstable, according to which, the following mathematical model of the risk of instability of the slope of an earth and rock dam can be established, setting the functional function as
Where,
Due to the great difficulties in the practical application of the above equation, it is transformed into
The problem of using probabilistic combinations to estimate Pf indirectly exists and can be solved perfectly. Thus, let the joint probability density function of the sliding moment L and the water level upstream of the dam H be
Where, (l/ℎ) is the conditional probability density function of the water level H for the sliding moment L under the given conditions and the probability density function
The probability density function for the sliding moment L of an earth and rock dam slope can be calculated by the full probability density formula, expressed as follows:
Combining Eq. 18 with Eq. 19 yields
If
What about there
where, ℎ1 is the minimum water level specified in the risk of instability calculation for the earth and rock dam slopes and ℎ2 is the maximum water level specified in the risk of instability calculation for the earth and rock dam slopes.
Eq. 23 is the formula for calculating the risk of instability in the slope of an earth and rock dam, but it is very difficult to solve the formula directly by integration. Therefore, in the actual calculation, it is necessary to apply the method of discrete numerical integration to solve it. After dividing the part of the load probability density distribution curve on L≤ℎ2 into N segments, the solution is given by the following equation.
Where,
In the process of slope risk analysis, the shear strength parameter cohesion and the internal friction coefficient
When using the Monte Carlo method of calculation, the cloud distribution of the shear strength parameter is allowed to replace the distribution histogram, and the standard deviation of the factor of safety and the mean of the distribution are obtained from the cloud distribution as in Eqs. 25–(26).
Where, X is the lognormal cloud distribution (its mean is the expectation of the cloud Ex, the standard deviation is the entropy of the cloud En; and the coefficient of variation is Vx; Y = lnx is the normal distribution (mean μY and standard deviation σY);
2.3.7 Steps for calculating the “cloud model—Monte Carlo” model
The “cloud model-Monte Carlo” model used in the calculation process of the failure probability Pf of the earth-rock dam slope can be summarized into several steps.
1) Input each random statistical characteristic and distribution model.
2) The uncertainty cloud model is used to generate cloud drops and sample uncertain quantities such as cohesion c and internal friction angle φ.
3) The random set of uniformly distributed random numbers is generated and the corresponding parameters are generated according to the distribution law of each variable.
4) Generated random numbers and parameters are substituted into the function of the Swedish strip division method for multiple calculations, the number of failures is recorded, and the failure probability Pf is calculated.
5) Solve for the risk of dam slope instability based on the failure probability Pf.
3 Results
3.1 Cloud distribution model for shear strength index
Based on the small sample data, the three numerical features of the shear strength parameter c were derived by the inverse cloud generator, and then the cloud distribution map was obtained by the forward cloud generator (φ values, c values log cloud distribution map of the same analysis path), and the basic parameters of the cloud model are shown in Table 3.

TABLE 3. Basic parameters of the Cloud model.
Through multiple cycles of the forward and reverse cloud generators, 1000 cloud drops were simulated, generating the cloud distribution shown in Figure 3.
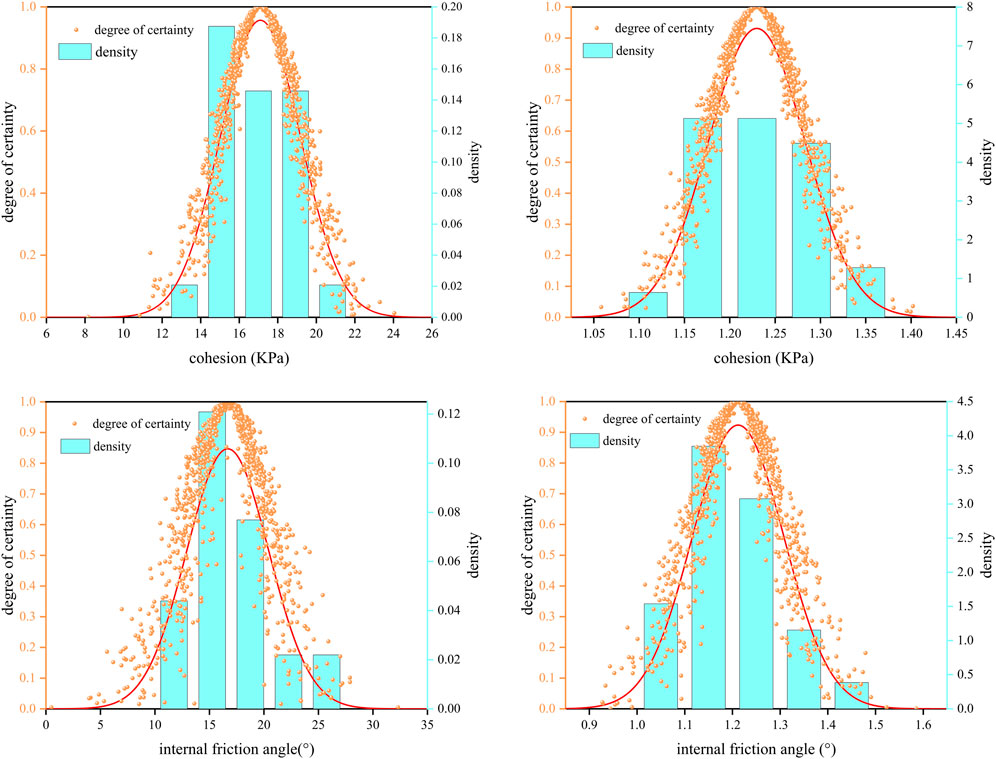
FIGURE 3. Sample parameter cloud distribution.
According to Figure 3, it can be seen that the generalized normal distribution of clouds can effectively model the discrete nature of finite sample data. The cloud droplets generated based on the three characteristic figures are mainly distributed in the intervals [12,22] [0.75,1.75] [12.5,20], and [1.1,1.3], by the ‘3 days′ rule in cloud theory. This indicates that the cohesion and internal friction angles obey both normal and lognormal cloud distributions. In order to determine the optimal probability distribution model for the shear strength index of the soil, a comparison was made. The results show that the tail cloud drops of the lognormal cloud distribution for cohesion and internal friction angle are ‘lighter’ than the normal cloud distribution and that the drops fluctuate less around the desired curve. This indicates that the variability between the sample data is reduced and the data is more concentrated after the logarithmic transformation. The log-transformed coefficient of variation for the soil parameters is calculated to be 0.043, which is much smaller than the untransformed coefficient of 0.121 and is consistent with the inferred results for the cloud distribution. Therefore, the log-normal cloud distribution is considered to be the optimal probability distribution model for cohesion and internal friction angle.
In order to make full use of the sample information without over-relying on the sample data, this study adopts a cloud theory-based method for studying the distribution types of soil shear strength indicators. As can be seen from Figure 3, the thickness of the clouds is not strictly normally distributed but is a generalized normal cloud distribution. In contrast to the distribution histogram and its fitted curve, the pan-normal distribution of clouds describes the uncertainty of finite data by introducing the super entropy He. As shown in Figure 3C, the cloud thickness is large and the cloud droplet distribution is discrete appearing fogged in the internal friction angle cloud distribution plot, indicating a large uncertainty in the sample data for the internal friction angle, a property that is not represented in the histogram of the internal friction angle distribution.
3.2 “Cloud Model-Monte Carlo” based slope stability risk analysis
3.2.1 Cloud simulation of shear strength parameters
The cohesive force c and the coefficient of internal friction f=tanφ of the landslide soil are considered random variables and are assumed to follow a log-normal cloud distribution. After 1000 simulations, the cloud distribution of the coefficient of safety is shown in Figure 4. The expected value Ex and variance En of the safety factor are shown in Table 4.
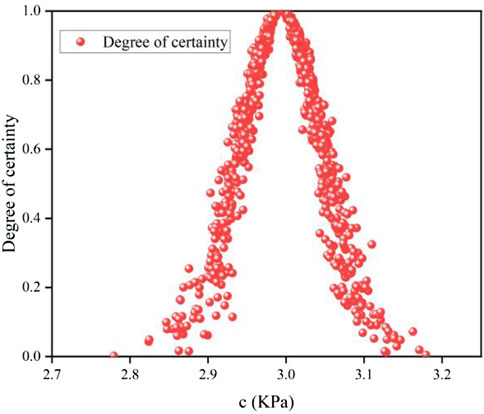
FIGURE 4. Cloud distribution of mean slope calculation results.

TABLE 4. Characteristic values of random mechanical parameters of earth and rock dams.
3.2.2 Determination of the minimum safety factor
3.2.2.1 Calculation assumptions
This calculation assumes a starting elevation of 160 m. The infiltration line of the earth and rock dam body is determined using the finite element method, which is not limited by irregular geometry and inhomogeneous materials, and the calculation results are highly reliable.
3.2.2.2 Calculation method
During the period of steady seepage, the Swedish strip division method was used to carry out the downstream slope stability analysis of the earth and rock dam, and the minimum safety factor and the location of the most dangerous slip surface were obtained through the calculation.
3.2.2.3 Calculation results
The minimum safety factors obtained using the Swedish arc method at each water level, together with the values specified in the code, are shown in Table 5 below.
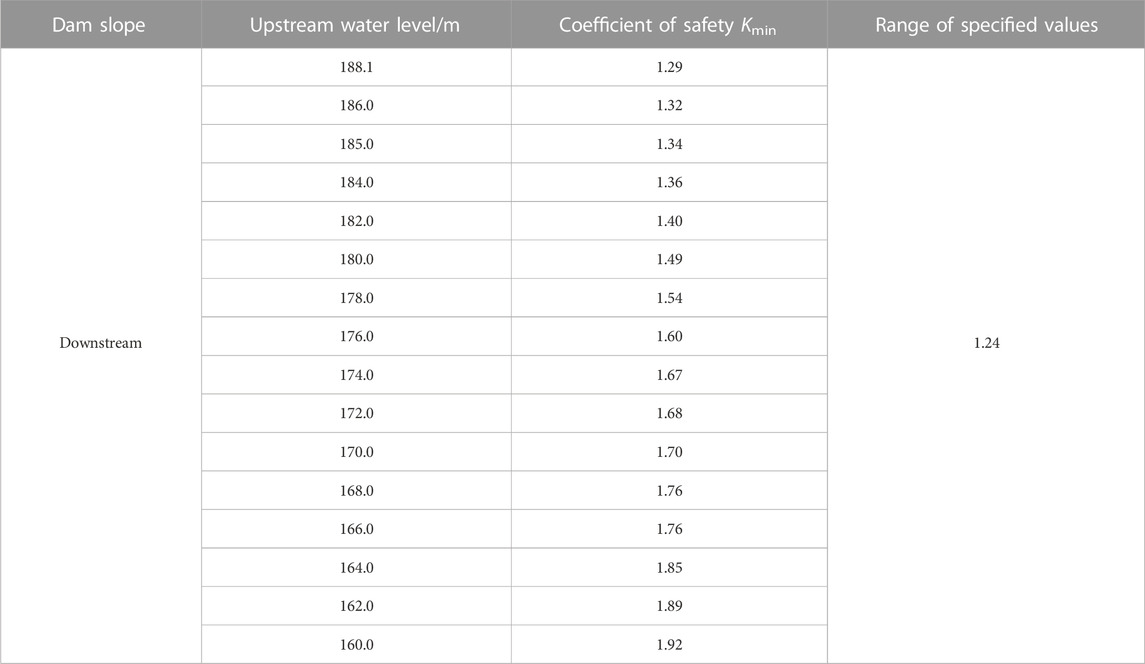
TABLE 5. Calculation of the slope stability factor of safety for the earth and rock dams.
3.2.3 Calculation of slope failure probability
3.2.3.1 Probability of failure
After obtaining the minimum safety coefficient from the slope stability analysis, the calculation was carried out using the Monte Carlo method and the relevant electro-computing procedures. In general, the probability of failure was under 0.1% according to the number of solutions N >
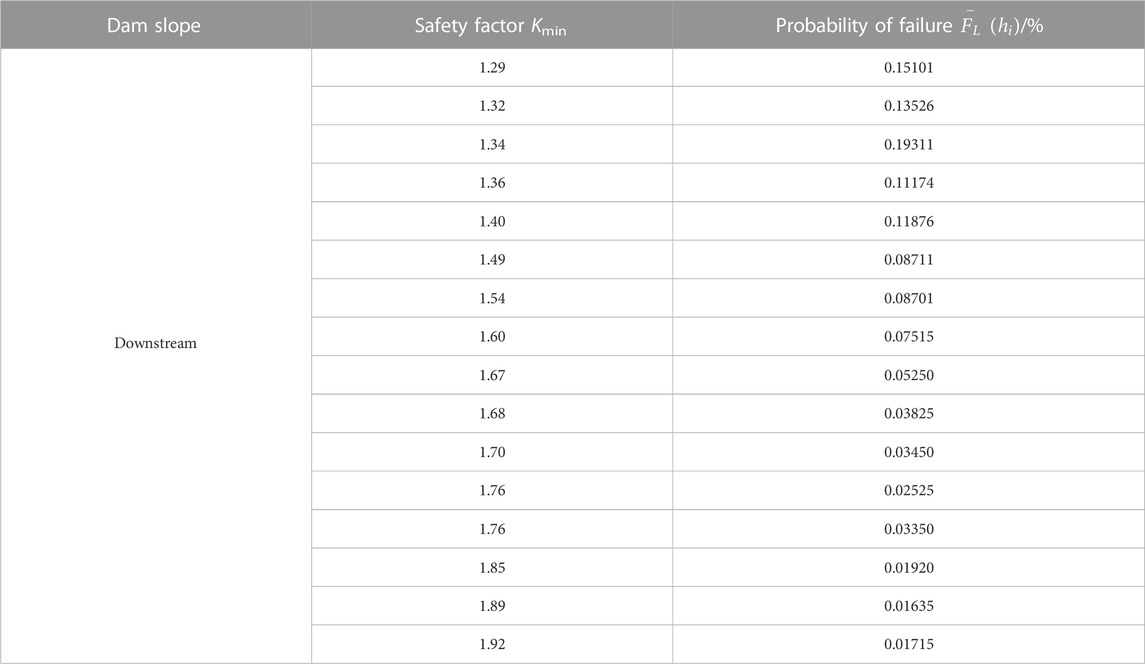
TABLE 6. Calculation of slope failure probability
3.2.3.2 Calculation of the interval frequency
Based on the upstream flood level frequency curve of the earth and rock dam Figure 5, the interval frequency value
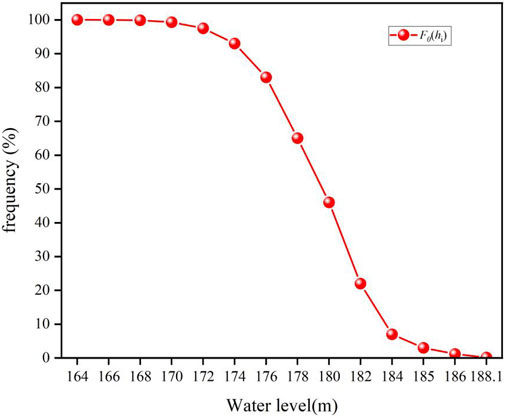
FIGURE 5. Water level frequency graph for earth and rock dams.
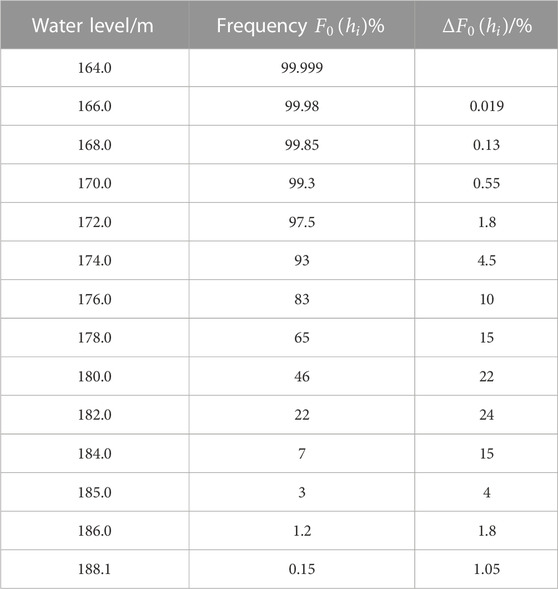
TABLE 7. Flood level frequency relationships upstream of earth and rock dams.
3.2.4 Coupled “cloud Model-Monte Carlo” model for dam slope risk calculation
The degree of risk
The results of the calculation are shown in Table 8.
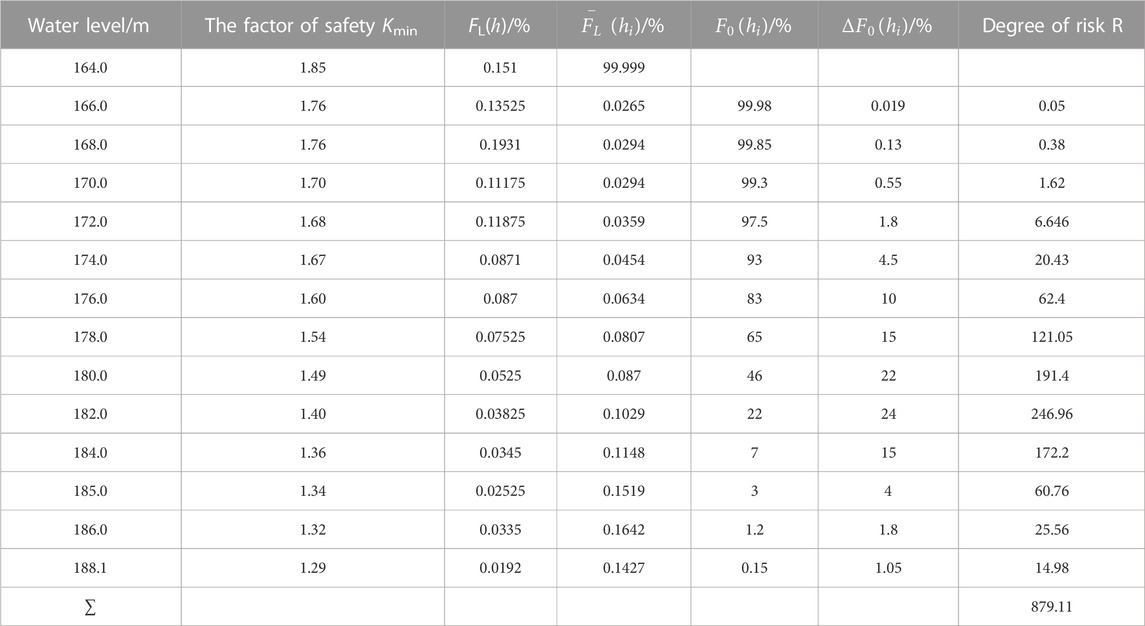
TABLE 8. Calculation of the risk of dam slope instability for earth and rock dams.
For a parameter F that fits the lognormal cloud distribution, let y fit the normal cloud distribution and have
or
Then F can be transformed into a normal cloud distribution.
The following transformation relationship exists between the expectation and entropy of F and y, i.e.,
In the above equation: μY and σY are the standard deviation and mean of y respectively.
The coefficient of variation is obtained from Eqs. 31–(32) as
Since y less than 0 is equivalent to F less than 0, the reliability index β = Exy/Eny not only reflects the probability that Y < 0, but also represents the probability that probability of F < 1. For a normal cloud distribution, the variables y and β alike can be expressed in terms of ExF, EnF.
According to the above equation, for μF= Exy= 3, VF= 9.7%, a review of the data shows that the probability of F > 1 is 99% and can be obtained by the following equation.
The improved risk analysis method based on cloud theory yields a risk level of 879.01
3.2.5 Risk evaluation
In recent years, the main method of risk analysis has been based on parameters following a normal distribution. However, this may lead to negative values for certain parameters, particularly when analyzing slope engineering parameters such as cohesion. This can result in lower reliability as cohesion may have negative values. To address this issue, this paper analyzes parameters following a logarithmic normal cloud distribution, aligning the stability measurement standard of slope instability with the traditional analysis method of functional functions less than zero.
Traditional slope stability analysis uses deterministic models to obtain the safety factor F. However, risk analysis based on cloud theory uses two indicators, the expectation Ep and entropy En, to determine the failure probability of the slope by analyzing the variability characteristics of influencing factors, which is more reasonable. Studies have shown that the probability of dam collapse due to landslides in earth-rock dams is on the order of 10−5 per dam per year, therefore, we set the landslide probability of earth-rock dams at 10−5 per dam per year. Taking into account the safety factors, the statistical probability of landslides for each dam per year is set at 1×10⁻⁵. Therefore, the safety reliability of earth-rock dams against landslides is above 99.999%.
However, determining the value of landslide risk for earth-rock dams is influenced by many factors. The process of determining risk standards requires repeated weighing between economic benefits, political risks, environmental assessments, and dam safety. Referring to relevant risk standards, this paper sets the allowable landslide risk standard at 0.5×10⁻⁶, resulting in a safety reliability indicator of over 99.9995.
The calculation results show that the risk probability corresponding to the design flood level of the dam is 9.01×10⁻⁶, exceeding the allowable risk standard of 0.5×10⁻⁶, thus reinforcement treatment is necessary.
4 Discussion
This study proposes a “cloud model-Monte Carlo” coupling model and applies it to evaluate the risk of specific earth-rock dam landslides. The results show that the proposed model is effective in analyzing the risk of dam slope failure and provides a comprehensive assessment of potential risks related to the dam. The cloud model is used to determine the probability distribution type of uncertain shear strength parameters. Then, the Monte Carlo method is used to generate a large number of random samples based on the cloud model for simulating the probability of dam slope failure. In addition, the results of the risk assessment indicate that under normal conditions, the risk of dam slope failure is relatively low, but it significantly increases under extreme weather conditions (such as heavy rain). This suggests the need to take appropriate measures to reduce the risk of dam slope failure under extreme weather conditions, such as strengthening the dam structure or implementing emergency response plans.
Overall, the cloud model-Monte Carlo coupling model provides an effective approach for evaluating the risk of dam slope failure. The results of this study can provide valuable information to dam managers and decision-makers to make informed decisions under different weather conditions and ensure dam safety.
5 Conclusion
Firstly, this paper employs a research method based on cloud theory to study the distribution types of soil shear strength indicators. The optimal probability distribution model for cohesion and internal friction angle is found to be the logarithmic normal cloud distribution. Moreover, we propose a “cloud model-Monte Carlo” coupling model, which can effectively evaluate the risk of dam landslides. The cloud model can handle the uncertainty of shear strength parameters and determine their probability distribution models. The Monte Carlo method can simulate the random behavior of input variables and calculate the probability of output variables. The combination of these two methods can provide more accurate risk assessment results. In slope risk analysis, the “cloud theory-Monte Carlo” model can calculate failure probability and risk degree more accurately and reliably compared to traditional methods.
Secondly, referring to relevant risk standards, this paper sets the allowable landslide risk standard for earth-rock dams at 0.5×10⁻⁶, with a safety reliability indicator of over 99.9995%. The calculation results show that the risk probability corresponding to the design flood level of the dam is 9.01×10⁻⁶, exceeding the allowable risk standard. Therefore, it is necessary to reinforce the earth-rock dam to reduce the risk of failure.
Finally, the proposed cloud model-Monte Carlo coupling model has broad application prospects in the field of dam risk assessment. It can be used to analyze the risks of various types of dams and provide accurate risk assessment results. In future research, the model can be further improved to enhance its accuracy and applicability, while being more widely applied and validated.
Data availability statement
The raw data supporting the conclusion of this article will be made available by the authors, without undue reservation.
Author contributions
Method: MC; Experiment: MC, JS, LM, and WJ; Data analysis: MC and ZS; Prepare the original manuscript: MC; Writing, reviewing and editing: MC and LH; Fund buy-out, LH; Guidance: LH and HZ
Funding
This work was supported by North China University of Water Resources and Electric Power and the National Natural Science Foundation of China (51509091).
Conflict of interest
The authors declare that the research was conducted in the absence of any commercial or financial relationships that could be construed as a potential conflict of interest.
Publisher’s note
All claims expressed in this article are solely those of the authors and do not necessarily represent those of their affiliated organizations, or those of the publisher, the editors and the reviewers. Any product that may be evaluated in this article, or claim that may be made by its manufacturer, is not guaranteed or endorsed by the publisher.
References
Cai, J.-S., Yeh, T.-C. J., Yan, E.-C., Tang, R.-X., and Hao, Y.-H. (2021). Design of borehole deployments for slope stability analysis based on a probabilistic approach. Comput. Geotechnics 133, 103909. doi:10.1016/j.compgeo.2020.103909
Chakraborty, R., and Dey, A. (2022). Probabilistic slope stability analysis: State-of-the-art review and future prospects. Innov. Infrastruct. Solutions 7, 177. doi:10.1007/s41062-022-00784-1
Chen, H., Guo, Q., Wang, L., and Meng, X. (2023). Evaluation of slope stability within the influence of mining based on combined weighting and finite cloud model. Energy Explor. Exploitation 41, 636–655. doi:10.1177/01445987221134638
Cheng, W., Dong, F., Tang, R., Yin, H., Shi, L., Zhai, Y., et al. (2022). Improved combination weighted prediction model of aquifer water abundance based on a cloud model. ACS Omega 7, 35840–35850. doi:10.1021/acsomega.2c04162
Chorol, L., and Gupta, S. K. (2023). Evaluation of groundwater heavy metal pollution index through analytical hierarchy process and its health risk assessment via Monte Carlo simulation. Process Saf. Environ. Prot. 170, 855–864. doi:10.1016/j.psep.2022.12.063
DAMS (2002). Code for Design of rolled earth-rock DAMS. Beijing: Survey and Design Institute of Yellow River Water Conservancy Commission.
Ge, W., Jiao, Y., Wu, M., Li, Z., Wang, T., Li, W., et al. (2022). Estimating loss of life caused by dam breaches based on the simulation of floods routing and evacuation potential of population at risk. J. Hydrology 612, 128059. doi:10.1016/j.jhydrol.2022.128059
Ge, W., Li, Z., Li, W., Wu, M., Li, J., and Pan, Y. (2020a). Risk evaluation of dam-break environmental impacts based on the set pair analysis and cloud model. Nat. Hazards 104, 1641–1653. doi:10.1007/s11069-020-04237-9
Ge, W., Qin, Y., Li, Z., Zhang, H., Gao, W., Guo, X., et al. (2020b). An innovative methodology for establishing societal life risk criteria for dams: A case study to reservoir dam failure events in China. Int. J. disaster risk Reduct. 49, 101663. doi:10.1016/j.ijdrr.2020.101663
Guojiao, L., Baohui, M., and Lehao, W. (2023). Water quality assessment of wenyu river with variable weight cloud model. Nat. Environ. Pollut. Technol. 22, 63–72. doi:10.46488/NEPT.2023.v22i01.005
Li, D., Liu, C., and Gan, W. (2009). A new cognitive model: Cloud model. Int. J. intelligent Syst. 24, 357–375. doi:10.1002/int.20340
Li, Z., Li, W., and Ge, W. (2018). Weight analysis of influencing factors of dam break risk consequences. Nat. Hazards Earth Syst. Sci. 18, 3355–3362. doi:10.5194/nhess-18-3355-2018
Li, Z., Zhang, Y., Wang, J., Ge, W., Li, W., Song, H., et al. (2021). Impact evaluation of geomorphic changes caused by extreme floods on inundation area considering geomorphic variations and land use types. Sci. Total Environ. 754, 142424. doi:10.1016/j.scitotenv.2020.142424
Liu, J., Shi, H., Wang, R., Si, Y., Wei, D., and Wang, Y. (2021). Quantitative risk assessment for deep tunnel failure based on normal cloud model: A case study at the ASHELE copper mine, China. Appl. Sci. 11, 5208. doi:10.3390/app11115208
Lu, X., Chen, C., Li, Z., Chen, J., Pei, L., and He, K. (2022). Bayesian network safety risk analysis for the dam–foundation system using Monte Carlo simulation. Appl. Soft Comput. 126, 109229. doi:10.1016/j.asoc.2022.109229
Ma, Z., and Zhang, S. (2020). Risk-based multi-attribute decision-making for normal cloud model considering pre-evaluation information. IEEE Access 8, 153891–153904. doi:10.1109/ACCESS.2020.3018153
Mao, X.-B., Hu, S.-S., Dong, J.-Y., Wan, S.-P., and Xu, G.-L. (2018). Multi-attribute group decision making based on cloud aggregation operators under interval-valued hesitant fuzzy linguistic environment. Int. J. Fuzzy Syst. 20, 2273–2300. doi:10.1007/s40815-018-0495-2
Mao, X., Wu, H., and Wan, S. (2022). A personalized comprehensive cloud-based method for heterogeneous MAGDM and application in COVID-19. CMES-Computer Model. Eng. Sci. 131, 1751–1792. doi:10.32604/cmes.2022.019501
Raghuvanshi, T. K. (2019). Governing factors influence on rock slope stability–Statistical analysis for plane mode of failure. J. King Saud University-Science. 31, 1254–1263. doi:10.1016/j.jksus.2019.01.002
Rouzéa, C., and Dattaa, N. (2016). Analysis of finite sample size quantum hypothesis testing via martingale concentration inequalities. arXiv preprint arXiv:1612.01464.
Ruan, D., Bian, J., Wang, Q., Wu, J., Yu, Y., and Gu, Z. (2021). Application of modified cloud model-level eigenvalue method in water quality evaluation. J. Hydrology 603, 126980. doi:10.1016/j.jhydrol.2021.126980
Santos, C. J., De Almeida Ribeiro, M. C., Santos, W. S., Belinato, W., Neves, L. P., and Perini, A. P. (2022). Medical and occupational dosimetry during interventional pediatric cardiology procedures: A Monte Carlo approach. Phys. Medica Eur. J. Med. Phys. 104, S28. doi:10.1016/S1120-1797(22)02179-2
Tu, K., Ye, S., Zou, J., Hua, C., and Guo, J. (2023). InSAR displacement with high-resolution optical remote sensing for the early detection and deformation analysis of active landslides in the upper yellow river. Water 15, 769. doi:10.3390/w15040769
Vihola, M., Helske, J., and Franks, J. (2020). Importance sampling type estimators based on approximate marginal Markov chain Monte Carlo. Scand. J. Statistics 47, 1339–1376. doi:10.1111/sjos.12492
Wang, D., Xu, C., Yuan, P., and Huang, D. (2020). A revised Monte Carlo method for target location with uav. J. Intelligent Robotic Syst. 97, 373–386. doi:10.1007/s10846-019-01011-3
Wang, T., Li, Z., Ge, W., Zhang, H., Zhang, Y., Sun, H., et al. (2023). Risk consequence assessment of dam breach in cascade reservoirs considering risk transmission and superposition. Energy 265, 126315. doi:10.1016/j.energy.2022.126315
Wang, T., Li, Z., Ge, W., Zhang, Y., Jiao, Y., Sun, H., et al. (2022). Calculation of dam risk probability of cascade reservoirs considering risk transmission and superposition. J. Hydrology 609, 127768. doi:10.1016/j.jhydrol.2022.127768
Wang-Wang, C., Dian-Qing, L., Xiao-Song, T., and Zi-Jun, C. (2018). Probability distribution of shear strength parameters using maximum entropy principle for slope reliability analysis. Rock Soil Mech. 39, 1469–1478. doi:10.16285/j.rsm.2016.1062
Wen, T., Hu, Z., and Tang, H. (2022). The field survey and deformation characteristics of exit slope of Qingshuigou tunnel in the southwest of China. Arabian J. Geosciences 15, 1096. doi:10.1007/s12517-022-10327-8
Wu, M., Ge, W., Wu, Z., Guo, X., Di, D., and Huang, S. (2020). Evaluation of the benefits of urban water resource utilization based on the catastrophe and emergy methods. Water Resour. Manag. 34, 1843–1853. doi:10.1007/s11269-020-02530-7
Wu, M., Wu, Z., Ge, W., Wang, H., Shen, Y., and Jiang, M. (2021). Identification of sensitivity indicators of urban rainstorm flood disasters: A case study in China. J. Hydrology 599, 126393. doi:10.1016/j.jhydrol.2021.126393
Xie, J., and Sun, D. (2009). Statistics of dam failures in China and analysis on failure causations. Water Resour. Hydropower Eng. 40, 124–128.
Yang, L., Chen, Y., Lu, H., Qiao, Y., Peng, H., He, P., et al. (2023). Cloud model driven assessment of interregional water ecological carrying capacity and analysis of its spatial-temporal collaborative relation. J. Clean. Prod. 384, 135562. doi:10.1016/j.jclepro.2022.135562
Yang, X., Hao, Z., Ma, G., and Li, G. (2021). Research on slope stability evaluation based on improved set pair analysis method: A case of tonglvshan open-pit mine. Shock Vib. 2021, 1–16. doi:10.1155/2021/6713581
Yangping, G., Wangyong, L., Lingling, W., and Linzhi, C. (2019). Parameter estimation of cloud model based on bayesian theory. Statistics Decis. 6.
Yaowu, Y., and Dongwei, C. (1994). Analysis of stability and reliability of soil slope. Chin. J. Geotechnical Eng. 16, 80–87.
Yong, M. R. (2004). Risk analysis methods and applications for earth and rock dams. Beijing: Science Press.
Zhang, H., Ge, W., Zhang, Y., Li, Z., Li, W., Zhu, J., et al. (2023). Risk management decision of reservoir dams based on the improved life quality index. Water Resour. Manag. 37, 1223–1239. doi:10.1007/s11269-023-03426-y
Zhang, M., Jin-Yong, L., and Jia-Xuan, M. (2006). Reliability analysis and design of slope stability of earth-rock dam. J. Hydroelectr. Eng. 25, 103–107.
Zhang, Y., Li, Z., Ge, W., Wang, J., Guo, X., Wang, T., et al. (2022b). Assessment of the impact of floods on terrestrial plant biodiversity. J. Clean. Prod. 339, 130722. doi:10.1016/j.jclepro.2022.130722
Keywords: shear strength index, probability distribution type, cloud theory, earth and rock dams, risk analysis
Citation: Han L, Chen M, Sun Z, Si J, Ma L, Ji W and Zhang H (2023) Stability analysis of slopes based on cloud model-Monte Carlo coupling. Front. Earth Sci. 11:1196677. doi: 10.3389/feart.2023.1196677
Received: 30 March 2023; Accepted: 25 April 2023;
Published: 10 May 2023.
Edited by:
Wei Ge, Zhengzhou University, ChinaReviewed by:
Wei Li, Zhengzhou Railway Vocational and Technical College, ChinaXiangdong He, Henan Provincial Water Conservancy Research Institute, China
Copyright © 2023 Han, Chen, Sun, Si, Ma, Ji and Zhang. This is an open-access article distributed under the terms of the Creative Commons Attribution License (CC BY). The use, distribution or reproduction in other forums is permitted, provided the original author(s) and the copyright owner(s) are credited and that the original publication in this journal is cited, in accordance with accepted academic practice. No use, distribution or reproduction is permitted which does not comply with these terms.
*Correspondence: Ming Chen, Y2hlbm1pbmcyMDIyMDVAMTI2LmNvbQ==