 Junfeng Chen
 Jiameng Ren
 Erqing Wang1
- 1College of Water Resources and Engineering, Taiyuan University of Technology, Taiyuan, China
- 2Taigu Water Balance Experimental Field, Hydrology and Water Resources Survey Station of Shanxi Province, Taigu, China
To reveal the effect of interlayer on the temperature of freeze-thaw soil and the transformation between phreatic water and soil water in shallow groundwater areas, a freeze-thaw test was conducted with a groundwater table depth of 0.5 m under laboratory freeze-thaw action. The soil temperature and the transformation between phreatic water and soil water of sand columns under constant freezing temperature at −20°C lasted for 20 days, and the thawing process lasted for 15 days were monitored. The interlayers with a particle size of 0.1–0.5 mm (d50 = 0.3 mm) and a thickness of 5 cm were set at 5, 15, 20, and 25 cm away from the surface and these sand columns were marked as D5, D15, D20, and D25, which were compared with a homogeneous sand column (Ch) with a particle size of 0.5–1.5 mm (d50 = 1.0 mm). The results showed that the fine particle interlayer had thermal insulation on the soil profile and that it effectively inhibited upward migration of phreatic water to soil water during the freezing process. A sand column that had a near-surface interlayer had a better thermal insulation, a stronger inhibition effect on upward migration amount of phreatic water to soil water (UMA) and a larger cumulative downward movement amount of soil water to phreatic water (DMA). The cumulative UMA of D5, D15, D20, and D25 was 61%–84% of Ch during the freezing stage, and the cumulative DMA of D5, D15, D20, and D25 was 29%–57% of Ch during the thawing stage. The inefficient loss of groundwater increased exponentially with the depth of interlayer, the sand column with an interlayer that was farther away from the surface consumed more groundwater and stored more water in the unsaturated zone, and its DMA reached almost zero earlier. These research results were significant for the scientific evaluation of water resources in shallow groundwater areas.
1 Introduction
Permafrost covers most of the planet’s high latitudes and elevations, with 50% of the permafrost exposed in the Northern Hemisphere. Seasonal frozen soil areas are distributed widely throughout China, accounting for about 70% of the total land area. Most areas of seasonally frozen soil have cold and dry climates and poor water resources (Liu et al., 2020). The soil in frozen areas undergoes a complex freezing and thawing process in the winter and spring, including a series of physical and chemical activities, such as water migration, temperature change, salt movement, and a three-phase change of water (Hansson et al., 2004; Min et al., 2022). The transformation between phreatic water and soil water in the shallow groundwater zone, however, often is accompanied by complex changes, which aggravate soil salinization and affect the accurate evaluation of water resources in arid areas (Hou et al., 2020). Thus, it is necessary to study the transformation law between phreatic water and soil water under freeze-thaw action to inhibit soil evaporation, prevent soil salinization, and protect groundwater resources in shallow groundwater areas.
Freeze-thaw cycles affect the water and heat transport of soil, which is an important dynamic change process in the land surface (Zhang and Sun, 2010; Kozlowski and Nartowska, 2013). This process changes the mechanical properties of soils and it has had a significant impact on many practical engineering and agricultural applications, such as frost heave damage and thaw-water infiltration of high-speed railway embankments (Kelleners et al., 2016; Zhang et al., 2021; Zhang et al., 2022). The permeability of frozen soil varies with changes in soil temperature, soil moisture, and soil structure, which play a decisive role in the formation, migration, and distribution of groundwater (Quinton et al., 2005; Quinton et al., 2009). Temperature change is an important factor leading to soil moisture phase changes and soil-water potential changes (Horel et al., 2022), and it is a major driver affecting the soil moisture movement in the soil freeze-thaw cycle (Wang et al., 2018). Soil temperature and air temperature have a synchronous change pattern under the freeze-thaw action (Zhang et al., 2020a; Chou and Wang, 2021). External environmental changes have had a greater impact on surface soil water content. The variation in soil water content with temperature obeys Gaussian distribution in the freeze-thaw stage (Zhao et al., 2019). Soil water is redistributed by the movement of unfrozen water, that is, driven by the gradient of soil-water potential, and water migrates from the unfrozen area to the frozen front, which then has a direct impact on vegetation growth (Li et al., 2013; Xiao et al., 2019; Zheng et al., 2021). Mutual replenishment of soil water and phreatic water has different transformation characteristics in different periods (Carretero et al., 2021). In seasonal frozen soil areas, phreatic water evaporation recharges soil water and, alternately, soil water infiltration recharges phreatic water (Chen et al., 2018a). Frozen soil may promote or hinder groundwater recharge and discharge (White et al., 2007; Evans et al., 2015; Walvoord and Kurylyk, 2016). A warm climate can promote the thawing of frozen soil and increase the permeability of the aquifer. To date, many scholars have conducted relevant studies on water-heat transport in soil and groundwater recharge during the freeze-thaw process using different test methods. Researchers have used various models to simulate and monitor the freezing and thawing process of soil and have quantitatively calculated the transformation of soil water and groundwater using numerical simulation methods. The steady-state solution is a common method used for quantitative replenishment (Abdulrazzak and Morel-Seytoux, 1983; Freyberg, 1983). Study areas have been located in Russia, the United States, Chile, and China (Bo et al., 2021). The dynamic changes in groundwater transport in these cold regions add many uncertainties to future water resource planning.
Sandy interlayer structures are common in the field soil profile because of external forces, such as wind and sand, hydrology, and geology (Xue et al., 2020). In layered soil, the movement of moisture is closely related to the nature, thickness, texture, soil-layer order and groundwater table depth of the soil layer (Pillai et al., 2009; Shokri et al., 2010; Li et al., 2014; Hu et al., 2022; Wu et al., 2022). At the interface of different soil layers, the hydraulic characteristics of soil are discontinuous, which leads to the difference of hydraulic characteristics between homogeneous soil and heterogeneous soil. At present, infiltration and evaporation tests have been used to study the water movement of the layered soil. The results showed that, the interlayer structure will change the infiltration performance and distribution of soil water, which has an important influence on soil infiltration characteristics (Assouline, 2013). The interlayer had an inhibitory effect on water infiltration, and this inhibitory effect increased with an increase in soil porosity. The deeper an interlayer was, the more obvious the change in the infiltration rate was (Miller and Gardner, 1962; Chen et al., 2019). Related studies, however, have also shown that an interlayer with a higher matric suction can promote soil water infiltration (Wang et al., 2014). The existence of an interlayer made the wetting front of water infiltration unstable (Liu et al., 2019). Some scholars also have used the HYDRUS model to study the best anti-seepage method under different interlayer positions, thicknesses, and gradations. The results of these studies have shown that the water-blocking and salt-insulating effect of the interlayer increased with an increase in the thickness of the interlayer, the rise of the interlayer position, and the deterioration of the gradation (Li et al., 2014; Gallo et al., 2022). Compared with homogeneous soil, a sand interlayer can inhibited water evaporation (Li et al., 2014; Gallo et al., 2022), and the cumulative evaporation was significantly lower than that of homogeneous soil regardless of the thickness and particle size of the interlayer (Diaz et al., 2005). Soil evaporation capacity was affected by the texture and thickness of the upper covering soil. In general, the coarser soil particle size and larger thickness effectively inhibited soil evaporation (Modaihsh et al., 1985). The upper coarse and lower fine soil better inhibited soil evaporation, whereas the upper fine soil and the lower coarse soil had little effect on the inhibition of evaporation (Willis, 1960). The interlayer sand column with surface silt had a higher evaporation rate and cumulative evaporation (Huang et al., 2013). Layered soil holds more water than homogeneous soil due to capillary resistance and hydraulic hindrance after undergoing the entire freeze-thaw cycle process (Li et al., 2014). The remaining water in the soil can improve the water availability of plants on the one hand, and may also lead to salinization and other environmental problems.
Understanding the transport of water and heat in freeze-thaw soil is relevant to the assessment and utilization of frozen area water resources (Sun et al., 2011; Wu et al., 2018). Because of the complexity of hydrodynamics and soil dynamics in heterogeneous porous media, early studies were mostly carried out on the hypothesis that the soil was homogeneous. Furthermore, most published articles on heterogeneous soils explored the effects of the thickness (Wu et al., 2022), texture (Chen et al., 2022), particle size (Wang et al., 2014) and soil configuration of the interlayer (Wang et al., 2020) on soil evaporation and infiltration processes, but the effect of interlayer position in the vertical direction on the phreatic transformation is not clarified. Else, most of the research on the sand layer was based on non-freeze-thaw soil, and there is a lack of research on the influence of interlayer on the transformation law between phreatic water and soil water under the condition of shallow groundwater in frozen soil area. Our study can provide a theoretical basis for this direction, which has important guiding significance for the prevention and control of soil salinization in shallow groundwater areas and the scientific evaluation of groundwater resources. In this study, the transformation between phreatic water and soil water with different interlayer positions were conducted by artificially controlling the freeze-thaw temperature in the laboratory. The objectives of this study were to 1) analyze the effects of interlayer positions on the soil temperature with shallow groundwater under freeze-thaw action; 2) investigate the effects of the interlayer on the transformation between phreatic water and soil water during the freeze-thaw process; and 3) reveal the influence mechanism of interlayer on the consumption of phreatic water.
2 Materials and methods
2.1 Laboratory device
The freeze-thaw laboratory device included a refrigeration unit, sand column, insulation device, constant head water-supply system with a Mariotte bottle, seepage bottle, thermistor temperature collector, and air temperature and humidity monitoring system, as shown in Figure 1.
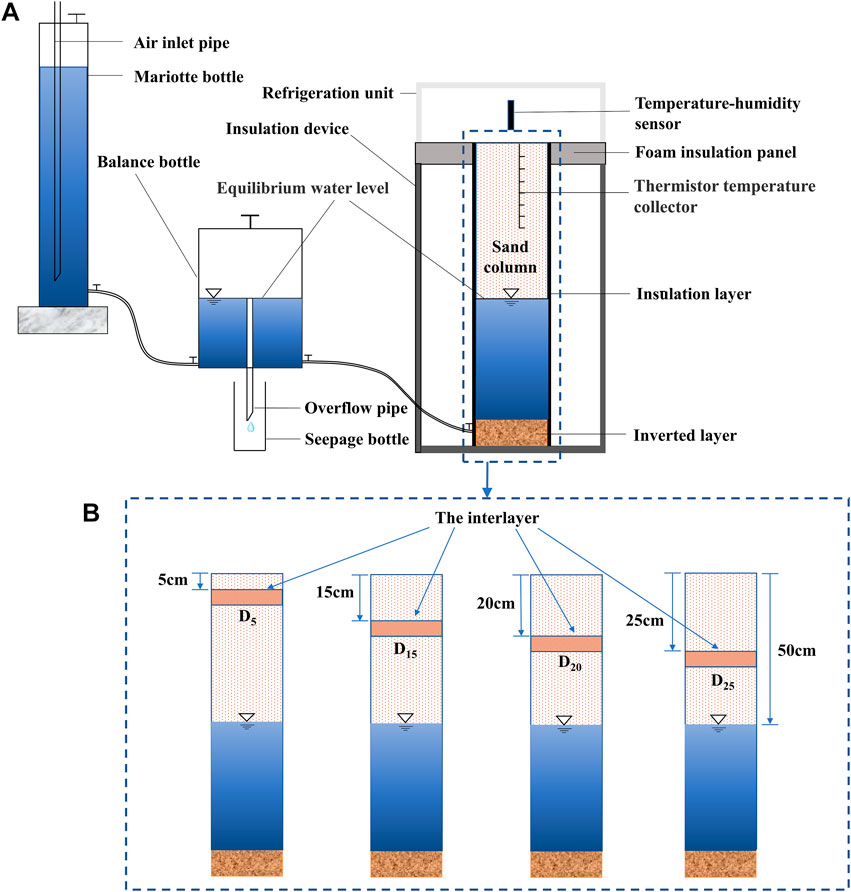
FIGURE 1. The laboratory device for the freeze-thaw test at a constant groundwater level. (A) The schematic diagram of the test device; (B) sand columns with different interlayer position.
The refrigeration unit was a digital control refrigerator (Haier BC/BD-338A) with a length of 140 cm, a width of 60 cm, and a height of 80 cm. The minimum refrigeration temperature was −40°C, which could be controlled by controlling the display panel. The temperature control accuracy was 0.1°C. The sand column was made of hard organic glass with an inner diameter of 15 cm and a height of 110 cm. To prevent the heat exchange between the sand column and the insulation device, a polyester thermal insulation film with a thickness of about 25 mm was wrapped around the outside of the sand column. The sand column was left with a water intake at the bottom, which was connected to the water replenishment device through a hose. The insulation device was constructed of a polyvinyl chloride (PVC) sheet filled with a thickness of 3 cm polyurethane in the middle, with a thickness of 5 cm, a length of 140 cm, a width of 60 cm, and a height of 100 cm. The foam board was added between the insulation device and the refrigeration unit to ensure unidirectional freezing, and the contact gap between the refrigeration unit and the insulation device was sealed. The constant water-level supply system included a Mariotte bottle (with a diameter of 8 cm and a height of 90 cm) and a balance bottle (with a diameter of 15 cm and a height of 40 cm) connected by a hose. The balance bottle was connected to the bottom of the test sand column with a hose. The seepage bottles were 250 and 500 ml graduated cylinders with an accuracy of 2 ml. The thermistor temperature collectors were multichannel data collectors, and the input signal included 32 channels, with an accuracy of 0.2 s per channel.
2.2 Laboratory design and monitoring methods
2.2.1 Laboratory design
Two kind of particle sizes of sand were selected by screening machine, which were 0.5–1.5 mm and 0.1–0.5 mm. The particle size of the homogeneous sand column was 0.5–1.5 mm, which was marked as Ch. The bottom of each sand column was filled with quartz sand with a thickness of 10 cm as the filter layer. The top of the filter layer was covered with a filter to prevent the valve from being clogged by fine soil particles in the sand column. The sand column was uniformly filled according to the bulk density of 1.5 g cm−3 and then was connected with a constant water-level supply system with a groundwater table depth of 0.5 m. The valve was opened after 72 h and the sand column was rehydrated from bottom to top with a balance bottle for 7 days at room temperature. Then the surface was freezing at a constant temperature. When the decrease of sand column temperature and Mariotte bottle recharge to the sand column reached almost zero, it began to thaw at room temperature until the recharge to the seepage bottle reached zero. The specific test scheme was as follows:
The sand column surface was freezing by the refrigeration equipment at a constant temperature of −20°C. The constant temperature freezing process lasted for 20 days, and the thawing process lasted for 15 days. Interlayers with a particle size of 0.1–0.5 mm and a thickness of 5 cm were set at 5, 15, 20, and 25 cm away from the surface and these sand columns were marked as D5, D15, D20, and D25, respectively. The specific test schemes and setting of sand columns are shown in Table 1.
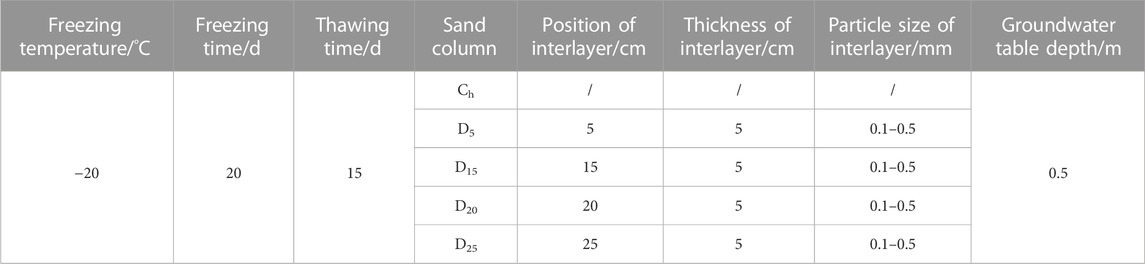
TABLE 1. Test schemes and setting of sand columns.
2.2.2 Data monitoring
The freezing temperature and relative humidity were collected by the environmental monitor (Cos-03-0 USB), and the storage capacity was 2.08 million. The data were exported through the USB recorder data management system. The frequency of data collection for this test was 1 h.
The sand column temperature monitoring used a multichannel collector (32 channels of input signal) to collect thermistor values that were preburied in the sand column at 5, 10, 15, 20, 25, 30, 40, and 50 cm, and the resistance values (the error is less than 0.5 Ω) were automatically converted to temperature using a built-in formula. The frequency of monitoring was every 2 h. The conversion relationship between thermistor value and soil temperature is:
where Rx was real-time measured resistance value, Ω; R25 was the resistance value when the temperature was 25°C, Ω; B was a constant value given as 3950; T was the soil temperature, °C.
The upward migration amount of phreatic water to soil water (UMA) was obtained by converting the relationship between the falling height of water in the Mariotte bottle and the cross-sectional area of the sand column to obtain the rising height of water in the sand column. The scale accuracy was 0.1 mm, and the monitoring frequency was every 2 h. The transformation relation is as follows:
where
During the thawing process, the downward movement amount of soil water to phreatic water was measured by the seepage bottle (accuracy was 2 ml). We converted the amount of water in the seepage bottle to the falling height of the water in the sand column. The monitoring frequency was every 2 h. The transformation relation is as follows:
where
The transformation between phreatic water and soil water during the freeze-thaw period is actually the upward migration of phreatic water to soil water caused by soil freezing and the downward movement of soil water to phreatic water by the thawing water of frozen soil. The difference between the UMA and DMA can reflect groundwater consumption, as follows:
where
3 Results
3.1 Freeze-thaw temperature and relative humidity variation
The daily average temperature and daily average humidity during the freeze-thaw period are shown in Figure 2. The soil temperature decreased rapidly during days 1 and 2 of the constant temperature freezing stage. Then, temperature fluctuated slightly near the design freezing temperature, which entered a stable change stage. The freezing process lasted for 20 days at −20°C before the soil temperature reached stability. After the freezing process, natural thawing was performed at room temperature. The temperature rose linearly during days 1–4 of the thawing stage and tended to remain stable after reaching room temperature. The temperature of the refrigeration unit was the same as the room temperature during days 13–15 of the thawing stage. The relative humidity also followed the same variation with air temperature.
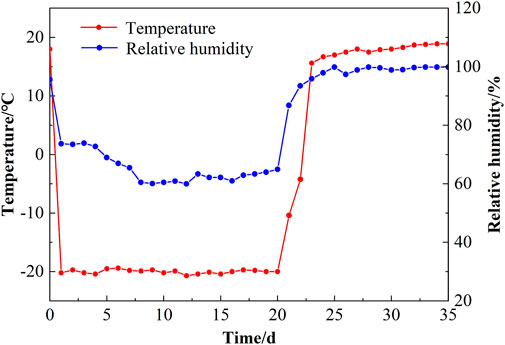
FIGURE 2. Variations of temperature and relative humidity during the freeze-thaw process.
3.2 Temperature variation of sand columns under freeze-thaw action
(1) Freezing stage
The temperature variations of Ch and sand columns with interlayers at different positions during the freezing process are shown in Figure 3. The air temperature had a significant effect on the soil temperature, and the soil temperature of all sand columns showed essentially the same variation trends at different depths.
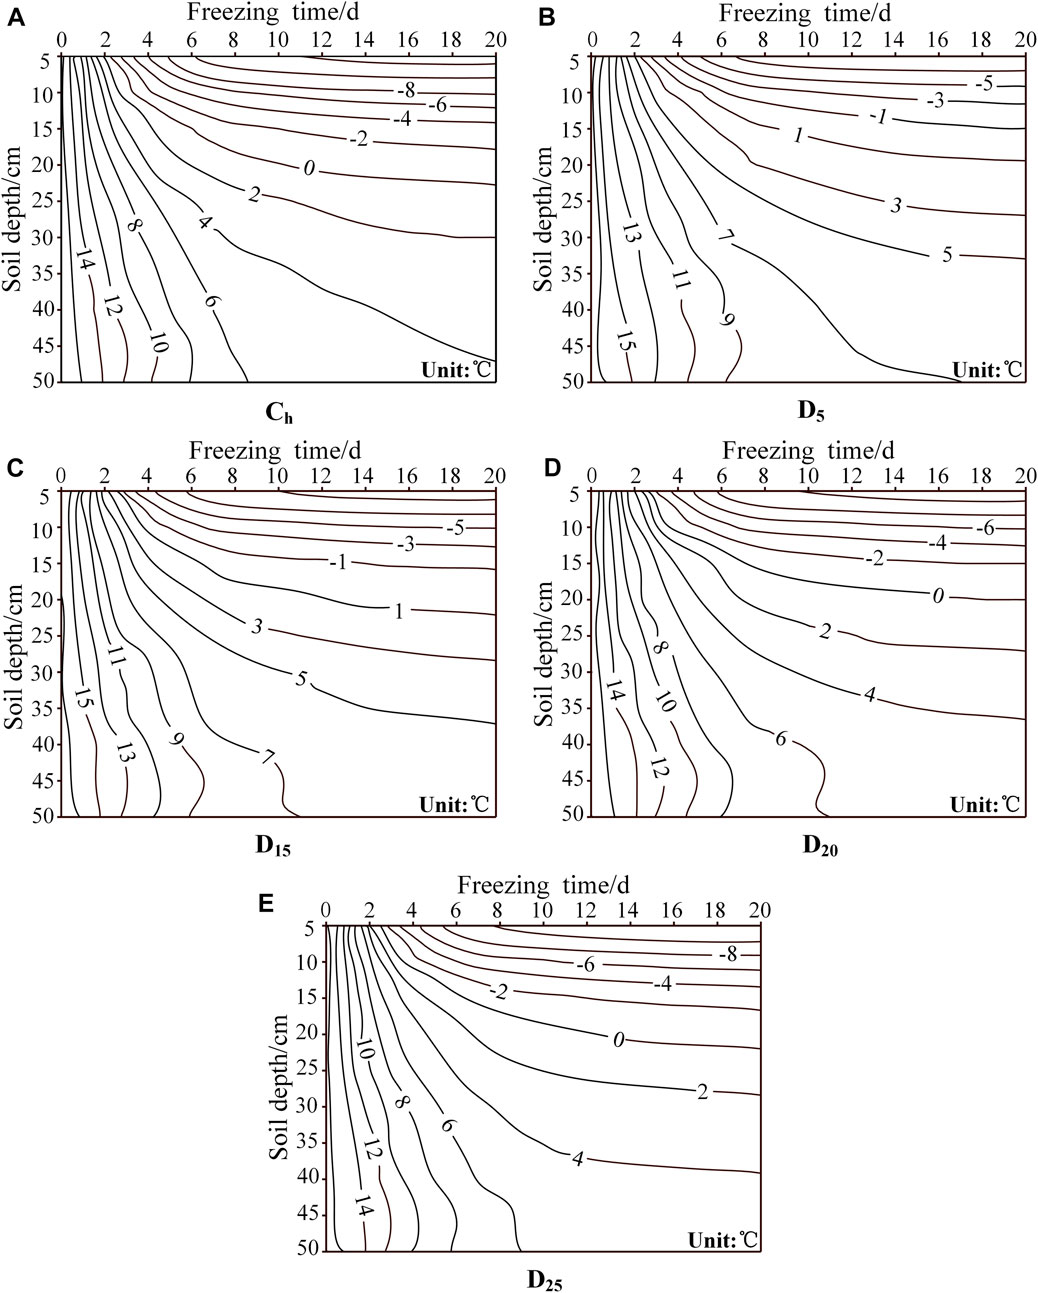
FIGURE 3. Temperature variation of sand columns during the freezing process. (A–E) are the temperature variation at different depths of Ch, D5, D15, D20 and D25 respectively.
At the beginning of the freezing stage, the temperature of the near-surface soil layer decreased rapidly. Subsequently, the temperature of the sand column decreased and eventually stabilized driven by the temperature gradient (Huang et al., 2013). The temperature variation of the sand column during the freezing process could be divided into three stages: the rapid cooling stage (during days 1–3 of the freezing stage, the daily temperature reduction was about 3.0°C–9.0°C), the slow cooling stage (during days 4–7 of the freezing stage, the daily temperature reduction was 1.0°C–3.0°C), and the stable change stage (during days 8–20 of the freezing stage, the daily temperature reduction was 0.1°C–0.5°C).
When the sand column temperature was stable (on day 20 of the freezing process), the temperatures of D5, D15, D20, and D25 dropped to −8.7°C–7.0°C, −10°C–6.2°C, −11.2°C–5.5°C, and −12°C–4.9°C, which was 2.6°C–4.2°C, 1.0°C–2.9°C, 0.5°C–1.7°C, and 0.2°C–0.9°C higher than Ch, which indicated that the existence of an interlayer hindered the loss of soil heat. The average temperature gradient of Ch was the highest and D5 was the lowest—that is, the average temperature gradient in the sand column with the near-surface interlayer was smaller, and the temperature of the sand column decreased more slowly, which had a better effect on the insulation of the sand column. The difference between the temperature of the interlayer sand column and Ch gradually decreased with a deepening of the interlayer position, and the soil thermal insulation gradually weakened. The temperature variations of D20 and D25 had little difference from Ch.
(2) Thawing stage
The temperature variations of the sand column also could be divided into three stages during the thawing process: the slow warming stage (during days 1–2 of the thawing stage, the daily temperature increase was about 0.2°C–0.8°C), the rapid warming stage (during days 3–9 of the thawing stage, the daily temperature increase was about 0.8°C–7.1°C), and the stable change stage (during days 10–15 of the thawing stage, the daily temperature increase was about 0.1°C–0.3°C).
At the beginning of the thawing process, the temperature of the sand column increased slowly and gradually slowed as depth increased (as shown in Figure 4). Subsequently, the temperature entered the rapidly increasing stage with an increase in the temperature gradient. Eventually, the temperature of the sand column entered a minor fluctuation stage, and then the temperature tended to be closer to room temperature. During the thawing process, the temperature recovery rate of the sand column was Ch > D25 > D20 > D15 > D5. The interlayers of D5, D15, D20, and D25 with a particle size of 0.1–0.5 mm, which was smaller than that of Ch. The poor thermal conductivity of fine soil particles hindered the downward migration of heat from the surface. Therefore, the temperature recovery rate of the interlayer sand column was slower, and the sand column with the near-surface interlayer had a more obvious thermal insulation and a slower temperature recovery rate.
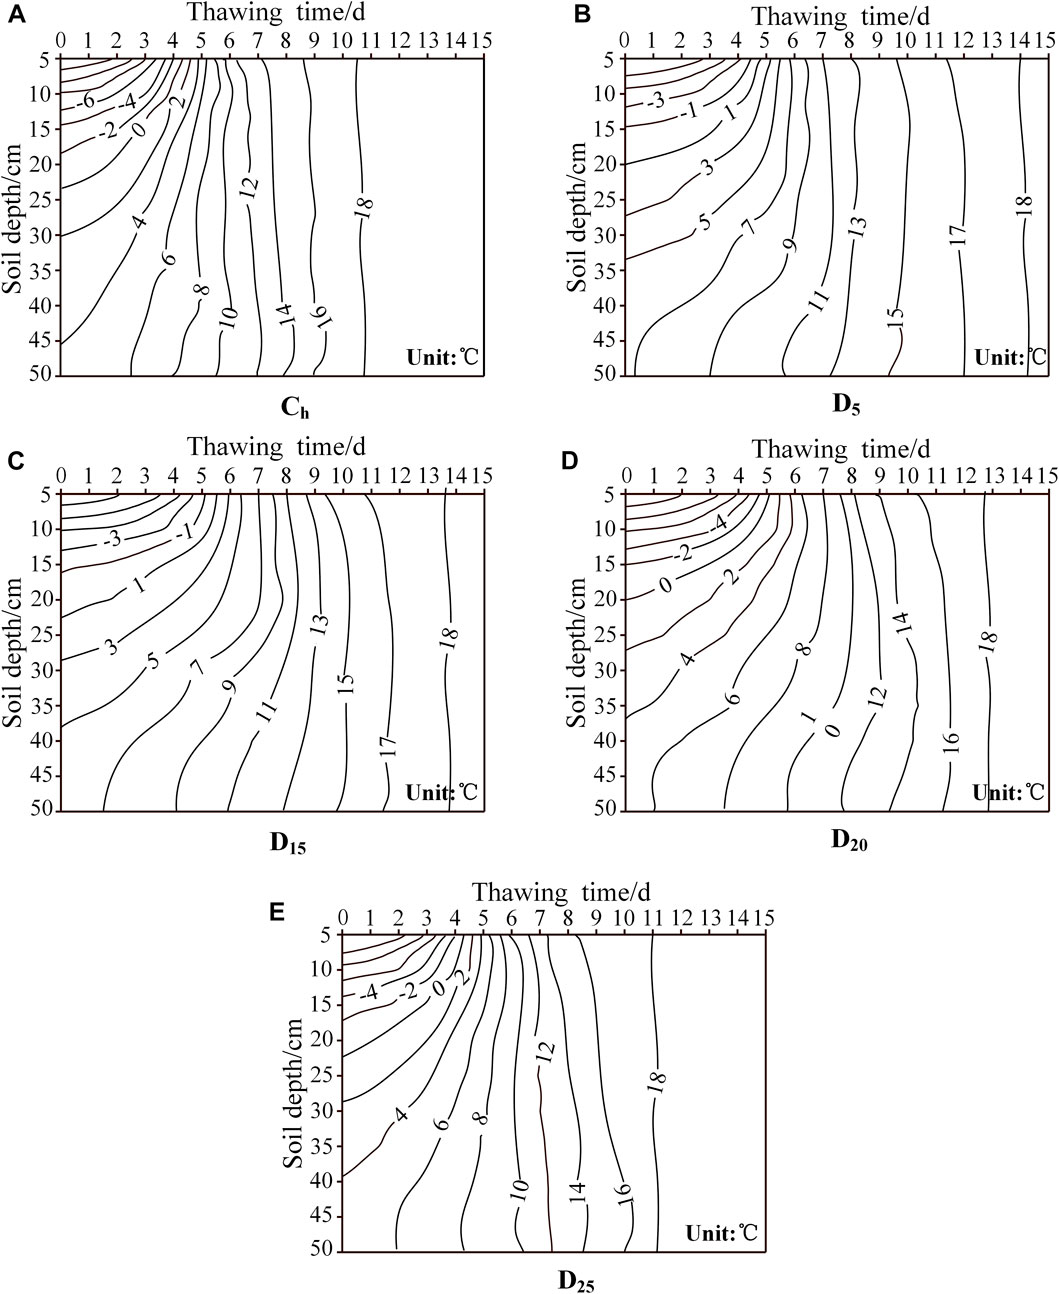
FIGURE 4. Temperature variation of sand columns during the thawing process. (A–E) are the temperature variation at different depths of Ch, D5, D15, D20 and D25 respectively.
3.3 Transformation between phreatic water and soil water under freeze-thaw action
3.3.1 Upward migration of phreatic water to soil water
The redistribution of water and heat in the soil during the freezing period results in a continuous upward migration of the phreatic water. The cumulative UMA of Ch and sand columns with four different interlayer positions during the freezing stage are shown in Figure 5. At the beginning of the freezing stage, the daily UMA of the sand columns with different interlayer positions ranged from 0.02 mm d−1 to 0.15 mm d−1, and the cumulative UMA was small. Subsequently, the UMA increased rapidly under the effect of soil-water potential and temperature gradient. The daily UMA decreased on day 9 when the soil temperatures were in a small fluctuation. At the end of the freezing stage, the cumulative UMA of D5, D15, D20, and D25 reached 6.19, 6.96, 7.60, and 8.53 mm, which was 61%, 69%, 75%, and 84% of Ch. The daily UMA of Ch was always higher than that of each interlayer sand column during the freezing process, and D5 had the lowest daily UMA. The interlayer effectively inhibited upward migration of phreatic water to soil water during the freezing stage (Zhang et al., 2020b)—that is, the farther the interlayer was away from the surface, the greater the cumulative UMA was. The near-surface interlayer had a more obvious inhibitory effect on upward migration of phreatic water to soil water.
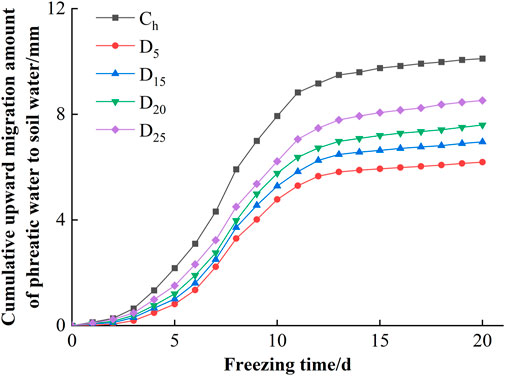
FIGURE 5. Cumulative upward migration amount of phreatic water to soil water during the freezing process.
In addition, the time required for sand columns with different interlayer positions to reach the same cumulative UMA was obviously different. It took about 11 and 8 days for the cumulative UMA to reach 5 mm in D5 and D25, which was 3.5 and 0.5 days later than Ch, respectively.
The analysis result shown that the cumulative UMA and the depth of interlayer was well fitted by the following exponential function:
where Qcev is the cumulative UMA (mm); x is the depth of interlayer (cm); a and b are regression coefficients.
The fitting curves of the cumulative UMA and the depth of interlayer are shown in Figure 6, and the results of the regression analysis are presented in Table 2. The correlation coefficients (R2) of the fitting equations are greater than 0.97, indicating that the variation in the cumulative UMA with the depth of interlayer during the freezing process can be well characterized by the above equations. At a given significance level of α = 0.05, F0.05 (p, n-p-1) = F0.05(1,2) = 18.50. F = 69.912 > F0.05(p, n-p-1), this indicated that the regression equations are significant. It can be seen that the cumulative UMA increased exponentially with the depth of interlayer.
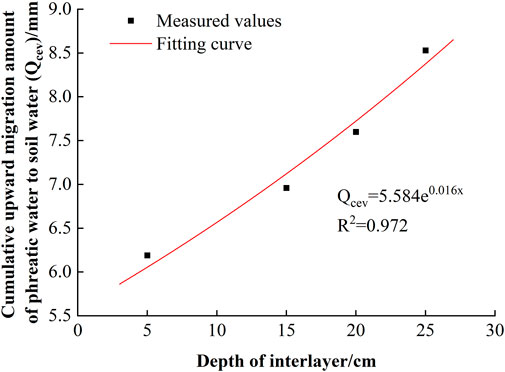
FIGURE 6. Fitting curves of the cumulative upward migration amount of phreatic water to soil water and the depth of interlayer.
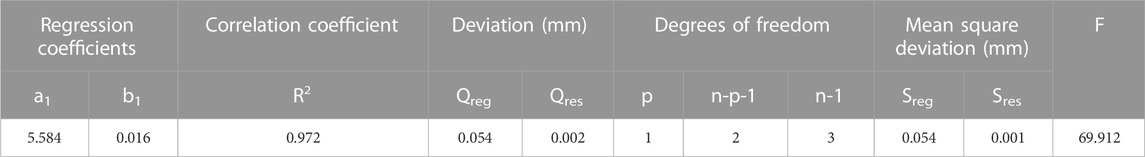
TABLE 2. Variance analysis for significance test of regression equations.
3.3.2 Downward movement of soil water to phreatic water
The presence of the interlayer changed the hydraulic conductivity of the soil, which affect the DMA during the thawing process. Variations in the cumulative DMA of sand columns with different interlayer positions during the thawing process are shown in Figure 7. The sand column thawed slowly in the first 2 days of the thawing stage. The daily DMA of Ch was 0.66 mm d−1 on day 2, and that of D5 and D25 was 19.70% and 54.55% lower than that of Ch. The frozen upper layer thawed rapidly as the temperature gradually increased from day 3 to day 9. Under the action of gravity, the soil water rapidly recharged to phreatic water. From day 10 to day 12 of the thawing stage, the increase in DMA was reduced, with an average daily increase of 0.04–0.63 mm. After that, the daily DMA of the sand column reached almost zero. The cumulative DMA of D5, D15, D20, and D25 reached 5.60, 4.53, 3.76, and 2.82 mm on day 15, which was 57%, 46%, 38%, and 29% of that of Ch.
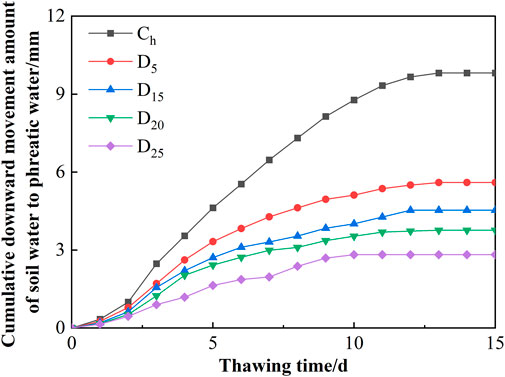
FIGURE 7. Cumulative downward movement amount of soil water to phreatic water during the thawing process.
Ch had the largest daily DMA, while D25 had the smallest daily DMA. The cumulative DMA of sand columns decreased as the interlayer position deepened. The cumulative DMA of D25 reached zero on day 9, whereas Ch did not reach zero until day 13. The DMA of the sand column with interlayer that was farther away from the surface reached zero earlier, and the interlayer had a more obvious inhibitory effect on the downward movement of soil water to phreatic water.
The fitting curves of the cumulative DMA and the depth of interlayer at the end of the thawing stages is shown in Figure 8. The correlation coefficients (R2) of the fitting equations are greater than 0.94, indicating that the variation in the cumulative DMA with the depth of interlayer during the freezing process can be well characterized by the fitted equation as shown in Figure 8. The cumulative DMA decreased exponentially with the depth of interlayer.
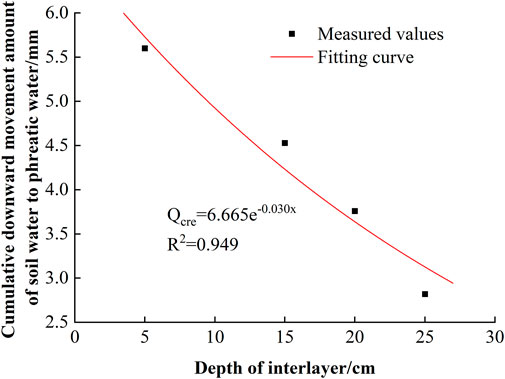
FIGURE 8. Fitting curves of the cumulative downward movement amount of soil water to phreatic water and the depth of interlayer.
3.3.3 Difference between the UMA and DMA
Generally, the invalid loss of groundwater occurs during seasonal freeze-thaw period. The difference between UMA and DMA (Qbh) often has been used to characterize the degree of groundwater depletion (Ouyang et al., 2016; Chen et al., 2018a; Chen et al., 2023), and which of the sand column with different interlayer positions was positive value (Table 3), that is, the cumulative UMA of the sand column was greater than the cumulative DMA. The value of Qbh was the smallest in Ch, and the UMA under the freeze-thaw action was 0.3 mm higher than that of the DMA. It indicated that the existence of the interlayer promoted the transformation of phreatic water to soil water and increased water storage in the sand column. With a deepening of the interlayer position, the value of Qbh increased, that is, the consumption of phreatic water increased.
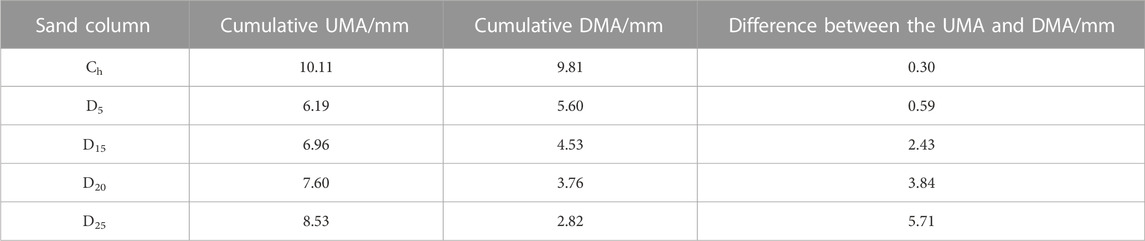
TABLE 3. The difference between the upward migration amount of phreatic water to soil water and downward movement amount of soil water to phreatic water during the freeze-thaw process.
where
The correlation coefficients (R2) of the fitting equation is greater than 0.98, and the fitting curves are shown in Figure 9. It can be seen that the Qbh increased exponentially with the deepening of interlayer position, indicating that the inefficient loss of groundwater increased with the depth of interlayer.
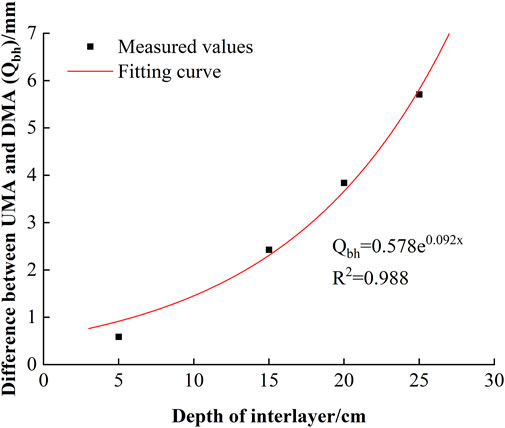
FIGURE 9. Fitting curves of the difference between the upward migration amount of phreatic water to soil water and downward movement amount of soil water to phreatic water and the depth of interlayer.
4 Discussion
4.1 Effects of the interlayer position on the soil temperature
Soil temperature was related to the thermal conductivity during the freeze-thaw period (Lein et al., 2019). Numerous studies have shown that soil texture, soil moisture content, dry bulk density, and soil particle size affected soil thermal conductivity (Chen, 2008; Zhang et al., 2016; He et al., 2021; Zakharov and Makhover, 2021), and soil-water phase change caused by temperature also affected soil thermal conductivity (Duc Cao et al., 2021). This will lead to redistribution of soil moisture and heat during the freeze-thaw period. The thermal conductivity of ice crystals was four times that of liquid water. Thus, when the soil was frozen, the thermal conductivity of soil increased rapidly with the expansion of ice crystals. In the rapid freezing stage, liquid water migrated and crystallized from the unfrozen area at the lower to upper layers according to the temperature gradient. As the freezing front advanced downward, the ice crystals in the frozen upper layer continued to increase. The pores between soil particles were filled with ice crystals, which resulted in an increase in soil thermal conductivity. With the decrease in freezing temperature, the soil temperature decreased rapidly, and then it stabilized (Cheng et al., 2014).
The soil temperature gradient is the important factor affecting the soil temperature. The larger the soil particle size, the smaller the porosity and the higher the thermal conductivity (Chen et al., 2023). Soil temperatures in homogeneous sand column are lower than in interlayer sand columns when the freezing was stable. This may be attributed to the lower heat conductivity of the small particle size interlayer which slowed the velocity of heat loss by the soil (Zhang et al., 2015; Chen et al., 2018b; Xue et al., 2020). Therefore, the freezing depths of the homogeneous sand column are larger in the freezing period. The ranking of soil temperature reduction in the four interlayer sand columns was D5 < D15 < D20 < D25 at the end of freezing stage, the results illustrate that the shallower sand interlayer preferred heat preservation for the sand column (Xue et al., 2020). Conversely, the temperature of the sand column with a near-surface interlayer rose slowly and the heat resistance effect was remarkable during the thawing process. In the vertical direction, the soil temperature in the surface layer of the sand column decreased faster and the upper soil temperature was lower than the temperature of the deeper soil layer. Then the soil thawed in both directions under the effect of temperature gradient, but the surface soil was more influenced by the external temperature, thus, the surface soil is the earliest to return to room temperature. Soil temperature recovery showed a significant hysteresis with the increasing of soil depth (Chen et al., 2023).
4.2 Transformation between phreatic water and soil water
The freezing process caused some of the liquid water to condense into ice crystals as the upper soil temperature decreased, resulting in upward migration of phreatic water to soil water by the soil water potential gradient (Wu et al., 2023). As mediums of energy and water transfer, soil porosity and specific surface area both affected the migration of water and energy (Watanabe and Mizoguchi, 2002). The particle size of the homogeneous sand column was large and uniform, such that it had the largest cumulative UMA and daily UMA during the freezing process under the same conditions. While the remaining sand columns had a sudden change in capillary suction at the intersection due to the presence of the interlayer (Zhang et al., 2020c), which inhibited the upward transport of phreatic water to soil water. The interlayer position is strongly correlated with the UMA. The cumulative UMA increased exponentially with the depth of interlayer. When the interlayer position was closer to the ground surface, the temperature of the lower part of sand column was relatively high, and the degree of the water phase change was weak during the freezing stage, which had a significant inhibitory effect on upward migration of phreatic water to soil water (Xue et al., 2020).
Different interlayer positions affected the water conductivity and the water-holding capacity of the unsaturated zone in the sand column. During the thawing stage, the soil water migrates downwards under the effect of the gravitational potential gradient and the matrix potential gradient (Du et al., 2018; Zhang et al., 2020b). The downward migration process of soil water in homogeneous sand column and interlayer sand column was the same before the wetting front of the thawing water reached the interlayer. The rate of downward migration of soil water gradually decreased as time increased, and it dropped sharply when wetting front migrated to interlayer (Fan et al., 2022). Homogeneous sand column was filled with large particle size soil resulting in a large hydraulic conductivity, thus, it had a greater cumulative DMA and daily DMA. In the sand column of the interlayer that was farther away from the surface, the path of soil water transport downward to the interlayer was longer than other sand columns, and the interlayer has a stronger water-holding capacity and weaker water-release capacity, thus, D25 had the lowest downward migration rate of water and daily DMA. Therefore, the deeper the interlayer position was, the slower the downward movement of soil water to phreatic water process and the smaller the cumulative DMA was.
Mutual exchange of soil water and groundwater occurs during the freeze-thaw period, and the cumulative DMA was always less than the cumulative UMA (Chen et al., 2018a). The
5 Conclusion
The soil temperature varied more in the homogeneous sand column during the freeze-thaw period in shallow groundwater areas. The existence of a fine particle interlayer had a thermal insulation on the soil profile. The closer the interlayer was to the surface, the better the insulation effect of the sand column was. The temperature of the homogeneous sand column increased fastest and rose the most during the thawing stage, while the sand column with the near-surface interlayer had the lowest temperature increase.
The inhibition effect on upward migration of phreatic water to soil water during the freezing process was stronger when the interlayer was closer to the surface, and the cumulative UMA of D5, D15, D20, and D25 was 61%–84% of Ch. The cumulative DMA decreased as the interlayer position deepened. The cumulative DMA of D5, D15, D20, and D25 was 29%–57% of Ch during the thawing stage. The DMA of the sand column with an interlayer that was farther away from the surface reached zero earlier. The sand column with an interlayer that was farther away from the ground surface consumed more groundwater and stored more water in the unsaturated zone. The cumulative UMA increased exponentially with the depth of interlayer, and the cumulative DMA decreased exponentially with the depth of interlayer.
This study investigated the effects of interlayer positions on the soil temperature and the transformation between phreatic water and soil water during the freeze-thaw process, and showed clearly the groundwater consumption with different interlayer position. These research results were significant for the prevention and control of soil salinization and the scientific evaluation of groundwater resources in shallow groundwater areas.
Data availability statement
The raw data supporting the conclusion of this article will be made available by the authors, without undue reservation.
Author contributions
JC: Conceptualization, Methodology, Writing—Original draft, Writing—Review and editing, and Project administration; JR: Writing—Original draft and Visualization and analysis; EW: Writing—Review and editing. LC: Writing—Review and editing; JX: Writing—Review and editing; XZ: Writing—Review and editing; and QD: Supervision. All authors contributed to the article and approved the submitted version.
Funding
This research was supported by the National Natural Science Foundation of China (Grant No. 41572239), the National Natural Youth Science Foundation of China (Grant No. 41502243) and the Natural Science Foundation of Shanxi Province, China (Grant No. 202203021221048).
Acknowledgments
We also acknowledge the reviewers and editor for their useful comments and corrections and their invaluable help.
Conflict of interest
The authors declare that the research was conducted in the absence of any commercial or financial relationships that could be construed as a potential conflict of interest.
Publisher’s note
All claims expressed in this article are solely those of the authors and do not necessarily represent those of their affiliated organizations, or those of the publisher, the editors and the reviewers. Any product that may be evaluated in this article, or claim that may be made by its manufacturer, is not guaranteed or endorsed by the publisher.
References
Abdulrazzak, M. J., and Morel-Seytoux, H. J. (1983). Recharge from an ephemeral stream following wetting front arrival to water table. Water Resour. Res. 19 (1), 194–200. doi:10.1029/WR019i001p00194
Assouline, S. (2013). Infiltration into soils: Conceptual approaches and solutions. Water Resour. Res. 49 (4), 1755–1772. doi:10.1002/wrcr.20155
Bo, L., Li, Z., Li, P., Xu, G., Xiao, L., and Ma, B. (2021). Soil freeze-thaw and water transport characteristics under different vegetation types in seasonal freeze-thaw areas of the loess plateau. Front. Earth Sci. 9, 704901. doi:10.3389/feart.2021.704901
Carretero, S., Rodrigues Capítulo, L., and Kruse, E. (2021). Evolution of groundwater recharge as a result of forest development on the East Coast of the province of Buenos Aires, Argentina. Hydrogeology J. 29 (2), 783–797. doi:10.1007/s10040-020-02282-z
Chen, J., Gao, X., Zheng, X., Miao, C., Liu, P., Du, Q., et al. (2018a). Transformation between phreatic water and soil water during freeze–thaw periods. Water 10 (4), 376. doi:10.3390/w10040376
Chen, J., Wang, E., Xue, J., Cui, L., Zheng, X., and Du, Q. (2023). Effects of soil particle size and gradation on the transformation between shallow phreatic water and soil water under laboratory freezing-thawing action. J. Hydrology 619, 129323. doi:10.1016/j.jhydrol.2023.129323
Chen, L., Yu, W., Yi, X., Hu, D., and Liu, W. (2018b). Numerical simulation of heat transfer of the crushed-rock interlayer embankment of Qinghai-Tibet Railway affected by aeolian sand clogging and climate change. Cold Regions Sci. Technol. 155, 1–10. doi:10.1016/j.coldregions.2018.07.009
Chen, S., Mao, X., and Shang, S. (2022). Response and contribution of shallow groundwater to soil water/salt budget and crop growth in layered soils. Agric. Water Manag. 266, 107574. doi:10.1016/j.agwat.2022.107574
Chen, S., Mao, X., and Wang, C. (2019). A modified green-ampt model and parameter determination for water infiltration in fine-textured soil with coarse interlayer. Water 11 (4), 787. doi:10.3390/w11040787
Chen, S. (2008). Thermal conductivity of sands. Heat Mass Transf. 44 (10), 1241–1246. doi:10.1007/s00231-007-0357-1
Cheng, Q., Sun, Y., Jones, S. B., Vasilyev, V. I., Popov, V. V., Wang, G., et al. (2014). In situ measured and simulated seasonal freeze–thaw cycle: A 2-year comparative study between layered and homogeneous field soil profiles. J. Hydrology 519, 1466–1473. doi:10.1016/j.jhydrol.2014.09.023
Chou, Y., and Wang, L. (2021). Seasonal freezing-thawing process and hydrothermal characteristics of soil on the Loess Plateau, China. J. Mt. Sci. 18 (11), 3082–3098. doi:10.1007/s11629-020-6599-9
Diaz, F., Jimenez, C. C., and Tejedor, M. (2005). Influence of the thickness and grain size of tephra mulch on soil water evaporation. Agric. Water Manag. 74 (1), 47–55. doi:10.1016/j.agwat.2004.10.011
Du, C., Yu, J., Wang, P., and Zhang, Y. (2018). Analysing the mechanisms of soil water and vapour transport in the desert vadose zone of the extremely arid region of northern China. J. Hydrology 558, 592–606. doi:10.1016/j.jhydrol.2017.09.054
Duc Cao, T., Kumar Thota, S., Vahedifard, F., and Amirlatifi, A. (2021). General thermal conductivity function for unsaturated soils considering effects of water content, temperature, and confining pressure. J. Geotechnical Geoenvironmental Eng. 147 (11), 2660. doi:10.1061/(asce)gt.1943-5606.0002660
Evans, S. G., Ge, S., and Liang, S. (2015). Analysis of groundwater flow in mountainous, headwater catchments with permafrost. Water Resour. Res. 51 (12), 9564–9576. doi:10.1002/2015wr017732
Fan, Y., Zhu, C., Bai, G., Ma, T., and Wang, Z. (2022). Numerical simulation of soil water movement by gravity subsurface hole irrigation. Water Supply 22 (7), 6389–6404. doi:10.2166/ws.2022.221
Freyberg, D. L. (1983). Modeling the effects of a time-dependent wetted perimeter on infiltration from ephemeral channels. Water Resour. Res. 19 (2), 559–566. doi:10.1029/WR019i002p00559
Gallo, A., Odokonyero, K., Mousa, M. A. A., Reihmer, J., Al-Mashharawi, S., Marasco, R., et al. (2022). Nature-inspired superhydrophobic sand mulches increase agricultural productivity and water-use efficiency in arid regions. ACS Agric. Sci. Technol. 2 (2), 276–288. doi:10.1021/acsagscitech.1c00148
Hansson, K., Simunek, J., Mizoguchi, M., Lundin, L. C., and van Genuchten, M. T. (2004). Water flow and heat transport in frozen soil: Numerical solution and freeze-thaw applications. Vadose Zone J. 3 (2), 693–704. doi:10.2113/3.2.693
He, H., Flerchinger, G. N., Kojima, Y., He, D., Hardegree, S. P., Dyck, M. F., et al. (2021). Evaluation of 14 frozen soil thermal conductivity models with observations and SHAW model simulations. Geoderma 403, 115207. doi:10.1016/j.geoderma.2021.115207
Horel, Á., Zsigmond, T., Farkas, C., Gelybó, G., Tóth, E., Kern, A., et al. (2022). Climate change alters soil water dynamics under different land use types. Sustainability 14 (7), 3908. doi:10.3390/su14073908
Hou, R., Li, T., Fu, Q., Liu, D., Li, M., Zhou, Z., et al. (2020). Research on the distribution of soil water, heat, salt and their response mechanisms under freezing conditions. Soil Tillage Res. 196, 104486. doi:10.1016/j.still.2019.104486
Hu, Z., Wang, X., McSweeney, K., and Li, Y. (2022). Restoring subsided coal mined land to farmland using optimized placement of Yellow River sediment to amend soil. Land Degrad. Dev. 33 (7), 1029–1042. doi:10.1002/ldr.4209
Huang, M., Bruch, P. G., and Barbour, S. L. (2013). Evaporation and water redistribution in layered unsaturated soil profiles. Vadose Zone J. 12 (1), 108. doi:10.2136/vzj2012.0108
Kelleners, T. J., Koonce, J., Shillito, R., Dijkema, J., Berli, M., Young, M. H., et al. (2016). Numerical modeling of coupled water flow and heat transport in soil and snow. Soil Sci. Soc. Am. J. 80 (2), 247–263. doi:10.2136/sssaj2015.07.0279
Kozlowski, T., and Nartowska, E. (2013). Unfrozen water content in representative bentonites of different origin subjected to cyclic freezing and thawing. Vadose Zone J. 12 (1), 57. doi:10.2136/vzj2012.0057
Lein, W. A., Slone, S. M. L., Smith, C. E., and Bernier, A. P. (2019). “Prediction of frost depth penetration and frost heave in frost susceptible Soils.pdf,” in Cold regions engineering (Reston, VA: American Society of Civil Engineers), 161–168.
Li, R., Shi, H., Flerchinger, G. N., Zou, C., and Li, Z. (2013). Modeling the effect of antecedent soil water storage on water and heat status in seasonally freezing and thawing agricultural soils. Geoderma 206, 70–74. doi:10.1016/j.geoderma.2013.04.021
Li, X., Chang, S. X., and Salifu, K. F. (2014). Soil texture and layering effects on water and salt dynamics in the presence of a water table: A review. Environ. Rev. 22 (1), 41–50. doi:10.1139/er-2013-0035
Liu, H., Lyu, X., Wang, J., He, X., and Zhang, Y. (2020). The dependence between shear strength parameters and microstructure of subgrade soil in seasonal permafrost area. Sustainability 12 (3), 1264. doi:10.3390/su12031264
Liu, L., Mao, X., Wu, Q., Liu, F., and Zhao, Y. (2019). Mechanism of groundwater migration in the subgrade in a seasonally frozen soil area. J. Cold Regions Eng. 33 (4), 196. doi:10.1061/(asce)cr.1943-5495.0000196
Miller, D. E., and Gardner, W. H. (1962). Water infiltration into stratified soil. Soil Sci. Soc. Am. J. 26 (2), 115–119. doi:10.2136/sssaj1962.03615995002600020007x
Min, L., Xiaohang, J., Ming, X., Louise, F., Dmitry, N., Vladimir, R., et al. (2022). Synthesis of physical processes of permafrost degradation and geophysical and geomechanical properties of permafrost. Cold Regions Sci. Technol. 198, 103522. doi:10.1016/j.coldregions.2022.103522
Modaihsh, A. S., Horton, R., and Kirkham, D. O. N. (1985). Soil water evaporation suppression by sand mulches. Soil Sci. 139 (4), 357–361. doi:10.1097/00010694-198504000-00010
Ouyang, W., Liu, B., and Wu, Y. (2016). Satellite-based estimation of watershed groundwater storage dynamics in a freeze–thaw area under intensive agricultural development. J. Hydrology 537, 96–105. doi:10.1016/j.jhydrol.2016.03.034
Pillai, K. M., Prat, M., and Marcoux, M. (2009). A study on slow evaporation of liquids in a dual-porosity porous medium using square network model. Int. J. Heat Mass Transf. 52 (7-8), 1643–1656. doi:10.1016/j.ijheatmasstransfer.2008.10.007
Quinton, W. L., Bemrose, R. K., Zhang, Y., and Carey, S. K. (2009). The influence of spatial variability in snowmelt and active layer thaw on hillslope drainage for an alpine tundra hillslope. Hydrol. Process. 23 (18), 2628–2639. doi:10.1002/hyp.7327
Quinton, W. L., Shirazi, T., Carey, S. K., and Pomeroy, J. W. (2005). Soil water storage and active-layer development in a sub-alpine tundra hillslope, southern Yukon Territory, Canada. Permafr. Periglac. Process. 16 (4), 369–382. doi:10.1002/ppp.543
Shokri, N., Lehmann, P., and Or, D. (2010). Evaporation from layered porous media. J. Geophys. Res. 115 (6), 6204. doi:10.1029/2009jb006743
Sun, S., Dai, C., Liao, H., and Xiao, D. (2011). A conceptual model of soil moisture movement in seasonal frozen unsaturated zone. Appl. Mech. Mater. 90-93, 2612–2618. doi:10.4028/www.scientific.net/AMM.90-93.2612
Walvoord, M. A., and Kurylyk, B. L. (2016). Hydrologic impacts of thawing permafrost-A review. Vadose Zone J. 15 (6), 10. doi:10.2136/vzj2016.01.0010
Wang, C., Mao, X., and Hatano, R. (2014). Modeling ponded infiltration in fine textured soils with coarse interlayer. Soil Sci. Soc. Am. J. 78 (3), 745–753. doi:10.2136/sssaj2013.12.0535
Wang, Q., Yang, Q., Guo, H., Xiao, X., Jin, H., Li, L., et al. (2018). Hydrothermal variations in soils resulting from the freezing and thawing processes in the active layer of an alpine grassland in the Qilian Mountains, northeastern Tibetan Plateau. Theor. Appl. Climatol. 136 (3-4), 929–941. doi:10.1007/s00704-018-2529-y
Wang, X., Hu, Z., and Liang, Y. (2020). Impact of interlayer on moisture characteristics of reclaimed soil backfilled with Yellow River sediments. Int. J. Agric. Biol. Eng. 13 (1), 153–159. doi:10.25165/j.ijabe.20201301.5418
Watanabe, K., and Mizoguchi, M. (2002). Amount of unfrozen water in frozen porous media saturated with solution. Cold Regions Sci. Technol. 34 (2), 103–110. doi:10.1016/s0165-232x(01)00063-5
White, D., Hinzman, L., Alessa, L., Cassano, J., Chambers, M., Falkner, K., et al. (2007). The arctic freshwater system: Changes and impacts. J. Geophys. Res. Biogeosciences 112 (4), 353. doi:10.1029/2006jg000353
Willis, W. O. (1960). Evaporation from layered soils in the presence of a water table. Soil Sci. Soc. Am. J. 24 (4), 239–242. doi:10.2136/sssaj1960.03615995002400040009x
Wu, C., Bi, Y., and Christie, P. (2022). Influence of loess interlayer thickness on water transport in sand. Pol. J. Environ. Stud. 31 (4), 3317–3325. doi:10.15244/pjoes/146188
Wu, D., Zhou, X., and Jiang, X. (2018). Water and salt migration with phase change in saline soil during freezing and thawing processes. Ground Water 56 (5), 742–752. doi:10.1111/gwat.12605
Wu, T., Li, H., and Lyu, H. (2023). Effect of freeze–thaw process on heat transfer and water migration between soil water and groundwater. J. Hydrology 617, 128987. doi:10.1016/j.jhydrol.2022.128987
Xiao, L., Zhang, Y., Li, P., Xu, G., Shi, P., and Zhang, Y. (2019). Effects of freeze-thaw cycles on aggregate-associated organic carbon and glomalin-related soil protein in natural-succession grassland and Chinese pine forest on the Loess Plateau. Geoderma 334, 1–8. doi:10.1016/j.geoderma.2018.07.043
Xue, J., Feng, H., Chen, J., Zheng, X., and Du, Q. (2020). The effect of a sand interlayer on soil evaporation during the seasonal freeze–thaw period in the middle reaches of the yellow river. Water 12 (8), 2092. doi:10.3390/w12082092
Zakharov, A. V., and Makhover, S. E. (2021). Dependence sandy soil thermal conductivity on grain-size composition. J. Phys. Conf. Ser. 1928 (1), 012034. doi:10.1088/1742-6596/1928/1/012034
Zhang, A., Zhang, J., Peng, J., Huang, C., and Zhou, C. (2022). Effect of freeze-thaw cycles on mechanical properties of an embankment clay: Laboratory tests and model evaluations. Front. Earth Sci. 10, 865348. doi:10.3389/feart.2022.865348
Zhang, H., Zhi, B., Liu, E., and Wang, T. (2020a). Study on varying characteristics of temperature field and moisture field of shallow loess in the freeze-thaw period. Adv. Mater. Sci. Eng. 2020, 1–10. doi:10.1155/2020/1690406
Zhang, J., Li, F., Zeng, L., Peng, J., and Li, J. (2020c). Numerical simulation of the moisture migration of unsaturated clay embankments in southern China considering stress state. Bull. Eng. Geol. Environ. 80 (1), 11–24. doi:10.1007/s10064-020-01916-6
Zhang, J., Li, F., Zeng, L., Zheng, J., Zhang, A., and Zhang, Y. (2020b). Effect of cushion and cover on moisture distribution in clay embankments in southern China. J. Central South Univ. 27 (7), 1893–1906. doi:10.1007/s11771-020-4418-7
Zhang, J., Zhang, A., Huang, C., Yu, H., and Zhou, C. (2021). Characterising the resilient behaviour of pavement subgrade with construction and demolition waste under Freeze–Thaw cycles. J. Clean. Prod. 300, 126702. doi:10.1016/j.jclepro.2021.126702
Zhang, N., Yu, X., Pradhan, A., and Puppala, A. J. (2016). A new generalized soil thermal conductivity model for sand–kaolin clay mixtures using thermo-time domain reflectometry probe test. Acta Geotech. 12 (4), 739–752. doi:10.1007/s11440-016-0506-0
Zhang, N., Yu, X., Pradhan, A., and Puppala, A. J. (2015). Effects of particle size and fines content on thermal conductivity of quartz sands. Transp. Res. Rec. J. Transp. Res. Board 2510 (1), 36–43. doi:10.3141/2510-05
Zhang, X., and Sun, S. (2010). The impact of soil freezing/thawing processes on water and energy balances. Adv. Atmos. Sci. 28 (1), 169–177. doi:10.1007/s00376-010-9206-0
Zhao, X., Xu, S., Liu, T., Qiu, P., and Qin, G. (2019). Moisture distribution in sloping black soil farmland during the freeze–thaw period in northeastern China. Water 11 (3), 536. doi:10.3390/w11030536
Keywords: freeze-thaw, soil temperature, phreatic water transformation, interlayer position, shallow groundwater
Citation: Chen J, Ren J, Wang E, Cui L, Xue J, Zheng X and Du Q (2023) Effect of the interlayer on soil temperature and the transformation between phreatic water and soil water under laboratory freeze-thaw action. Front. Earth Sci. 11:1200677. doi: 10.3389/feart.2023.1200677
Received: 05 April 2023; Accepted: 13 June 2023;
Published: 22 June 2023.
Edited by:
Dongliang Luo, Chinese Academy of Sciences (CAS), ChinaReviewed by:
Jue Li, Chongqing Jiaotong University, ChinaZhiwei Zhou, University of Chinese Academy of Sciences, China
Copyright © 2023 Chen, Ren, Wang, Cui, Xue, Zheng and Du. This is an open-access article distributed under the terms of the Creative Commons Attribution License (CC BY). The use, distribution or reproduction in other forums is permitted, provided the original author(s) and the copyright owner(s) are credited and that the original publication in this journal is cited, in accordance with accepted academic practice. No use, distribution or reproduction is permitted which does not comply with these terms.
*Correspondence: Junfeng Chen, Y2hlbmp1bmZlbmdAdHl1dC5lZHUuY24=