 Kamal Abdelrahman
 Saddam Ali Hazaea
- Department of Geology and Geophysics, College of Science, King Saud University, Riyadh, Saudi Arabia
One hundred seventy geotechnical boreholes, two geo-seismic profiles of multichannel analyses of surface waves (MASW), and two geoelectrical cross-sections of electrical resistivity tomography (ERT) were carried out in the historical Diriyah urban zone. The borehole samples were analyzed for the geotechnical parameters of the standard penetration test (SPT N-value), the rock quality designation (RQD), and compressive strength (CS). Moreover, P- and S-wave velocities have been calculated. The measured SPT N-value has been corrected to amend the N60 parameter. According to the corrected N60, type, lithological, and soil profiles were divided into five distinct subsurface layers. It is indicated, for all recorded depths, these sediments become denser with depth where the values of N60 increase from 5 to 88 downward. According to grain size distribution, the major part of soil sites is composed of sand and varies from low to medium compressibility. The estimated RQD values range from 5 to 100 indicating rocks with significant variations in their geotechnical and physio-chemical characteristics. Furthermore, the compressive strength varies widely between 152.3 and 1,104.2 kg/cm2, which represents diverse geodynamic behavior under civil engineering constructions. Besides, the range of soil stiffness is indicated by the Shear-wave velocity (Vs) for soil layers, which varies from 171.3 to 456.2 m/s. According to the findings of the MASW profiles, the shear wave velocity is shown to be decreasing in MASW profile 1 between depths of 8 and 14 m, where the values range from 1,000 to 1,500 m/s, indicating a weak zone filled with secondary materials. But line 2 shows how the shear wave velocity decreased from depths of 5 m–11 m, where values ranged from 1,000 to 1,500 m/s, thus indicating a weak zone. The low resistivity zones in ERT cross-sections, which are found at the same depths in MASW profiles, are well associated with these findings. It can be concluded that there are a number of weak zones with varying depths, shapes, and dimensions found in the historical Diriyah urban zone’s near-surface deposits that civil engineers, urban planners, and urban developers should consider before undertaking any construction or developmental work involving civil engineering.
1 Introduction
Historical Diriyah is located 11 km from the city center and 20 km northwest of Riyadh on the banks of Wadi Hanifa. Traditional homes are made of local mud brick and frequently have one or two stories. The current size of historical Diriyah is 7 km2. The historical city of Diriyah is located in the blistering desert, like most other Saudi Arabian cities. Historical Diriyah, also known as the nation’s symbolic birthplace, was home to the first Saudi capital and served as an inspiration for many of the Kingdom’s leaders throughout its history. The medieval city of Diriyah, which also contains the UNESCO World Heritage Site At-Turaif, is home to magnificent mud-brick buildings of the Najdi architectural style. In the 7 square kilometer Diriyah Gate project, a multitude of tourist and recreation destinations are planned that are expected to cost 75 billion Saudi riyals. The Diriyah Gate project helps Saudi Vision 2030 by assisting in bringing in 27 million local and foreign tourists by the year 2030. This will aid the National Tourism Plan, which aims to welcome 100 million visitors from all over the world into the Kingdom. Geotechnical measurements are used in building design laws to define deposits and establish their properties, which has lately become a very important study of deposits close to the surface and an essential function in the design ground motions of the structure’s design codes (Alhumimidi, 2020).
Evaluating the Historical Diriyah site requires assessing the geotechnical properties of geological rock units, and numerous investigations of this kind have been carried out in all major urban areas worldwide (Abdelrahman et al., 2017a; Abdelrahman et al.2017b; Abdelrahman et al.2019a; Abdelrahman et al.2019b; Abdelrahman et al.2020; Abdelrahman et al.2021a; Abdelrahman et al.2021b; Abdelrahman et al.2021c), Stiros and Kontogianni 2009, and Stiros and Pytharouli 2018). Avoiding geotechnical risks and designing appropriate surface and subsurface foundation systems with the help of the determined geotechnical characteristics are both important. And creating a safe environment free from underground threats to buildings. In the future, this will be a useful guide for assessing the area’s near-surface dangers. The main objectives of this study are to evaluate the near-surface rock quality and identify weak spots that should be avoided during construction. The idea of soil site classes was first forth by Borcherdt et al., in 1994.
Masoud and Abdel Aal (2019) used three-dimensional geotechnical modeling to analyze the soils in Riyadh City. The foundation for calculating geotechnical parameters was a variety of comprehensive and factual research that was used to produce conceptual geotechnical models. An assessment of rock mass characteristics and geotechnical variables will enable a reliable, safe, and effective design, and many such studies have been carried out globally (Almajed et al., 2021). Western Riyadh City and southern Khamis Mushait City in southwest Saudi Arabia’s Almadani, et al. (2015) analysis of geotechnical characteristics for the urban site (Almadani, et al., 2021). The Historical Diriyah area is bounded by latitudes of 24.743225° N and 24.705413° N, and longitudes of 46.556310° E and 46.590642° E, respectively (Figure 1).
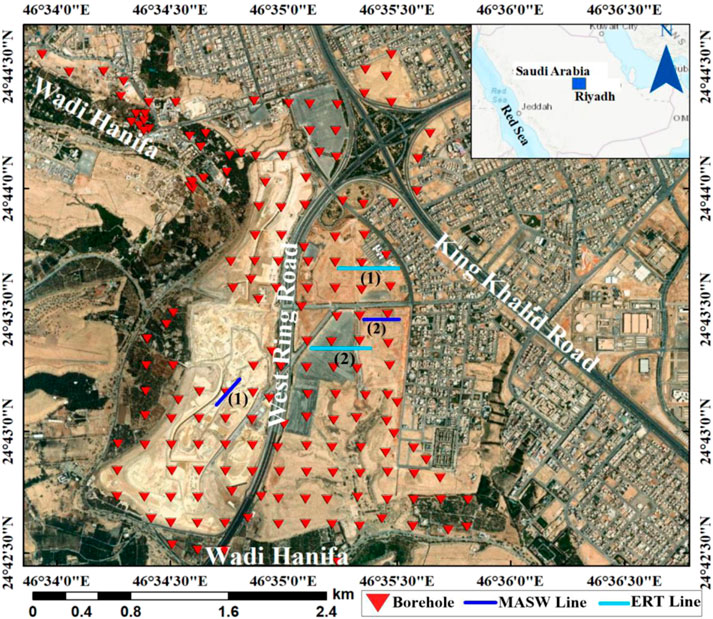
FIGURE 1. Locations of the geotechnical boreholes, MASW, and ERT profiles in the historical Diriyah urban zone.
The research team faced many challenges represented from the beginning including the difficulty of entering and working in the study area due to the presence of a lot of field activities and construction works. We also encountered difficulties during conducting ground surveys, taking field samples, preserving them, wrapping them, and protecting them from weather conditions. We also faced challenges in collecting the many geophysical profiles, which require specific conditions and specifications in order to preserve the quality of the data. In addition to painstaking efforts during the analysis, interpretation, and discussion of the results integrated.
This study has represented the integration of geological, geotechnical, and geophysical datasets that is applied to the study area for the first time. Where the geological dataset is illustrated by a detailed geological map showing the lithological variations, whereas the geophysical data will do through seismic shear wave velocity models, and geoelectrical cross-sections of electrical resistivity tomography (ERT).
1.1 Riyadh’s geotechnical problems with rock and soil
The majority of the Quaternary Wadi deposits in Riyadh’s eastern and central zones make up about 30% of the city. These deposits, which contain clay, silt, sand, and gravel, are of fluvial or aeolian origin. Under Banban, there are 1 m of interbedded gravels with weathered limestone and solution-collapse breccia that gradually climb to 9 m at the third industrial zone to the southeast. Fragments of limestone are frequently observed. The less resilient soft and porous breccia of the collapsing carbonate layers has collapsed due to the near-surface anhydrite’s dissolution (Rahim, 1981). The channel courses were subject to many changes over time during the late Tertiary and Quaternary wet eras, and these were deposited as a conflux of various Wadi channels coming in from the west and north. This type of soil presents various construction challenges because of its high permeability, especially in areas where a sound rock bed is present beneath the soil (Masoud, and Aal, 2019). Other frequently troublesome soil types in the Riyadh area include loessal, collapsing, and shrinking soils. Collapsing soils are alluvial wadi deposits with a majority of sand and varying quantities of gravel, silt, and clay.
2 Geological setting of the study area
Geologically, the region around Riyadh is underlain by Mesozoic to Cenozoic sedimentary rocks from the Arabian shelf, which is often covered by Quaternary deposits of gravel, sand, silt, and clay (Al-Othman, 2002). Mostly cryptocrystalline limestone and calcareous limestone are interspersed in these strata. Depending on the amount of weathering, rocks fracture to varying degrees, and later dissolution inside the rock causes the production of small voids as well as some larger voids. Northwest of Riyadh, the historical Diriyah region is part of the Jubaila, Hanifa, Sheet Gravel, Alluvium, and Arab formations (Steineke and Bramkamp, 1952; Vaslet et al., 1991a; Figure 2). A massive lime mudstone lower unit and a smaller top granular rock unit make up each of the lower, middle, and upper portions of the Jubaila Formation (Upper Jurassic) in central Saudi Arabia (Basyoni et al., 2013). The Jubaila limestone is a very hard limestone that lies between two softer strata. The Jubaila limestone is divided between upper and lower units with a thickness of 116 m to the east and west of Wadi Hanifa (Manivit et al., 1985).
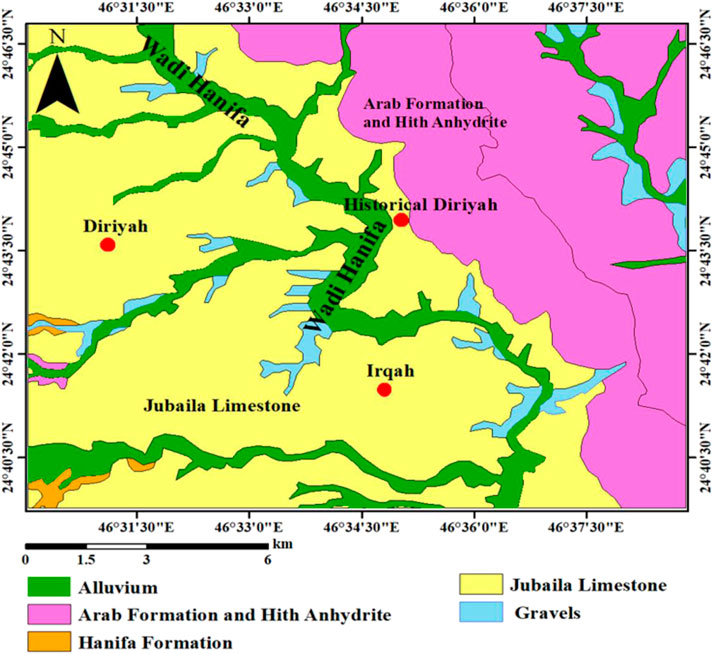
FIGURE 2. Geologic map of the historical Diriyah (modified after Vaslet et al., 1991).
A prominent scarp that is frequently over 75 m high and produced by lower beds tops the Hanifa Formation (Powers et al., 1966). Although the limestone is mainly aphanitic and calcarenitic, there are some exceptionally durable layers of clean-washed lime sand (calcarenite) in the center and northern portions. In the Jubaila to the south, there are notable lateral changes that include an abrupt switch from limestone to dolomite in the formation’s highest part, followed by a switch from limestone to sandstone, and finally a return to limestone in the lower portion. To the north, limestone changes to dolomite and sandstone at a comparable but slower rate. However, dolomite does flow stratigraphically downhill along strike, often with interbeds of calcarenite and calcarenitic limestone, replacing the upper Jubaila in the north and the bottom part of the sequence in the south (Powers et al., 1966). Due to the loss of anhydrite, the Upper Jurassic Arab Formation comprises four carbonate-evaporite members; nevertheless, the middle and higher Arab Members (Arab C, B, and A) are difficult to differentiate from one another (Sharief et al., 1991). When the formation shifted from tan aphanitic limestone below to massive anhydrite of the Hith above, the anhydrite separators were identifiable because the carbonates and their underlying anhydrite comprise four major deposition cycles, which closely correlate to a time-stratigraphic unit (Powers et al., 1966).
The fill material depth in the area under investigation is close to 3 m. The study location is south of a valley deposit that contains diverse sediments down to a depth of 35 m, and the research region is home to a diversity of rock formations (sandy lean clay, silty sand, silty gravel with, poorly graded sand, silty gravel with sand and silty sand with gravel). The study area is largely composed of limestone, which helps to create the Jubaila and Arab formations. The study region also features a valley deposit in the northwest that is 35 m deep and made up of a variety of sediments. The sediments in this valley deposit are very similar to those found in the valley in the southern part of the study area (Figure 3). The fence diagram includes several details that show the thickness and types of the deposit as well as how the sediments spread deeper. Also, it divided the region into little squares so that we could identify and learn about the rocks from the shown sediments (Figure 4).
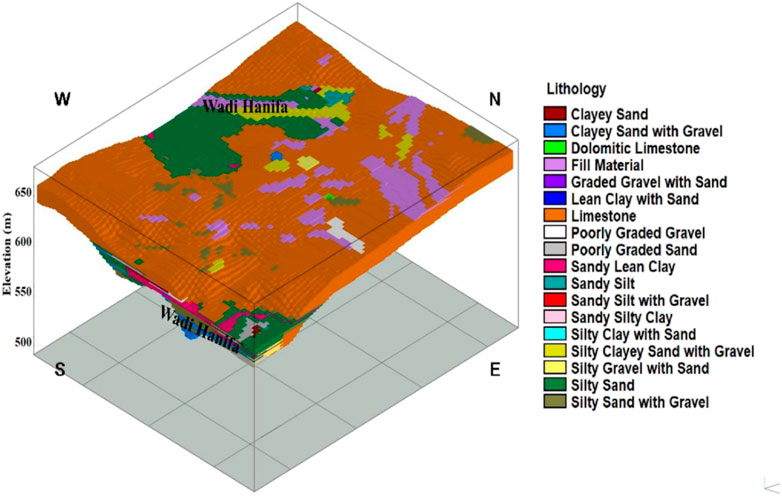
FIGURE 3. 3D diagram showing the lateral variations of lithology in the historical Diriyah urban zone.
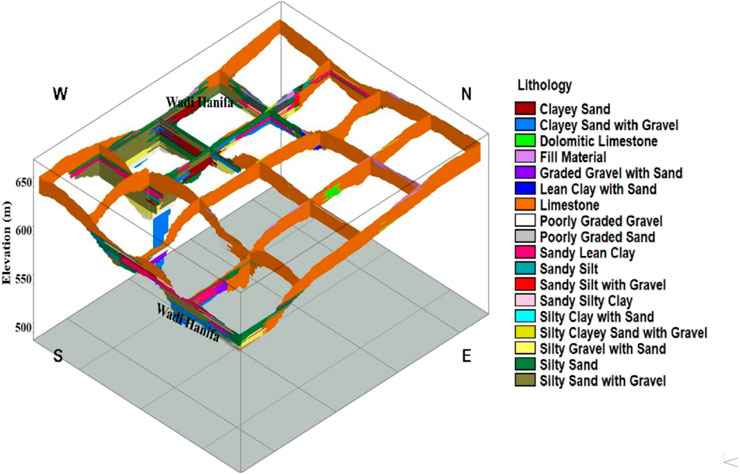
FIGURE 4. 3D Fence diagram showing vertical variations of the lithological setting of the historical Diriyah zone.
3 Materials and methods
The Standard Penetration Test (SPT) is widely used to determine the properties of soil in the field. At the historical Diriyah, a standard penetration test (SPT) was performed on 300 samples from 30 boreholes, a rock quality designation test (RQD) on 477 samples from 140 boreholes, and a compression strength test on 129 samples from 115 boreholes (CS). Two-dimensional (2D) models of the SPT, RQD, and CS were produced using the Surfer software. A borehole measuring 100 mm in diameter will be used to place a split spoon sampler into the soil between the depths of 15 and 35 m. The action involves dropping a 63.5 kg hammer onto a drill rod from a height of 750 mm. The number of hits N required to penetrate 300 mm is known as the penetration resistance. Not considered are the blows for the first 150 mm of penetration. It is important to remember that the standard penetration number “N” differs for similar soil profiles at a given depth depending on a number of different factors. Among these crucial variables are the SPT hammer efficiency, drill diameter, sample approach, rod length, water table, and overburden pressure. Usually, SPT is carried out every 1.5 m or anytime the strata shift. If the N number is found to be larger than 100 when evaluating hard formations, the test is terminated.
For field procedures (Energy Correction), the use of the SPT correction factor is always suitable. For cohesive soil, field procedure corrections are sufficient in place of overburden pressure correction (Rahman, 2020). It is appropriate, based on field observations, to standardize the field SPT number as a function of the driving energy input and its dissipation around the sampler and in the surrounding soil. By converting the measured N to N60 as shown below, the discrepancies in testing methods may be at least somewhat accounted for (Skempton, 1986);
Where, EH = Hammer efficiency; CB = Borehole diameter correction; CS = Sampler correction; CR = Rod length correction; N60 = Corrected SPT N-value for field procedures; N = Field-Measured SPT N-Value.
3.1 Rock quality designation (RQD)
The most popular techniques for classifying rock masses rely heavily on RQD. Deere et al. (1967) invented the RQD in order to offer a quantitative assessment of the rock mass quality using drill core logs. The proportion of unbroken core fragments greater than 100 mm (4 in) in length in the entire core is known as RQD. The core should be drilled using a double-tube core barrel and should be at least NW size (54.7 mm or 2.15 in diameter). Eq. 2 summarizes the proper formula for measuring the length of core pieces and calculating RQD (Deere, 1964; Deere, 1989).
RQD is a directionally dependent metric, and depending on the borehole orientation, its value may alter dramatically. It is meant to depict the in-situ character of the rock pile. Care must be taken when employing diamond core drilling to make sure that fractures brought on by handling or the drilling process are noted and excluded when figuring out the value of RQD. Table 1 lists the classification of rocks according to Deere. In this study, 460 samples were collected and logged to show the RQD index during the coring process.

TABLE 1. RQD classification index (Deere, 1989).
3.2 Compressive strength
Compressive strength is a constrained level of compressive stress that causes ductile failure (infinite theoretical yield) or brittle failure in a material (rupture as the result of crack propagation, or sliding along a weak plane). On materials, parts, and structures, compressive strength is measured. The degree of uniaxial compressive stress that a material reaches when it totally fails is, by definition, its ultimate compressive strength. The particular test procedures and measurement conditions have an impact on compressive strength measurements. Typically, compression strengths are provided in accordance with a particular technical standard.
A is the initial cross-sectional surface area, and F is the force or load at the point of failure.
3.3 P- and S wave velocities
An essential input factor for dynamic ground analysis is shear wave velocity. Vs and N60 for all types of soil (Tsiambaos and Sabatakakis, 2011);
In this study, the equation of Bery and Saad (2012) has been used to determine the P-wave velocity from the borehole for the four layers, with a regression coefficient of 0.8377 (83.77%) as follows:
3.4 Grain size distribution
Determine the sizes of the many particles that make up a specific unconsolidated sedimentary deposit, sedimentary rock, archaeological locus, or soil unit using a sedimentological analysis known as grain size. By drawing conclusions from the sizes of the sediment particles studied and their distributions, the major objective of this approach is to identify the type of environment and energy associated with the transport mechanism at the time of deposition. Grain size analysis is a fundamental tool for classifying unconsolidated materials and sediments, sedimentary rocks, and sedimentary environments. Quantitative analysis of the percentages of different particulate sizes yields one of the most fundamental physical properties of clastic sediments and sedimentary rocks (Udden, 1914; Wentworth, 1922).
3.5 Liquid limit (LL) and plasticity index (PI)
The moisture level at which soil starts to flow and behave like a liquid is known as the liquid limit. In order to determine the liquid limit of soils, it is customary to conduct at least three random tests, each with a different moisture content. Use one of the following formulae to get the liquid limit for each specimen with water content (US Army Engineer Waterways Experiment Station, & United States. Army. Corps of Engineers, 1958):
where N = number of blows WN = Moisture content at N blows tan β = Slope of the flow curve when plotted on logarithmic paper.
3.6 Plasticity index (PI)
Plasticity is an inherent property of fine-grained soil. Conventionally, the plasticity of soil is represented through an index called the plasticity index. The plasticity index is the magnitude of the water content range over which the soil remains plastic. PI is the difference between LL and PL (Wroth and Wood, 1978);
where, PL is Plastic Limit defined as the moisture content in percentage, at which a cohesive Soil will change from a plastic state to a semisolid state; LL= Liquid limit.
3.7 Multi-channel analysis of surface waves (MASW)
The seismic exploration method known as MASW was originally used in geophysics by (Park et al., 1999). One of the seismic survey techniques for determining the elastic condition (stiffness) of the ground for geotechnical engineering purposes is the multichannel analysis of surface waves (MASW) approach. For a variety of geotechnical investigations, using surface wave propagation to get shear wave velocities (Vs) profiles have proven to be a promising technique (Soupois et al., 2007; Almalki et al., 2011; Busato et al., 2016; Liu et al., 2016; Shen et al., 2016; Aldahri et al., 2017; Rahimi et al., 2018; Cardarelli et al., 2018; Hu and Liu, 2019; Mogren et al., 2020; Sena Lozoya et al., 2020; Alamri et al., 2020; Alzahrani et al., 2021a; Alzahrani et al., 2021b; Alzahrani M. et al., 2022; Abd El-Raouf et al., 2021 and; Abd El-Raouf et al. 2022). These investigations mainly include building-ground studies, site assessment, determination of the physical properties of rocks and delineating subsurface cavities and weak zones, etc.
3.8 Electrical resistivity tomography (ERT)
ERT is now mainly carried out with a multi-electrode resistivity meter system. Such surveys use a number of electrodes laid out in a straight line with constant spacing. A computer-controlled system is then used automatically to select the active electrodes for each measure (Griffith and Barker, 1993; Dahlin, 1996). Successful case studies demonstrating cavity detection using ERT conducted in a karst area in Muan-gun, Jeollanam-do, Korea were reported by Kim et al. (2007), Song et al. (2011), and Yi et al. (2011). In this region, over-pumping of water from underground cavities formed by limestone dissolution resulted in a decline in the water table and in the frequent occurrence of ground subsidence. The general methodological chart is illustrated in Figure 5. Arc Map is used to create the location and Geological Maps, Rockworks is used to create a Fence diagram, and Surfer Golden software is used to create Geotechnical maps. Moreover, the software of RES2DINV and Prosys ll are used for ERT processing. In addition, ParkSEIS software is used for MASW Processing.

FIGURE 5. The general methodological chart illustrating the workflow in this study.
4 Results and discussion
The soil and rocks were separated in each of the five layers shown in Figure 5; the black dashed line separating them shows a structure based on SPT values, where the soil values range from 5 to 50 and the rocks from 50 to 90. Figure 6 shows that the two layers at a depth of 3 m and 4.5 m include a substantial amount of sedimentation, which causes the values of SPT to fall, where the values of SPT vary from 5 to 44. This is due to the presence of two wades, one in the northwest and the other in the south. While sediments are still present in the northwest and south, where SPT values vary from 18 to 46, the third layer, which is at a depth of 6 m, shows a drop in the amount of soil and the emergence of rocks. The fourth and fifth layers, which are found at depths of 7.5 m and 9 m, respectively, and where the values of SPT vary from 23 to 48, provide a clearer picture of the rocks’ appearance. A rise in SPT levels is the reason for this.
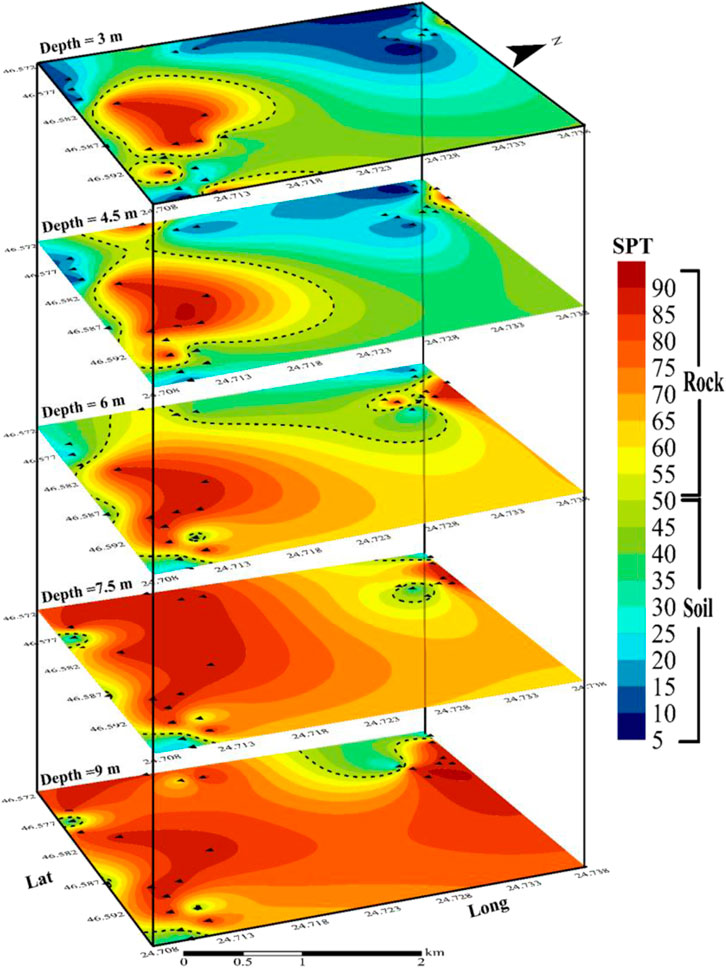
FIGURE 6. Variations of the standard penetration test (SPT) for soil layers at different depths.
The ratio of the length of the core run to the total length of sound core pieces that are 4 inches (10.16 cm) or longer is known as the rock quality designation (RQD). At a depth of 3 m southeast of the research location, low rock quality values were discovered; the values varied from 5% to 25%, suggesting that the rocks in that direction are inferior (very poor). Moreover, low rock quality values of 25%–50% were discovered at various depths in the northeast of the research zone, indicating that the rocks in that direction are of poor quality (poor). When working in low RQD soils, precautions against instability should be considered. Although there are good concentrations of rock quality in the bulk of the analyzed areas, the favorability for construction is highest in places with high RQD values, as shown in Figure 7. The layers demonstrate a southern gradient in rock quality, pointing to the presence of fractures and voids in the rocks. In addition, towards the northeast and southeast of the study zone, all rock layers are of lower quality.
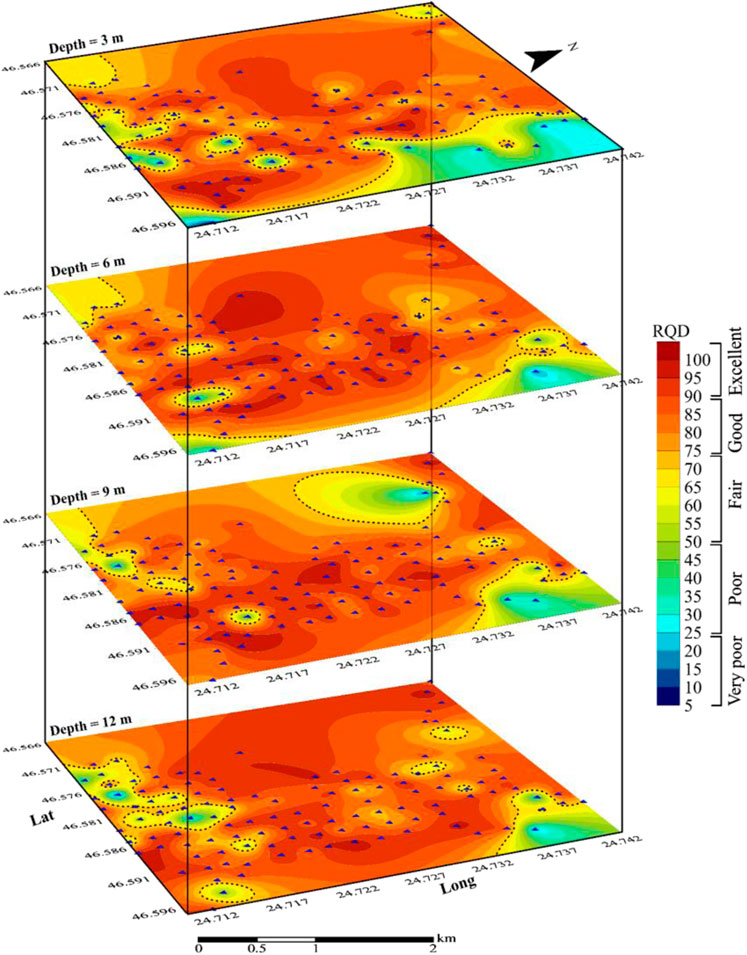
FIGURE 7. Distribution of the Rock quality designation (RQD) for rock at different depths.
According to Deere 1989, Figure 8 displays low compressive strength values. It is noticeable that CS 400 kg/cm2, which denotes poor rock quality, was found in the research area’s middle region (RQD). The eastern and northeastern zones showed high values where CS > 750 kg/cm2, indicating good to exceptional rock quality categorization (RQD). In the remaining portions, intermediate values of 400–CS-750 kg/cm2 were found, reflecting a medium rock grade rating (RQD). It is observed that weak zones are present across the area, as shown by the low compressive strength values found at various depths (cavities, sinkholes). The depth of the dissolving soil can go as deep as 16 m in the northwest of the research area and as high as 11 m in the south to southeast, according to a correction process N to N60 for the existence of a sedimentary valley, as illustrated in Figure 9.
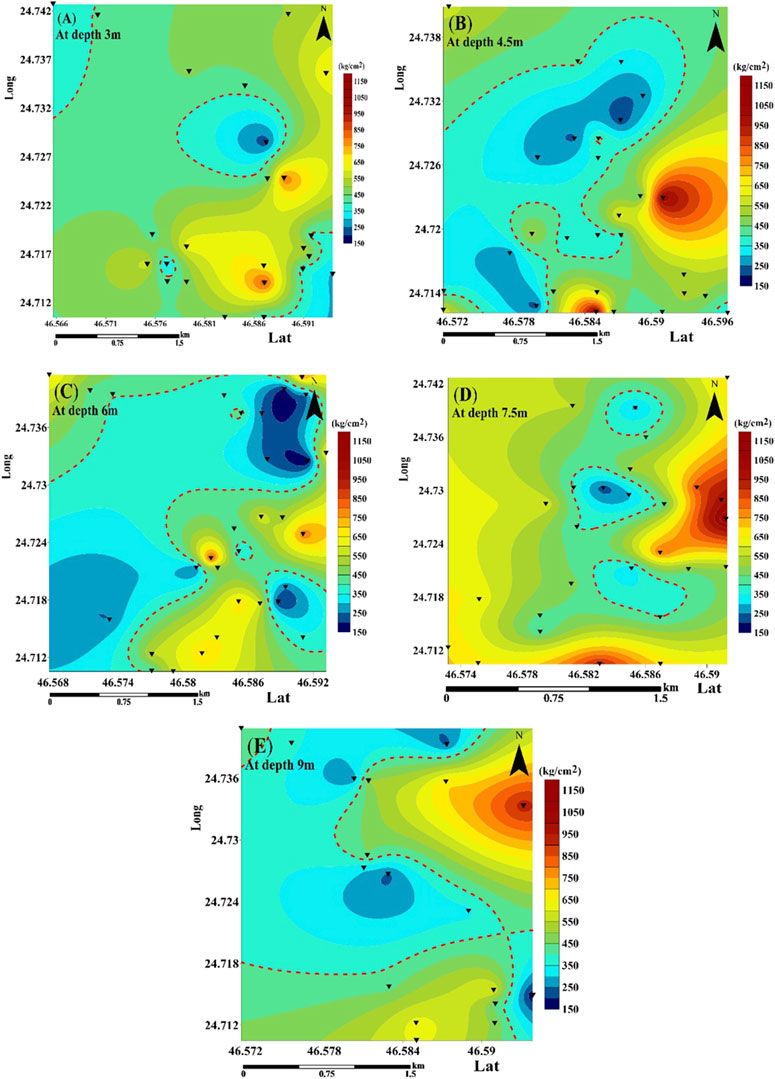
FIGURE 8. Distribution of the compressive strength for rock at different depths. (A) at 3-meters depth; (B) at 4.5 meters depth; (C) at 6.0 meters depth; (D) at 7.5 meters depth; (E) at 9.0 meters depth.
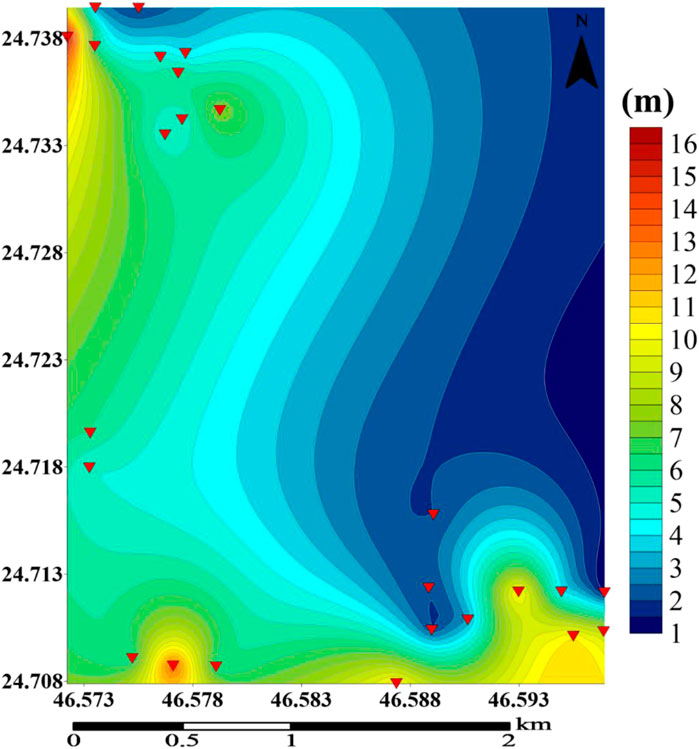
FIGURE 9. Variations of the thickness of soil (where N60< 50), (the red overturned triangles show the locations of boreholes in the soil striping zones).
Shear wave velocities are measured in the range of 170–470 m/sec. Sediments are noticeable in the northwest of the study area, where shear wave velocities vary from 170 to 330 m/s, as well as in the far south of the study area. The equation above is used to compute the shear velocity from N60. As a depth, shear wave velocities rise while those in the first 3 m fell. The shear wave velocity is shown to increase with depth through the strata in Figure 10 until it reaches a value of 470 m/s, suggesting that the sediments have solidified and are about to become rock. The northern portion of the land is covered with Vs 180 m/s (class E) and extends to 4.5 m deep, indicating soft soil, according to NEHRP recommendations from 2003. At a depth of 6 m, stiff soil emerged as 180 Vs 360 m/s (class D). At a depth of >6 m, the soil of 360 Vs 470 m/s (class C) became visible, exposing very dense soil and soft rock.
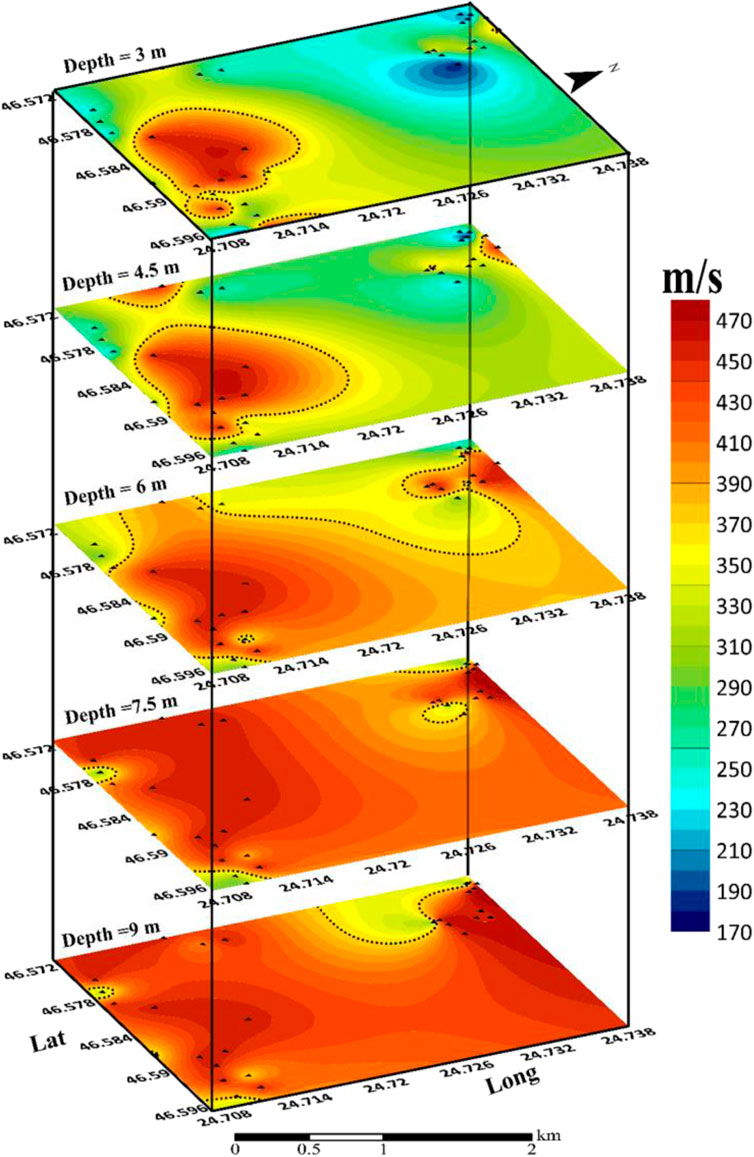
FIGURE 10. Shear wave velocity variations (Vs) for soil layers at different depths.
The area of interest, generally, has ground fissures, some of which extend 12 m below the surface. The fact that the P -wave velocity falls in a southeast direction, with a value of 100 at a depth of 3 m that indicating the rock quality is very poor, while in a northeasterly direction, with a value of 500, and this decrease lasts until a depth of 12 m shows that the rock quality is poor. In the first 3 m of the study area, the P-wave velocity falls in a southern direction, reaching 700. The occurrence of these fractures throughout all levels generally denotes that the limestone rock in the area was dissolved by the infiltrated water between the layers as depicted in Figure 11.
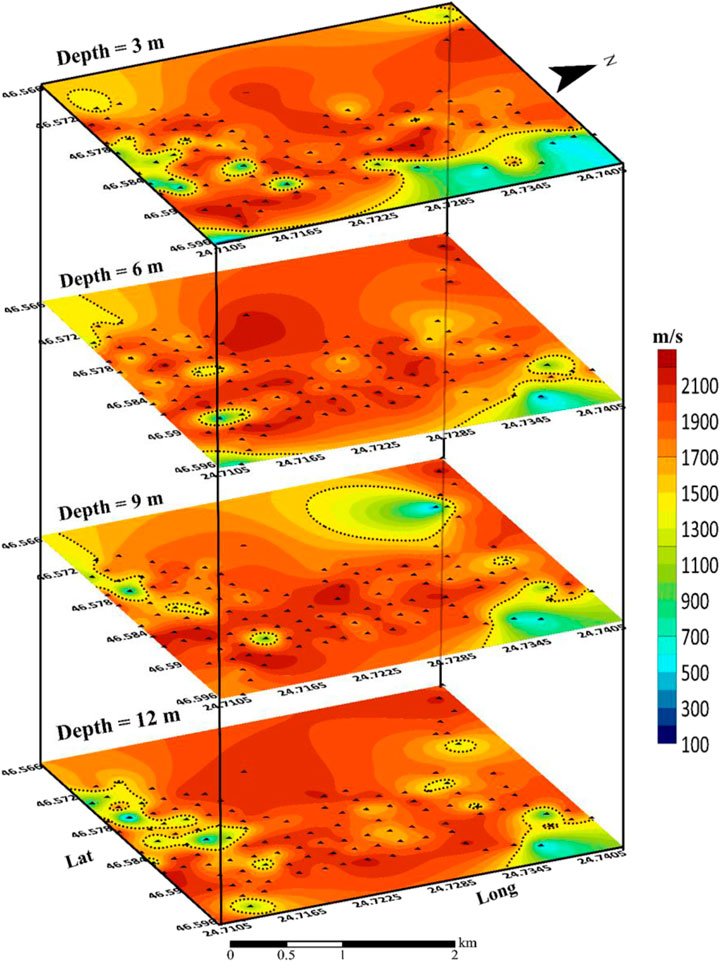
FIGURE 11. Variations of P-wave velocities (Vp) for rock layers at different depths.
According to the classification of soil types by Garcia and Frankenstein (2015), the study area is made up of fine-grain soil (clay and silt), where the grain size is less than 0.4 mm, and sand soil, where the grain size ranges from 0.4 to 4.75 mm. Figure 12A depicts the locations of grain size distribution in the study area. Gravels with a grain size of more than 4.75 mm. Sand is therefore the primary component, as shown in Figure 12B. Figure 13A depicts the distribution of liquid limit and plasticity index sample locations across the research area; the corresponding ranges of values for these variables are 24.0%–37.0% and 10.0%–17.0%, respectively. According to Figure 13B, the study area’s soil behavior ranges from low to medium compressibility.
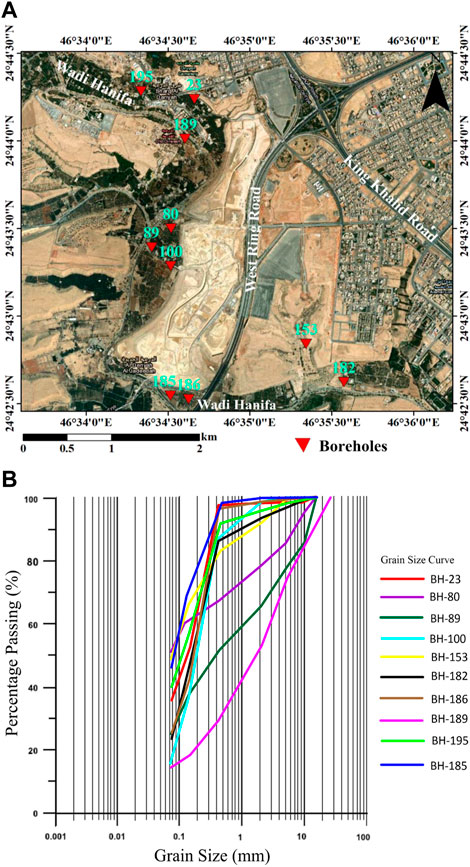
FIGURE 12. (A) Locations of grain size distribution to study area in the historical Diriyah urban zone. (B) Variations of grain size of soil at depth 4 m.
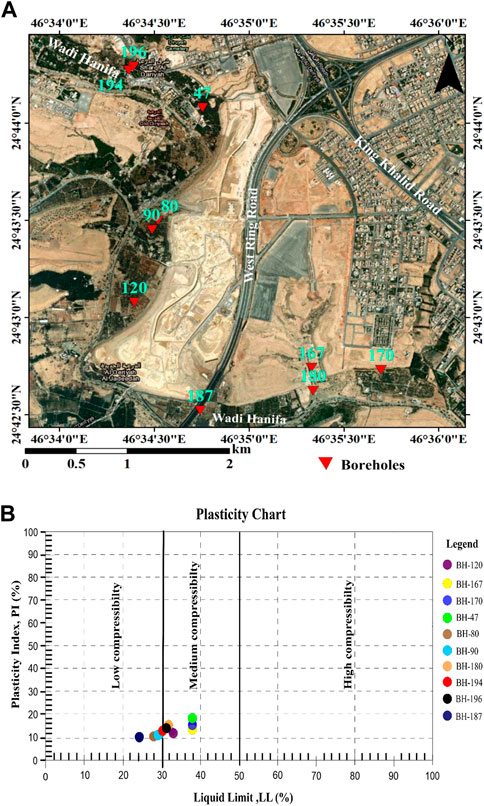
FIGURE 13. (A) Locations of liquid limit and plasticity index samples distribution in the historical Diriyah urban zone. (B) Variations of liquid limit and plasticity index of soil at depth 4 m.
Shear wave velocity from seismic is decreasing at depths 8 m–14 m in MASW profile No. 1 where the values varied from 1,000 to 1,500 m/s indicating a weak zone (cavities, sinkholes, fractures, fissures, etc.), filled with less competent materials. Although shear wave velocity is increasing at depths 15 m–30 m where the results ranged from 1,500 to 2,700 m/s that indicated compact limestone. Moreover, the MASW profile No. 2 the shear wave velocity is decreasing from depths 5 m–11 m where, the values varied from 1,000 to 1,500 m/s indicating a weak zone (Cavities, Sinkholes), filled with secondary materials. Although shear wave velocity increases at depths 11 m–30 m where the values ranged from 1,500 to 2,400 m/s that suggests compact limestone illustrated in Figure 14. The RES2DINV resistivity inversion software (Loke, 2002) was utilized in the investigation to invert the apparent resistivity data automatically. The least-square fitting technique (Loke and Barker, 1996) was utilized to find the best fit for the resistivity model through iterations. Three iterations were made in each case, with RMS errors of less than 5%. In addition to each profile, the findings of the inverse models are shown as cross-sections showing the real resistivity distribution of the subsurface with depth. The models display a variety of zones with low and relatively high resistivities.
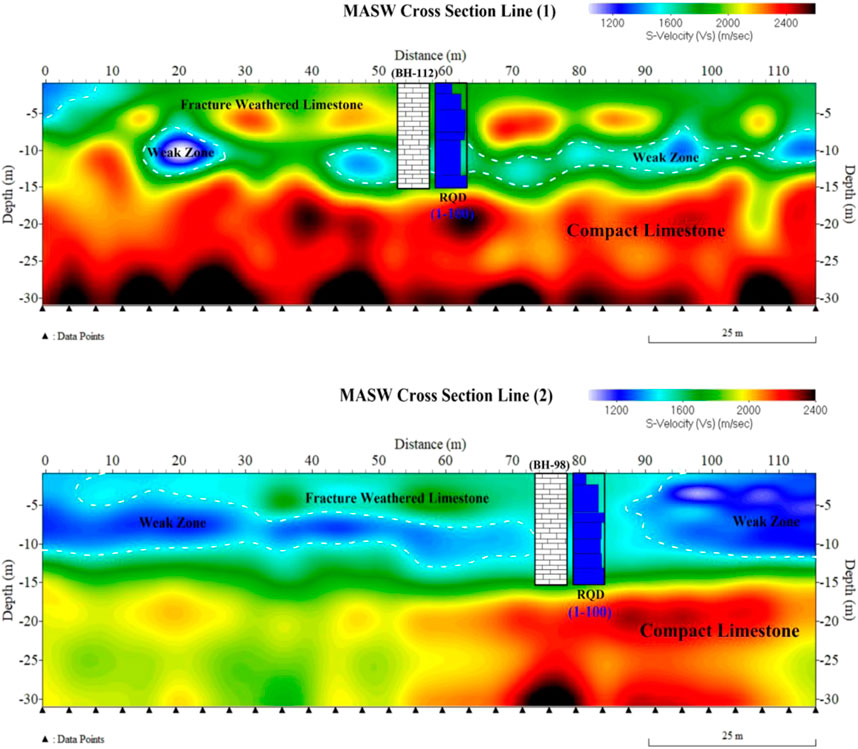
FIGURE 14. MASW Geoseismic cross-sections of historical Diriyah urban zone.
A modest region of low resistivity (less than 110 m) is spread over the entire profile in ERT cross-section No. 1 (Figure 15). They start at 10 m below ground level and descend to 33 m, whereas the principal potential zone covers the center portion of this profile. These zones have different depths, forms, and connections and might be circular, oval, or triangular in shape. The high resistivity sites in this profile keep the low resistivity zones apart, preventing them from joining. Cross-section No. 2 (Figure 15) contains many sites with low resistivity (110 m), although they are spread out over a wide range of depths and sizes. It should be noted that the eastern region’s low resistivity zones extend 10 m below the surface. All throughout the structure are these zones of low resistivity, which first show in the center at a depth of 10 m and continue to a depth of 33 m on either side of a region of high resistivity (>1,000 m). Zones with low resistivities cover the compacted limestone in the western part, starting at ground level and extending up to 10 m.
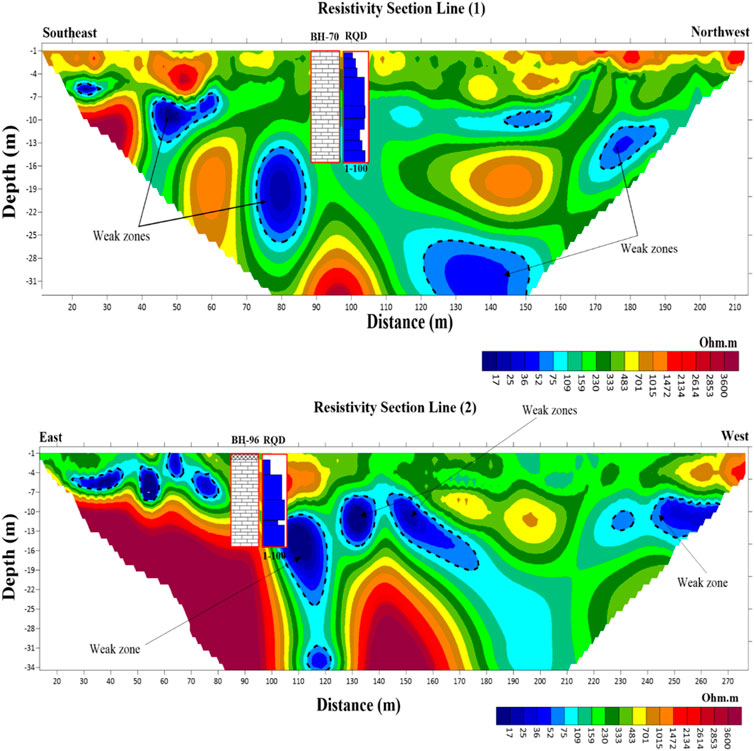
FIGURE 15. ERT geoelectric cross-sections of historical Diriyah urban zone (after Alzahrani H. et al., 2022).
The numerous tests of great soil samples of near-surface in the study area through several ground investigations showed that the nature of the land changes sideways and vertically, which reflects the presence of cavities or weakness zones throughout the study area at various depths and with different characterizations. These features naturally occur in such types of limestone rocks and calcareous soils (Alharbi et al., 2015; Al-Malki et al., 2015; Fnais et al., 2015; Alyousef et al., 2015a and; 2015b).
5 Conclusion
The majority of the historical Diriyah urban zone is composed mainly of limestone rocks. While there are two zones of low-land strips (branches of wadi Hanifah) bordering the northwestern and southeastern edges of the development area. Both strips are filled with a variety of deposits with soil that descends to a depth of 35 m. The results of the standard penetration test (SPT) show that the lowest values in soil strips are around 5 and extend downward to 10 m in depth. In spite of that, the general values increased with depth until they reached limestone rocks, SPT values range for the soil from 5 to 48, increasing with depth, and weak zones are recorded at various depths. Moreover, the SPT values rise with depth, reaching values between N60 and 87. The relationship between the designation of rock quality and the compressive strength of rocks is directly proportional, i.e., the better the quality of the rocks, the higher the compressive strength, as shown in Figures 6, 7, which show compressive strength and rock quality, respectively. At various depths, low RQD values were observed, indicating weak zones (sinkholes, fractures, fissures, etc.). The central zone of the study area was encompassed by the low compressive strength values at various depths. Low shear wave values are obtained at various depths exposing weak zones, whereas the shear wave velocities range from 170 to 470 m/s. Fines, sand, and gravel are among the three forms of soil, with sand having the biggest share. Low to medium compressibility range for liquid limit and plasticity index.
In depths of 8–14 m in line 1, shear wave velocity from seismic is decreasing, with values ranging from 1,000 to 1,500 m/s, indicating a weak zone (Cavities, Sinkholes) filled with secondary materials. At depths between 15 and 30 m, shear wave velocities increased and ranged from 1,500 to 2,700 m/s, indicating compact limestone. The shear wave velocity is decreasing along line 2 at depths of 5–11 m, which indicates the presence of a weak zone (Cavities, Sinkholes) packed with secondary materials. Figure 15 demonstrates that shear wave velocity is rising between 11 and 30 m below the surface, where values ranged from 1,500 to 2,400 m/s, indicating compact limestone. These zones have different depths, forms, and connections and might be circular, oval, or triangular in shape. The high resistivity sites in this profile keep the low resistivity zones apart, preventing them from joining. Line 2 in Figure 15 shows a dense pattern of the low resistivity (110 m) sites, however, these sites can be found at other depths and in different configurations. It should be noted that the eastern region’s low resistivity zones extend 10 m below the surface. All throughout the structure are these zones of low resistivity, which first show in the center at a depth of 10 m and continue to a depth of 33 m on either side of a region of high resistivity (>1,000 m). In the western part, areas of compacted limestone are covered with low resistivity zones that start at ground level and last up to 10 m. At varied depths and extensions, numerous weak zones are found in distinct places. Sinkholes, fractures, and fissures in the limestone rocks could be these weak zones. Before beginning civil engineering work at the historic Diriyah Gate region, civil engineers, urban developers, and planners should take these results into consideration Deere, 1964; Safety, 2003; Borcherdt et al., 2012; Aldahri et al., 2018.
Data availability statement
The original contributions presented in the study are included in the article/supplementary material, further inquiries can be directed to the corresponding author.
Author contributions
All authors listed have made a substantial, direct, and intellectual contribution to the work and approved it for publication.
Funding
The authors extend their appreciation to the Deputyship for Research and Innovation, “Ministry of Education” in Saudi Arabia for funding this research (IFKSUOR3-192-1).
Conflict of interest
The authors declare that the research was conducted in the absence of any commercial or financial relationships that could be construed as a potential conflict of interest.
Publisher’s note
All claims expressed in this article are solely those of the authors and do not necessarily represent those of their affiliated organizations, or those of the publisher, the editors and the reviewers. Any product that may be evaluated in this article, or claim that may be made by its manufacturer, is not guaranteed or endorsed by the publisher.
References
Abd El-Raouf, A., Iqbal, I., Meister, J., Abdelrahman, K., Hassan, A., and OsmanOsman, M. (2022). Earthflow reactivation assessment by multichannel analysis of surface waves and electrical resistivity tomography: A case study. Open Geosci. 13 (13), 1328–1344. doi:10.1515/geo-2020-0310
Abdelrahman, K., Abdullah, A.-A., Al-Otaibi, N., Fnais, M., and Abdelmonem, E. (2019a). Ground motion acceleration and response spectra of Al-Mashair area, Makkah Al-Mukarramah, Saudi Arabia. Arab. J. Geosci. 12, 346. doi:10.1007/s12517-019-4526-6
Abdelrahman, K., Al-Amri, A., Al-Arifi, N., and Abdelmoneim, E. (2017a). Seismic risk assessment at the proposed site of gemsa wind power station, south-Western coast of gulf of Suez, Egypt. J. Geol. Soc. India 89, 192–196. doi:10.1007/s12594-017-0583-1
Abdelrahman, K., Al-Amri, A., Al-Otaibi, N., and Fnais, M. (2020). Geotechnical assessment for the ground conditions in makah Al-mukarramah city, Saudi Arabia. J. King Saud. Univ. – Sci. 32, 2112–2121. doi:10.1016/j.jksus.2020.02.011
Abdelrahman, K., Al-Amri, A., Al-Otaibi, N., and Abdelmonem, E. (2019b). Naif Al-otaibi, mohammed Fnais and enayat abdelmonem (2019): Ground motion acceleration and response spectra of Al-mashair area, makkah Al-mukarramah, Saudi Arabia. Arabian J. Geosciences 12, 346. doi:10.1007/s12517-019-4526-6
Abdelrahman, K., and Al-Otaibi, N. (2021b). Naif Al-Otaibi, Elkhedr Ibrahim (2021b): Environmental hazard assessment for ground failure in Jeddah city, Western Saudi Arabia, through cross-hole seismic testing. J. King Saud Univ. – Sci. 33, 101274. doi:10.1016/j.jksus.2020.101274
Abdelrahman, K., and Al-Otaibi, N. (2021c). Naif Al-Otaibi, Elkhedr Ibrahim (2021c): Assessment of land subsidence as an environmental threat facing Dammam city, eastern Saudi Arabia based on soil geotechnical parameters using downhole seismic approach. J. King Saud Univ. – Sci. 33, 101233. doi:10.1016/j.jksus.2020.101233
Abdelrahman, K., Fnais, M., Enayat, A., Khaled, M., and Saadoon, A. B. (2017b). Seismic vulnerability assessment in the new urban area of Diriyah Governorate, Riyadh, Saudi Arabia. Arab. J. Geosci. 10, 434. doi:10.1007/s12517-017-3222-7
Abdelrahman, K., Qaysi, S., Mogren, S., Zaidi, F., and Ghrefat, H. (2021a). Elkhedr ibrahim, saleh qaysi, Saad mogren, faisal zaidi and habes ghrefat (2021a): Evaluation of kinetic moduli and soil competence scale of soil profiles in jizan area, southwestern Saudi Arabia. Arabian J. Geosciences 14, 172. doi:10.1007/s12517-020-06376-6
Al-Malki, M., Fnais, M., Al-Amri, A., and Abdelrahman, K. (2015). Estimation of fundamental frequency in dammam city, eastern Saudi Arabia. Arab. J. Geosci. 8, 2283–2298. doi:10.1007/s12517-014-1337-7
Al-Othman, A. A. (2002). “Environmental study of Wadi Hanifah, Riyadh, with special reference to wastewater disposal and the quality of the stream water, groundwater, and sediments,”. Doctoral dissertation (Cardiff, Wales: Cardiff University).
Alamri, A. M., Bankher, A., Abdelrahman, K., El-Hadidy, M., and Zahran, H. (2020). Soil site characterization of Rabigh city, Western Saudi Arabia coastal plain, using HVSR and HVSR inversion techniques. Arabian J. Geosciences 13, 29. doi:10.1007/s12517-019-5027-3
Aldahri, M., El-Hadidy, M., Zahran, H., and Abdelrahman, K. (2018). Seismic microzonation of Ubhur district, Jeddah, Saudi Arabia, using H/V spectral ratio. Arabian J. Geosciences 11, 113. doi:10.1007/s12517-018-3415-8
Aldahri, M., mogren, S., Abdelrahman, K., Zahran, H., El Hady, S., El-Hadidy, M., et al. (2017). Surface soil assessment in the ubhur area, north of jeddah, western Saudi Arabia, using a multichannel analysis of surface waves method. J. Geol. Soc. India 89, 435–443. doi:10.1007/s12594-017-0626-7
Alharbi, M., Fnais, M., Al-Amri, A., Abdelrahman, K., Andreae, M. O., and Al-Dabbagh, M. (2015). Site response assessment at the city of Al Khobar, eastern Saudi Arabia, from microtremor and borehole data. Arab. J. Geosci. 8, 10015–10030. doi:10.1007/s12517-015-1890-8
Alhumimidi, M. S. (2020). Geotechnical assessment of near-surface sediments and their hazardous impact: Case study of Jizan city, southwestern Saudi Arabia. J. King Saud Univ. Sci. 32 (3), 2195–2201. doi:10.1016/j.jksus.2020.02.031
Almadani, S., Al-Amri, A., Fnais, M., Abdelrahman, K., Ibrahim, E., and El-Motaal, E. A. (2015). Evaluation of geotechnical parameters for urban site in southern Khamis Mushait city, southwest Saudi Arabia, using seismic refraction method. Arabian J. Geosciences 8 (8), 6225–6236. doi:10.1007/s12517-014-1615-4
Almadani, S. A., Abdelrahman, K., and Qaysi, S. (2021). Integrated geoinvestigation for evaluation of an engineering site—A case study from the Western Riyadh city, central Saudi Arabia. Arab. J. Geosci. 14, 380. doi:10.1007/s12517-021-06767-3
Almajed, A., Aldhowian, A., and Abdelrahman, K. (2021). Geological and geotechnical evaluation of limestone rocks along the Riyadh metro project (Riyadh city, Saudi Arabia). Arabian J. Geosciences 14 (2), 89–15. doi:10.1007/s12517-020-06364-w
Almalki, H., El-Werr, A., and Abdel-Rahman, K. (2011). Estimation of near-surface geotechnical parameters using seismic measurements at the proposed KACST expansion site, Riyadh, KSA. Arabian J. Geosciences 4, 1131–1150. doi:10.1007/s12517-010-0124-3
Alyousef, K., Al-Amri, A., Fnais, M., Abdelrahman, K., and Loni, O. (2015a). Site effect evaluation for Yanbu City urban expansion zones, Western Saudi Arabia, using microtremor analysis. Arab. J. Geosci. 8, 1717–1729. doi:10.1007/s12517-014-1310-5
Alyousef, K., Aldamegh, K., Abdelrahman, K., Loni, O., Saud, R., et al. (2015b). Evaluation of site response characteristics of King Abdulaziz City for Science and Technology, Saudi Arabia using microtremors and geotechnical data. Arab. J. Geosci. 8, 5181–5188. doi:10.1007/s12517-014-1542-4
Alzahrani, H., Abdelrahman, K., Qaysi, S., and Al-Otaibi, N. (2021a). Shear-wave velocity profiling of Jizan city, southwestern Saudi Arabia, using controlled-source spectral analysis of surface-wave measurements. J. King Saud Univ. – Sci. 33, 101592. doi:10.1016/j.jksus.2021.101592
Alzahrani, H., Abdelrahman, K., Qaysi, S., and Al-Otaibi, N. (2021b). Shear-wave velocity profiling of Jizan city, southwestern Saudi Arabia, using controlled-source spectral analysis of surface-wave measurements. J. King Saud Univ. – Sci. 33, 101592. doi:10.1016/j.jksus.2021.101592
Alzahrani, H., Abdelrahman, K., and Hazaea, S. A. (2022a). Use of geoelectrical resistivity method for detecting near-surface groundwater potential zones at Riyadh city, Saudi Arabia. J. King Saud University-Science 34 (7), 102253. doi:10.1016/j.jksus.2022.102253
Alzahrani, M., Abdelrahman, K., Alfaifi, A., Al-Otaibi, N., and Aljaber, A. (2022b). Site effect estimation for shallow engineering bedrock using microtremor HVSR method and geotechnical borehole data, Riyadh city, Saudi Arabia. J. King Saud Univ. – Sci. 34, 102285. doi:10.1016/j.jksus.2022.102285
Amr Abd El-Raouf, , Iqbal, I., Meister, J., Abdelrahman, K., Hassan, A., and OsmanBadran, M. (2021). Earthflow reactivation assessment by multichannel analysis of surface waves and electrical resistivity tomography: A case study. Open Geosci. 13, 1328–1344. doi:10.1515/geo-2020-0310
Basyoni, M. H., and Khalil, M. (2013). An overview of the diagenesis of the Upper Jurassic carbonates of Jubaila and Hanifa formations, central Saudi Arabia. Arabian J. Geosciences 6 (2), 557–572. . doi:10.1007/s12517-011-0317-4
Bery, A. A., and Saad, R. (2012). Correlation of seismic P-wave velocities with engineering parameters (N value and rock quality) for tropical environmental study. Int. J. Geosci. 3, 749–757. doi:10.4236/ijg.2012.34075
Borcherdt, G., Glassmoyer, M., and Cranswick, A. E. (2012). Armenia earthquake reconnaissance report: Effect of site conditions on ground motions and damage. Earthq. Spectra Spec. Issue, 23–42. International Building Council (IBC) International Building Code (ISBN: 978-1-60983-039-7.
Busato, L., Boaga, J., Peruzzo, L., Himi, M., Cola, S., Bersan, S., et al. (2016). Combined geophysical surveys for the characterization of a reconstructed river embankment. Eng. Geol. 211, 74–84. doi:10.1016/j.enggeo.2016.06.023
Cardarelli, E., Cercato, M., and De Donno, G. (2018). Surface and borehole geophysics for the rehabilitation of a concrete dam (Penne, Central Italy). Eng. Geol. 241, 1–10. doi:10.1016/j.enggeo.2018.05.008
Dahlin, T. (1992). On the automation of 2D resistivity surveying for engineering and environmental applications. Ph.D. Thesis. Lund University.
Deere, D. U., Hendron, A. J., Patton, F. D., and Cording, E. J. (1967). “Design of surface and near-surface construction in rock,” in Failure and breakage of rock Proc 8th U.S. symp rock mech 237–302. Soc Min Engrs Editor C. Fairhurst (New York, United States: Am. Inst. Min. Metall. Petroleum Engineers).
Deere, D. U. (1989). Rock quality designation (RQD) after 20 years U.S. Army corps engrs contract report GL-89-1 Waterways experimental station. Vicksburg, Mississippi: USACE.
Fnais, M., Al-Amri, A., Abdelrahman, K., Al-Yousef, K., allafouza Loni, O., and Abdel Moneim, E. (2015). Assessment of soil-structure resonance in southern Riyadh City, Saudi Arabia. Arab. J. Geosci. 8, 1017–1027. doi:10.1007/s12517-013-1247-0
García-Gaines, R. A., and Frankenstein, S. (2015). USCS and the USDA soil classification system: Development of a mapping scheme. Vicksburg, Mississippi: USACE.
Griffiths, D. H., and Barker, R. D. (1993). Two-dimensional resistivity imaging and modelling in areas of complex geology. J. Appl. Geophys. 29, 211–226. doi:10.1016/0926-9851(93)90005-j
Hu, J., and Liu, H. (2019). Bayesian network models for probabilistic evaluation of earthquake-induced liquefaction based on CPT and vs databases. Eng. Geol. 254, 76–88. doi:10.1016/j.enggeo.2019.04.003
Kim, J.-H., Yi, M.-J., Hwang, S.-H., Song, Y., Cho, S.-J., and Synn, J.-H. (2007). Integrated geophysical surveys for the safety evaluation of a ground subsidence zone in a small city. J. Geophys Eng. 4, 332–347. doi:10.1088/1742-2132/4/3/s12
Liu, Z., Liu, F., Ma, F., Wang, M., Bai, X., Zheng, Y., et al. (2016). Collapsibility, composition, and microstructure of loess in China. Can. Geotech. J. 53 (4), 673–686. Miller RD et al (1999) Using MASW to map. doi:10.1139/cgj-2015-0285
Loke, M. H. (2002). Rapid 2-D resistivity and IP inversion using the least square method. Geotomo Softw. RES2DINV, Ver. 3.50.
Loke, M. H., and Barker, R. D. (1996). Rapid least-squares inversion of apparent resistivity pseudo-sections by a quasi-Newton method. Geophys. Prospect. 44, 131–152. doi:10.1111/j.1365-2478.1996.tb00142.x
Manivit, J., Pellaton, C., Vaslet, D., Le Nindre, Y. M., Brosse, J. M., Breton, J. P., et al. (1985). Geologic map of the Darma quadrangle, sheet 24 H. Kingdom of Saudi Arabia (with text). Saudi Arabian Deputy Ministry Mineral Resour. Jeddah, Geosciences Map GM-101A, Kingd. Saudi Arab. 133.
Masoud, A. A., and Aal, A. K. A. (2019). Three-dimensional geotechnical modeling of the soils in Riyadh city, KSA. Bull. Eng. Geol. Environ. 78 (1), 1–17. doi:10.1007/s10064-017-1011-x
Mogren, S., Aldahri, M., Abdelrahman, K., and Zahran, H. (2020). Near-surface foundation level assessment from seismic measurements: A case study of north jeddah city, Saudi Arabia. Arabian J. Geosciences 13, 233. doi:10.1007/s12517-020-5233-z
Park, C. B., Miller, R. D., and Xia, J. (1999). Multichannel analysis of surface waves. Geophysics 64 (3), 800–808. doi:10.1190/1.1444590
Powers, R. W., Ramirez, L. F., Redmond, C. D., and Elberg, E. L. (1966). Geology of the arabian peninsula—sedimentary geology of Saudi Arabia. Sunrise Valley Drive Reston, United States: USG Survey Professional Paper. 560-D.
Rahim, K. S. A. (1981). “Strength and formation characteristics of sedimentary rocks,” in Proceedings of the symposium on geotechnical problems in Saudi Arabia, Riyadh, Saudi Arabia, 11-13 May 1981 (King Saud University), 169–200.
Rahimi, S., Wood, C. M., Coker, F., Moody, T., Bernhardt-Barry, M., and Mofarraj Kouchaki, B. (2018). The combined use of MASW and resistivity surveys for levee assessment: A case study of the melvin price reach of the Wood river levee. Engin Geol. 241, 11–24. doi:10.1016/j.enggeo.2018.05.009
Rahman, M. M. (2020). Foundation design using standard penetration test (SPT) N-value. Dhaka, Bangladesh: Bangladesh Water Development Board.
Safety, I. S. N. E. H. R. P. (2003). Recommended provisions for seismic regulations for new buildings and other structures. Washington, United States: Building seismic safety council. FEMA 450.
Sena-Lozoya, E. B. (2020). Seismic exploration survey northeast of the tres virgenes geothermal field, baja California sur, Mexico. Geothermics 84, 101743. doi:10.1016/j.geothermics.2019.101743
Sharief Fa, , Khan Ms, , and Magara K, (1991). Outcrop-sub crop sequence and diagenesis of upper Jurassic Arab–Hith formations, Central Saudi Arabia. JKAU Earth Sci. 4, 105–136. doi:10.4197/ear.4-1.6
Shen, M., Chen, Q., Zhang, J., Gong, W., and Hsein Juang, C. (2016). Predicting liquefaction probability based on shear wave velocity: An update. Bull. Eng. Geol. Environ. 75 (3), 1199–1214. doi:10.1007/s10064-016-0880-8
Skempton, A. W. (1986). Standard penetration test procedures and the effects in sands of overburden pressure, relative density, particle size, ageing and overconsolidation. Geotechnique 36 (3), 425–447. doi:10.1680/geot.1986.36.3.425
Song, S.-H., Lee, G.-S., Um, J.-Y., and Suh, J. –J. (2011). Resistivity imaging using borehole electrical resistivity tomography: A case of land subsidence in karst area due to the excessive groundwater withdrawal. J. Korean Earth Sci. Soc. 32, 537–547. doi:10.5467/jkess.2011.32.6.537
Soupios, P. M., Georgakopoulos, P., Papadopoulos, N., Saltas, V., Andreadakis, A., Vallianatos, F., et al. (2007). Use of engineering geophysics to investigate a site for a building foundation. J. Geophys Eng. 4 (1), 94–103. doi:10.1088/1742-2132/4/1/011
Steineke, M., and Bramkamp, R. A. (1952). Mesozoic rocks of eastern Saudi-Arabia. AAPG Bulletin-American Assoc. Petroleum Geol. 36 (5), 909.
Stiros, S., and Kontogianni, V. (2009). Mean deformation tensor and mean deformation ellipse of an excavated tunnel section. Int. J. Rock Mechan Min. Sci. 46, 1306–1314. doi:10.1016/j.ijrmms.2009.02.013
Stiros, S., and Pytharouli, S. (2018). Interpretations of reservoir-induced seismicity may not always be valid: The case of seismicity during the impoundment of the kremasta dam (Greece, 1965-1966). Bull. Seismol. Soc. Am. 108, 3005–3015. doi:10.1785/0120170359
Udden, J. A. (1914). Mechanical composition of clastic sediments. Geol. Soc. Am. Bull. 25, 655–744. doi:10.1130/GSAB-25-655
Tsiambaos, G., and Sabatakakis, N. (2011). Empirical estimation of shear wave velocity from in situ tests on soil formations in Greece. Bull. Eng. Geol. Environ. 70 (2), 291–297. doi:10.1007/s10064-010-0324-9
US Army Engineer Waterways Experiment Station (1958). Review of soils design, construction, and prototype observations, texarkana dam. Texas, United States: Waterways Experiment Station. (No. 3).
Vaslet, D., Al-Muallem, M. S., Maddah, S. S., Brosse, J. M., Fourniguet, J., Breton, J. P., et al. (1991a). Explanatory notes to the geologic map of the Ar riyad quadrangle. Sheet 24 I, kingdom of Saudi Arabia. Jeddah, Saudi Arabia: Ministry of Petroleum and Mineral Resources.
Wentworth, C. K. (1922). A scale of grade and class terms for clastic sediments. J. Geol. 30 (5), 377–392. doi:10.1086/622910
Wroth, C. P., and Wood, D. M. (1978). The correlation of index properties with some basic engineering properties of soils. Can. Geotechnical J. 15 (2), 137–145. doi:10.1139/t78-014
Keywords: SPT-N, compressive strength, RQD, MASW, ert, historical Diriyah, Riyadh, Saudi Arabia
Citation: Abdelrahman K, Hazaea SA and Almadani SA (2023) Geological-geotechnical investigations of the historical Diriyah urban zone in Riyadh, Saudi Arabia: an integrated approach. Front. Earth Sci. 11:1202534. doi: 10.3389/feart.2023.1202534
Received: 08 April 2023; Accepted: 10 May 2023;
Published: 22 May 2023.
Edited by:
Ahmed M. Eldosouky, Suez University, EgyptReviewed by:
Abdellatif Younis, National Research Institute of Astronomy and Geophysics, EgyptBiraj Kanti Mondal, Netaji Subhas Open University, India
Copyright © 2023 Abdelrahman, Hazaea and Almadani. This is an open-access article distributed under the terms of the Creative Commons Attribution License (CC BY). The use, distribution or reproduction in other forums is permitted, provided the original author(s) and the copyright owner(s) are credited and that the original publication in this journal is cited, in accordance with accepted academic practice. No use, distribution or reproduction is permitted which does not comply with these terms.
*Correspondence: Kamal Abdelrahman, a2hhc3NhbmVpbkBrc3UuZWR1LnNh