 Robert J. Leamon1,2*
- 1Goddard Planetary Heliophysics Institute, University of Maryland–Baltimore County, Baltimore, MD, United States
- 2NASA Goddard Space Flight Center, Greenbelt, MD, United States
The Sun provides the energy required to sustain life on Earth and drive our planet’s atmosphere. However, establishing a solid physical connection between solar and tropospheric variability has posed a considerable challenge across the spectrum of Earth-system science. Over the past few years a new picture to describe solar variability has developed, based on observing, understanding and tracing the progression, interaction and intrinsic variability of the magnetized activity bands that belong to the Sun’s 22-year magnetic activity cycle. A solar cycle’s fiducial clock does not run from the canonical min or max, instead resetting when all old cycle polarity magnetic flux is cancelled at the equator, an event dubbed the “termination” of that solar cycle, or terminator. In a recent paper, we demonstrated with high statistical significance, a correlation between the occurrence of termination of the last five solar cycles and the transition from El Niño to La Niña in the Pacific Ocean, and predicted that there would be a transition to La Niña in mid 2020. La Niña did indeed begin in mid-2020, and endured into 2023 as a rare “triple dip” event, but some of the solar predictions made did not occur until late 2021. This work examines what went right, what went wrong, the correlations between El Niño, La Niña and geomagnetic activity indices, and what might be expected for the general trends of large-scale global climate in the next decade.
1 Introduction
In Leamon et al. (2021), hereafter Paper I, we showed a strong correlation between the end of solar activity cycles and the warm-to-cold transitions of the El Niño Southern Oscillation, that held for the 5 cycles 19–23, or from 1966–7 to 2010–11.
The key breakthrough that led to this discovery was thinking not about sunspot number as the driving measure, the defining measure, of a solar cycle. Rather, a solar cycle’s fiducial clock does not run from the canonical sunspot min, or max, but instead resets when all old cycle polarity magnetic flux is cancelled at the equator, an event dubbed the “termination” of that Hale cycle, or terminator. The terminators occur about 18–24 months after the canonical minima, and although originally defined through observation of solar EUV and magnetograph images, i.e., 2-D images, the time when the monthly-averaged solar radio flux, F10.7 = 90 sfu is a good scalar proxy. For further details on Hale Cycle terminators, their predictability, and impacts on solar activity and (space weather) output, the interested reader is directed to McIntosh et al. (2019), Dikpati et al. (2019), Leamon et al. (2020, 2022), and McIntosh et al. (2023).
Although published in April 2021, Paper I was originally submitted in November 2017, a testament, perhaps, of its introductory paragraph, including:
It is fair, then, to say that searching for the connection between the variability of the solar atmosphere and that of our troposphere has become “third-rail science”—not to be touched at any cost.
Paper I made the prediction that the termination of solar cycle 24 would occur in mid-late 2020, and thus there would be a transition to La Niña at that time. That was a very bold prediction when submitted in 2017, less bold on final acceptance. La Niña did indeed begin in mid-2020, and endured into 2023 as a rare “triple dip” event. However, some of the solar predictions that Paper I made did not occur until late 2021. In what follows we present updated data through January 2023, and examine what went right for Leamon et al., what went wrong, and what might be expected for the general trends of large-scale global climate in the next decade.
2 New observations
Figure 1 continues, and extends, our presentation of solar activity markers and proxies back over the past 60 years, combining and updating figures 1, 4 of Paper I through January 2023. Progressing down the figure, we see the total and hemispheric sunspot numbers, with colored shading representing a dominance of the north (red) and south (blue) hemispheres. Panel (b) shows a data-motivated depiction of the latitudinal progression of the Sun’s magnetic cycle bands. As initially developed by (McIntosh et al., 2014), these “band-o-grams” are set by three parameters (points in time): the times of hemispheric maxima (the time that the band starts moving equatorward from 55°) and the terminator time. We assume a linear progression between those times in each hemisphere. Above 55° latitude we prescribe a linear progression of 10° per year, in keeping with “Rush to the Poles” seen in coronal green line data (Altrock, 1997). Panel (c) shows the variation of the galactic cosmic ray flux (GCR) as measured at the University of Oulu, Finland, anti-correlated with solar activity as strong (and complicated) solar magnetic fields essentially block cosmic rays from entering the Solar System, and hence the Earth’s atmosphere during periods of high solar activity. Panel (d) shows the Penticton 10.7 cm radio flux, F10.7, which can be viewed as a disk-integrated measure of magnetic field strength and complexity. Above the ∼65 sfu floor, which is predominantly thermal in nature and produced all over the solar disk, F10.7 is generated primarily by bremsstrahlung and gyro resonance with sufficiently strong magnetic field—i.e. in the corona above sunspots. Note that the final data point (January 2023, F10.7 = 182 sfu) is higher than any single month in Cycle 24! Panel (e) shows the composite index of the Sun’s chromospheric variability measured through the ultraviolet emission of singly ionized Magnesium. This serves two purposes: (1) it is a measure of magnetic field strength in the chromosphere, and (2) it is a close proxy for solar ultraviolet flux at wavelengths near ∼200 nm that are important for molecular oxygen dissociation and ozone formation in the stratosphere Finally, panel (f) shows the NOAA Oceanic Niño index (ONI), our primary measure of El Niño and La Niña. ONI is defined as the 3-month running mean of ERSST. v5 SST anomalies in the Niño 3.4 region [5°N–5°S, 120°–170°W]. Through all panels the vertical dashed lines mark the Hale Cycle terminators, including now that of Cycle 24 in December 2021 (McIntosh et al., 2023).
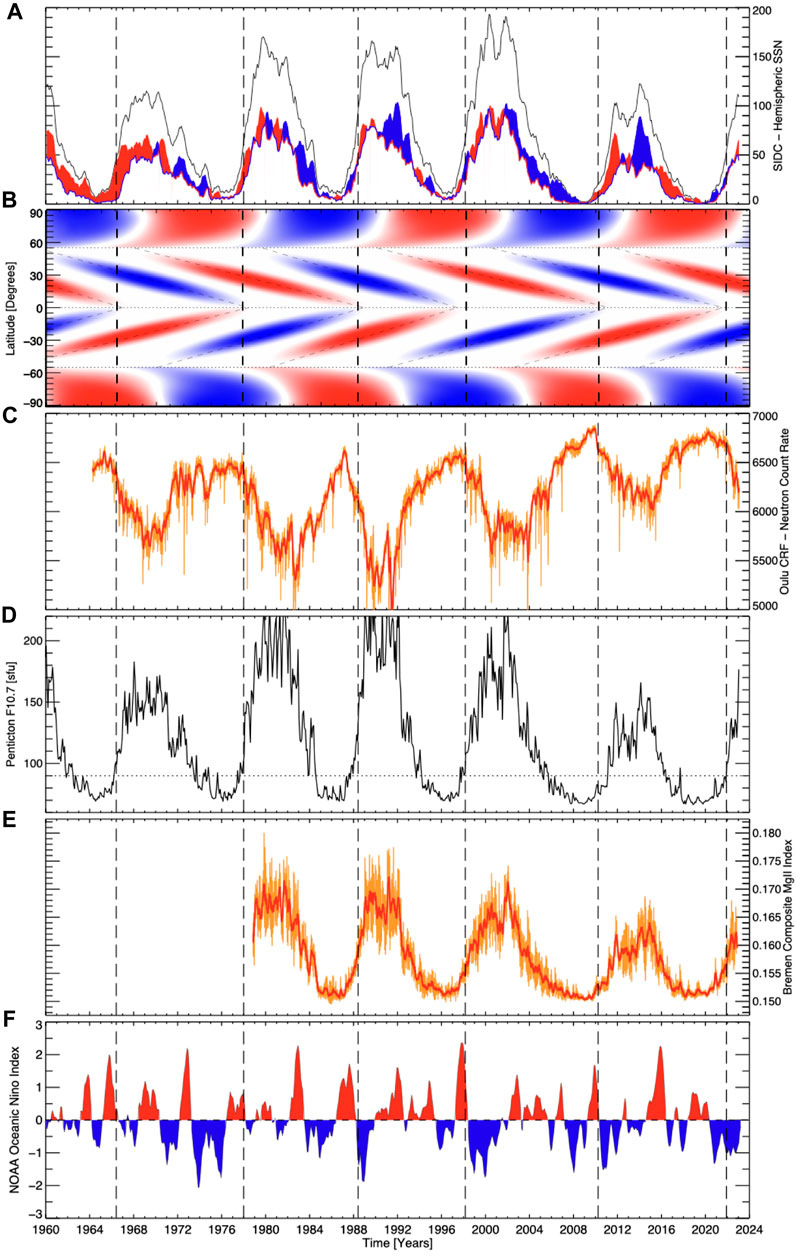
FIGURE 1. Comparing more than five decades of solar evolution and activity proxies, combining and updating Figures 1, 4 of Leamon et al. (2021). From top to bottom: (A) the total (black) and hemispheric sunspot numbers (north—red, and blue—south); (B) a data-motivated schematic depiction of the Sun’s 22 years magnetic activity cycle; (C) the Oulu cosmic-ray flux; (D) the Penticton F10.7 cm radio flux; (E) the Mg ii index of ultraviolet variability from the University of Bremen; and (F) the variability of the Oceanic Niño Index (ONI) over the same epoch. The black dashed lines mark the cycle terminators, including the December 2021 end of Cycle 24.
2.1 Successes
Paper I predicted that there would be a transition to La Niña in mid-2020. La Niña did indeed begin in mid-2020. Success! Well, maybe.
The ∼5% drop in GCRs at the terminator was one of their defining features in Paper I. The GCRs again drop 5.5% after observed terminator in December 2021. As of January 2023, the GCR level is below the average of the entire 59-year record, is approaching the peak (nadir) level of Cycle 24, and is ahead of the same phase of Cycle 24, a year after terminator. This is not surprising given that all measures of solar activity have been higher in Cycle 25 than the relatively weak last Cycle 24.
Not shown in Figure 1 are measures of Atlantic hurricane season activity. Paper I predicted “a particularly active season in 2021, and maybe even 2020, depending on exactly when the terminator and ENSO transition occurs,” based on the historical record: all Atlantic hurricane seasons are relatively strong in the first year of La Niña after an El Niño, when waters are still warm but upper-level wind shears are favorable for cyclone genesis (Vecchi and Soden, 2007). This was indeed the case: 2020 was the most active Atlantic hurricane season on record, and the 2021 season was the third-most active. The 2022 season was near-normal. In terms of economic damage, the costliest season to date was 2017, which again had a (weak) La Niña after the extremely strong 2015–16 El Niño.
2.2 What went wrong
Paper I’s prediction for a 2020 La Niña was derived from solar cycle predictions of Leamon et al. (2020). They forecast late 2020, which did mean that Cycle 24 would have been short at less than 10 years (compared to almost 13.0 years for Cycle 23).
In reality, the Hale Cycle terminator did not occur until December 2021 (although November 2020 was a tantalising failure to launch). This meant that the length of Cycle 24 was 10.75 years, still (slightly) faster than average. McIntosh et al. (2023) discuss the failure to launch in more detail, and present a revised outlook for the solar activity for the rest of Cycle 25.
In Paper I we consciously tried to avoid discussion of causation, which, due to its controversial nature could lead to dismissal of the empirical relationship, and we wanted to open a broader scientific discussion of solar coupling to the Earth and its environment. But Paper I did suggest that corpuscular radiation—specifically galactic cosmic rays modulated by the large-scale heliospheric magnetic field—appears to have greater influence on ENSO than photons, independent of the exact mechanism by which they couple to the atmosphere. As Figure 1 shows, the second of the triple dips does align with the big drop in cosmic rays. There is a small drop (from the peak) that aligns with the onset of La Niña in 2020, but this is only a ∼1% drop in GCRs, compared to the ∼5% drop at the terminator in 2021. So it is plausible, then, that the onset of La Niña in 2020 was just “random” internal fluctuations of the atmospheric system, and the second and third years were sustained by whatever mechanism drives the external coupling.
Nevertheless, independent of the exact coupling mechanisms, the question must be asked, why has the pattern occurred and reoccurred regularly for the past five solar cycles, or 60 years?
3 Discussion
3.1 Mechanisms
So if we cannot conclusively link the flux of incoming cosmic rays or other charged particles, how else might we explain a solar influence? We offer two potential solar-terrestrial mechanisms: (1) the effects of the Heliospheric Current Sheet, and (2) the effects of geomagnetic activity indices.
Figure 2 again shows the F10.7 radio flux, Oulu GCR count, and the ONI record, but adds the computed Heliospheric Current Sheet (HCS) tilt angle from the Wilcox Solar Observatory (Scherrer et al., 1977; Wilcox et al., 1980). Note that the Wilcox Solar Observatory has only been extant since 1976, so we only show the 4 + cycles since then (It did, conveniently perhaps, come online at the nadir of the Cycle 19 minimum.)
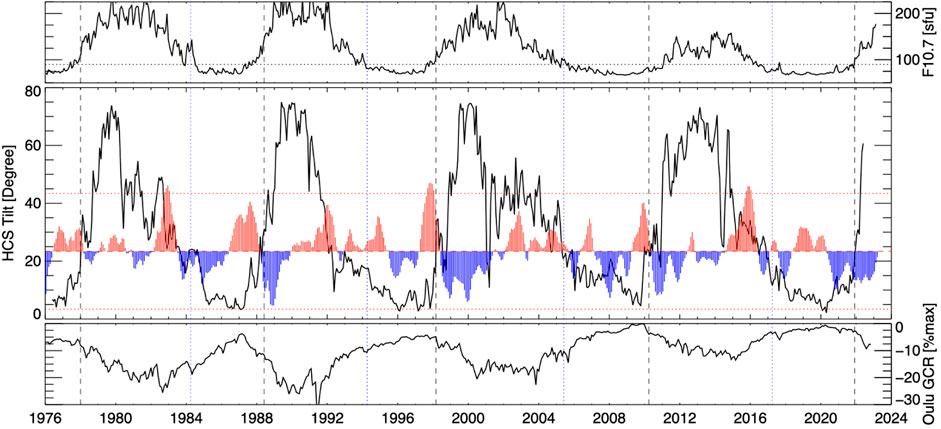
FIGURE 2. Showing the relationship between the tilt of the HCS current sheet (black) and ONI (red). The zero point for the ONI trace is offset to 23.4° (Earth’s axial tilt), and the horizontal dotted lines correspond to ONI=±2. The top and bottom sub-panels show F10.7 and the Oulu GCR flux as context for the landmarks of the solar activity cycle. In all panels the dashed vertical lines correspond the Hale Cycle terminators, and the dotted vertical lines correspond to the 3/5 “pre-terminator” point as described in Chapman et al. (2020) and Leamon et al. (2022).
The first thing to observe in Figure 2 is that, like F10.7 = 90, when the HCS tilt exceeds the Earth’s orbital obliquity, 23.4°, is also a good (scalar) proxy for the terminator. Similarly, on the downslope of the cycle, there seems to be a correlation between the decay of the post-maximum El Niño and when H = 23.4°.
The rapid rise in F10.7, and the increasing number and complexity of solar active regions that lead to the increasing tilt of the HCS, all occur at the terminators. When the slope of the change in solar activity is the steepest, that is, the period when the gradients in our atmosphere are the largest. It follows that there should be two such times, once during the ascending phase and again during the declining phase of the cycle. There is a difference in Figure 2 in the decay of tilt between two odd and the two even cycles, something that also visible in the production of X-flares (Leamon and McIntosh, 2022), and does seem to track in the timing of the El Niño to La Niña transition. The six terminators in Paper I, while highly statistically significant for N = 6, was a tough pill to swallow for some readers; a correlation for 4 (or even 2) is too much.
Figure 3 shows the relationship between the geomagnetic activity indices Ap (red) and Kp (green) and ONI record. The Kp and Ap record extends back further (1932) than ONI (1950), but we show the full record to see that the gross behaviour of Ap within a solar cycle remains similar independent of cycle strength. Two things are immediately apparent: 1) The El Niño near solar minimum (that precedes the El Niño to La Niña transition described in Paper I at the terminators—the dashed black lines) corresponds quite well to the local minimum of Ap. The transition to La Niña then occurs as the solar cycle and geomagnetic activity ramps up at the terminator. 2) We identify the strongest mid-cycle El Niño peaks (and mark them by pink dashed lines). These tend to be associated with the highest levels of geomagnetic activity. Note also the close—but not exact—correspondence of the dotted lines marking the 2/5 of the cycle phase and the El Niño peak pink lines, especially for the last 4 cycles (after 1978). Not every local maximum or minimum in Ap corresponds to an El Niño (and vice versa), but this simple correspondence can explain almost 90% (17/19) of El Niño events (ONI
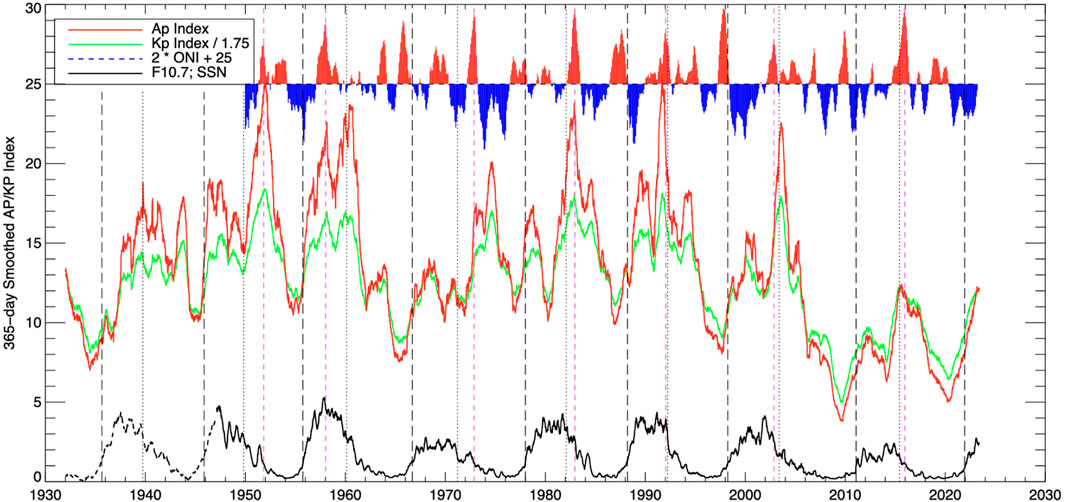
FIGURE 3. Showing the relationship between the geomagnetic activity indices Ap (red) and Kp (green) and ONI (red and blue, hot and cold). At the bottom the F10.7 radio flux (and SSN for 1932–1947) are shown, smoothed and scaled, as context for the landmarks of the solar activity cycle. As in Figure 2, the dashed vertical lines correspond the Hale Cycle terminators, but here the dotted vertical lines correspond to the 2/5 point—which closely corresponds to the sharp drop in F10.7 seen here, and the reformation of the sun’s polar coronal holes Leamon et al. (2022). The magenta dashed lines mark the dates of the (strongest) mid-cycle El Niños. Note the close correspondence of the 2/5 dotted lines and El Niño peak dashed magenta lines, especially after 1978 (i.e., the past 4 cycles).
Historically, scientists have looked at the extrema of the solar cycle, trying to correlate the timing of solar max and solar min with dynamic changes in terrestrial climatology and weather. Instead, we should be investigating the timing of the extrema of the first derivative of solar cycle activity and looking for correlations with global dynamic changes in our atmosphere during those periods. It is then no small wonder things appear more clearly when using the terminator as the fiducial time to anchor terrestrial climate epoch analyses. Summarizing, it would appear that an El Niño tends to develop starting at solar min and shortly after solar max, when the solar inputs to the atmosphere are relatively stable, and the ensuing transition to La Niña occurs when solar output is undergoing most change.
3.2 Other recent results
A common suggestion from previous studies is that a multi-year La Niña tends to occur after a strong El Niño. Iwakiri and Watanabe, 2021 argued that the duration of La Niña is strongly influenced by the amplitude of the preceding El Niño in both observations and a long climate model simulation, presumably due to a large initial discharge. The weird thing about 2020–23, however, is that this prolonged La Niña, unlike previous triple dips, has not come after a strong El Niño, which tends to build up a lot of ocean heat that takes a year or two to dissipate. Where’s the dynamics for this? (Jones, 2022, quoting NOAA’s M. L’Heureux). Paper I noted that the period of terminator-ENSO correlation corresponds to the close-to-monotonic rise in global sea surface temperatures over the same time period. As the world warms, and ice sheets melt, a slowdown of the Atlantic Meridional Overturning Circulation (AMOC) is expected from the influx of fresh water (Boers, 2021). Orihuela-Pinto et al. (2022) modelled a collapse of the AMOC, and showed that such a collapse would strengthen Pacific Trade Winds, push warm waters to the west, thus creating more La Niña-like conditions.
Generally, large-scale global climate models predict a shift to more El Niño-like states as the oceans warm, but this is not what has been observed for the past 50 years or so—as Figure 1 shows. Similarly, we may consider the shift from negative PDO to positive in 1976–77 (e.g., Mantua et al., 1997; Minobe, 1997, 2000), previously referred to as the Great Pacific Climate Shift (e.g., Trenberth, 1990; Miller et al., 1994), and the subsequent reversal to negative PDO in 2002–03, but neither phase shift is immediately apparent in Figure 1. The observed AMOC indices flipped from positive to negative in the early 1960s, but the statistical correlations of Paper I endured after the return flip in the late 1990s.
We have focused here (again) on ONI, a single scalar quantity of an area-averaged SST anomaly, rather than 2D maps of SST. McKenna and Karamperidou (2022) report a difference in the response of atmospheric blocking events, synoptic weather patterns that divert the jet stream from its typical path in the mid-to high-latitudes between “canonical” and “Modoki” (or Eastern and Central Pacific) flavors of El Niño. Put another way, there is more to teleconnections than just a scalar index can convey: the different teleconnections and impacts on the mid-latitude circulation coming from Eastern and Central Pacific flavors of El Niño demonstrate different effects in blocking frequency and characteristics; significant disruption of weather patterns caused by blocking can have severe ecological and socio-economic impacts.
Similarly, the difference between flavors of El Niño (Trenberth and Stepaniak, 2001; Kao and Yu, 2009; Yeh et al., 2009) may be associated with the difference between those forced by “fixed” solar cycle landmarks and those responding to oceanic/atmospheric dynamics, although increasingly warming sea surface temperatures may just be the dominant Modoki El Niño driver (Yeh et al., 2009).
3.3 The “standard” cycle
As previously discussed, it is clear from the modified superposed epoch analysis of Leamon et al. (2021) that there is a coherent pattern to solar output and the terrestrial response from terminator to terminator. The logical next step, then, is to average the five solar cycles for which we have data into a “standard” unit cycle that we may use for skillful prediction of future cycles. As first discussed in Leamon et al. (2022), the monthly series data are interpolated into 100 points from terminator to terminator, and an average and standard deviation are computed at each interpolation point for each of 5 cycles. This is shown in Figure 4 for F10.7 and the ONI El Niño index. Given the almost 100% variation in peak F10.7 from cycle to cycle, the average rises more smoothly from solar minimum to solar maximum than any of the individual cycles of Figure 1; however, the changes in standard deviation (i.e., the edges in the red shaded envelope) are clear at x ∼ 0, 0.4 and 0.6, and are driven by changes below the solar surface as discussed in Leamon et al. (2022).
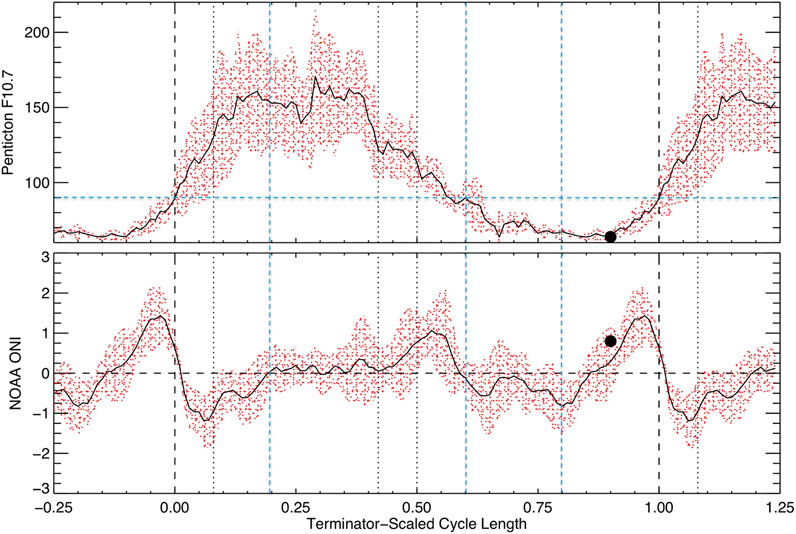
FIGURE 4. “Standard” cycle for F10.7 (top) and ONI (bottom). The black trace is the average of the past five cycles [cf.Figures 1D, F], and the red envelope is defined by one standard deviation. The dots correspond to 2019 May, the blue horizontal dashed line in the F10.7 panel corresponds to the terminator proxy threshold of 90 sfu, and the blue vertical dashed lines correspond to the “Circle of Fifths” outlined in Leamon et al. (2022).
We may use this standard cycle as a prediction tool for future ENSO events. In the language of the state vector simple dynamic system formulation of ENSO of Penland and Sardeshmukh (1995), it is clear that the forcing term f(t) must have a strong negative impulse at the terminator, a (strong) positive impulse through sunspot minimum to the terminator (and one—or two, for each hemisphere—weaker positive impulses associated with increased (E)UV insolation around solar maximum). As the Appendix A and Figure 6 show [and as Torrence and Compo (1998) and Wang and Wang (1996) showed], there is always power at shorter scales (3–7 years), between the terminators, corresponding to the intrinsic mode(s) of the system. Even if it is likely that the mid-cycle El Niño peak is related to increased solar output, we do not attempt to fit every bump and wiggle, or explain every (non-terminator) feature as solar-induced.
Nevertheless, it is an interesting exercise, if not an acid test, to predict Cycle 25: we already can estimate the date of the next terminator date as the brightpoints revealing the Cycle 25 activity band (cf.Figure 1B) have been present on disk long enough such that we may make a (well-constrained) linear extrapolation for when the Cycle 25 terminator will be and thus convert the unit cycle to real time out beyond 2030. This is shown in Figure 5: The lower panel updates Figure 1B, and shows the progression of the EUV brightpoint distribution for cycles 22–25. That the cycle 25 progression is well-established and, more importantly, linear, is clear. From extrapolating observations of the distribution of EUV brightpoints and their equatorward progression, we can already estimate that the Cycle 25 terminator will be late 2031—early 2032, with an uncertainty of about 9 months. Following the method outlined by Leamon et al. (2022), we can confirm, refine, or revise our estimate for the length of Cycle 25 as early as its polar field reversal, which we currently estimate to be early-mid 2024. While the timing of the 2020 La Niña turned out to be perhaps more serendipitous than a fantastic prediction 3 years in advance, the triple-dip that endured into 2023, and its previous analogue of 1998–2001, one whole Hale Cycle ago, we may be cautiously optimistic for the general trends of large-scale solar climate in the next decade.
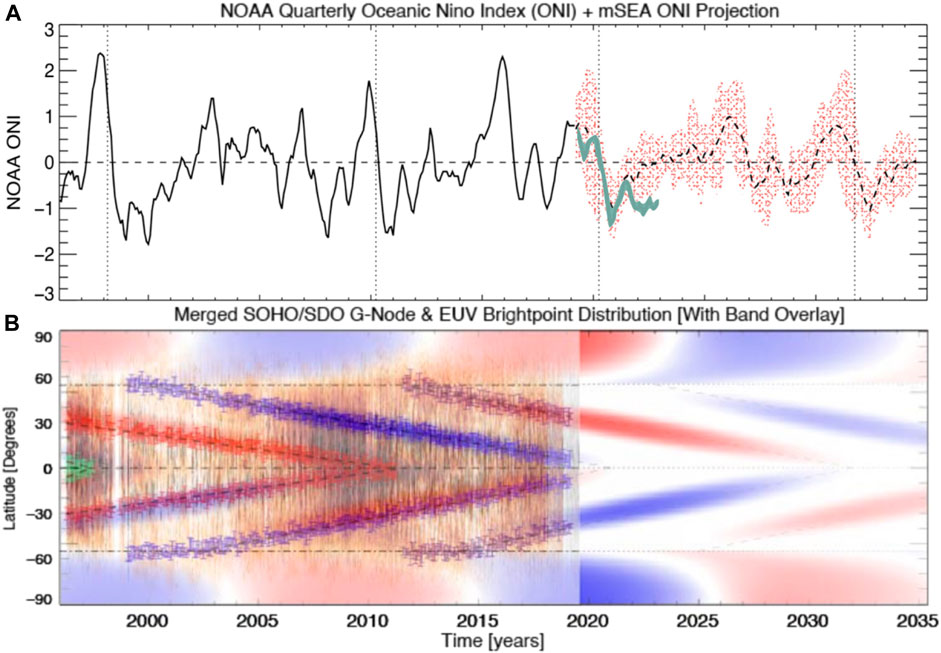
FIGURE 5. (A) “Standard” cycle from Figure 4 projected forward in (real) time from March 2019 to the Cycle 25 terminator, currently predicted (Leamon et al., 2022, from extrapolation of the band progression shown in Panel (B)) to be late 2031. EL Niños may be expected around 2026 and 2031, and La Niñas in 2020–21, 2027–28 and 2032–33. The green trace shows the observed ONI from March 2019 to December 2022.
The year 2023 does present an immediate acid test: Figure 5 suggests, statistically, that there will not a (strong) El Niño until around 2026, after the peak of the sunspot cycle, and ENSO-neutral conditions will endure from now until then. This is in contrast with the increasing drumbeats of a (strong) El Niño from various government agencies and NGOs worldwide. For instance, the European Center for Medium-Range Weather Forecasting (ECMWF) model, predicted on 1 Feb 2023 that the July measurement would be +0.91, a
3.4 What have we learned?
It is all to easy to dismiss the solar cycle terminator–ENSO correlation of Leamon et al. (2021) as a quirk, a curiosity. Indeed, its citation record—4, plus one self-citation (Leamon et al., 2022) for the modified superposed epoch method—might concur with that sentiment.
Climate Science is messy; this is not a topic to wrap up neatly and put a bow on it. Interdisciplinary, transdisciplinary science is even harder. Not only does one have to wrap things up neatly and convince one’s own discipline community, but then to convince the other community requires speaking their (specialized) language to communicate with them. The stacked time series plots of scalar quantities in all the Figures here rather than maps suggest I am still operating in an “above-the-atmosphere” mindset.
Paper I was written with an open mind as to what the coupling mechanism from the Sun to the ocean was and reported just the statistical correlations. We suspected that cosmic rays or precipitation of other charged particles might be modulating the teleconnections (e.g., Bjerknes, 1969; Domeisen et al., 2019) from equator to higher (terrestrial) latitudes, and the fact that these correlations turned on in the 1960s came from the warming planet. Rather than increased tropospheric temperatures, other long-time-scale trends, such as phase of the Atlantic Multi-decadal Oscillation (AMO; see, e.g., Omrani et al., 2022) could aid (or hinder) teleconnections, driving the observed ENSO variability. The AMO turned negative in the mid-60s, in time for the Cycle 19 terminator, but that negative phase ended around 2000, and there have been two more Hale Cycle terminators since then, with associated (multi-year) La Niña events.
The GCR flux did drop off slightly in mid-2020, corresponding to the onset of the current multi-year La Niña event, but the big (5.5%) drop corresponded to the late-2021 decrease in ONI, or return to values below −0.5. Tinsley et al. (1989) noted that while the GCR flux recorded by neutron monitors in Oulu (as used in this paper and elsewhere) lies in the range 1–10 GeV, it would be more appropriate to use as comparison with (storm intensity) the flux of particles with energies an order of magnitude lower, being “the main source of ionisation and a source of chemical species in the lower stratosphere and troposphere.” This is consistent with the biggest change in Oxygen fluxes (ACE-SIS) from the mid-2020 peak came in the 7.3–10 MeV/nuc range (so 115–160 MeV total for an 8-proton, 8-neutron Oxygen nucleus) with a 30%–40% drop over the last half of 2020, and a further decrease aligned with the terminator (JS Rankin, personal communication; but see also Rankin et al., 2022).
The US$ billion socio-economic impacts of ENSO are such that it behooves us, as a community, to mitigate them by being able to predict ENSO on decadal timescales. We need an experiment, or series of experiments, field campaigns, models, both in the neutral atmosphere and plasma space above, to deduce the coupling pathway and mechanisms. Is charged particle precipitation properly accounted for in coupled circulation models, for instance? The method described here to describe the “unit cycle” of irradiance can then be forecast to a given/predicted solar cycle length and strength for use in higher-fidelity long-range future climate models. The various studies and authors quoted in Jones (2022) agree that the IPCC models are missing something—usually incorporation of ice sheets—but why not incorporation of upper atmosphere phenomena?
3.5 Where do we go now?
Any connection, or attempted connection between solar variability and oceanic variability is viewed with deep scepticism. Nevertheless, any prognostic skill at all, frankly, is mind-boggling. The correlations presented here and in Paper I are not happenstance. As previously mentioned, the year 2023 presents an immediate acid test of the predictions here (ENSO relatively neutral) and recent computer models calling for a strong El Niño, albeit while highly cognizant of the Spring Predictability Barrier.
To advance higher-fidelity long-range future climate models, we need a (large) team of open-minded individuals to explore what needs to be included. And, of course, not just funding, but interdisciplinary funding. Finally, there has in the last year or so, been a rapid increase in interest of Artificial Intelligence and Machine Learning for the scientific process—methods for predicting natural phenomena, and also discovering new physical insight based on hitherto unforeseen patterns in the data. Such a Neural Net technique was demonstrated for geomagnetic storm predictions by Cheung et al. (2017), and provides a clear pathway forward for our interests: What potential mechansisms can be found to explain the empirical sun-atmosphere correlation through correlated variations in the solar corona, EUV spectral irradiance, and solar wind down to the radiation belts, ITM structures and the stratosphere?
4 Conclusion
In Paper I (Leamon et al., 2021) we showed a strong correlation between the end of solar activity cycles and the warm-to-cold transitions of the El Niño Southern Oscillation, that held for the 5 cycles 19–23, or from 1966–7 to 2010–11. Paper I then predicted that the next such transition would be in 2020. La Niña did indeed begin in mid-2020, and endured into 2023. However, some of the solar predictions made in Paper I did not come to pass until late 2021.
It would appear, then, that the galactic cosmic ray-driven modulation suggested by Paper I to explain the El Niño to La Niña transitions is not correct. In lieu of GCRs, but still searching for a solar-modulated mechanism, we considered the we considered the tilt of the Heliospheric current sheet and the geomagnetic activity indices Kp and Ap. When the HCS tilt exceeds the Earth’s orbital obliquity, 23.4°, is a good (scalar) proxy for the terminator, and thus an El Niño to La Niña transition.
The geomagnetic activity indices are a far more promising mechanism: 17 of the 19 significant El Niño events since 1950 are closely correlated in time with a local extremum in Kp and Ap. The El Niño to La Niña transition at the terminator comes as geomagnetic activity rises from its solar cycle minimum, and any mid-cycle El Niños are associated with local peaks in geomagnetic activity (especially that event that always seems to occur within a year of the 2/5 cycle landmark).
So, revising the conclusion from Paper I, maybe it is an El Niño that is driven by solar-terrestrial coupling, and a La Niña just follows as the coupled ocean-atmosphere system relaxes. However, these temporal correlations do not explain the magnitude of an El Niño event, or the La Niña event that follows, nor does it explain why post-terminator La Niña events tend to endure for two or more years, especially those at the end of even-numbered solar cycles, such as the 2020–23 event just ended.
Based on the solar cycle correlations shown in Figures 1, 3, we computed the average ENSO for a solar cycle, and predicted it forward for the next decade.
The rest of 2023 presents an immediate acid test for the statistical correlations presented here: we do not predict a strong El Niño, in opposition, perhaps, to dynamical forecasts. Statistical forecasts have no experience of the current unprecedentedly warm ocean waters worldwide; have dynamic forecasts properly included such sea surface temperatures? If any solar cycle-dependent model is to be believed, we have to go all the way back to 1957 to get a (strong) El Niño prior to solar maximum. We shall see.
To conclude, in light of the theme of this Frontiers Research Topic, “Impact of Solar Activities on Weather and Climate,” we have shown that there are rapid changes in solar output, in terms of energetic photons, particulate ejecta and the large-scale heliospheric structure at specific, predictable times in the solar cycle, and that major swings in the various ENSO indices are correlated with at least one (The El Niño to La Niña transition at the terminator), if not two (the post-maximum El Niño peak), of these landmarks. As such, the results presented here suggest that solar (cycle-modulated) inputs are not properly captured in current models of ENSO, and thus we offer great utility for improving the fidelity of atmospheric and climate modelling in future.
Data availability statement
The original contributions presented in the study are included in the article/Supplementary Material, further inquiries can be directed to the corresponding author.
Author contributions
RL was solely responsible for the concept, intellectual content, writing and figure creation, and approved it for publication.
Funding
RL acknowledges support from NASA’s Living With a Star Program and the grant of Indo-US Virtual Networked Center (IUSSTF-JC-011-2016) to support the joint research on Extended Solar Cycles.
Acknowledgments
I thank Dan Marsh and Scott McIntosh, coauthors of Paper I, for their continued discussion and insight. McIntosh is also due thanks for providing the model data shown in panel (b) of Figure 1. The Reviewers are greatly appreciated for the encouragement to look at the geomagnetic indices discussed inFigure 3.
Conflict of interest
The authors declare that the research was conducted in the absence of any commercial or financial relationships that could be construed as a potential conflict of interest.
Publisher’s note
All claims expressed in this article are solely those of the authors and do not necessarily represent those of their affiliated organizations, or those of the publisher, the editors and the reviewers. Any product that may be evaluated in this article, or claim that may be made by its manufacturer, is not guaranteed or endorsed by the publisher.
References
Altrock, R. C. (1997). An ‘extended solar cycle’ as observed in Fe xiv. Sol. Phys.170, 411–423. doi:10.1023/A:1004958900477
Bjerknes, J. (1969). Atmospheric teleconnections from the equatorial pacific. Mon. Weather Rev.97, 163–172. doi:10.1175/1520-0493(1969)097⟨0163:ATFTEP⟩2.3.CO;2
Boers, N. (2021). Observation-based early-warning signals for a collapse of the atlantic meridional overturning circulation. Nat. Clim. Change11, 680–688. doi:10.1038/s41558-021-01097-4
Chapman, S. C., McIntosh, S. W., Leamon, R. J., and Watkins, N. W. (2020). Quantifying the solar cycle modulation of extreme space weather. Geophys. Res. Lett.47, e87795. doi:10.1029/2020GL087795
Cheung, C. M. M., Handmer, C., Kosar, B., Gerules, G., Poduval, B., Mackintosh, G., et al. (2017). “Modeling geomagnetic variations using a machine learning framework,” in AGU fall meeting abstracts, 2017, SM23A–2591.
Dikpati, M., McIntosh, S. W., Chatterjee, S., Banerjee, D., Yellin-Bergovoy, R., and Srivastava, A. (2019). Triggering the birth of new cycle’s sunspots by solar tsunami. Sci. Rep.9, 2035. doi:10.1038/s41598-018-37939-z
Domeisen, D. I. V., Garfinkel, C. I., and Butler, A. H. (2019). The teleconnection of El Niño southern oscillation to the stratosphere. Rev. Geophys.57, 5–47. doi:10.1029/2018RG000596
Fierstein, J., and Hildreth, W. (1992). The plinian eruptions of 1912 at Novarupta, Katmai national Park, Alaska. Bull. Volcanol.54, 646–684. doi:10.1007/BF0043-0778
Iwakiri, T., and Watanabe, M. (2021). Mechanisms linking multi-year La Niña with preceding strong El Niño. Sci. Rep.11, 17465. doi:10.1038/s41598-021-96056-6
Jones, N. (2022). Rare ‘triple’ La Niña climate event looks likely—What does the future hold?Nature607, 21. doi:10.1038/d41586-022-01668-1
Kao, H.-Y., and Yu, J.-Y. (2009). Contrasting eastern-pacific and central-pacific types of ENSO. J. Clim.22, 615–632. doi:10.1175/2008JCLI2309.1
Labitzke, K., and van Loon, H. (1988). Associations between the 11-year solar cycle, the QBO and the atmosphere. Part I: The troposphere and stratosphere in the Northern Hemisphere in winter. J. Atmos. Terr. Phys.50, 197–206. doi:10.1016/0021-9169(88)90068-2
Leamon, R. J., McIntosh, S. W., Chapman, S. C., and Watkins, N. W. (2020). Timing terminators: Forecasting sunspot cycle 25 onset. Sol. Phys.295, 36. doi:10.1007/s11207-020-1595-3
Leamon, R. J., McIntosh, S. W., and Marsh, D. R. (2021). Termination of solar cycles and correlated tropospheric variability. Earth Space Sci.8, e2020EA001223. doi:10.1029/2020EA001223
Leamon, R. J., McIntosh, S. W., and Title, A. M. (2022). Deciphering solar magnetic activity: The solar cycle clock. Front. Astronomy Space Sci.9, 886670. doi:10.3389/fspas.2022.886670
Leamon, R., and McIntosh, S. (2022). “How does the sun know which way is up? The difference between odd and even cycles and implications for sunspot cycle 25 max,” in AGU fall meeting abstracts, 2022, SH52E–1507.
Mantua, N. J., Hare, S. R., Zhang, Y., Wallace, J. M., and Francis, R. C. (1997). A pacific interdecadal climate oscillation with impacts on salmon production. Bull. Am. Meteorological Soc.78, 1069–1079. doi:10.1175/1520-0477(1997)078⟨1069:APICOW⟩2.0.CO;2
McIntosh, S. W., Leamon, R. J., and Egeland, R. (2023). Deciphering solar magnetic activity: The (solar) hale cycle terminator of 2021. Front. Astronomy Space Sci.10, 1050523. doi:10.3389/fspas.2023.1050523
McIntosh, S. W., Leamon, R. J., Egeland, R., Dikpati, M., Fan, Y., and Rempel, M. (2019). What the sudden death of solar cycles can tell us about the nature of the solar interior. Sol. Phys.294, 88. doi:10.1007/s11207-019-1474-y
McIntosh, S. W., Wang, X., Leamon, R. J., Davey, A. R., Howe, R., Krista, L. D., et al. (2014). Deciphering solar magnetic activity. I. On the relationship between the sunspot cycle and the evolution of small magnetic features. Astrophys. J.792, 12. doi:10.1088/0004-637X/792/1/12
McKenna, M., and Karamperidou, C. (2022). “Impacts of El Niño flavors on northern hemisphere blocking,” in AGU fall meeting abstracts, 2022, A55A–A0066. (Submitted to GRL).
Miller, A., Cayan, D., Barnett, T., Graham, N., and Oberhuber, J. (1994). The 1976–77 climate shift of the Pacific Ocean. Oceanography7, 21–26. doi:10.5670/oceanog.1994.11
Minobe, S. (1997). A 50-70 year climatic oscillation over the North Pacific and North America. Geophys. Res. Lett.24, 683–686. doi:10.1029/97GL00504
Minobe, S. (2000). Spatio-temporal structure of the pentadecadal variability over the North Pacific. Prog. Oceanogr.47, 381–408. doi:10.1016/S0079-6611(00)00042-2
Omrani, N.-E., Keenlyside, N., Matthes, K., Boljka, L., Zanchettin, D., Jungclaus, J. H., et al. (2022). Coupled stratosphere-troposphere-Atlantic multidecadal oscillation and its importance for near-future climate projection. npj Clim. Atmos. Sci.5, 59. doi:10.1038/s41612-022-00275-1
Orihuela-Pinto, B., England, M. H., and Taschetto, A. S. (2022). Interbasin and interhemispheric impacts of a collapsed atlantic overturning circulation. Nat. Clim. Change12, 558–565. doi:10.1038/s41558-022-01380-y
Penland, C., and Sardeshmukh, P. D. (1995). The optimal growth of tropical sea surface temperature anomalies. J. Clim.8, 1999–2024. doi:10.1175/1520-0442(1995)008⟨1999:TOGOTS⟩2.0.CO;2
Ramaswamy, V., Schwarzkopf, M. D., Randel, W. J., Santer, B. D., Soden, B. J., and Stenchikov, G. L. (2006). Anthropogenic and natural influences in the evolution of lower stratospheric cooling. Science311, 1138–1141. doi:10.1126/science.1122587
Rankin, J. S., McComas, D. J., Leske, R. A., Christian, E. R., Cohen, C. M. S., Cummings, A. C., et al. (2022). Anomalous cosmic-ray oxygen observations into 0.1 AU. Astrophys. J.925, 9. doi:10.3847/1538-4357/ac348f
Scherrer, P. H., Wilcox, J. M., Svalgaard, L., Duvall, T. L., Dittmer, P. H., and Gustafson, E. K. (1977). The mean magnetic field of the sun - observations at Stanford. Sol. Phys.54, 353–361. doi:10.1007/BF00159925
Tinsley, B. A., Brown, G. M., and Scherrer, P. H. (1989). Solar variability influences on weather and climate: Possible connections through cosmic ray fluxes and storm intensification. J. Geophys. Res.94, 14783–14792. doi:10.1029/JD094iD12p14783
Toohey, M., Krüger, K., Bittner, M., Timmreck, C., and Schmidt, H. (2014). The impact of volcanic aerosol on the northern hemisphere stratospheric polar vortex: Mechanisms and sensitivity to forcing structure. Atmos. Chem. Phys.14, 13063–13079. doi:10.5194/acp-14-13063-2014
Torrence, C., and Compo, G. P. (1998). A practical guide to wavelet analysis. Bull. Am. Meteorological Soc.79, 61–78. doi:10.1175/1520-0477(1998)079⟨0061:APGTWA⟩2.0.CO;2
Trenberth, K. E. (1990). Recent observed interdecadal climate changes in the Northern Hemisphere. Bull. Am. Meteorological Soc.71, 988–993. doi:10.1175/1520-0477(1990)071<0988:roicci>2.0.co;2
Trenberth, K. E., and Stepaniak, D. P. (2001). Indices of El Niño evolution. J. Clim.14, 1697–1701. doi:10.1175/1520-0442(2001)014⟨1697:LIOENO⟩2.0.CO;2
Vecchi, G. A., and Soden, B. J. (2007). Increased tropical Atlantic wind shear in model projections of global warming. Geophys. Res. Lett.34. doi:10.1029/2006GL028905
Wang, B. (1995). Interdecadal changes in El Niño onset in the last four decades. J. Clim.8, 267–285. doi:10.1175/1520-0442(1995)008⟨0267:ICIENO⟩2.0.CO;2
Wang, B., and Wang, Y. (1996). Temporal structure of the southern oscillation as revealed by waveform and wavelet analysis. J. Clim.9, 1586–1598. doi:10.1175/1520-0442(1996)009⟨1586:TSOTSO⟩2.0.CO;2
Wilcox, J. M., Hoeksema, J. T., and Scherrer, P. H. (1980). Origin of the warped heliospheric current sheet. Science209, 603–605. doi:10.1126/science.209.4456.603
Wolter, K., and Timlin, M. S. (2011). El Niño/Southern Oscillation behaviour since 1871 as diagnosed in an extended multivariate ENSO index (MEI.ext). Int. J. Climatol.31, 1074–1087. doi:10.1002/joc.2336
Appendix A: Wavelet analysis
Given that the key result of the present paper is that ENSO variability is correlated with the terminators, which occur not at a fixed temporal frequency but at a fixed phase of the solar cycle, we are reticent to include a Fourier spectral analysis. Nevertheless, the question “Would you expect there to be significant power in a Fourier spectrum of the entire ENSO signal?” is a valid one, as there have been several previous spectral analyses of ENSO. Indeed, the seminal wavelet analysis paper (Torrence and Compo, 1998) uses ENSO data (the Niño3 timeseries) as its “practical example.”
As such, Figure 6 shows wavelet power spectra for the ONI index as discussed above, and also for the longer term “Multivariate ENSO Index,” MEI, (Wolter and Timlin, 2011) that combines air pressure, temperature and wind speed data along with sea surface temperatures, normalized such that the mean value for 1871–2005 is zero and the standard deviation is unity.
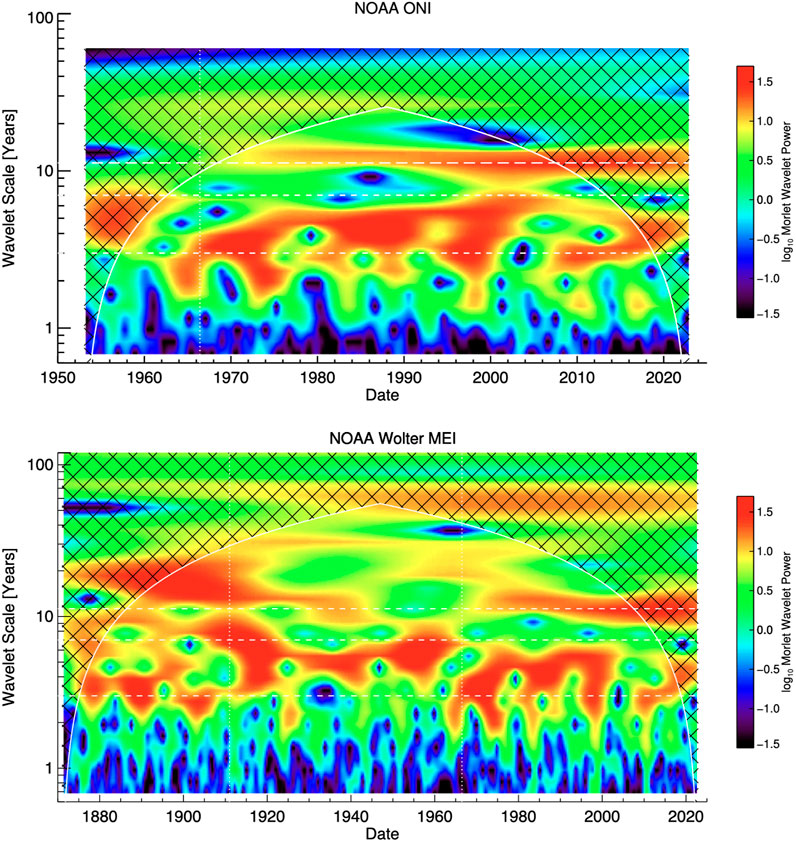
FIGURE 6. Wavelet power spectra for the NOAA indices ONI 1950–present (top) and the extended “Multivariate ENSO Index” (MEI) 1871–present (bottom; note change of abscissa scale). Cross-hatched regions on either end indicate the “cone of influence,” where edge effects become important. Horizontal dashed and dotted white lines refer to periods of 3, 7, and 11 years; Vertical white lines indicate June 1966 (the Cycle 19 terminator), and, in the MEI panel, January 1911 (see text). Significant power is seen at solar cycle scales from the mid-1960s on, consistent with the results of Torrence and Compo (1998), and Wang and Wang (1996).
As a sanity check, the spectra of the two indices agree, and our analysis agrees with previous ENSO wavelet analyses (Wang and Wang, 1996; Torrence and Compo, 1998) that “the principal period of ENSO has experienced two rapid changes since 1872, one in the early 1910s and the other in the mid-1960s.” Thus in both panels of Figure 6, vertical dot-dashed lines indicate June 1966 (the cycle 19 terminator), and in Figure 6B, somewhat arbitrarily, January 1911 marking the extent of the significance contour at 12–14 year scales and low power at scales shorter than about 4 years. An abrupt alteration anywhere between 1911 and 1914 would not be inconsistent with Figure 6B. However, given the likely role of tropospheric warming and stratospheric cooling in changing the properties of ENSO (Ramaswamy et al., 2006), and polar vortex—QBO teleconnections (Labitzke and van Loon, 1988; Toohey et al., 2014), it is believable that the June 1912 Novarupta volcano eruption in Katmai National Park, Alaska (Fierstein and Hildreth, 1992)—the largest eruption of the 20th century in terms of ash volume expelled, and which, unlike other major eruptions with stratospheric consequences, happened at high rather than equatorial latitudes—could be the trigger of the 1910s phase change seen in Figure 6. Another suggestion from Figure 6 is that another abrupt alteration of oscillation period occurred around 2003–5 to a dominant 3-year periodicity. Even though one could then argue that a 3-year intrinsic periodicity would also make a 2019–2020 prediction, the power at scales of a few years (almost always) exceeds that at solar cycle scales, and there is consistent, significant, power at 11-ish year scales over the past five solar cycles.
Not unrelated to the change in ENSO principal period and the onset of a significant signal at solar cycle scales in the mid-1960s, Wang (1995) noted that the onset of El Niño experienced an abrupt change in the late 1970s. He attributed the change to “a sudden variation in the background state, associated with “a conspicuous global warming” and deepening of the Aleutian Low in the North Pacific.”
Keywords: sun, solar activity cycle, solar effects, space weather, solar irradiance, El Niño Southern oscillation, global change, global climate models
Citation: Leamon RJ (2023) The triple-dip La Niña of 2020–22: updates to the correlation of ENSO with the termination of solar cycles. Front. Earth Sci. 11:1204191. doi: 10.3389/feart.2023.1204191
Received: 11 April 2023; Accepted: 13 June 2023;
Published: 05 July 2023.
Edited by:
Limin Zhou, East China Normal University, ChinaReviewed by:
Anthony Lupo, University of Missouri, United StatesAna G. Elias, Universidad Nacional de Tucumán, Argentina
Copyright © 2023 Leamon. This is an open-access article distributed under the terms of the Creative Commons Attribution License (CC BY). The use, distribution or reproduction in other forums is permitted, provided the original author(s) and the copyright owner(s) are credited and that the original publication in this journal is cited, in accordance with accepted academic practice. No use, distribution or reproduction is permitted which does not comply with these terms.
*Correspondence: Robert J. Leamon, cm9iZXJ0LmoubGVhbW9uQG5hc2EuZ292