 Rongrong Li1
 Guoce Xu2*
- 1State Key Laboratory of Water Resources and Hydropower Engineering Science, Wuhan University, Wuhan, China
- 2State Key Laboratory of Eco-Hydraulics in Northwest Arid Region, Xi’an University of Technology, Xi’an, Shaanxi, China
When large reservoirs are built and put into operation, the downstream hydrological processes will be altered significantly, and ecology and agricultural irrigation water of the basin will be affected to some extent. The reservoir index (RI) and the sediment trapping efficiency (TE) of reservoirs are defined to quantify the reservoir impacts on the water flow and sediment by considering the static storage capacity. However, the regulating effect of reservoirs on hydrological variables is not only related to static storage capacity, but also to dynamic reservoir operation. Thus, in this paper, a general rainfall-reservoir index (GRRI) is developed by coupling reservoir regulation indicator (RR, including RI and TE) and effective rainfall affecting the dynamic operation of reservoirs, and the GRRI is used as the covariate to carry out the nonstationary frequency analysis of flood (Q) and annual sediment load (S) at Gaochang (GC) station in Min River, Wulong (WL) station in Wu River, Ankang (AK), Huangjiagang (HJG) and Huangzhuang (HZ) station in Han River, and Cuntan (CT) station on the main stream of the upper Yangtze River. It is found that Q and S at six stations have obvious changes induced by reservoirs, the mean of Q decreases by 22.8%–60.6%, and S drops by 47.7%–89.5% after the change-point of time series. The nonstationary probability distribution models with GRRI as the covariate have better fitting effects than nonstationary models with RR as the covariate. With the incorporation of the impacts of effective rainfall, the GRRI can more accurately capture the occurrence of nonstationarity in the downstream hydrological frequency. These results might be helpful for exploring the impact mechanism of the reservoir regulation on the downstream hydrological variables as well as ecological management of basin.
1 Introduction
Hydrological frequency analysis is a statistical measure to determine the occurrence probability of hydrological events by fitting the probability distribution with observed data (Bhat et al., 2019). The traditional hydrological frequency analysis is based on the assumption of independence and stationarity. However, due to the impact of climate change and human activities, the assumption of stationarity has been challenged (Xiong and Guo, 2004; Milly et al., 2008; Salas and Obeysekera, 2014; Milly and Dunne, 2020), and the nonstationary hydrological frequency analysis has received more and more attention from hydrologists (Vogel et al., 2011; Jiang et al., 2017; Wen et al., 2019a; Xiong et al., 2020; Liu et al., 2019; Li et al., 2021).
The nonstationary hydrological frequency analysis is usually based on the covariate analysis, that is, the probability distribution parameters are expressed as functions of covariates (Rigby and Stasinopoulos, 2005), so it is critical to accurately capture the driving factors of hydrological variables (Jiang et al., 2019; Xiong et al., 2020; Li et al., 2022). For river basins that are greatly disturbed by humans, the hydrological variables (such as water level, water flow, sediment concentration) in the river channel are significantly altered by human activities. Among them, the reservoir regulation has a conspicuous impact on the downstream hydrological variables (Graf, 1999; Yang et al., 2002; Batalla et al., 2004; Yang et al., 2006; Yang et al., 2008; Döll et al., 2009; Rossi et al., 2009; Biemans et al., 2011; Zhang et al., 2015; Wu et al., 2018; Xiong et al., 2019; Li R. et al., 2020; Li et al., 2022), especially the spread of water flow and the sediment transport from upstream to downstream (Figure 1). Before the reservoir construction, the water flow and sediment in the river channel spread freely downstream without hindrance. After the reservoir construction, the magnitude of the water flow becomes flat due to the weakening of the reservoir. And usually the water flow in the reservoir area is slow, the sediment carried by the flow will be deposited in the reservoir, and only a small amount of sediment will be carried downstream, so the sediment will be reduced and the river will become clear in the downstream. Reservoir construction can effectively reduce flood peaks, change the intra-annual distribution of runoff and intercept sediment, therefore, it can improve soil erosion, increase the assurance of water for crops, and have a very obvious impact on vegetation ecology and agricultural irrigation. The regulation effect of the reservoirs on water flow is usually quantified by the reservoir index (RI) (López and Francés, 2013), and the interception effect of the reservoirs on sediment is usually quantified by the sediment trapping efficiency (TE) of reservoirs (Brune, 1953; Vörösmarty et al., 2003), both of which are defined based on the static storage capacity of the reservoir, and they are widely used by hydrologists to analyze the impact of reservoirs on hydrological variables (Zhang et al., 2015; Ray and Goel, 2019; Xiong et al., 2019; Li R. et al., 2020; 2022).
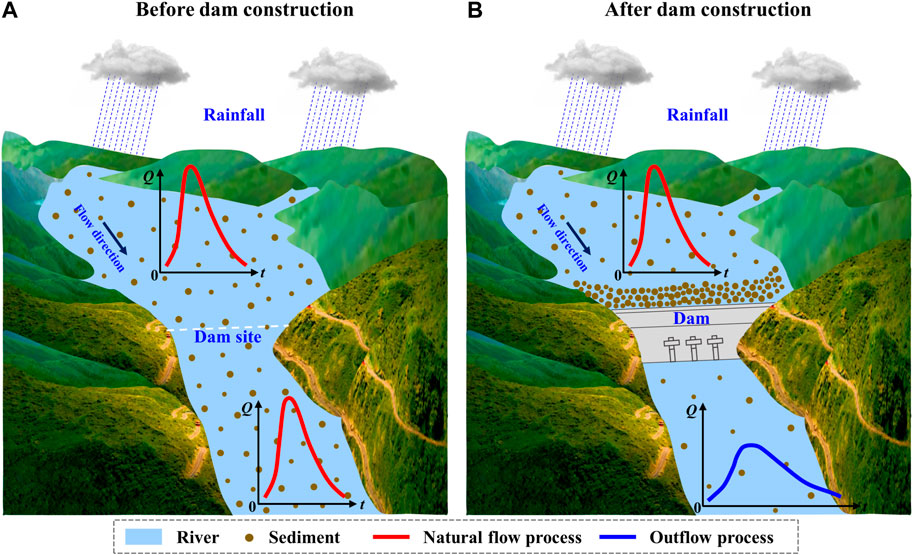
FIGURE 1. Sketch map about reservoir impacts on the streamflow and sediment.
However, the regulating effect of reservoirs on hydrological variables (flood, runoff, sediment load and so on) is not only related to static storage capacity, but also to reservoir operation, which changes dynamically with rainfall. The reservoir operation strategy also changes in real time in the case of high inflow and low inflow (Ahmadi et al., 2015), which is not completely consistent with the idea of quantifying the reservoir effects by RI and TE (as long as no new reservoir is built in the basin, the regulation capacity of the reservoir is the same every year). Therefore, it is necessary to consider both the static storage capacity and the dynamic operation of reservoirs to investigate the reservoir impacts on the nonstationarity of downstream hydrological variables. Xiong et al. (2019) defined the rainfall-reservoir composite index (RRCI) that combined both the RI and the exceedance probability of scheduling-related multiday antecedent rainfall input variables, and they found that fitting effect of nonstationary probability distribution model with RRCI as the covariate was better than the model with RI as the covariate. Li R. et al. (2020) developed the rainfall-augmented sediment trapping index (RSTI) that coupled TE and rainfall characteristics, and used RSTI, TE, rainfall characteristics such as rainfall amount and rainfall intensity as dependent variables to simulate sediment load. The results showed that RSTI could achieve better simulations than other factors in both linear and nonlinear regression models. In essence, the action mechanisms of rainfall and reservoirs on different hydrological variables in the river is similar, so how to establish a general index to explain the effects of rainfall and reservoirs on downstream hydrological variables (such as flood, runoff, and sediment load) is worth exploring.
Therefore, the major objectives of this paper are as follows: 1) develop a general rainfall-reservoir index (GRRI) by coupling effective rainfall that drives hydrological variables and reservoir regulation indicator to quantify the reservoirs impacts on the downstream hydrological variables; 2) compare the GRRI with RR by carrying out the covariate-based nonstationary hydrological frequency analysis. Three sub-basins (Min River, Wu River, and Han River) of the Yangtze River basin and the Cuntan station on the main stream are selected as case studies to perform the research in this paper, it has been found that hydrological processes in these basins have been altered by climate change and reservoir constructions (Tang et al., 2013; Wu et al., 2018; Xiong et al., 2019; Li R. et al., 2020; Guo et al., 2020; Lu et al., 2020).
The rest of this paper is organized as follows: the methods used in this study are described in the next section; Section 3 introduces the study area and data used in this study; the results of this study are presented in Section 4; in Section 5, some discussions are described, and the main conclusions are summarized in Section 6.
2 Methods
2.1 Trend and change-point analysis
The Mann-Kendall (MK) test (Mann, 1945; Kendall, 1975) and Pettitt (PT) test (Pettitt, 1979) are widely used as non-parametric methods for trend and change-point detection in hydro-meteorological series, respectively.
2.1.1 Mann-Kendall test
The Mann-Kendall statistic S is defined as follows for a series
in which,
The standard normal statistic Z is calculated as Eq. 3 and the variance of S is
At a certain significance level α, if the absolute value of Z is greater than the standard normal variate then the trend of the series changes obviously and there is an upward trend when
2.1.2 Pettitt test
The Pettitt statistic Kt is defined as follows for a series
where,
Eq. 6 is used to calculate the probability values (pPT) when the change-point of the series is located at Kt and there is a significant change-point when pPT<α.
2.2 General rainfall-reservoir index (GRRI)
In order to accurately assess the reservoir impacts on the downstream hydrological variables, in this study, a general rainfall-reservoir index (GRRI) is developed by coupling effective rainfall that drives hydrological variables and reservoir regulation indicator, and it is defined as follows
where, FER is the probability distribution of effective rainfall, which can be the probability distribution of univariate rainfall event or the joint probability distribution of multivariate rainfall event; RR is an indicator that symbolizes the impact of reservoir regulation, e.g., reservoir index (RI) and sediment trapping efficiency (TE). The relationship between GRRI and RR and FER is shown in Figure 2.

FIGURE 2. Relationship of the general rainfall-reservoir index (GRRI) to probability distribution of effective rainfall (FER) and reservoir regulation indicator (RR) described in Eq. 7.
Since
When
For various hydrological variables, different effective rainfall and reservoir regulation indicators are selected to calculate GRRI as covariates for nonstationary hydrological frequency analysis. In this study, the two hydrological variables of flood and annual sediment load are taken as examples, their corresponding GRRIs are calculated according to Eq. 7, which are marked as GRRI_Q and GRRI_S respectively. Specific details on how to identify the effective rainfall and reservoir regulation indicator for flood and annual sediment load are described below.
2.2.1 Identifying the effective rainfall
Multi-day antecedent rainfall is the most direct meteorological condition affecting flood events (Bennett et al., 2018). In this study, 20 levels of multi-day antecedent rainfall are counted, namely, the rainfall on the day when the flood peak occurred, the sum of the rainfall on the day of the flood peak and the rainfall on the previous day, and the sum of the rainfall on the day when the flood peak occurred and the rainfall on the previous 2, 3, 4, 5, 6, 7, 8, 9, 10, 11, 12, 13, 14, 15, 16, 17, 18, 19 days, they are recorded as P1, P2, P3, P4, P5, P6, P7, P8, P9, P10, P11, P12, P13, P14, P15, P16, P17, P18, P19 and P20 respectively. The one with the strongest Pearson correlation coefficient with flood is chosen as the effective rainfall for flood.
The rainfall amount and rainfall intensity reaching a certain level affect the sediment generation and transport (Wen et al., 2019b; Li R. et al., 2020). In this study, 16 threshold levels (TL) of daily rainfall intensity, i.e., TL=0, 1, 2, 4, 6, 8, 10, 15, 20, 25, 30, 35, 40, 45, 50, 55 mm/day, are selected to calculate the homologous rainfall amount (marked as A0, A1, A2, A4, A6, A8, A10, A15, A20, A25, A30, A35, A40, A45, A50, and A55) by summing the amount of all daily rainfall events with an intensity higher than the given TL value, and to calculate the homologous rainfall intensity (marked as I0, I1, I2, I4, I6, I8, I10, I15, I20, I25, I30, I35, I40, I45, I50, and I55) by averaging all daily rainfall intensity with an intensity higher than the given TL value. Among the rainfall amount and rainfall intensity corresponding to different TL, rainfall variables with the strongest correlation with sediment load are considered to be the effective rainfall affecting the sediment load. The joint distribution of effective rainfall amount and effective rainfall intensity is constructed as the probability distribution of effective rainfall by using copula theory (Sklar, 1959; Nelsen, 2006) to participate in the calculation of GRRI_S. If only rainfall amount or rainfall intensity is significantly correlated with sediment load, the effective rainfall contains only one rainfall characteristic, and its univariate probability distribution is established for calculating GRRI_S.
The distribution of effective rainfall can be fitted using either theoretical distribution or empirical distribution, the latter being easier to calculate and apply in practice.
2.2.2 Reservoir regulation indicator
The reservoir regulation indicator (RR) include the reservoir index (RI) for flood discharge and the sediment trapping efficiency (TE) of reservoirs for river sediment, both of which are calculated as follows:
The RI (López and Francés, 2013; Jiang et al., 2015) is defined to reflect the impact of reservoirs on the downstream streamflow, which is a dimensionless indicator with the following expression
where N is the total number of reservoirs upstream of the hydrological station; Ai is the controlled basin area of the ith reservoir upstream, km2; AT is the total basin area controlled by the hydrological station, km2; Vi is the total storage capability of the ith reservoir, m3;
The TE was proposed by Brune (1953) and developed by Vörösmarty et al. (2003) for quantifying reservoir’s ability to intercept sediment, it is based on dividing a basin into multiple (≥2) subareas by considering the differences in geographical location of reservoirs in the basin (Vörösmarty et al., 2003), which is defined as follows
where TE is the trapping efficiency for entire basin;
Therefore, in this study, RI is taken as the reservoir regulation indicator for flood, TE is used as the reservoir regulation indicator for annual sediment load.
2.3 Covariate-based nonstationary frequency analysis
The covariate-based nonstationary frequency analysis has been widely concerned by hydrologists (Strupczewski et al., 2001; Rigby and Stasinopoulos, 2005; Villarini et al., 2010; Salas and Obeysekera, 2014; Jiang et al., 2015; Xiong et al., 2020; Li et al., 2022), in which distribution parameters are expressed as the function of covariates/explanatory variables. In this study, Weibull (WEI), Gumbel (GU), Gamma (GA), Logistic (LO), Normal (NO), Lognormal (LNO), Generalized extreme value (GEV), and Pearson type III (P-III) distribution are used as candidate distributions to fit hydrological series, the location parameter (
where
3 Study area and data
3.1 The study area
The Yangtze River is the largest river in China measuring approximately 6,397 km in length. It spans the three steps of China’s terrain from west to east, and flows through 11 provinces. The total basin area is about 1.8 million km2, accounting for 18.8% of China’s land area. The vast area and complex topography have created the diverse monsoon climate characteristics of the Yangtze River basin. The average annual precipitation is about 1,100 mm, with large inter-annual variation and uneven distribution within the year. The annual runoff of the Yangtze River basin reaches 960 billion m3 and is rich in hydropower resources. The degree of hydropower development and water resource utilization in the basin is relatively high, forming the world’s largest reservoir group with the Three Gorges Reservoir as the core (Xu and Zhang, 2018; Li H. et al., 2020). The basin has a well-developed river network and numerous tributaries, with 8 basins exceeding 80,000 km2, 49 basins more than 10,000 km2. In this paper, the Min River basin, Wu River basin, Han River basin and the Cuntan station on the main stream (Figure 3) are taken as typical study areas to carry out the nonstationary hydrological frequency analysis.
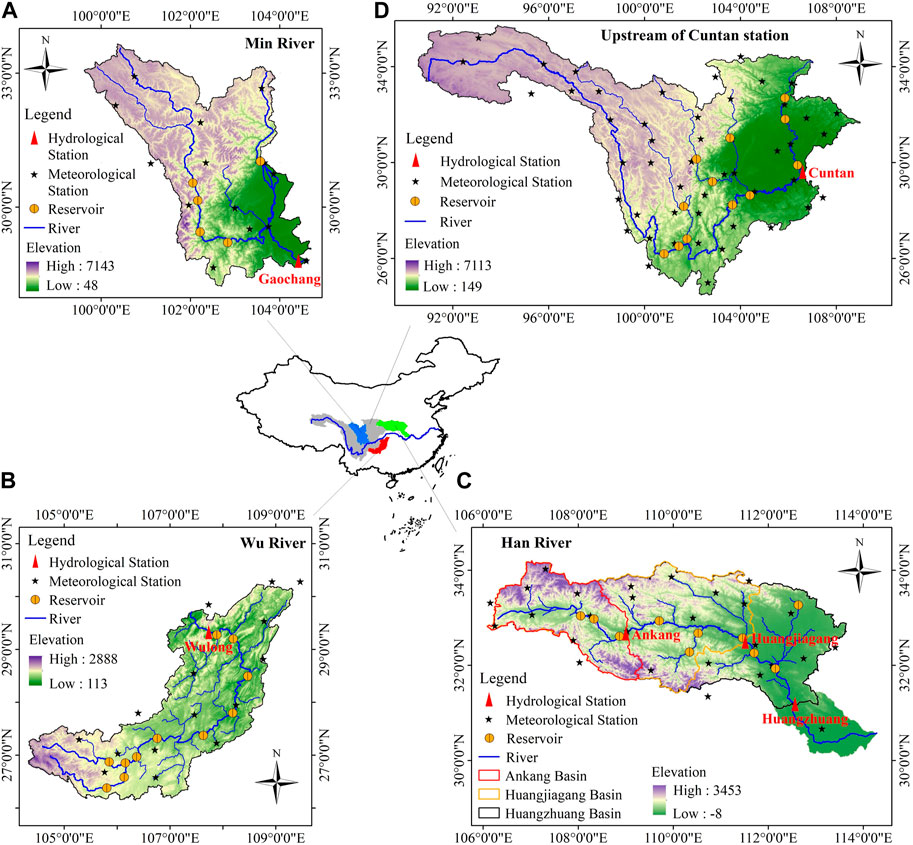
FIGURE 3. Sketch map of study area.
The Min River is situated 99°37′E-104°38′E and 28°13′N-33°38′N, covering a total area of 135,387 km2. It is located in the upper reaches of the Yangtze River with a length of 735 km. The annual average temperature is 15°C and mean annual precipitation ranges from 800 mm to 1,100 mm (Tang et al., 2013). The Wu River, with the coordinates of 104°18′E-109°22′E and 26°07′N-30°22′N, and a catchment area of 87,920 km2, is the largest tributary in the upper reaches of the Yangtze River measuring approximately 1,050 km in length. The annual average temperature varies from 13°C to 18°C and mean annual precipitation is from 900 mm to 1,400 mm (Wu et al., 2018; Li R. et al., 2020). The Han River is situated 106°00′E-114°00′E and 30°30′N-34°30′N, covering a total area of 159,000 km2. It is located in the middle reaches of the Yangtze River with a length of 1,532 km and is the largest tributary of the Yangtze River. The annual average temperature is 14°C–16°C and mean annual precipitation varies from 700 mm to 1,100 mm (Xiong et al., 2019; Xie et al., 2021). The Cuntan hydrological station is a crucial control station for the main stream of the upper Yangtze River, controlling nearly one-half of the Yangtze River basin (catchment area: 866,559 km2), the annual average temperature is 13°C and mean annual precipitation is 1,004 mm. Many reservoirs in these basins have been built and put into operation, among which, the nonstationary analysis of Cuntan station only considers the large reservoirs with a total storage capacity greater than 1 billion m3, and the information of all reservoirs is listed in Table 1.

TABLE 1. Characteristic parameters of the reservoirs in the study area.
3.2 Data
In this study, the collected data include streamflow data, sediment data, rainfall data and reservoir data in the study area. Specifically, daily discharge, daily rainfall, and annual sediment load records during 1960–2019 of Gaochang (GC) station in Min River; daily discharge, daily rainfall, and annual sediment load records of Wulong (WL) station in Wu River from 1952 to 2019; daily discharge and daily rainfall records (1956–2019) of Ankang (AK) station and Huangjiagang (HJG) station in Han River; daily discharge, daily rainfall, and annual sediment load records during 1953–2019 of Huangzhuang (HZ) station in Han River; and daily discharge, daily rainfall, and annual sediment load records of Cuntan (CT) station on the main stream of Yangtze River from 1960 to 2019. The streamflow data and sediment data are provided by the Hydrology Bureau of the Changjiang Water Resources Commission, China (http://www.cjh.com.cn/en/), and the rainfall data is obtained from the National Climate Center of the China Meteorological Administration (http://data.cma.cn/site/index.html).
4 Results
4.1 Temporal variations of hydrological series
The Mann-Kendall test and Pettitt test are used for trend and change-point testing of annual maximum daily discharge (Q) and annual sediment load (S) of GC, WL, AK, HJG, HZ, and CT station, the results are shown in Table 2. From the results in the table, it can be seen that, except for Q at CT station, the other hydrological variables of the six stations have significant decreasing trends or change-points at the significance level of 0.1. It is not difficult to find that the change-points in the hydrological series are closely linked with the time of the construction of the large reservoirs in the basin. Since the nonstationary diagnosis results of flood series at CT station are not significant, the nonstationary flood frequency analysis of CT station will not be carried out below.
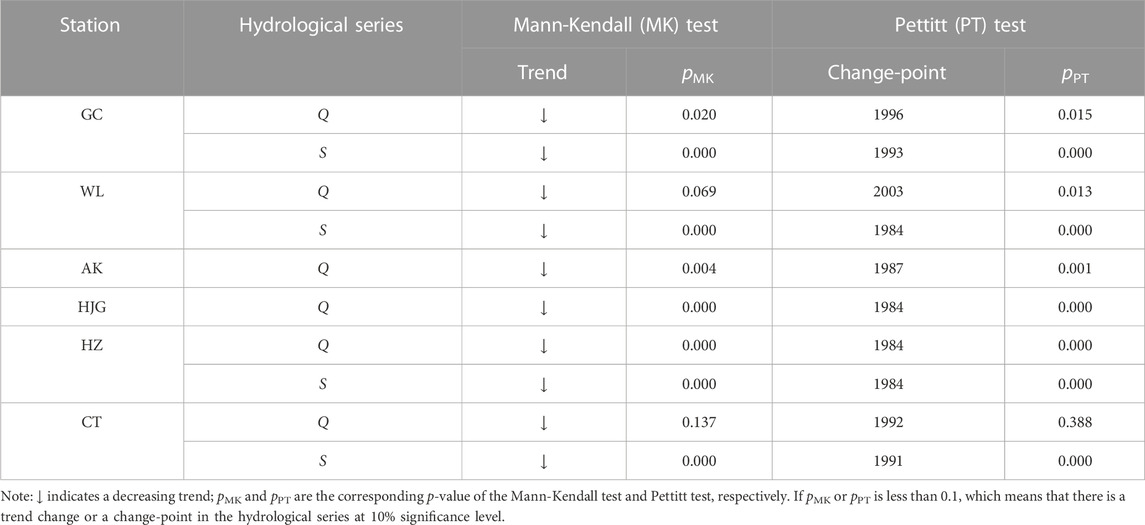
TABLE 2. The results of trend test by Mann-Kendall method and change-point test by Pettitt method for hydrological series.
The inter-annual time series of Q and S at GC, WL, AK, HJG, HZ, CT station are displayed in Figure 4. It can be seen from the figure that all hydrological series at the six stations presented downward trends after 1980 or 1990 when large reservoirs were built in the basin, which is consistent with the results of Mann-Kendall test. As displayed in Table 3, both the mean and coefficient of variance (Cv) of each hydrological series change greatly after the change-point compared with that before the change-point. In addition to the mean of Q at CT station reduces by 10.6%, the mean of Q at other stations decreases by 22.8%–60.6%, and the mean of S drops sharply by 47.7%–89.5%.
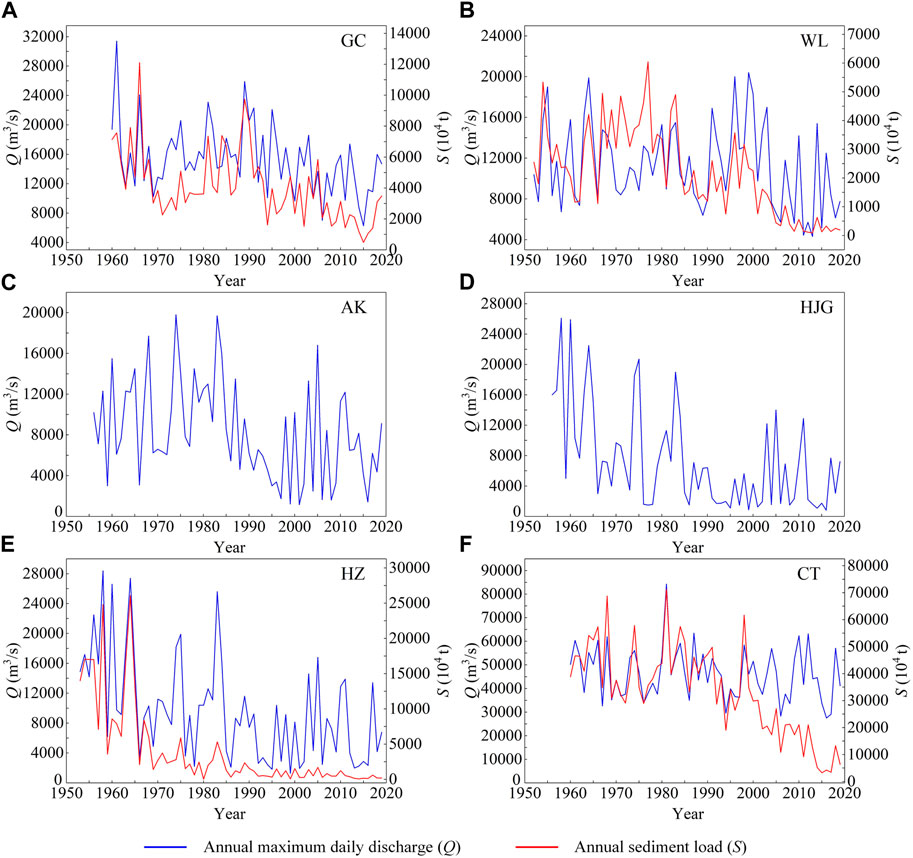
FIGURE 4. Time series of hydrological variables at (A) GC station, (B) WL station, (C) AK station, (D) HJG station, (E) HZ station and (F) CT station.
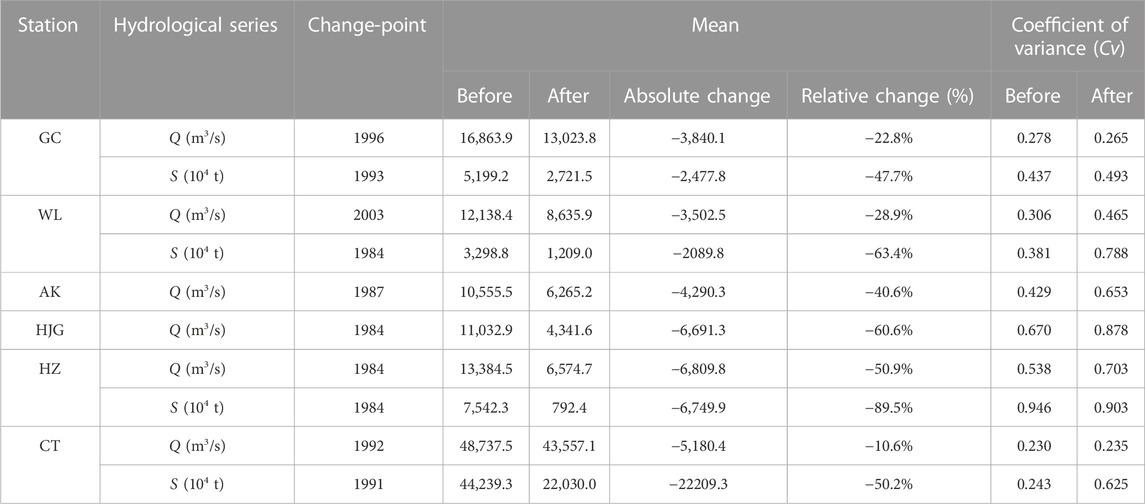
TABLE 3. Comparison of statistical characteristics for hydrological series before and after the change-point.
4.2 Results for the general rainfall-reservoir index (GRRI)
4.2.1 Identification of effective rainfall
Figure 5 presents the Pearson linear correlation between rainfall characteristics (including multi-day antecedent rainfall with 20 levels, rainfall amount and rainfall intensity with 16 threshold levels as described in Section 2.2) and hydrological variables including Q and S at the six hydrological stations (GC, WL, AK, HJG, HZ, and CT). It is found that, P7, P6, P4, P5, and P17 are the most relevant rainfall characteristics for Q at GC, WL, AK, HJG, and HZ station, respectively. For annual sediment load, A15 and I2 are the most relevant rainfall characteristics for S at GC station, A6 and I1 are the most relevant rainfall variables for S at WL station, while S at HZ station is only significantly correlated with A0 (i.e., the annual rainfall), but has no obvious correlation with the rainfall intensity at different threshold levels, A6 and I2 are the most relevant rainfall characteristics for S at CT station. These rainfall characteristics most correlated with hydrological variables are selected as effective rainfall to calculate the general rainfall-reservoir index (GRRI). The probability distribution of effective rainfall for both flood and sediment load are constructed based on empirical distribution. For the case that effective rainfall contains multiple rainfall characteristics, the probability distribution can be deduced from empirical Copula (Li R. et al., 2020).
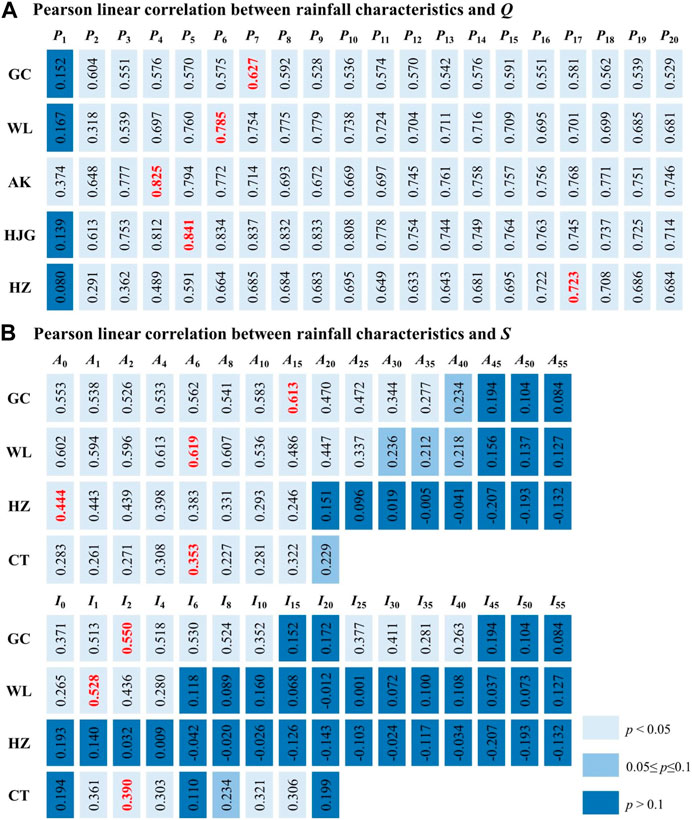
FIGURE 5. Identification of the effective rainfall for hydrological variables including Q and S in the study area.
4.2.2 GRRI calculation
To calculate the annual values of the general rainfall-reservoir index (GRRI), the reservoir index (RI) and sediment trapping efficiency (TE) should be estimated first. The calculation of TE requires dividing a basin into multiple subareas (as in Figure 6) according to the differences in geographical location of reservoirs in the basin. The Min River basin is divided into two subareas, the outlet of the two subareas are Tongjiezi station and Zipingpu station, and the mean annual runoff at the outlet is 470.0 × 10⁸ m3 and 148.0 × 10⁸ m3 respectively. The Wu River basin is divided into three subareas, the outlet of the three subareas are Yachihe station, Sinan station and Wulong station respectively, and the mean annual runoff at the outlet is 100.9 × 10⁸ m3, 271.0 × 10⁸ m3 and 486.4 × 10⁸ m3 respectively. The controlled basin by HZ station is divided into five subareas, the outlet of the five subareas are Ankang station, Huangjiagang station, Huanglongtan station, Baihe station and Huangzhuang station, and the mean annual runoff at the outlet is 184.6×10⁸ m3, 343.6×10⁸ m3, 55.0×10⁸ m3, 20.0×10⁸ m3 and 455.0×10⁸ m3 respectively. The upstream of CT station is divided into five subareas, the outlet of the five subareas are Panzhihua station, Tongzilin station, Xiangjiaba station, Gaochang station and Beibei station, and the mean annual runoff at the outlet is 567.6 × 10⁸ m3, 590.6 × 10⁸ m3, 1,433.0 × 108 m3, 841.0 × 10⁸ m3 and 650.6 × 10⁸ m3 respectively. Then, the TE at GC, WL, HZ and CT station is calculated by Eqs 11, 12, as shown by the red dashed lines in Figure 7, the RI of the study area is computed by Eq. 10, as displayed by the blue dashed lines in Figure 7. Next, the GRRI is calculated by Eq. 7 based on RI, TE and the probability distribution of effective rainfall obtained in Section 4.2.1, and general rainfall-reservoir index for flood and annual sediment load (i.e., GRRI_Q and GRRI_S) are displayed as solid lines in Figure 7. They all significantly correlated with hydrological variables including Q and S (Table 4).

FIGURE 6. Sketch diagram of reservoirs in the study area for calculating the sediment trapping efficiency (TE).
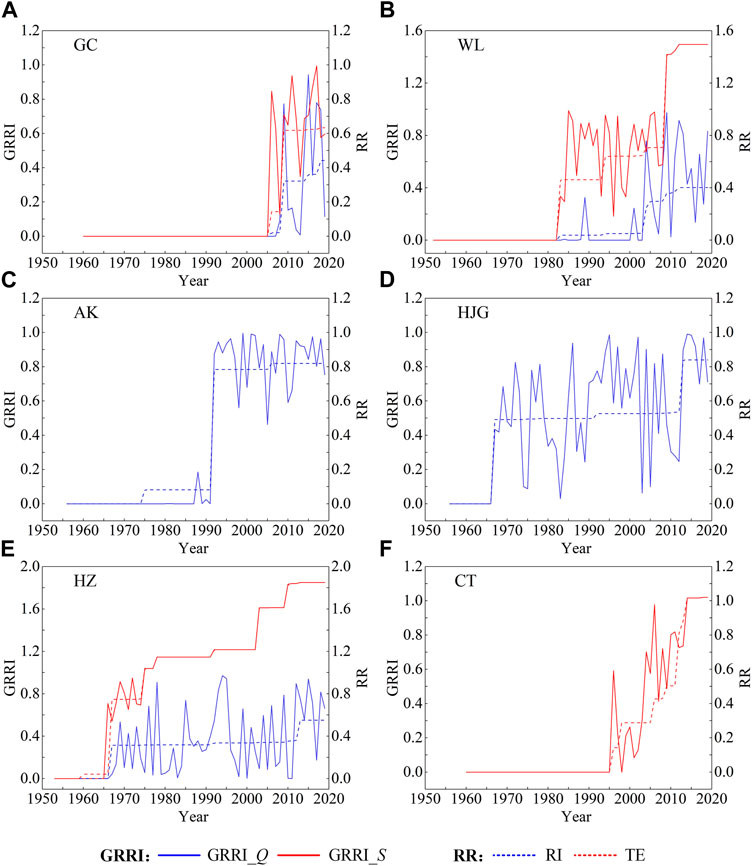
FIGURE 7. The time series of RR (RI and TE) and GRRI (GRRI_Q and GRRI_S).

TABLE 4. Pearson linear correlation coefficients between hydrological variables and the general rainfall-reservoir index (GRRI).
4.3 Frequency analysis of flood and sediment load
The stationary hydrological frequency analysis and nonstationary hydrological frequency analysis with RR (RI and TE) or GRRI (GRRI_Q and GRRI_S) as the covariate are carried out separately for Q and S at each hydrological station to investigate how the reservoirs affect downstream flood and sediment load. The summary of the results for fitting the stationary and nonstationary probability distribution models to the Q and S is shown in Table 5. The relative size of SBC values indicates that the nonstationary models are better than the stationary models for Q and S at all stations, and the nonstationary probability distribution models with GRRI as the covariate have better fitting effects than nonstationary models with RR as the covariate, and the results of KS test indicating that the selected models are all reasonable. Therefore, the nonstationary model with GRRI as the covariate is the best model, which is obviously more suitable for the hydrological frequency analysis at GC, WL, AK, HJG, HZ, and CT station. For the nonstationary probability distributions, the location parameter
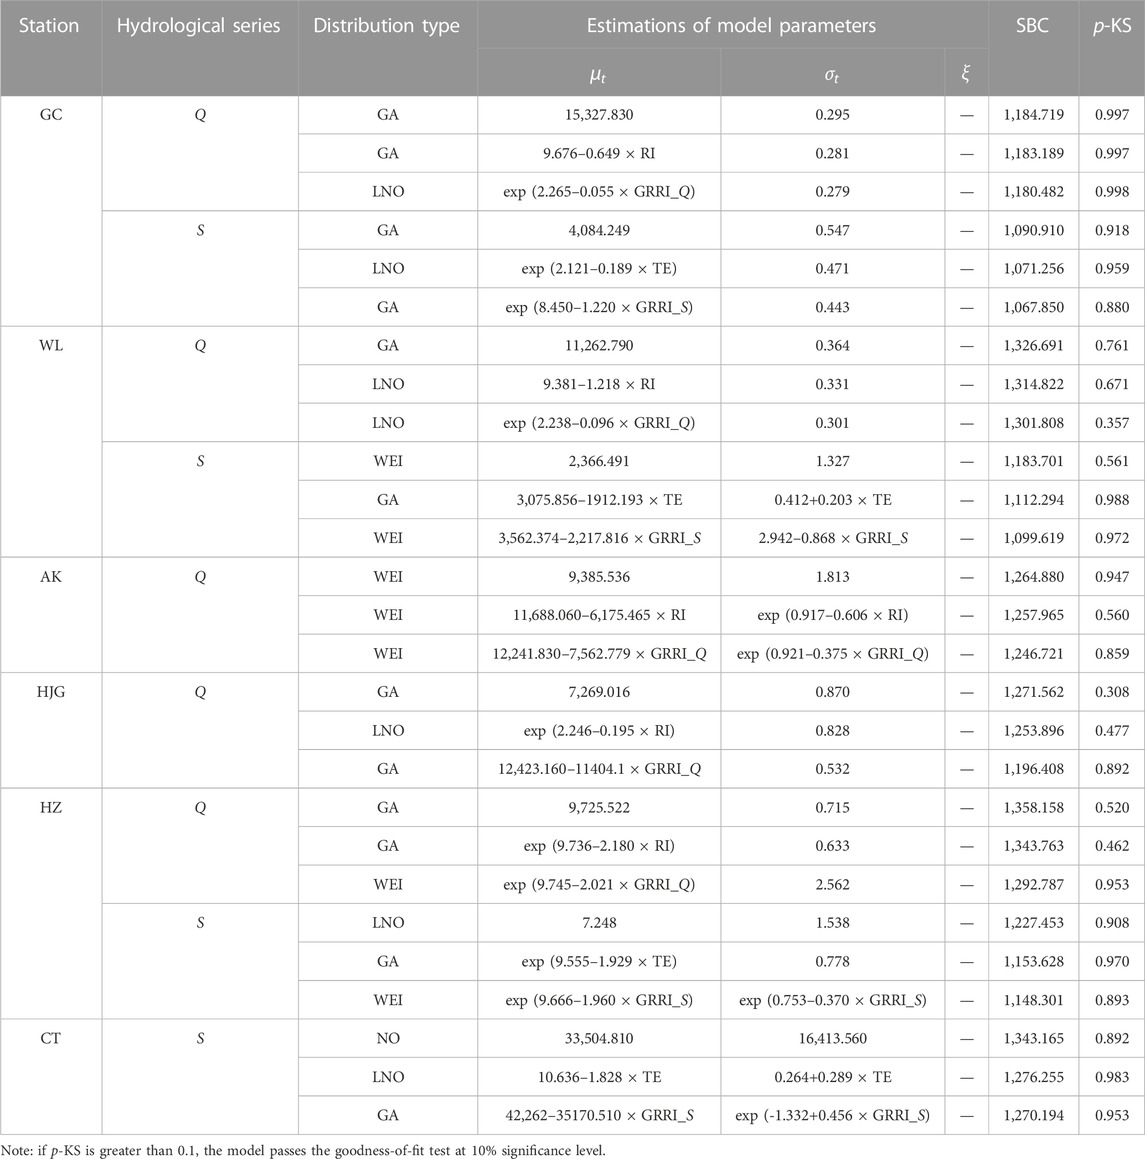
TABLE 5. Summary of the results of stationary and nonstationary probability distribution models for hydrological series. For the Q, the results presented in the table include three models, that is the stationary model, the optimal nonstationary model with RI as the covariate, and the optimal nonstationary model with GRRI_Q as the covariate; For the S, the results shown in the table cover three models, namely, the stationary model, the best nonstationary model with TE as the covariate, and the best nonstationary model with GRRI_S as the covariate.
The quantile curve plots (Figure 8 for flood and Figure 9 for annual sediment load) demonstrate that the magnitude of Q and S decreases since 1980 or 1990 when a large number of reservoirs are constructed upstream of the hydrological station, and hydrological series is well fitted by the best models. Undoubtedly, with the incorporation of the impacts of effective rainfall, the GRRI can more conveniently and accurately capture the occurrence of nonstationarity in the downstream hydrological frequency. Taking the HJG station and WL station as an example, when the Danjiangkou Reservoir, 6.19 km upstream of the HJG, was built in 1967, flood discharge of HJG began to decrease. As more reservoirs were put into operation, flood discharge continued to decrease. However, some relatively large events still occurred, such as 20,700 m3/s in 1975. When the Wujiangdu Reservoir was completed in 1983, sediment load of WL began to decrease. As more reservoirs were constructed, the magnitude of sediment load kept decreasing. Whereas, some relatively large events still occurred, such as 3,575 × 104 t in 1996. Obviously, the occurrence of this phenomenon can be well explained by GRRI, while RR is powerless in this regard.
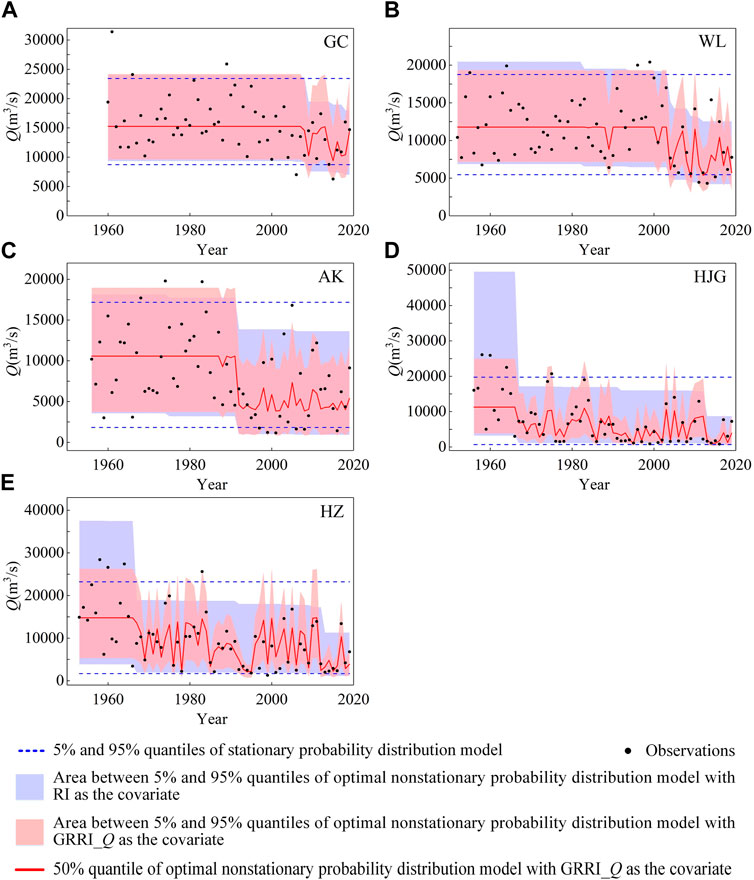
FIGURE 8. Quantile curve plots of stationary probability distribution model and optimal nonstationary probability distribution model with GRRI_Q as the covariate for flood.
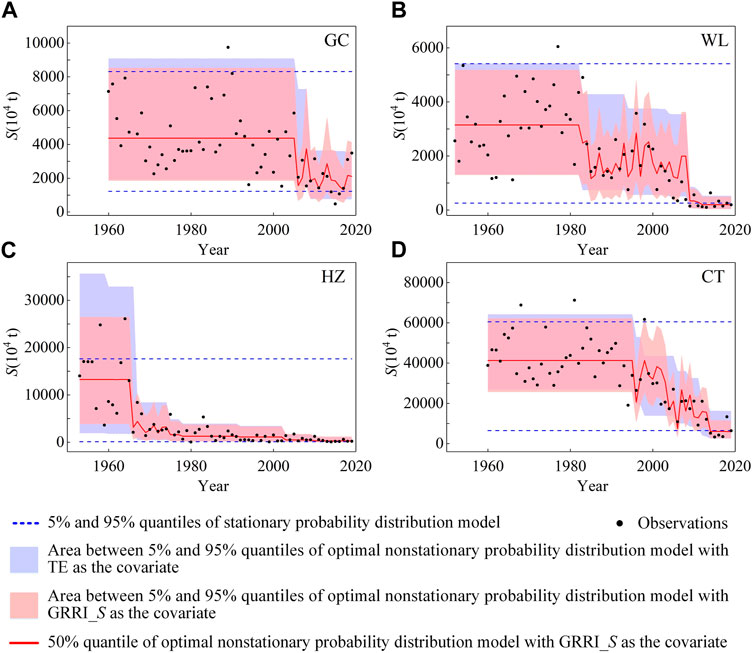
FIGURE 9. Quantile curve plots of stationary probability distribution model and optimal nonstationary probability distribution model with GRRI_S as the covariate for annual sediment load.
5 Discussions
The long-term variation in the hydrological series and the quantile curves of nonstationary probability distribution models with RR (RI and TE) or GRRI (GRRI_Q and GRRI_S) as the covariate in Figures 8, 9 demonstrate that upstream reservoirs evidently altered the downstream hydrological regimes, which is consistent with the results of reservoirs impacts on the hydrological regime in the basin found in previous studies (Jiang et al., 2015; Wu et al., 2018; Xiong et al., 2019; Li R. et al., 2020; Lu et al., 2020). From Table 5 and Figures 8, 9, nonstationary probability distribution models with GRRI as the covariate are better than nonstationary models with RR as the covariate, therefore, the GRRI might be a useful index for capturing the nonstationarity in the downstream hydrological frequency induced by reservoirs. Similar results could be found in the study by Xiong et al. (2019) and Li R. et al. (2020). The study of Xiong et al. (2019) showed that in the nonstationary flood frequency analysis of the Han River basin, the rainfall-reservoir composite index (RRCI) coupled with rainfall characteristics and reservoir index (RI) has a better model fitting effect than RI. Li R. et al. (2020) used rainfall amount, rainfall intensity, sediment trapping efficiency (TE), and rainfall-augmented sediment trapping index (RSTI) coupled with rainfall characteristics and TE as dependent variables to establish regression models for simulating the sediment load in the Wu River basin, they found that both the linear regression model and the nonlinear regression model with RSTI as the covariate are superior to the cases with other factors as the covariate. Due to the combination of effective rainfall, the GRRI (GRRI_Q and GRRI_S) is significantly different from RR (RI and TE) (Figure 7). When GRRI and RR are in the range of 0–1, GRRI is sometimes larger than RR and sometimes smaller than RR, so the actual reservoir effect may be incorrectly estimated by the RR.
When large-scale reservoirs are built in the basin, the magnitude of downstream hydrological variables is generally small in most cases (Figures 8, 9), however some events with large magnitude may also occur. For example, most values of Q at HJG station were less than 10,000 m3/s after 1967, but Q in 1975 was 20,700 m3/s, and most values of S at WL station were less than 2,000×104 t since 1983, but S in 1996 was 3,575×104 t. The occurrence of these events may be related to the impact of rainfall on the reservoir operation. Therefore, rainfall effects must be considered in addition to reservoir storage capacity when attempting to accurately quantify the reservoir impacts on downstream hydrological variables. For example, in this paper, only those multi-day antecedent rainfall samples corresponding to the timing of the annual maximum daily discharge were selected for flood frequency analysis. This means that extreme rainfall events corresponding to the non-annual maximum daily discharge cannot be included, resulting in certain errors in the estimation of rainfall probability distributions. Therefore, peaks-over-threshold sampling method may be considered to reduce this error when analyzing the impact of reservoirs on flooding (Xiong et al., 2019).
In the reservoir impact analysis of this study, the results of the hydrological frequency analysis considering reservoir impacts have obtained better simulations (Figures 8, 9) and the change-point results correspond to the time of completion of large reservoirs in the basin. These results demonstrated that the hydrological series in the basin is mainly influenced by the operation of large reservoirs in the Yangtze River basin (Xu and Zhang, 2018; Li H. et al., 2020; Li et al., 2022; Zhang et al., 2022). The construction of large reservoirs will undoubtedly affect the observation data and may lead to nonstationarity, so all large reservoirs should be considered in the study of reservoir impact analysis, and small reservoirs with insignificant regulation effects should be considered as far as possible when data are available. In addition, reservoir construction is not the only human activity that has an impact on hydrological variables, for example, hydrological variables may also be affected by the underlying surface conditions of the basin, which should be paid more attention to the study of basins with obvious underlying surface changes, such as the Yellow River basin in northern China (Zhu et al., 2015; Wang et al., 2017; Xu et al., 2018; Zhang et al., 2018). In order to gain a clearer understanding of the hydrological mechanisms under changing environments, it is necessary to comprehensively analyze the causes for the changes in the hydrological series in future research. For example, the study on floods can consider the influence of artificial flood diversion and detention, and the study on sediment load can consider the impact of artificial sand mining activities and land use and land cover change in the basin.
6 Conclusion
In order to accurately assess the reservoirs impacts on the downstream hydrological variables and provide theoretical reference for ecological sustainable development and agricultural irrigation, a general rainfall-reservoir index (GRRI) is developed by coupling effective rainfall that drives hydrological variables and reservoir regulation indicator in this study. The annual maximum daily discharge (Q) and annual sediment load (S) of Gaochang (GC) station in Min River, Wulong (WL) station in Wu River, Ankang (AK), Huangjiagang (HJG) and Huangzhuang (HZ) station in Han River, and Cuntan (CT) station on the main stream of the upper Yangtze River are selected as case studies for performing the nonstationary hydrological frequency analysis based on GRRI to illustrate the reservoir effects on the downstream flood and sediment load. The main findings are summarized as follows.
(1) The Q and S at GC station, Q and S at WL station, Q at AK station and HJG station, Q and S at HZ station, S at CT station all have significant decreasing trends or change points, and the change-points in the hydrological series are closely linked with the time of the construction of the large reservoirs in the basin. Compared with the mean of hydrological series before the change-point, the mean after the change-point has a great change: Q decreases by 22.8%–60.6%, and S drops sharply by 47.7%–89.5%.
(2) For developing GRRI, the effective rainfall for Q and S are optimized. The effective rainfall for Q at GC, WL, AK, HJG and HZ station are 7-day, 6-day, 4-day, 5-day and 17-day antecedent rainfall (including the rainfall on the day when the flood peak occurred), respectively. The effective rainfall for S at GC station is A15 (rainfall amount with an intensity higher than 15 mm/day) and I2 (rainfall intensity higher than 2 mm/day); the effective rainfall for S at WL station is A6 and I1; the effective rainfall for S at CT station is A6 and I2; and the effective rainfall for S at HZ station is annual rainfall.
(3) All the nonstationary probability distribution models are better than the stationary models for Q and S at six stations, and the nonstationary probability distribution models with GRRI as the covariate have better fitting effects than nonstationary models with RR as the covariate. With the incorporation of the impacts of effective rainfall, the GRRI can more accurately capture the occurrence of nonstationarity in the downstream hydrological frequency.
Data availability statement
The original contributions presented in the study are included in the article/supplementary material, further inquiries can be directed to the corresponding author.
Author contributions
RL: methodology; investigation; formal analysis; writing-original draft. GX: project administration; writing—review and editing; funding acquisition.
Funding
This research is financially supported by the National Natural Science Foundation of China (NSFC Grants 51979219).
Conflict of interest
The authors declare that the research was conducted in the absence of any commercial or financial relationships that could be construed as a potential conflict of interest.
Publisher’s note
All claims expressed in this article are solely those of the authors and do not necessarily represent those of their affiliated organizations, or those of the publisher, the editors and the reviewers. Any product that may be evaluated in this article, or claim that may be made by its manufacturer, is not guaranteed or endorsed by the publisher.
References
Ahmadi, M., Haddad, O. B., and Loáiciga, H. A. (2015). Adaptive reservoir operation rules under climatic change. Water Resour. Manag. 29, 1247–1266. doi:10.1007/s11269-014-0871-0
Batalla, R. J., Gomez, C. M., and Kondolf, G. M. (2004). Reservoir-induced hydrological changes in the Ebro River basin (NE Spain). J. Hydrol. 290, 117–136. doi:10.1016/j.jhydrol.2003.12.002
Bennett, B., Leonard, M., Deng, Y., and Westra, S. (2018). An empirical investigation into the effect of antecedent precipitation on flood volume. J. Hydrol. 567, 435–445. doi:10.1016/j.jhydrol.2018.10.025
Bhat, M. S., Alam, A., Ahmad, B., Kotlia, B. S., Farooq, H., Taloor, A. K., et al. (2019). Flood frequency analysis of river Jhelum in Kashmir basin. Quatern. Int. 507, 288–294. doi:10.1016/j.quaint.2018.09.039
Biemans, H., Haddeland, I., Kabat, P., Ludwig, F., Hutjes, R. W. A., Heinke, J., et al. (2011). Impact of reservoirs on river discharge and irrigation water supply during the 20th century. Water Resour. Res. 47 (3), W03509. doi:10.1029/2009wr008929
Brune, G. M. (1953). Trap efficiency of reservoirs. Eos Trans. Am. Geophys. Union 34 (3), 407–418. doi:10.1029/tr034i003p00407
Döll, P., Fiedler, K., and Zhang, J. (2009). Global-scale analysis of river flow alterations due to water withdrawals and reservoirs. Hydrol. Earth Syst. Sc. 13 (12), 2413–2432. doi:10.5194/hess-13-2413-2009
Graf, W. L. (1999). Dam nation: A geographic census of American dams and their large-scale hydrologic impacts. Water Resour. Res. 35, 1305–1311. doi:10.1029/1999wr900016
Guo, W., Li, Y., Wang, H., and Cha, H. (2020). Temporal variations and influencing factors of river runoff and sediment regimes in the Yangtze River, China. Desalin. Water Treat. 174, 258–270. doi:10.5004/dwt.2020.24889
Jiang, C., Xiong, L., Guo, S., Xia, J., and Xu, C. (2017). A process-based insight into nonstationarity of the probability distribution of annual runoff. Water Resour. Res. 53 (5), 4214–4235. doi:10.1002/2016wr019863
Jiang, C., Xiong, L., Xu, C., and Guo, S. (2015). Bivariate frequency analysis of nonstationary low-flow series based on the time-varying copula. Hydrol. Process. 29 (6), 1521–1534. doi:10.1002/hyp.10288
Jiang, C., Xiong, L., Yan, L., Dong, J., and Xu, C. (2019). Multivariate hydrologic design methods under nonstationary conditions and application to engineering practice. Hydrol. Earth Syst. Sc. 23 (3), 1683–1704. doi:10.5194/hess-23-1683-2019
Li, H., Liu, P., Guo, S., Cheng, L., and Yin, J. (2020). Climatic control of Upper Yangtze River flood hazard diminished by reservoir groups. Environ. Res. Lett. 15, 124013. doi:10.1088/1748-9326/abc4fe
Li, R., Xiong, L., Xiong, B., Li, Y., Xu, Q., Cheng, L., et al. (2020). Investigating the downstream sediment load change by an index coupling effective rainfall information with reservoir sediment trapping capacity. J. Hydrol. 590, 125200. doi:10.1016/j.jhydrol.2020.125200
Li, R., Xiong, L., Zha, X., Xiong, B., Liu, H., Chen, J., et al. (2022). Impacts of climate and reservoirs on the downstream design flood hydrograph: A case study of yichang station. Nat. Hazards 113, 1803–1831. doi:10.1007/s11069-022-05370-3
Li, S., Qin, Y., Song, X., Bai, S., and Liu, Y. (2021). Nonstationary frequency analysis of the Weihe River annual runoff series using de-nonstationarity method. J. Hydraul. Eng. 26 (11), 04021034. doi:10.1061/(asce)he.1943-5584.0002125
Liu, S., Huang, S., Xie, Y., Wang, H., Leng, G., Huang, Q., et al. (2019). Identification of the non-stationarity of floods: Changing patterns, causes, and implications. Water Resour. Manag. 33 (3), 939–953. doi:10.1007/s11269-018-2150-y
López, J., and Francés, F. (2013). Non-stationary flood frequency analysis in continental Spanish rivers, using climate and reservoir indices as external covariates. Hydrol. Earth Syst. Sc. 17 (8), 3189–3203. doi:10.5194/hess-17-3189-2013
Lu, F., Song, X., Xiao, W., Zhu, K., and Xie, Z. (2020). Detecting the impact of climate and reservoirs on extreme floods using nonstationary frequency models. Stoch. Env. Res. Risk A 34 (1), 169–182. doi:10.1007/s00477-019-01747-2
Mann, H. B. (1945). Nonparametric tests against trend. Econometrica 13, 245–259. doi:10.2307/1907187
Massey, E. J. (1951). The Kolmogorov-smirnov test for goodness of fit. J. Am. Stat. Assoc. 46 (253), 68–78. doi:10.1080/01621459.1951.10500769
Milly, P. C. D., Betancourt, J., Falkenmark, M., Hirsch, R. M., Kundzewicz, Z. W., Lettenmaier, D. P., et al. (2008). Stationarity is dead: Whiter water management? Science 319 (5863), 573–574. doi:10.1126/science.1151915
Milly, P. C. D., and Dunne, K. A. (2020). Colorado River flow dwindles as warming-driven loss of reflective snow energizes evaporation. Science 367, 1252–1255. doi:10.1126/science.aay9187
Pettitt, A. N. (1979). A non-parametric approach to the change point problem. J. R. Stat. Soc. C-Appl. 28, 126–135. doi:10.2307/2346729
Ray, L., and Goel, N. (2019). Flood frequency analysis of Narmada River basin in India under nonstationary condition. J. Hydraul. Eng. 24 (8), 05019018. doi:10.1061/(asce)he.1943-5584.0001808
Rigby, R. A., and Stasinopoulos, D. M. (2005). Generalized additive models for location, scale and shape. J. R. Stat. Soc. C54, 507–554. doi:10.1111/j.1467-9876.2005.00510.x
Rossi, A., Massei, N., Laignel, B., Sebag, D., and Copard, Y. (2009). The response of the Mississippi River to climate fluctuations and reservoir construction as indicated by wavelet analysis of streamflow and suspended-sediment load, 1950-1975. J. Hydrol. 377, 237–244. doi:10.1016/j.jhydrol.2009.08.032
Salas, J. D., and Obeysekera, J. (2014). Revisiting the concepts of return period and risk for non-stationary hydrologic extreme events. J. Hydraul. Eng. 19, 554–568. doi:10.1061/(asce)he.1943-5584.0000820
Schwarz, G. (1978). Estimating the dimension of a model. Ann. Stat. 6 (2), 461–464. doi:10.1214/aos/1176344136
Sklar, M. (1959). Fonctions de repartition a n dimensions et leurs marges. Paris: Publications de l’Institut de Statistique de l’Université de Paris.
Strupczewski, W. G., Singh, V. P., and Feluch, W. (2001). Non-stationary approach to at-site flood frequency modelling I. Maximum likelihood estimation. J. Hydrol. 248, 123–142. doi:10.1016/s0022-1694(01)00397-3
Tang, Q., He, X., Bao, Y., Zhang, X., Guo, F., and Zhu, H. (2013). Determining the relative contributions of climate change and multiple human activities to variations of sediment regime in the Minjiang River, China. Hydrol. Process 27 (25), 3547–3559. doi:10.1002/hyp.9472
Villarini, G., Smith, J. A., and Napolitano, F. (2010). Nonstationary modeling of a long record of rainfall and temperature over Rome. Adv. Water Resour. 33 (10), 1256–1267. doi:10.1016/j.advwatres.2010.03.013
Vogel, R. M., Yaindl, C., and Walter, M. (2011). Nonstationarity: Flood magnification and recurrence reduction factors in the United States. J. Am. Water Resour. As. 47 (3), 464–474. doi:10.1111/j.1752-1688.2011.00541.x
Vörösmarty, C. J., Meybeck, M., Fekete, B., Sharma, K., Green, P., and Syvitski, J. P. M. (2003). Anthropogenic sediment retention: Major global impact from registered river impoundments. Glob. Planet. Change 39, 169–190. doi:10.1016/s0921-8181(03)00023-7
Wang, F., Ge, Q., Yu, Q., Wang, H., and Xu, X. (2017). Impacts of land-use and land-cover changes on river runoff in Yellow River basin for period of 1956-2012. Chin. Geogr. Sci. 27 (1), 13–24. doi:10.1007/s11769-017-0843-3
Wen, T., Jiang, C., and Xu, X. (2019a). Nonstationary analysis for bivariate distribution of flood variables in the Ganjiang River using time-varying copula. Water 11 (4), 746. doi:10.3390/w11040746
Wen, T., Xiong, L., Jiang, C., Hu, J., and Liu, Z. (2019b). Effects of climate variability and human activities on suspended sediment load in the Ganjiang River Basin, China. J. Hydraul. Eng. 24 (11), 05019029. doi:10.1061/(asce)he.1943-5584.0001859
Wu, X., Xiang, X., Chen, X., Zhang, X., and Hua, W. (2018). Effects of cascade reservoir dams on the streamflow and sediment transport in the Wujiang River basin of the Yangtze River, China. Inland Waters 8 (2), 216–228. doi:10.1080/20442041.2018.1457850
Xie, Y., Guo, S., Xiong, L., Tian, J., and Xiong, F. (2021). Nonstationary design flood estimation in response to climate change, population growth and cascade reservoir regulation. Water 13, 2687. doi:10.3390/w13192687
Xiong, B., Xiong, L., Guo, S., Xu, C., Xia, J., Zhong, Y., et al. (2020). Nonstationary frequency analysis of censored data: A case study of the floods in the Yangtze River from 1470 to 2017. Water Resour. Res. 56 (8), e2020WR027112. doi:10.1029/2020wr027112
Xiong, B., Xiong, L., Xia, J., Xu, C., Jiang, C., and Du, T. (2019). Assessing the impacts of reservoirs on downstream flood frequency by coupling the effect of scheduling-related multivariate rainfall with an indicator of reservoir effects. Hydrol. Earth Syst. Sc. 23 (11), 4453–4470. doi:10.5194/hess-23-4453-2019
Xiong, L., and Guo, S. (2004). Trend test and change-point detection for the annual discharge series of the Yangtze River at the Yichang hydrological station/Test de tendance et détection de rupture appliqués aux séries de débit annuel du fleuve Yangtze à la station hydrologique de Yichang. Hydrol. Sci. J. 49 (1), 99–112. doi:10.1623/hysj.49.1.99.53998
Xu, C., and Zhang, D. (2018). Impact of the operation of cascade reservoirs in upper Yangtze River on hydrological variability of the mainstream. Proc. IAHS 379, 421–432. doi:10.5194/piahs-379-421-2018
Xu, G., Zhang, J., Li, P., Li, Z., Lu, K., Wang, X., et al. (2018). Vegetation restoration projects and their influence on runoff and sediment in China. Ecol. Indic. 95, 233–241. doi:10.1016/j.ecolind.2018.07.047
Yang, S., Zhao, Q., and Belkin, I. M. (2002). Temporal variation in the sediment load of the Yangtze River and the influences of human activities. J. Hydrol. 263, 56–71. doi:10.1016/s0022-1694(02)00028-8
Yang, T., Zhang, Q., Chen, Y., Tao, X., Xu, C., and Chen, X. (2008). A spatial assessment of hydrologic alteration caused by dam construction in the middle and lower Yellow River, China. Hydrol. Process 22, 3829–3843. doi:10.1002/hyp.6993
Yang, Z., Wang, H., Saito, Y., Milliman, J. D., Xu, K., Qiao, S., et al. (2006). Dam impacts on the Changjiang (Yangtze) river sediment discharge to the sea: The past 55 years and after the three Gorges dam. Water Resour. Res. 42, W04407. doi:10.1029/2005wr003970
Zhang, H., Dou, Y., Ye, L., Zhang, C., Yao, H., Bao, Z., et al. (2022). Realizing the full reservoir operation potential during the 2020 Yangtze river floods. Sci. Rep. 12, 2822. doi:10.1038/s41598-022-06801-8
Zhang, Q., Gu, X., Singh, V. P., Xiao, M., and Chen, X. (2015). Evaluation of flood frequency under non-stationarity resulting from climate indices and reservoir indices in the East River basin, China. J. Hydrol. 527, 565–575. doi:10.1016/j.jhydrol.2015.05.029
Zhang, X., Lin, P., Chen, H., Yan, R., Zhang, J., Yu, Y., et al. (2018). Understanding land use and cover change impacts on runoff and sediment load at flood events on the Loess Plateau, China. Hydrol. Process 32, 576–589. doi:10.1002/hyp.11444
Zhu, J., Gao, P., Geissen, V., Maroulis, J., Ritsema, C. J., Mu, X., et al. (2015). Impacts of rainfall and land use on sediment regime in a semi-arid region: Case study of the wuqi catchment in the upper beiluo River basin, China. Arid. Land Res. Manag. 29 (1), 1–16. doi:10.1080/15324982.2014.919041
Keywords: nonstationarity, reservoir impacts, GRRI, frequency analysis, flood, annual sediment load
Citation: Li R and Xu G (2023) Assessing the impacts of reservoirs on downstream hydrological frequency based on a general rainfall-reservoir index. Front. Earth Sci. 11:1204640. doi: 10.3389/feart.2023.1204640
Received: 14 April 2023; Accepted: 19 June 2023;
Published: 27 June 2023.
Edited by:
Lei Wang, Institute of Tibetan Plateau Research (CAS), ChinaCopyright © 2023 Li and Xu. This is an open-access article distributed under the terms of the Creative Commons Attribution License (CC BY). The use, distribution or reproduction in other forums is permitted, provided the original author(s) and the copyright owner(s) are credited and that the original publication in this journal is cited, in accordance with accepted academic practice. No use, distribution or reproduction is permitted which does not comply with these terms.
*Correspondence: Guoce Xu, eHVndW9jZV94QDE2My5jb20=