 Nai-Chen Chen1,2*
 Tsanyao Frank Yang1†
 Ya-Hsuan Liou1,3
 Huei-Ting Tina Lin4
 Wei-Li Hong2
 Saulwood Lin4
 Chih-Chieh Su3,4
 Li-Hung Lin1,3
 Pei-Ling Wang3,4*
- 1Department of Geoscience, National Taiwan University, Taipei, Taiwan
- 2Department of Geological Sciences, Stockholm University, Stockholm, Sweden
- 3NTU Research Center for Future Earth, National Taiwan University, Taipei, Taiwan
- 4Institute of Oceanography, National Taiwan University, Taipei, Taiwan
Dissolved organic carbon (DOC) and volatile fatty acids (VFAs) play key roles in the carbon cycling of marine sediment. Both microbially or thermally activated cracking of organic matter often produces high quantities of DOC and VFAs. To uncover the distribution pattern of DOC and VFAs in sediments under both impacts, a submarine mud volcano (SMV), was chosen to denote a model system that could witness how microbial activities react under the mixing of seawater and deeply-sourced fluids in a subsurface environment. We examined the concentration profiles of DOC and several VFAs (lactate, formate, acetate, propionate, and butyrate) in pore water, covering both sulfate reduction and methanogenesis zones, and further numerically modeled six porewater species (DOC, bromide, calcium, magnesium, ammonium, and total alkalinity) to quantify their fluxes from depth as well as the rates of in-situ microbial processes. Apparently, bulk DOC concentrations fluctuated with depths, probably primarily controlled by in situ microbial processes. Lactate was detectable in some samples, while propionate and butyrate were under detection limit. Acetate and formate concentrations were consistently and uniformly low throughout all biogeochemical zones, with a slightly increasing trend with depth at the center of the SMV, suggesting active utilization and turnover by the terminal steps of organic matter mineralization. The numerical modeling suggests that most DOC patterns were primarily influenced by in-situ organic matter degradation, while the impact of upward migrating fluid become more significant at center sites. The calculation of the Gibbs energy of metabolic redox reactions reveals that acetoclastic sulfate reduction yields the highest energy throughout sediment columns and may co-exist with methanogenesis below sulfate reduction zone. In contrast, acetoclastic methanogenesis yields higher energy within sulfate reduction zone than below that region, suggesting it is thermodynamically feasible to co-occur with sulfate reduction in dynamic SMV environments.
1 Introduction
Organic matter stored in marine sediments has been estimated to be up to 7.8
The proximity to terrestrial and nutrient sources renders continental margins the locus of organic matter remineralization. Previous estimates suggest that about 60%–80% of total organic carbon (TOC) pool, including DOC and particulate organic carbon (POC), is converted to dissolved inorganic carbon (DIC) and high molecular-weight organic complex through microbial respiration and fermentation (Kandasamy and Nagender Nath, 2016). Such degradation processes cascade to the stepwise production of low-molecular-weight DOC (such as amino acids and monosaccharides) and further downstream short-chain organic acids and alcohols (such as volatile fatty acids (VFAs) and methanol) (Heuer et al., 2010; Komada et al., 2013; Burdige et al., 2016; Komada et al., 2016; Zhang et al., 2019). These energetic intermediate products are ideal electron donors for different terminal electron-accepting processes. Based on the concentration profiles and incubation experiments, acetate has been identified to serve as an important substrate for manganese and iron reduction (Burdige, 1993; Chuang et al., 2021), sulfate reduction (Glombitza et al., 2015), methanogenesis (Wellsbury et al., 1997; Parkes et al., 2007; Heuer et al., 2009; Ijiri et al., 2018), or denitrification (Thauer et al., 1989; Amend and Shock, 2001; Yoon et al., 2013) in shallow marine sediments. Furthermore, a fraction of VFAs (particularly acetate) could be directly assimilated into biomass (Morono et al., 2011; Na et al., 2015), contributing to the pool of particulate organic carbon. The rapid turnover often enables the limited accumulation of these intermediate, energetic substrates in most marine sediments (e.g., micromolar range of acetate in marine porewater; Finke et al., 2007; Sørensen et al., 1981; Valdemarsen and Kristensen, 2010). Therefore, although observations regarding the variation in the concentration of these molecules bear great implications for subseafloor microbial processes, their distribution pattern remains rarely explored.
In addition to the input from the water column, thermally or microbially activated cracking of organic matter in subseafloor also leads the production of high quantities of DOC from strata with relatively low TOC content (<1 wt%; e.g., Parkes et al., 2007). Typical examples include submarine mud volcanoes (SMVs) and seeps, which represent the seafloor expression of conduits tapping deep fluid reservoirs (Egeberg and Barth, 1998; Nuzzo et al., 2008; Hung et al., 2016; Eickenbusch et al., 2019). Few studies have demonstrated that the concentrations of specific DOC compounds could range up to millimolar ranges (e.g., Egeberg and Barth, 1998; Nuzzo et al., 2008; Pohlman et al., 2010; Heuer et al., 2020). Although such high concentrations are confined in a narrow depth range, the strong contrast from background seawater concentrations (few μM or less) could have sustained a high flux exported to the overlying seawater. Recent studies indicated that DOC benthic fluxes from sediments near cold seeps and mud volcanoes in offshore southwestern Taiwan (28–1,264 μmol m−2 d−1) are several times higher than most DOC fluxes in coastal and continental margin sediments (Hung et al., 2016). If the estimates based on observations of near a few mud volcanoes are valid across the basin, the contribution of DOC from mud volcanoes and seeps would constitute a significant proportion of marine DOC pool and affect the biogeochemical network and ecosystem in benthic environments. As the DOC pool represents a mixture of various individual compounds, it remains unclear whether the fluxes of specific substrates are comparable with the bulk DOC pattern.
This study aims to better understand the distribution pattern of DOC and VFAs for sediments in a submarine mud volcano, TY1, offshore southwestern Taiwan. The TY1 mud volcano exports fluids and gases originating from a source depth estimated to be 4–6 km below the seafloor (kmbsf) to the seawater column (Chen et al., 2020); thus, it provides ideal materials to address how DOC associated with deep fluids is cycled through various microbial processes at shallow depths. To this aim, bulk DOC and various VFAs (acetate, formate, propionate, butyrate, and lactate) were specifically targeted and discussed together with other aqueous and gas geochemistry data obtained in a previous study (Chen et al., 2020). These results were further integrated into a reactive transport modeling to quantify how microbially dissimilative and assimilative metabolisms affect the patterns of bulk DOC.
2 Materials and methods
2.1 Geological settings and sampling sites
Offshore southwestern Taiwan is at the frontal area of the accretionary wedge generated during the subduction–collision between the Luzon Arc and the Eurasian passive continental margin (e.g., Teng, 1990). The boundary separating the passive from active margins is defined by the deformation front, a northward extension of the Manila trench. The active margin is further divided by the out-of-sequence thrust into the Upper and Lower Slope domains (e.g., Lin et al., 2009; Lin et al., 2014). Through the seismic reflection profiles and remotely operated vehicle (ROV) survey, a total of 13 submarine mud volcanoes (SMVs) have been identified in the Upper Slope domain of offshore southwestern Taiwan (Figure 1A; Chen et al., 2014a; Chen et al., 2014b). Two mud volcanoes fed by one mud diapir constitute the Tsangyao Mud Volcano Group (TYMV; re-named after MV12; Chen et al., 2017), the largest SMV offshore southwestern Taiwan. One of the mud volcanoes, TY1, has a conical structure and a wide flat top with a diameter of ∼500 m at a water depth of ∼370 m (Figures 1B, C; Chen et al., 2014a). Two major gas plumes, one at the west and the other at the south, were detected on the crest by a multibeam echo sounder. These gas plumes reached 367 m above the seafloor (Chen et al., 2014b). TY2 is not as active as TY1; although mud diapiric structure was found under its conical bathymetry in the seismic profile, no venting was detected (Wu, 2016). A previous study shows that three major lithologic units (mud breccia, moderate mud breccia, and massive units) were recovered in sediment cores collected from TY1 (Hiruta et al., 2017). 90% of the massive units is fine sand (63–212 μm), while moderate mud breccia, and mud breccia units are dominated by clay and silt. Chen et al. (2020) has shown that the deep fluid sourced from smectite dehydration has intruded in TY1, and these fluids mix with seawater percolating downward from the seabed, generating great salinity and other geochemical gradients in shallow sediments. The effect of fluid advection is swapped with the diffusive transport as the distance from the center increased (upward fluid velocity is also shown in Figure 2). The expedition on TY1 was conducted in offshore southwestern Taiwan by R/V Ocean Researcher I (Leg 1,118). Piston cores with lengths ranging from 260 to 450 cm were recovered along a transect from the center to the margin of the TY1 cone structure (Figure 1C). Sampling sites are listed in Table 1 and shown in Figures 1B, C.
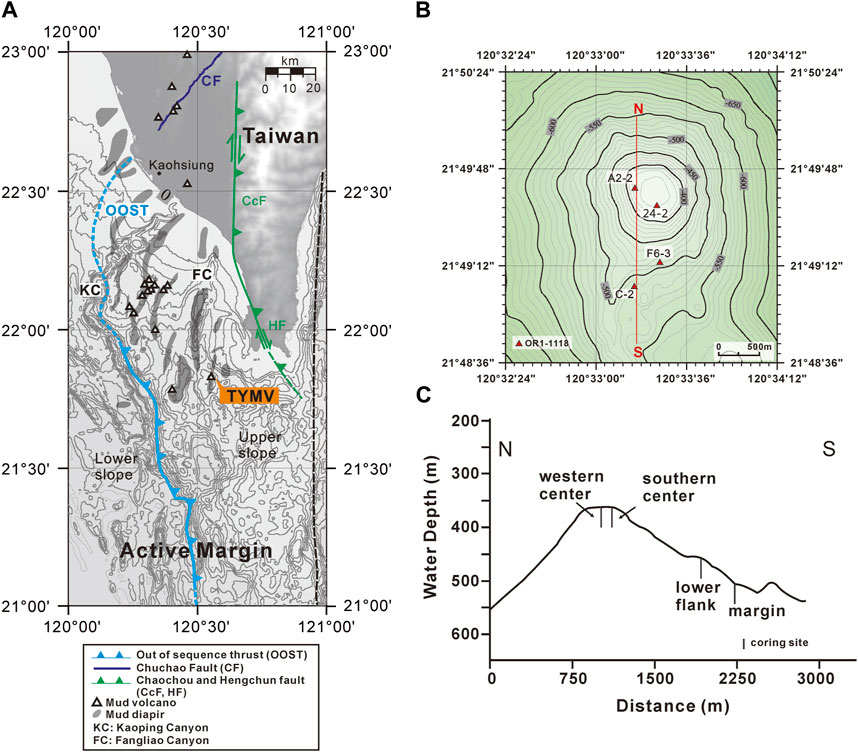
FIGURE 1. Coring sites and the tectonic structures in onshore and offshore south Taiwan. (A) Submarine mud volcanoes are distributed in the upper slope domain, active margin. The light blue line near the shelf edge is out of sequence thrust (OOST), while the dark blue line denotes the Chuchau fault (CF). The green line represents the Chaochou fault (CcF) and the Hengchun fault (HF). The tectonic structures are cited by Lin et al. (2009); Lin et al. (2014). The right boundary of the upper slope is defined by Lin et al. (2009). (B, C) “modified from Chen et al. (2020)” are views of coring sites on TY1 from above and cross-section, respectively. The map was created by the open-source GMT software (Wessel and Smith, 1998), using the NOAA public database (Amante and Eakins, 2009).
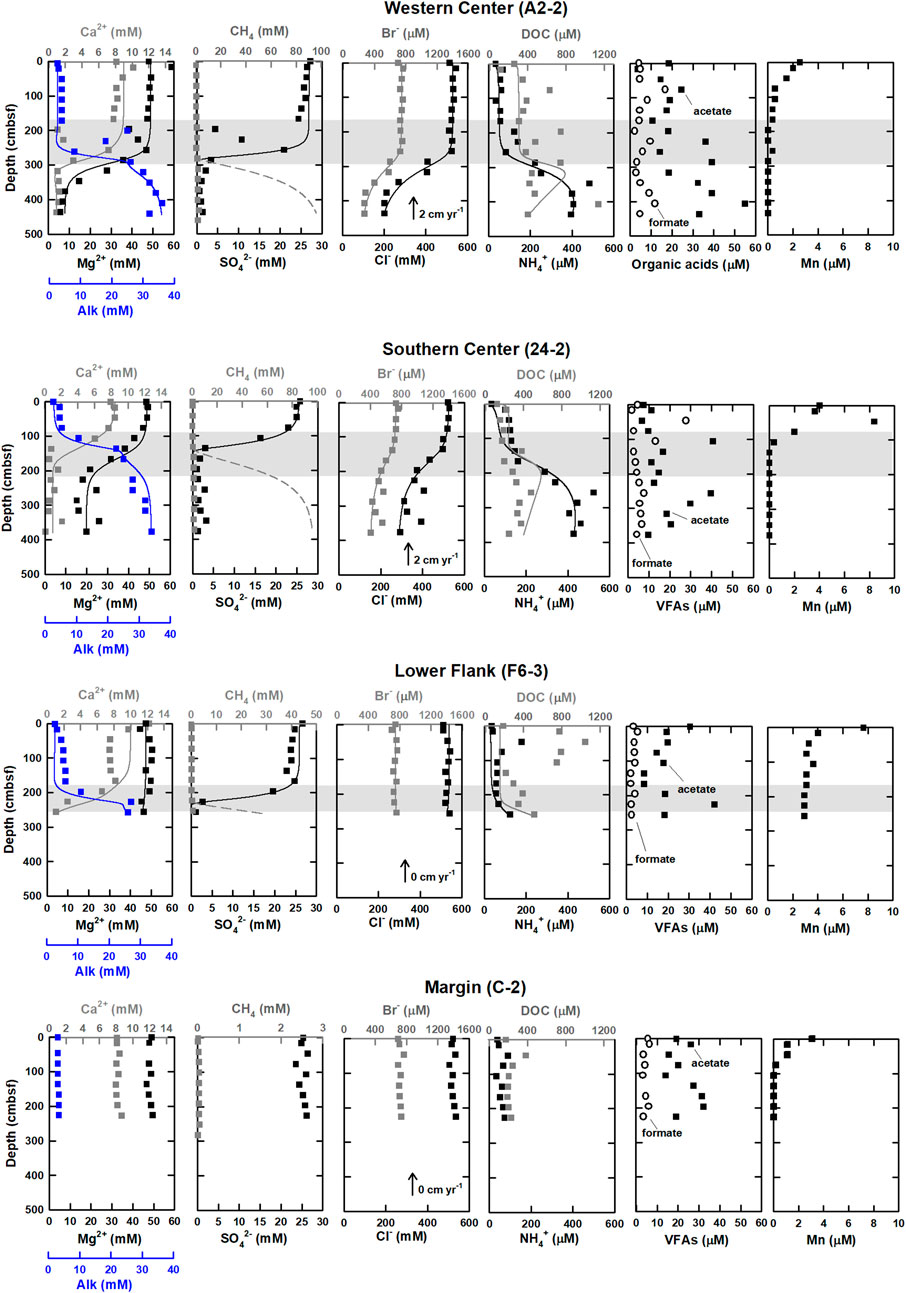
FIGURE 2. Geochemical profiles of western and southern center, lower flank, and margin sites at the submarine mud volcano, TY1. Shaded areas denote SMTZ. Measured data are shown by squares, while the solid and dashed lines represent the best fit between the model simulated profiles and measured data (after Chen et al., 2020). The data on methane, sulfate, chloride, Alk, calcium, and magnesium were cited from Chen et al. (2020).
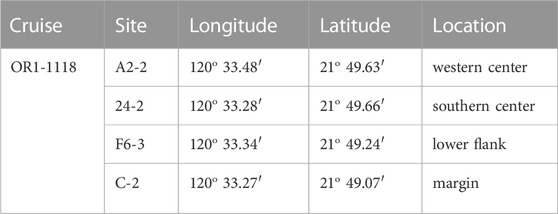
TABLE 1. Information on sites cored at a submarine mud volcano, TY1, during cruise OR1-1118.
2.2 Sampling and analytical methods
Pore fluid samples for aqueous geochemistry were obtained through centrifugation and subsequently collected through filtration using polypropylene rubber-free syringes and disposable 0.2-µm Supor membranes. At least 10 mL of the filtrate was split into five fractions first for the analyses of anion, cation, total alkalinity (Alk), water isotopes, and DOC as well as VFAs. Samples for DOC and VFA analyses were kept in pre-combusted 2-mL glass vials with Teflon-coated screw caps and stored at −20oC until analyses. Prior to sample collection, all glass vials were soaked in 10% HNO3 for 3 days, rinsed with Milli-Q water, and then combusted at 550oC for 4 h. For cation samples, concentrated nitric acid (70%) was added at a volume ratio of 1:45 to preserve the valence state for elements sensitive to redox change. The data of some major ions, Alk, and water isotopes have been published by Chen et al. (2020).
The ex-situ pH was measured immediately on board while analyzing Alk (Supplementary Figure S1; Chen et al., 2020). Total dissolved manganese and iron concentrations were analyzed by an inductively coupled plasma optical emission spectrometry (ICP-OES). Bromide and ammonium were measured by an ion chromatography (IC, 882 Compact IC Plus; Chen et al., 2020; Hu et al., 2017). The concentrations of DOC were determined by the Shimadzu-TOC-L carbon analyzer (Shimadzu Corp., Kyoto, Japan) equipped with a non-dispersive infrared detector and an auto-sampler. Samples were manually diluted by 10 to 30 folds, acidified with HCl, and purged using a helium stream prior to the injection into the analyzer. Five standards (5, 10, 15, 20, and 30 μM) were prepared from the Consensus Reference Material, CRM (purchased from Hansell Lab, Miami, United States), with an uncertainty smaller than 5%. The analyses of VFAs were determined by an Agilent HPLC system, model 1,260 Infinity LC (Agilent Technologies, Santa Clara, CA, United States), equipped with a diode array detector (DAD). An ion exchange column (Agilent Hi-Plex H, 8 μm, 300 × 7.7 mm) coupled to a guard column (PL Hi-Plex H, 50 × 7.7 mm) was used to separate VFAs (targets including lactate, formate, acetate, propionate, and butyrate) at a flow rate of 0.6 mL min−1 of eluent 4.0 mM H2SO4 with a column temperature maintained at 65°C. Five standards (1, 5, 10, 25, and 50 μM) were prepared from 10 mM stocks of individual target compounds at a purity of ≥98%. Standard solutions (5 and 10 μM) were injected after every five analyses in order to monitor the drift of the retention time and signal intensity. The limit of detection (LOD) is calculated as LOD = 3.3σ/S (Borman and Elder, 2017). The σ is the standard deviation of the response derived from the calibration curve, and S is estimated from the slope of the calibration curve for the analyte. The LOD of each VFA was lower than 1.5 μM.
2.3 Numerical modeling
2.3.1 Modeling construction
To further quantify the impacts of deep fluids and heterotrophic processes on geochemical characteristics, a one-dimension reactive transport modeling, described in detail by Chen et al. (2020) and organic matter degradation simulations (Wallmann et al., 2006), was applied to generates the porewater concentration-depth profiles of Alk, calcium, magnesium, bromide, ammonium, and DOC. The simulation of VFAs is not included because VFAs are involved in many reactions but lack constraints. Since hydrogen sulfide was not measured, and thus, the modeling result of dissolved inorganic carbon (DIC = CO2 + HCO3− + CO32−) was assumed to be Alk. The model including transportation (molecular diffusion and fluid advection), bubble irrigation, and microbial reaction terms is as follows:
where
2.3.2 Reactions
The mineralization reactions proceed with the POC degradation for the production of DOC through the following simple pathway:
where DOC plays as an intermediate product. Without constraints of carbon isotopes (e.g., Komada et al., 2013; Burdige et al., 2016), the kinetic rate law for DOC production (or POC degradation) depending on the concentration of dissolved metabolites is simplified and considered here (Wallmann et al., 2006):
where
POC degradation coexists with the release of bromide and ammonium and fuels downstream organoclastic sulfate reduction (OSR) as well as methanogenesis (ME) (see Table 2 for acronyms about all reactions). The reactions involved in the POC degradation (OSR and ME), anaerobic oxidation of methane (AOM), and carbonate precipitation (CP) are listed below:
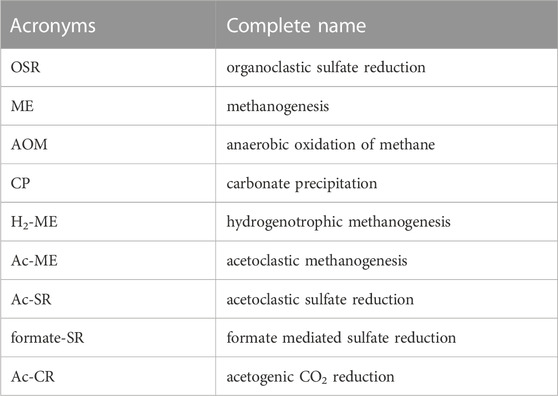
TABLE 2. List of acronyms about reactions mentioned in the text.
OSR:
ME:
AOM:
CP:
where
2.3.3 Numerical modeling scenarios
In order to observe the variation of in-situ processes and deep fluids (advection) under different modeling settings, three cases were considered. In case 1, all reactions were involved, but only diffusion was considered (without advection term). In case 2, diffusion and advection terms were considered (without reaction terms). In case 3, all reactions and transportation terms were considered. The influence of advection could be shown by comparing case 1 and case 3, while the impact of reactions could be revealed by comparing case 2 and case 3. Only cases 1 and 3 were considered at site F6-3 because there was no significant upward fluid flow (Chen et al., 2020). As there was no apparent geochemical variation at site C-2, no simulation was conducted.
2.4 Gibbs energy calculations
The Gibbs energy (ΔG) of the chemical reaction, governed by the concentration of reactants and products and the temperature and pressure, represents the energy obtained by microorganisms through a specific catabolic pathway. The Gibbs free energy for a suite of metabolic reactions involving acetate, formate, methane, and sulfate (Eqs 9–13) was calculated by using Eq. 8 considering that acetate and formate were focused as the representative electron donors because they are present throughout the sediment column and are two of the most common microbial fermentation products.
where
Hydrogenotrophic methanogenesis (H2-ME):
Acetoclastic methanogenesis (Ac-ME):
Acetoclastic sulfate reduction (Ac-SR):
formate mediated sulfate reduction (formate-SR):
Acetogenic CO2 reduction (Ac-CR):
The activities were computed by multiplying measured concentrations of the species by their activity coefficients. Activity coefficients were calculated from an extended version of the Debye-Hückel Extended equation at an ionic strength of 0.3–0.7 (Helgeson, 1969) and with chloride-derived salinity of 13–35 psu. Temperatures in sediments were calculated based on in situ bottom water temperature (10.5oC) and a temperature gradient of 0.39oC/m at TY1 (Wu, 2016). The ex-situ measured pH values ranged from 7.7 to 8.9 (Supplementary Figure S1). The density of porewater and the concentration of hydrogen were assumed to be 1.03 g/cm3 and 2 nM, respectively. The numerical modeling results of methane concentrations were used for methanogenesis (Eqs 9, 10; Chen et al., 2020). As hydrogen sulfide was not measured, its concentration was assumed to be 1 nM and 1 mM in our calculations.
3 Results
3.1 Variation of solutes profiles across TY1 submarine mud volcano
Profiles of solute concentrations for the four sampling sites are shown in Figure 2. Bromide concentrations ranged from 0.2 to 0.8 mM and decreased with depth below SMTZ at center sites (A2-2 and 24-2), while they stayed constant at lower flank (F6-3) and margin (C-2) sites. Ammonium concentrations varied between 30 and 600 μM. Unlike the trend of bromide, ammonium concentrations increased with depths at sites A2-2 and 24-2. At sites F6-3 and C-2, ammonium concentrations were typically lower than 100 μM throughout the core except for values at 72 and 256 cmbsf. Manganese ion concentrations were lower than 10 μM and decreased with depth at all sites, while the total dissolved iron concentrations were almost below the detection limit and are not shown in the profiles.
DOC concentration ranged from 100 to 1,200 μM. At center sites (A2-2 and 24-2) with the mean value around 400 μM, and generally increased with depth, with some spiked values deviating from the increasing trend. In contrast, the lower flank (F6-3) and margin (C-2) sites were characterized by high concentrations at shallow depths and low concentrations at deeper depths. At the lower flank site (F6-3), the DOC concentration increased at above 130 cmbsf (up to 1,000 μM) and decreased to around 250 μM at the core bottom; at site C-2, the DOC concentration was almost constant (around 200 μM). Of all analyzed VFAs, formate and acetate appear to be the most abundant, with the ratios of acetate to DOC ranging from 2% to 8%, from 4% to 8%, from 2% to 4%, and from 4% to 17% at sites A2-2, 24-2, F6-3, and C-2, respectively (Figure 2; Supplementary Table S1). At center sites (A2-2 and 24-2), formate concentrations ranged from 3 to 30 μM and were higher than 13 μM at above 100 cmbsf and lower than 10 μM below that depth. However, formate concentrations were nearly constant (below 6 μM) at the lower flank and margin sites (F6-3 and C-2). Acetate concentrations were generally higher than formate and lactate and ranged from 3 to 55 μM. At site A2-2, acetate concentrations increased with depth. No noticeable trend except for two peaks at 100 and 250 cmbsf was observed at site 24-2. At site F6-3, acetate concentrations varied between 10 and 20 μM, with a peak value of 40 μM observed at 220 cmbsf. At site C-2, acetate concentrations were around 20 μM and increased to 30 μM at 130 to 200 cmbsf. Propionate and butyrate were below the detection limit for all samples, whereas lactate up to 10 μM was sporadically detected for a few samples (Supplementary Table S1).
3.2 Numerical modeling
The numerical modeling results of three cases are shown in Figure 3. For bromide, case 1 (without advection) could not fit well with measured data, while case 2 (without reactions) and case 3 (transport and all reactions) could match. For ammonium at center sites, modeling results in all cases followed the trend of measured data, while the results of case 3 fit the best. For DOC at center sites, modeling results in all cases were lower than measured data above SMTZ at site A2-2 while they followed the trend of measured data at site 24-2. Below SMTZ, case 1 was much higher than measured data, while case 2 could fit well at site 24–2 but not site A2-2. Compared to case 1, both case 2 and case 3 were closer to measured data at center sites. For ammonium and DOC at site F6-3, all modeling results were lower than the data above SMTZ. For calcium, neither case 1 nor case 2 could fit measured data; although case 3 was closer to measured data than the other two cases, part of the data above 2.86 mbsf could not be fitted well. For magnesium, only case 1 could not match measured data. For Alk, the result of case 1 was much lower than measured data. Although results of case 2 could fit profiles of bottom and above SMTZ at center sites, the results were still lower than measured data at SMTZ. Only case 3 could fit the Alk profile better. To sum, by considering all reactions and transportations (case 3), the modeling results matched the observations for most ions and molecules.
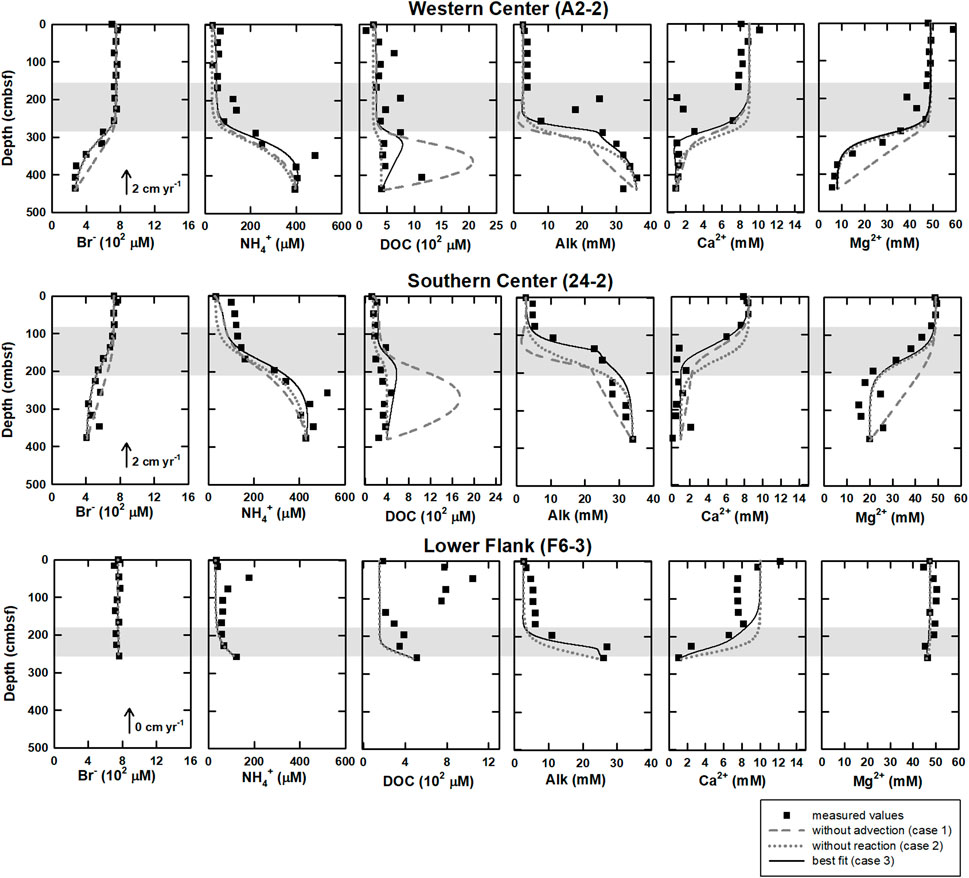
FIGURE 3. The modeling results under different scenarios of western and southern center as well as lower flank sites at the submarine mud volcano, TY1. The scenarios include 1) without advection (case 1, gray dashed lines), 2) without reactions (case 2, gray dotted lines), and 3) best fit (case 3, solid lines) of DOC, bromide, ammonium, calcium, magnesium, and Alk. At lower flank site (F6-3), because upward fluid velocity is 0 cm yr−1 (Chen et al., 2020), there are only case 1 and case 3. Closed circles are measured values, and shaded area denoted the SMTZ at each site.
3.3 Gibbs energies of formate and acetate in sulfate reduction, methanogenesis, and acetogenesis
Gibbs free energies calculated for five microbial processes—H2-ME, Ac-ME, Ac-SR, formate-SR, and Ac-CR are shown in Figure 4. The energy yields of Ac-SR remained at constant above SMTZ at all sites but decreased below SMTZ. The highest yields (most negative ΔG values) of Ac-SR were obtained for samples above SMTZ (1.66–2.86 mbsf) with ΔG values around −50 and −90 kJ (mol acetate)−1 under 1 mM and 1 nM of hydrogen sulfide, respectively. The lowest energy yields (less negative ΔG values) were found at below SMTZ and around −38 kJ and −70 kJ (mol acetate)−1 under 1 mM and 1 nM of hydrogen sulfide, respectively. Similar to the energy yields trend of Ac-SR, the energy yields of formate oxidized sulfate reduction (formate-SR) were in the range of −15 and −30 kJ (mol formate)−1 and were higher above SMTZ and slightly decreased as sulfate decreased.
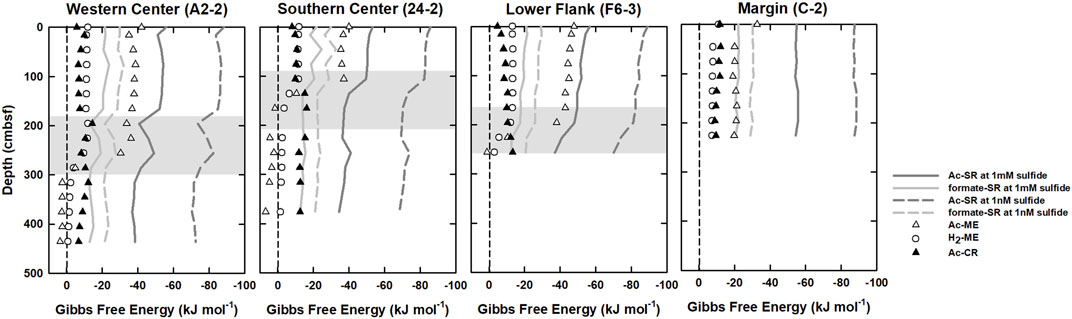
FIGURE 4. Gibbs free energies calculated for hydrogentrophic methanogenesis (H2-ME; opened circles), acetoclastic methanogenesis (Ac-ME; opened triangles), acetoclastic sulfate reduction (Ac-SR; solid and dashed dark gray line), formate oxidized sulfate reduction (formate-SR; solid and dashed light gray line), and acetogenesis (Ac-CR; black filled triangles). Shaded areas denote SMTZ.
The ΔG values of Ac-ME were around −5 to −50 kJ (mol CH4)−1 above the bottom SMTZ and increased rapidly to even positive values (around +3 (mol CH4)−1) below the SMTZ at all sites. Like Ac-ME, the ΔG values of H2-ME were around −10 to −12 kJ (mol CH4)−1 above the SMTZ and increased to −1.0 kJ (mol CH4)−1 below the SMTZ at all sites. Below SMTZ, energy yields of methanogenesis decreased with depth due to higher DIC and methane concentrations beneath sulfate reduction zone. By contrast, the energy yields of Ac-CR were constantly low and around −10 kJ to −15 kJ (mol acetate)−1. Its energy yield was similar to H2-ME above SMTZ and higher than all methanogenesis below SMTZ.
4 Discussion
4.1 Impact of external fluid input and microbial degradation on DOC and VFAs patterns
The mud volcano represents the seafloor expression for fracture-channeled fluid flow from subseafloor and impacts the near seafloor sedimentary biogeochemistry. Chen et al. (2020) observed that chloride-depleted deep fluids rich in thermogenic methane originating from a depth of 3–5 kmbsf migrated upward at the crater center of the TY1 mud volcano. Furthermore, based on the evidence that water is more 18O-enriched and 2H- at western center site (A2-2), stronger deep fluid influence at western center site was inferred as compared to southern center site (24-2; Figure 2).
The fluctuations of the DOC and VFAs concentrations in the sediment porewater are generally influenced by the degrees of POC degradation and external fluid input. In this study, Pearson’s correlation is used to address these two factors based on the fact that chloride serves as a conservative tracer to track fluid transport whereas bromide and ammonium are indirectly linked to POC degradation (Table 3). Similar to chloride, bromide concentrations at depths shallower than SMTZ at site A2-2 were invariant. At and below SMTZ (2.3 mbsf), bromide was positively correlated with chloride at center sites (r is around +1.0). Although bromide has been considered to be released with the degradation of organic matter (e.g., Wallmann et al., 2006), the highly positive correlation with chloride suggests that bromide distribution is mainly controlled by a mixture of seawater and bromide-depleted deep fluid. In contrast, for sites F6-3 and C-2 distributed on the lower flank and margin of the TY1, respectively, bromide concentrations were invariant with depths, suggesting a limited impact of advective transport or biological activities. Same as bromide, ammonium and bicarbonate are also considered to be derived from the POC degradation, their concentration profiles suggest the in-situ POC degradation and the net accumulation of the reaction products (Figure 2), a pattern typically observed for marine sediments. However, over our studied regions, concentrations of ammonium and Alk generally increased with depth and were negatively correlated with chloride at different degrees, suggesting patterns are potentially influenced by deep fluids.
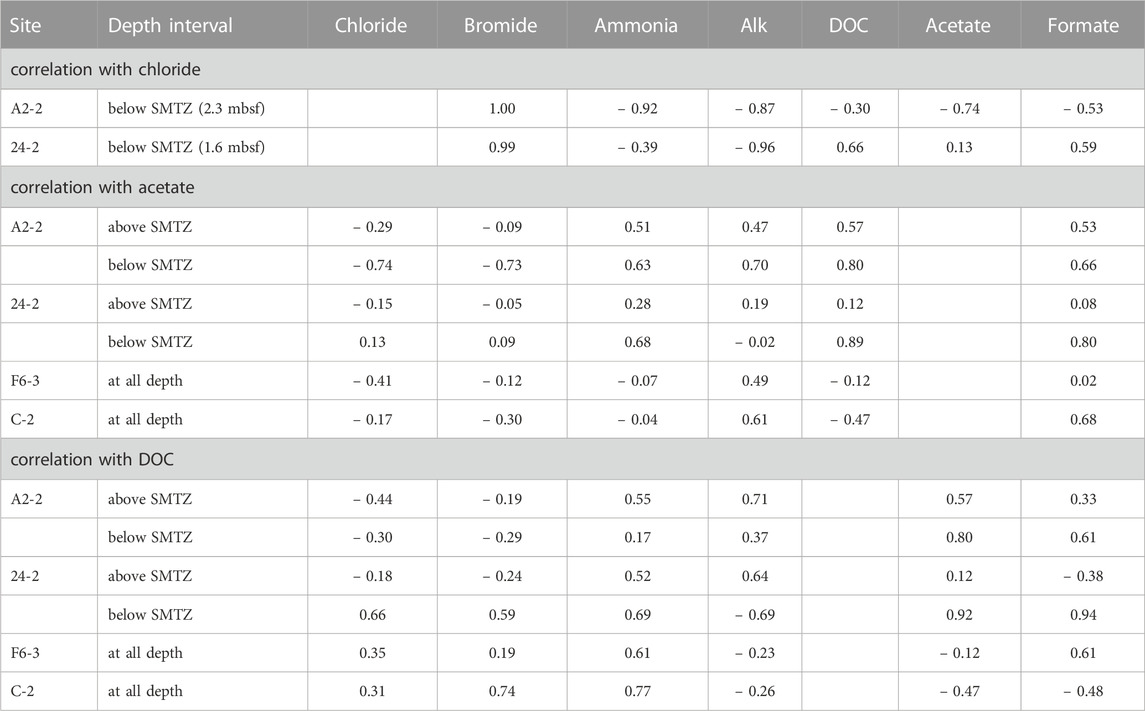
TABLE 3. Correlation with chloride, acetate, and DOC.
The correlation between chloride and DOC/VFAs also varied site by site while the DOC concentrations were positively correlated with the ammonium concentrations at most depth intervals and sites (r > 0.5; except for below SMTZ at site A2-2; Table 3), implying the potential influence of in-situ processes. Besides, the patterns of DOC and VFAs indeed varied considerably from site to site. At center sites (A2-2 and 24-2), DOC concentrations generally increased with depth with some spiked values deviating from the increasing trend. For comparison, the lower flank and margin sites (F6-3 and C-2) were generally characterized by high DOC concentrations at shallow depths and low concentrations at depth, suggesting DOC sourced from deep fluids is not significant.
Of all investigated VFAs, acetate and formate appear to be more abundant and prevalent in all cores. Although their concentrations ranged up to around 60 μM, they either fluctuated greatly or remained at a low level along depth. Acetate concentrations were positively correlated with ammonium and DOC at center sites while they were high in the low chloride zone (i.e., negatively correlated with chloride) below SMTZ at site A2-2, suggesting acetate sourced from deep fluid (probably from thermal degradation) and produced via microbial processes at subsurface at site A2-2 where the strongest advective flow was observed. No significant correlation between acetate and ammonium or DOC was observed for the lower flank sites (|r| < 0.2). Formate was correlated better with DOC than acetate. All these lines of evidence suggest that acetate and formate metabolisms were linked with organic degradation, and that formate is perhaps more labile than acetate and rapidly turned over between different metabolisms. Acetate and formate are both competitive substrates for terminal electron-accepting processes (e.g., Hoehler et al., 1998). Culture tests have shown that metal reduction, sulfate reduction, and methanogenesis compete for these two potential substrates and hydrogen gas for metabolic energy (e.g., Oremland and Polcin, 1982). Because they are primarily produced from the fermentation of complex organic matter, their abundances in natural environments are regulated at a certain low level to fulfill the efficient energy transfer between producing and consuming metabolisms (Orcutt et al., 2013; Glombitza et al., 2015; Beulig et al., 2018). Exceptions occur particularly for petroleum or natural gas reservoirs where acetate and formate are produced by thermo-cracking, adding to those produced from biodegradation could amount up to a scale of mM (Egeberg and Barth, 1998). The scenario is complicated by the fact that acetate could be also produced by acetogenesis from hydrogen and a fraction of these two VFAs could be assimilated into cell biomass through acetyl-CoA or formate dehydrogenase (Jansen et al., 1984; Teece et al., 1999). The complex reaction network and the contribution of individual pathways or community members in SMV environments remain largely unraveled. Collectively, our correlation coefficients suggest that the VFAs and DOC in the porewater of our study sites were mostly related to the in-situ POC degradation and cycling, but their increase could be also contributed by the chloride-depleted deep fluid, which may carry thermal degradation VFAs and DOC, at the sites centered around TY1 mud volcano.
4.2 Numerical modeling evaluation
4.2.1 Quantifying microbial POC degradation rates and deep fluid inputs
The numerical modeling is constructed to quantify the effect of in-situ POC degradation and deep fluids on the pattern of bulk DOC. Our modeling results show that the model of case 3 can fit the measured data better than that of the other two cases (Figure 3). Further integration of rate over depth demonstrated that the whole depth-integrated rates of DOC accumulation were 17–47.6 mmol C m−2 yr−1 at center sites. This range is ten times higher than DOC flux from depth (4–5 mmol C m−2 yr−1), suggesting that in-situ microbial processes dominated over fluid transport in DOC cycling and that the in-situ POC degradation is vital to supply DOC for terminal electron accepting processes. However, the DOC flux of deep fluids become relatively significant with depth. Its influence can be revealed by comparing the model results for the above and below the SMTZ (Table 4). The DOC accumulation rate below SMTZ (deducting the total DOC consumption of OSR and ME) is close to 10 mmol C m−2 yr−1 while DOC flux from depth is around 4 mmol C m−2 yr−1 at site A2-2, and those two are almost the same below SMTZ at site 24-2 (around 4.8 mmol C m−2 yr−1), suggesting impact of deep fluids could not be ignored, especially below SMTZ. Additionally, the case 2 modeling derived profiles (without reactions) at center sites fit better to the DOC measured data when compared to case 1 (without advection; Figure 3), suggesting deep fluids that may carry thermally degraded DOC potentially controls the profiles. Although depth-integrated rates suggest lower impact of in-situ POC degradation at site F6-3 (Table 4), all of our modeling results could not fit DOC profile well at site F6-3 and, therefore, underestimate the influence from in-situ processes (Figure 2). Similar to DOC, the patterns of ammonium are mainly controlled by in-situ processes, but the influence of deep fluids are obvious at center sites (Table 4). The ammonium production rate above SMTZ is higher than flux from depth, while its production below SMTZ is lower than deep flux, suggesting that deep fluids primarily control the ammonium patterns below SMTZ.
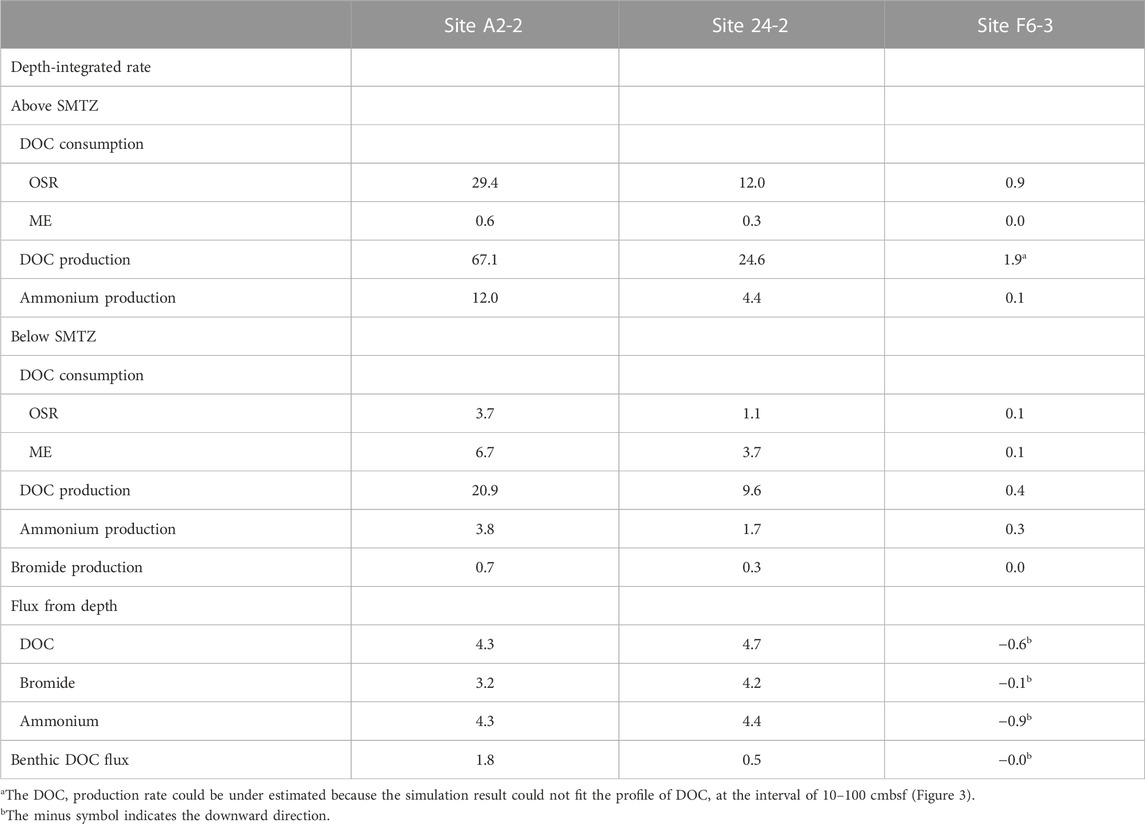
TABLE 4. Microbial activity and DOC flux derived from reactive transport simulations. Depth-integrated consumption and production rates of DOC, bromide, and ammonium. The unit of rates and fluxes is mmol C m−2 yr−1, but for rates and fluxes associated with ammonium and bromide, the units are mmol N m−2 yr−1 and mmol Br m−2 yr−1, respectively.
The small discrepancies between the modeled and measured DOC profiles could be further exploited to discuss the quality of organic matter in the sediment and the porewater at site F6-3. Because of low POC content (0.5 wt%; Su et al., 2018), a kinetic constant of POC degradation was assumed to be resemble that for recalcitrant POC (10–6 yr−1; Middelburg, 1989), making it difficult to fit the real data above SMTZ well. In addition, profiles of modeled major ions are partly controlled by bubble irrigation above SMTZ (Chuang et al., 2013; see modeling construction in Supplementary Material S1), which may enhance the seawater dilution process. And thus, the deviation of the modeled DOC above SMTZ likely suggests a more labile POC/DOC pool with higher reactivity than we expected.
DOC/NH4+ ratios could provide additional insights of POC and DOC degradation. According to rate laws of POC degradation and ammonium production in Wallmann et al. (2006), the degradative products exempted from further exploitation postdating formation would share DOC/NH4+ ratios similar to the source characteristics (
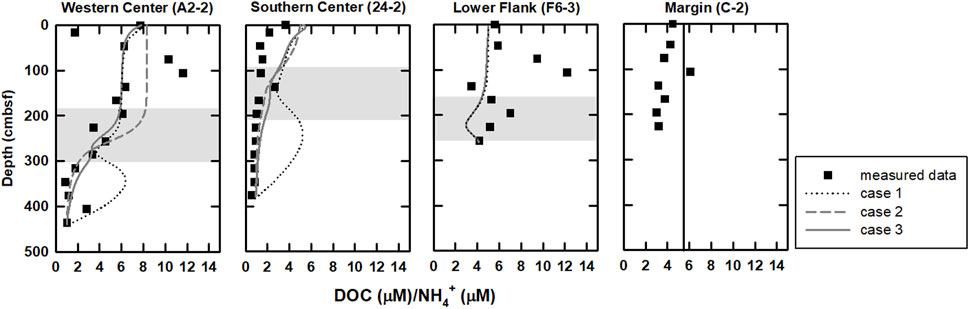
FIGURE 5. Profiles of DOC/NH4+ ratios for all sites. In general, this ratio is relatively high above the SMTZ and decreases below the SMTZ. DOC/NH4+ ratios derived from modeling results of case 3 (curved lines) are also plotted for comparison. Profiles are relatively invariant at site C-2 (Figure 2), indicating low microbial rates and potentially sharing DOC/NH4+ ratios similar to the source characteristics, and thus,
Bromide production could be attributed to POC degradation (Borowski, 2004; Wallmann et al., 2006; Wei et al., 2008); however, comparisons between cases 2 and 3 suggest that bromide is mainly controlled by advection (Figure 3). Although the molar Br/C ratio used in our model (Br/TOC=7.6
DIC could be either produced by POC degradation, AOM, or consumed by carbonate precipitation which is also influenced by the transport of divalent ions (Eqs 4–7). The modeling indicated that the deep DIC fluxes at center sites (ca. 350 C mmol m−2 yr−1; Supplementary Table S2) are higher than the consumption rate of calcium and magnesium due to carbonate precipitation (5.0–9.0 C mmol m−2 yr−1) and POC degradation (17–40 C mmol m−2 yr−1) regardless of AOM production (700–850 C mmol m−2 yr−1) at SMTZ (Supplementary Table S2; Chen et al., 2020). The results suggest the dominance of fluid processes, such as advection and diffusion, over others in controlling the profiles of Alk, calcium and magnesium. Overall, the degradation of POC to produce metabolites and the advection of deep fluids explain most of the observations.
4.2.2 Benthic DOC flux at TY1
The venting of SMV transport not only thermogenic methane but also DOC into the ocean (Hung et al., 2016; Brogi et al., 2019; Chen et al., 2020; Amaral et al., 2021). Our simulations shows that the benthic DOC flux is in the range of 0.04–3.33 mmol C m−2 yr−1 (Table 4), which is much lower than that in the previous study (57–90 mmol C m−2 yr−1; Hung et al., 2016). However, as we mentioned before, bubble irrigation is applied in our modeling construction, which could also act as a DOC sink because it dilutes sediment porewater DOC concentrations with low DOC seawater; namely, accumulated DOC has been transported to seawater through bubble irrigation. Under this scenario, the total accumulation of DOC in porewater transported to seawater is around 47.6 mmol C m−2 yr−1 (by deducting consumption of OSR and ME from DOC production; Table 4), which is close to the previous study.
4.3 Energy limitation
The depth-integrated total DOC production rate is in the range of 34–88 mmol m-2 yr-1 with approximate half of the flux attributed to the consumption mediated by OSR and ME. The simulation results indicate that OSR is dominated above SMTZ while ME is the major process consuming DOC below SMTZ at center sites (Table 4). Although OSR is limited below SMTZ, the simulation results still suggest that OSR may occur in this zone (Table 4). This interpretation could be supported by the calculation of Gibbs free energy at center sites (Figure 4), which shows the energy yields of Ac-SR (at 1 mM sulfide) are in the range of −35 to −40 kJ (mol acetate)−1 below SMTZ. The energetic requirement of sulfate reduction was suggested to be between −33.1 and −42.8 kJ mol−1 in the culture experiments with Desulfobacter hydrogenophilus (DSM3380) consuming acetate and sulfate (Jin and Bethke, 2009). By using incubation experiments with 35S-labeled sulfate, Glombitza et al. (2015) suggests that the minimum energy requirement of Ac-SR could be around −30 kJ (mol acetate)−1 (or (mol sulfate) −1). Based on assumptions of energy cost of ATP from ADP, Glombitza et al., 2019 suggest that −20 kJ (mol acetate)−1 should be sufficient for sulfate reduction. While the co-existence of sulfate reducers and methanogens below SMTZ has been found in several areas (Leloup et al., 2007; Treude et al., 2014; Orsi et al., 2016; Chuang et al., 2021), and sulfate reducers are present below SMTZ in a terrestrial mud volcano (Cheng et al., 2012), we infer that Ac-SR might proceed at the energetic limit in the sediment below SMTZ at center sites.
The simulation results also suggest that ME may occur above SMTZ (Table 4). ΔG of Ac-ME at above SMTZ is in the range of −35 to −50 kJ (mol CH4) −1. This range is higher than that of H2-ME and suggest that Ac-ME could co-exist with sulfate reduction. Co-occurrence of Ac-SR and Ac-ME has been observed at ODP site 1,226 (Wang et al., 2008). Their modeling derived reaction rates and thermodynamic calculations (ΔG) of Ac-SR and Ac-ME suggest that these processes can co-occur because both ΔG are exergonic throughout sediment core column and are close to the values in culturing experiments (Wang et al., 2008; Wang et al., 2010; Sela-Adler et al., 2017). Furthermore, Cheng et al. (2012) has shown the existence of Ac-ME above SMTZ from incubation results of mud volcano sediments. Although the potential energy limitation of H2-ME was found to be at an even lower energy yield of −10 kJ (mol CH4)−1 (Hoehler et al., 2001), which is similar to what we derived at above SMTZ (ΔG = −10 to −12 kJ (mol CH4) −1; Figure 4), H2-ME would be easily inhibited by sulfate-reducing bacteria because of competition for hydrogen (e.g., Abram and Nedwell, 1978), suggesting that H2-ME is less likely to occur at above SMTZ. Our thermodynamic calculations show Ac-ME below SMTZ is endergonic (ΔG > 0 kJ) while H2-ME is around −2 kJ (mol CH4) −1, which is more positive than the potential limit of ME. This could be because of high methane concentration below SMTZ (at center sites: 96 mM; at lower flank site: 40 mM; Chen et al., 2020), which could strongly shift the equilibrium towards the reactant side, making ME, especially Ac-ME, energetically unfavorable.
Previous studies have shown that the existence of Ac-CR in subsurface sediment by incubation and carbon isotopes approaches (Liu and Suflita, 1993; Heuer et al., 2009). In our study, Ac-CR is exergonic throughout sediment column and even higher than methanogenesis below SMTZ (Figure 4). Although the correlation between acetate and chloride is higher below SMTZ (Table 3), suggesting an obvious input from deep fluids, the depth-integrated rate of DOC production below SMTZ (after deducting consumption from OSR and ME) is comparable to the DOC flux from depth especially at center sites (Figure 2; Table 4), suggesting that higher acetate is resulted from both deep fluids and Ac-CR.
5 Conclusion
The in-situ processes and intrusion of deep fluids that may transport thermally activated cracking of VFAs and DOC around the mud volcano affect the geochemical conditions of the deep subsurface. Correlation between different controlling factors reveals that in-situ POC degradation is the main controlling mechanism for DOC, acetate, and formate patterns. At sites centered around the mud volcano, the effect of deep fluids on DOC and acetate concentrations becomes more significant, which is also the case for ammonium, bromine and Alk distributions. Numerical modeling for six key metabolic reactive parameters (DOC, bromide, calcium, magnesium, ammonium, and Alk) in the porewater further shows that these dissolved materials are controlled by deep fluids. Although the DOC and ammonium produced by in-situ POC degradation is dominant, the contribution from deep fluids becomes more significant with depth, especially below the SMTZ at center sites. The benthic DOC flux resulting from bubble irrigation and deep fluids is around 48 mmol C m−2 yr−1, which was much greater than typical diffusional DOC flux into the deep ocean. Both the modeling results and the calculations of the Gibbs free energy of metabolic redox reactions suggest that acetoclastic sulfate reduction yields the highest energy and may co-exist with methanogenesis below the SMTZ. Acetoclastic methanogenesis yields higher energy and can co-occur with sulfate reduction above the SMTZ; indeed, the observed elevations in acetate concentration could be a result of input from both deep fluids and acetogenesis. Our research quantified the impacts between microbial mediated reactions and the active transport by deep fluids, demonstrating how modeling and observations can work together to unravel an extremely dynamic subsurface environment.
Data availability statement
The original contributions presented in the study are included in the article/Supplementary Material, further inquiries can be directed to the corresponding authors.
Author contributions
N-CC, TY, P-LW, H-TL, and L-HL initiated the study and designed sampling and analyses. N-CC and SL collected samples. N-CC, P-LW, Y-HL, H-TL, and C-CS conducted analyses. N-CC, W-LH, P-LW, and L-HL conducted numerical modeling. N-CC, P-LW, L-HL, and H-TL wrote the paper. All authors contributed to the article and approved the submitted version.
Funding
This study is supported by the Taiwanese National Science and Technology Council, Ministry of Education as well as Stockholm University.
Acknowledgments
We would like to thank the captain and crew of the R/V Ocean Research Vessels I, and all assistants and students on board for their help in sample collections, especially Y-J. Chen, H-W. Chen, T-H. Yang, and Y-H. Chang. Y-J. Chen and H-W. Chen are specially acknowledged for invaluable technical and analytical support. We are also grateful to the suggestions for the structure and distribution of SMVs by Dr. S-C. Chen.
Conflict of interest
The authors declare that the research was conducted in the absence of any commercial or financial relationships that could be construed as a potential conflict of interest.
Publisher’s note
All claims expressed in this article are solely those of the authors and do not necessarily represent those of their affiliated organizations, or those of the publisher, the editors and the reviewers. Any product that may be evaluated in this article, or claim that may be made by its manufacturer, is not guaranteed or endorsed by the publisher.
Supplementary material
The Supplementary Material for this article can be found online at: https://www.frontiersin.org/articles/10.3389/feart.2023.1210088/full#supplementary-material
References
Abram, J. W., and Nedwell, D. B. (1978). Inhibition of methanogenesis by sulphate reducing bacteria competing for transferred hydrogen. Archives Microbiol. 117, 89–92. doi:10.1007/bf00689356
Alshameri, A., He, H., Zhu, J., Xi, Y., Zhu, R., Ma, L., et al. (2018). Adsorption of ammonium by different natural clay minerals: Characterization, kinetics and adsorption isotherms. Appl. Clay Sci. 159, 83–93. doi:10.1016/j.clay.2017.11.007
Amante, C., and Eakins, B. W. (2009). ETOPO1 arc-minute global relief model: Procedures, data sources and analysis.
Amaral, V., Romera-Castillo, C., and Forja, J. (2021). Submarine mud volcanoes as a source of chromophoric dissolved organic matter to the deep waters of the Gulf of Cádiz. Sci. Rep. 11 (1), 3200–3212. doi:10.1038/s41598-021-82632-3
Amend, J. P., and Shock, E. L. (2001). Energetics of overall metabolic reactions of thermophilic and hyperthermophilic Archaea and Bacteria. FEMS Microbiol. Rev. 25 (2), 175–243. doi:10.1111/j.1574-6976.2001.tb00576.x
Arnosti, C. (2011). Microbial extracellular enzymes and the marine carbon cycle. Annu. Rev. Mar. Sci. 3, 401–425. doi:10.1146/annurev-marine-120709-142731
Beulig, F., Røy, H., Glombitza, C., and Jørgensen, B. (2018). Control on rate and pathway of anaerobic organic carbon degradation in the seabed. Proc. Natl. Acad. Sci. 115 (2), 367–372. doi:10.1073/pnas.1715789115
Boatman, C. D., and Murray, J. W. (1982). Modeling exchangeable NH4+ adsorption in marine sediments: Process and controls of adsorption 1, 2. Limnol. Oceanogr. 27 (1), 99–110. doi:10.4319/lo.1982.27.1.0099
Borman, P., and Elder, D. (2017). Q2(R1) validation of analytical procedures. In ICH Quality Guidelines, 127–166. doi:10.1002/9781118971147.ch5
Borowski, W. S. (2004). A review of methane and gas hydrates in the dynamic, stratified system of the Blake Ridge region, offshore southeastern North America. Chem. Geol. 205 (3-4), 311–346. doi:10.1016/j.chemgeo.2003.12.022
Brogi, S. R., Kim, J.-H., Ryu, J.-S., Jin, Y. K., Lee, Y. K., and Hur, J. (2019). Exploring sediment porewater dissolved organic matter (DOM) in a mud volcano: Clues of a thermogenic DOM source from fluorescence spectroscopy. Mar. Chem. 211, 15–24. doi:10.1016/j.marchem.2019.03.009
Burdige, D. J., Berelson, W. M., Coale, K. H., McManus, J., and Johnson, K. S. (1999). Fluxes of dissolved organic carbon from California continental margin sediments. Geochimica Cosmochimica Acta 63 (10), 1507–1515. doi:10.1016/s0016-7037(99)00066-6
Burdige, D. J., Komada, T., Magen, C., and Chanton, J. P. (2016). Carbon cycling in Santa Barbara Basin Sediments: A modeling study. J. Mar. Res. 74 (3), 133–159. doi:10.1357/002224016819594818
Burdige, D. J. (1993). The biogeochemistry of manganese and iron reduction in marine sediments. Earth-Science Rev. 35 (3), 249–284. doi:10.1016/0012-8252(93)90040-e
Chen, N.-C., Yang, T. F., Hong, W.-L., Yu, T.-L., Lin, I.-T., Wang, P.-L., et al. (2020). Discharge of deeply rooted fluids from submarine mud volcanism in the Taiwan accretionary prism. Sci. Rep. 10 (1), 381–392. doi:10.1038/s41598-019-57250-9
Chen, N. C., Yang, T. F., Hong, W. L., Chen, H. W., Chen, H. C., Hu, C. Y., et al. (2017). Production, consumption, and migration of methane in accretionary prism of southwestern Taiwan. Geochem. Geophys. Geosystems 18, 2970–2989. doi:10.1002/2017gc006798
Chen, S.-C., Hsu, S.-K., Wang, Y., Chung, S.-H., Chen, P.-C., Tsai, C.-H., et al. (2014a). Distribution and characters of the mud diapirs and mud volcanoes off southwest Taiwan. J. Asian Earth Sci. 92, 201–214. doi:10.1016/j.jseaes.2013.10.009
Chen, S.-C., Hsu, S. K., Wang, Y., Chung, S. H., Chen, P. C., Tsai, C. H., et al. (2014b). Distribution and characters of the mud diapirs and mud volcanoes off southwest Taiwan. J. Asian Earth Sci. 92, 201–214. doi:10.1016/j.jseaes.2013.10.009
Cheng, T.-W., Chang, Y.-H., Tang, S.-L., Tseng, C.-H., Chiang, P.-W., Chang, K.-T., et al. (2012). Metabolic stratification driven by surface and subsurface interactions in a terrestrial mud volcano. ISME J. 6 (12), 2280–2290. doi:10.1038/ismej.2012.61
Chuang, P.-C., Dale, A. W., Heuer, V. B., Hinrichs, K.-U., and Zabel, M. (2021). Coupling of dissolved organic carbon, sulfur and iron cycling in Black Sea sediments over the Holocene and the late Pleistocene: Insights from an empirical dynamic model. Geochimica Cosmochimica Acta 307, 302–318. doi:10.1016/j.gca.2021.04.032
Chuang, P. C., Dale, A. W., Wallmann, K., Haeckel, M., Yang, T. F., Chen, N. C., et al. (2013). Relating sulfate and methane dynamics to geology: Accretionary prism offshore SW Taiwan: Relating SO4and CH4Dynamics off SW Taiwan. Geochem. Geophys. Geosystems 14 (7), 2523–2545. doi:10.1002/ggge.20168
Egeberg, P. K., and Barth, T. (1998). Contribution of dissolved organic species to the carbon and energy budgets of hydrate bearing deep sea sediments (Ocean Drilling Program Site 997 Blake Ridge). Chem. Geol. 149 (1-2), 25–35. doi:10.1016/s0009-2541(98)00033-3
Eickenbusch, P., Takai, K., Sissman, O., Suzuki, S., Menzies, C., Sakai, S., et al. (2019). Origin of short-chain organic acids in serpentinite mud volcanoes of the mariana convergent margin. Front. Microbiol. 10, 1729. doi:10.3389/fmicb.2019.01729
Fenchel, T., Blackburn, H., Blackburn, T. H., and King, G. M. (2012). Bacterial biogeochemistry: The ecophysiology of mineral cycling. Academic Press.
Finke, N., Vandieken, V., and Jørgensen, B. B. (2007). Acetate, lactate, propionate, and isobutyrate as electron donors for iron and sulfate reduction in Arctic marine sediments, Svalbard. Fems Microbiol. Ecol. 59 (1), 10–22. doi:10.1111/j.1574-6941.2006.00214.x
Glombitza, C., Egger, M., Røy, H., and Jørgensen, B. B. (2019). Controls on volatile fatty acid concentrations in marine sediments (Baltic Sea). Geochimica Cosmochimica Acta 258, 226–241. doi:10.1016/j.gca.2019.05.038
Glombitza, C., Jaussi, M., Røy, H., Seidenkrantz, M.-S., Lomstein, B. A., and Jørgensen, B. B. (2015). Formate, acetate, and propionate as substrates for sulfate reduction in sub-arctic sediments of Southwest Greenland. Front. Microbiol. 6, 846. doi:10.3389/fmicb.2015.00846
Haas, A. F., Nelson, C. E., Kelly, L. W., Carlson, C. A., Rohwer, F., Leichter, J. J., et al. (2011). Effects of coral reef benthic primary producers on dissolved organic carbon and microbial activity. PloS one 6 (11), e27973. doi:10.1371/journal.pone.0027973
Hedges, J. I., and Keil, R. G. (1995). Sedimentary organic matter preservation: An assessment and speculative synthesis. Mar. Chem. 49(2–3), 81–115. doi:10.1016/0304-4203(95)00008-F
Helgeson, H. C. (1969). Thermodynamics of hydrothermal systems at elevated temperatures and pressures. Am. J. Sci. 267 (7), 729–804. doi:10.2475/ajs.267.7.729
Heuer, V. B., Inagaki, F., Morono, Y., Kubo, Y., Spivack, A. J., Viehweger, B., et al. (2020). Temperature limits to deep subseafloor life in the Nankai Trough subduction zone. Science 370 (6521), 1230–1234. doi:10.1126/science.abd7934
Heuer, V. B., Krueger, M., Elvert, M., and Hinrichs, K.-U. (2010). Experimental studies on the stable carbon isotope biogeochemistry of acetate in lake sediments. Org. Geochem. 41 (1), 22–30. doi:10.1016/j.orggeochem.2009.07.004
Heuer, V. B., Pohlman, J. W., Torres, M. E., Elvert, M., and Hinrichs, K. U. (2009). The stable carbon isotope biogeochemistry of acetate and other dissolved carbon species in deep subseafloor sediments at the northern Cascadia Margin. Geochimica Cosmochimica Acta 73 (11), 3323–3336. doi:10.1016/j.gca.2009.03.001
Hiruta, A., Yang, T. F., Lin, S., Su, C.-C., Chen, N.-C., Chen, Y.-J., et al. (2017). Activation of gas bubble emissions indicated by the upward decreasing Lead-210 activity at a submarine mud volcano (TY1) offshore southwestern Taiwan. J. Asian Earth Sci. 149, 160–171. doi:10.1016/j.jseaes.2017.08.007
Hoehler, T. M., Alperin, M. J., Albert, D. B., and Martens, C. S. (2001). Apparent minimum free energy requirements for methanogenic Archaea and sulfate-reducing bacteria in an anoxic marine sediment. Fems Microbiol. Ecol. 38 (1), 33–41. doi:10.1111/j.1574-6941.2001.tb00879.x
Hoehler, T. M., Alperin, M. J., Albert, D. B., and Martens, C. S. (1998). Thermodynamic control on hydrogen concentrations in anoxic sediments. Geochimica Cosmochimica Acta 62 (10), 1745–1756. doi:10.1016/s0016-7037(98)00106-9
Hong, W.-L., Torres, M. E., Carroll, J., Crémière, A., Panieri, G., Yao, H., et al. (2017). Seepage from an arctic shallow marine gas hydrate reservoir is insensitive to momentary ocean warming. Nat. Commun. 8, 15745. [Article]. doi:10.1038/ncomms15745
Hu, C.-Y., Yang, T. F., Burr, G. S., Chuang, P.-C., Chen, H.-W., Walia, M., et al. (2017). Biogeochemical cycles at the sulfate-methane transition zone (SMTZ) and geochemical characteristics of the pore fluids offshore southwestern Taiwan. J. Asian Earth Sci. 149, 172–183. doi:10.1016/j.jseaes.2017.07.002
Hung, C.-W., Huang, K.-H., Shih, Y.-Y., Lin, Y.-S., Chen, H.-H., Wang, C.-C., et al. (2016). Benthic fluxes of dissolved organic carbon from gas hydrate sediments in the northern South China Sea. Sci. Rep. 6, 29597. doi:10.1038/srep29597
Ijiri, A., Inagaki, F., Kubo, Y., Adhikari, R. R., Hattori, S., Hoshino, T., et al. (2018). Deep-biosphere methane production stimulated by geofluids in the Nankai accretionary complex. Sci. Adv. 4 (6), eaao4631. doi:10.1126/sciadv.aao4631
Jansen, K., Thauer, R. K., Widdel, F., and Fuchs, G. (1984). Carbon assimilation pathways in sulfate reducing bacteria. Formate, carbon dioxide, carbon monoxide, and acetate assimilation by Desulfovibrio baarsii. Archives Microbiol. 138, 257–262. doi:10.1007/bf00402132
Jin, Q., and Bethke, C. M. (2009). Cellular energy conservation and the rate of microbial sulfate reduction. Geology 37 (11), 1027–1030. doi:10.1130/g30185a.1
Kandasamy, S., Lin, B., Lou, J. Y., Kao, S. J., Chen, C. T. A., and Mayer, L. M. (2018). Estimation of marine versus terrigenous organic carbon in sediments off southwestern taiwan using the bromine to total organic carbon ratio as a proxy. J. Geophys. Res. Biogeosciences 123 (10), 3387–3402. doi:10.1029/2018jg004674
Kandasamy, S., and Nagender Nath, B. (2016). Perspectives on the terrestrial organic matter transport and burial along the land-deep sea continuum: Caveats in our understanding of biogeochemical processes and future needs. Front. Mar. Sci. 3 (259). doi:10.3389/fmars.2016.00259
Komada, T., Burdige, D. J., Crispo, S. M., Druffel, E. R., Griffin, S., Johnson, L., et al. (2013). Dissolved organic carbon dynamics in anaerobic sediments of the Santa Monica Basin. Geochimica Cosmochimica Acta 110, 253–273. doi:10.1016/j.gca.2013.02.017
Komada, T., Burdige, D. J., Li, H.-L., Magen, C., Chanton, J. P., and Cada, A. K. (2016). Organic matter cycling across the sulfate-methane transition zone of the Santa Barbara Basin, California Borderland. Geochimica Cosmochimica Acta 176, 259–278. doi:10.1016/j.gca.2015.12.022
Leloup, J., Loy, A., Knab, N. J., Borowski, C., Wagner, M., and Jørgensen, B. B. (2007). Diversity and abundance of sulfate-reducing microorganisms in the sulfate and methane zones of a marine sediment, Black Sea. Environ. Microbiol. 9(1), 131–142. doi:10.1111/j.1462-2920.2006.01122.x
Lin, A. T., Yao, B. C., Hsu, S. K., Liu, C. S., and Huang, C. Y. (2009). Tectonic features of the incipient arc-continent collision zone of Taiwan: Implications for seismicity. Tectonophysics 479 (1-2), 28–42. doi:10.1016/j.tecto.2008.11.004
Lin, C.-C., Lin, A. T.-S., Liu, C.-S., Horng, C.-S., Chen, G.-Y., and Wang, Y. (2014). Canyon-infilling and gas hydrate occurrences in the frontal fold of the offshore accretionary wedge off southern Taiwan. Mar. Geophys. Res. 35 (1), 21–35. doi:10.1007/s11001-013-9203-7
Liu, S., and Suflita, J. M. (1993). H 2 -CO 2 -dependent anaerobic O-demethylation activity in subsurface sediments and by an isolated bacterium. Appl. Environ. Microbiol. 59(5), 1325–1331. doi:10.1128/aem.59.5.1325-1331.1993
Mackenzie, F., Lerman, A., and Andersson, A. (2004). Past and present of sediment and carbon biogeochemical cycling models. Biogeosciences Discuss. 1 (1), 11–32. doi:10.5194/bg-1-11-2004
Middelburg, J. J. (1989). A simple rate model for organic matter decomposition in marine sediments. Geochimica Cosmochimica Acta 53 (7), 1577–1581. doi:10.1016/0016-7037(89)90239-1
Morono, Y., Terada, T., Nishizawa, M., Ito, M., Hillion, F., Takahata, N., et al. (2011). Carbon and nitrogen assimilation in deep subseafloor microbial cells. Proc. Natl. Acad. Sci. 108 (45), 18295–18300. doi:10.1073/pnas.1107763108
Na, H., Lever, M. A., Kjeldsen, K. U., Schulz, F., and Jørgensen, B. B. (2015). Uncultured D esulfobacteraceae and C renarchaeotal group C 3 incorporate 13 C-acetate in coastal marine sediment. Environ. Microbiol. Rep. 7 (4), 614–622. doi:10.1111/1758-2229.12296
Nuzzo, M., Hornibrook, E. R., Hensen, C., Parkes, R. J., Cragg, B. A., Rinna, J., et al. (2008). Shallow microbial recycling of deep-sourced carbon in Gulf of Cadiz mud volcanoes. Geomicrobiol. J. 25 (6), 283–295. doi:10.1080/01490450802258196
Orcutt, B. N., LaRowe, D. E., Biddle, J. F., Colwell, F. S., Glazer, B. T., Reese, B. K., et al. (2013). Microbial activity in the marine deep biosphere: Progress and prospects. Front. Microbiol. 4, 189. doi:10.3389/fmicb.2013.00189
Oremland, R. S., and Polcin, S. (1982). Methanogenesis and sulfate reduction: Competitive and noncompetitive substrates in estuarine sediments. Appl. Environ. Microbiol. 44 (6), 1270–1276. doi:10.1128/aem.44.6.1270-1276.1982
Orsi, W. D., Barker Jørgensen, B., and Biddle, J. F. (2016). Transcriptional analysis of sulfate reducing and chemolithoautotrophic sulfur oxidizing bacteria in the deep subseafloor. Environ. Microbiol. Rep. 8(4), 452–460. doi:10.1111/1758-2229.12387
Parkes, R. J., Wellsbury, P., Mather, I. D., Cobb, S. J., Cragg, B. A., Hornibrook, E. R. C., et al. (2007). Temperature activation of organic matter and minerals during burial has the potential to sustain the deep biosphere over geological timescales. Org. Geochem. 38(6), 845–852. doi:10.1016/j.orggeochem.2006.12.011
Pohlman, J. W., Bauer, J. E., Waite, W. F., Osburn, C. L., and Chapman, N. R. (2010). Methane hydrate-bearing seeps as a source of aged dissolved organic carbon to the oceans. Nature 4, 37–41. doi:10.1038/ngeo1016
Schrum, H. N., Spivack, A. J., Kastner, M., and D'Hondt, S. (2009). Sulfate-reducing ammonium oxidation: A thermodynamically feasible metabolic pathway in subseafloor sediment. Geology 37 (10), 939–942. doi:10.1130/g30238a.1
Sela-Adler, M., Ronen, Z., Herut, B., Antler, G., Vigderovich, H., Eckert, W., et al. (2017). Co-existence of methanogenesis and sulfate reduction with common substrates in sulfate-rich estuarine sediments. Front. Microbiol. 8, 766. doi:10.3389/fmicb.2017.00766
Sørensen, J., Christensen, D., and Jørgensen, B. B. (1981). Volatile fatty acids and hydrogen as substrates for sulfate-reducing bacteria in anaerobic marine sediment. Appl. Environ. Microbiol. 42 (1), 5–11. doi:10.1128/aem.42.1.5-11.1981
Su, C.-C., Hsu, S.-T., Hsu, H.-H., Lin, J.-Y., and Dong, J.-J. (2018). Sedimentological characteristics and seafloor failure offshore SW Taiwan. Terr. Atmos. Ocean. Sci. 29 (1), 65–76. doi:10.3319/tao.2017.06.21.01
Teece, M. A., Fogel, M. L., Dollhopf, M. E., and Nealson, K. H. (1999). Isotopic fractionation associated with biosynthesis of fatty acids by a marine bacterium under oxic and anoxic conditions. Org. Geochem. 30 (12), 1571–1579. doi:10.1016/s0146-6380(99)00108-4
Teng, L. S. (1990). Geotectonic evolution of late Cenozoic arc-continent collision in Taiwan. Tectonophysics 183 (1-4), 57–76. doi:10.1016/0040-1951(90)90188-e
Thauer, R., Zinkhan, D., and Spormann, A. (1989). Biochemistry of acetate catabolism in anaerobic chemotrophic bacteria. Annu. Rev. Microbiol. 43 (1), 43–67. doi:10.1146/annurev.mi.43.100189.000355
Treude, T., Krause, S., Maltby, J., Dale, A. W., Coffin, R., and Hamdan, L. J. (2014). Sulfate reduction and methane oxidation activity below the sulfate-methane transition zone in Alaskan Beaufort Sea continental margin sediments: Implications for deep sulfur cycling. Geochimica Cosmochimica Acta 144, 217–237. doi:10.1016/j.gca.2014.08.018
Valdemarsen, T., and Kristensen, E. (2010). Degradation of dissolved organic monomers and short-chain fatty acids in sandy marine sediment by fermentation and sulfate reduction. Geochimica Cosmochimica Acta 74 (5), 1593–1605. doi:10.1016/j.gca.2009.12.009
Vanneste, H., Kelly-Gerreyn, B. A., Connelly, D. P., James, R. H., Haeckel, M., Fisher, R. E., et al. (2011). Spatial variation in fluid flow and geochemical fluxes across the sediment–seawater interface at the Carlos Ribeiro mud volcano (Gulf of Cadiz). Geochimica Cosmochimica Acta 75 (4), 1124–1144. doi:10.1016/j.gca.2010.11.017
Wallmann, K., Aloisi, G., Haeckel, M., Obzhirov, A., Pavlova, G., and Tishchenko, P. (2006). Kinetics of organic matter degradation, microbial methane generation, and gas hydrate formation in anoxic marine sediments. Geochimica Cosmochimica Acta 70 (15), 3905–3927. doi:10.1016/j.gca.2006.06.003
Wang, G., Spivack, A. J., and D’Hondt, S. (2010). Gibbs energies of reaction and microbial mutualism in anaerobic deep subseafloor sediments of ODP Site 1226. Geochimica Cosmochimica Acta 74 (14), 3938–3947. doi:10.1016/j.gca.2010.03.034
Wang, G., Spivack, A. J., Rutherford, S., Manor, U., and D’Hondt, S. (2008). Quantification of co-occurring reaction rates in deep subseafloor sediments. Geochimica Cosmochimica Acta, 72(14), 3479–3488. doi:10.1016/j.gca.2008.04.024
Wei, W., Kastner, M., and Spivack, A. (2008). Reply to comment on: “Chlorine stable isotopes and halogen concentrations in convergent margins with implications for the Cl isotopes cycle in the ocean”. Earth Planet. Sci. Lett. 274 (3-4), 535. doi:10.1016/j.epsl.2008.07.023
Wellsbury, P., Goodman, K., Barth, T., Cragg, B. A., Barnes, S. P., and Parkes, R. J. (1997). Deep marine biosphere fuelled by increasing organic matter availability during burial and heating. Nature 388 (6642), 573–576. doi:10.1038/41544
Wessel, P., and Smith, W. H. (1998). New, improved version of generic mapping tools released. Eos, Trans. Am. Geophys. Union 79 (47), 579. doi:10.1029/98eo00426
Wu, J. (2016). New data processing algorithm for marine heat flow and thermal modeling for Tsan-Yao mud volcano offshore SW Taiwan. Taipei: Institute of Oceanography College of Science, National Taiwan University.
Yoon, S., Sanford, R. A., and Löffler, F. E. (2013). Shewanella spp. use acetate as an electron donor for denitrification but not ferric iron or fumarate reduction. Appl. Environ. Microbiol. 79 (8), 2818–2822. doi:10.1128/aem.03872-12
Keywords: dissolved organic carbon, volatile fatty acids, submarine mud volcano, deep fluid, numerical modeling, gibbs free energy
Citation: Chen N-C, Yang TF, Liou Y-H, Lin H-TT, Hong W-L, Lin S, Su C-C, Lin L-H and Wang P-L (2023) Controlling factors on patterns of dissolved organic carbon and volatile fatty acids in a submarine mud volcano offshore southwestern Taiwan. Front. Earth Sci. 11:1210088. doi: 10.3389/feart.2023.1210088
Received: 21 April 2023; Accepted: 12 July 2023;
Published: 25 July 2023.
Edited by:
Glen T. Snyder, The University of Tokyo, JapanReviewed by:
Stephen A. Bowden, University of Aberdeen, United KingdomVerena Heuer, University of Bremen, Germany
Copyright © 2023 Chen, Yang, Liou, Lin, Hong, Lin, Su, Lin and Wang. This is an open-access article distributed under the terms of the Creative Commons Attribution License (CC BY). The use, distribution or reproduction in other forums is permitted, provided the original author(s) and the copyright owner(s) are credited and that the original publication in this journal is cited, in accordance with accepted academic practice. No use, distribution or reproduction is permitted which does not comply with these terms.
*Correspondence: Nai-Chen Chen, bmFpLWNoZW4uY2hlbkBnZW8uc3Uuc2U=; Pei-Ling Wang, cGx3YW5nQG50dS5lZHUudHc=
†Deceased