 Lisa Beccaro1*†
 Matteo Albano1†
 Cristiano Tolomei1
 Claudia Spinetti1
 Giuseppe Pezzo1
 Mimmo Palano2
 Claudio Chiarabba1
- 1Istituto Nazionale di Geofisica e Vulcanologia, Osservatorio Nazionale Terremoti, Roma, Italy
- 2Istituto Nazionale di Geofisica e Vulcanologia, Osservatorio Etneo, Catania, Italy
Post-emplacement dynamics of lava flows is governed by several factors such as poroelastic deformation of the substrate; gravity-induced repacking and rearrangement of the vesicle-bearing fluid lava and other void spaces by superposed flows; lava densification processes; viscoelastic strain relaxation of the ground caused by the lava load; thermal cooling and contraction of the solid lava; and discrete motion of surface blocks. Here we investigate post-emplacement lava flow dynamics at the Mt. Etna volcano, and we infer on the possible causes by exploiting optical and radar satellite data. Synthetic aperture radar data from Sentinel-1 satellite mission provided high-resolution horizontal and vertical displacement rates and displacement time series of the lava flows emplaced on the Mt. Etna volcano summit from January 2016 to July 2021. Sentinel-2 multispectral data allowed to identify the lava flows boundaries emplaced during the December 2018 and May 2019 paroxysms. Finally, high resolution COSMO-SkyMed radar data allowed to account for the topographic changes generated by the lava emplacement by means of stereo radargrammetry technique. Such an unprecedented dataset provided a full picture of the lava flow dynamics, whose kinematics is governed lava cooling, which in turn produce thermal contraction of the lava body and viscous compaction of the underlying substrate. Both phenomena act at different periods, being the thermal contraction predominant for recent lava flows. Downslope sliding is also invoked, especially for recent lava flows emplaced on high slope areas.
1 Introduction
Lava flows are streams of partially molten rock that cool as they flow and are emitted from eruptive volcanic vents (Griffiths, 2000). Their kinematics depend on many aspects, such as the properties and composition of the erupted magma, the effusion rate, and the ground topography over which the lava flows (Griffiths, 2000; Dietterich and Cashman, 2014; Korotkii et al., 2016). Morphologic properties of lava flows are generally obtained using ground-based surveys or, more recently, through UAV-based surveys (Favalli et al., 2018; De Beni et al., 2019). Nevertheless, satellite remote sensing techniques have proven effective in providing a comprehensive view of the phenomenon (Cappello et al., 2018; Corradino et al., 2019; Ganci et al., 2022; Ganci et al., 2023). Satellite optical images, in the spectral ranges from visible to thermal infrared, allow the mapping of lava flows with great spatial coverage and high resolution more safely without performing physical measurements from the volcanic edifice during the eruptive crisis (Oppenheimer, 1993; Wright et al., 2000; Harris et al., 2001; Lombardo et al., 2011) and accounting for topographic changes produced by the lava flow emplacements (Bisson et al., 2021). Hyperspectral data offer the capability to extract mineralogical, textural, and compositional properties from lava flows (Dietterich et al., 2018). They also enable the examination of various attributes like spectral features (Spinetti et al., 2009; Amici et al., 2014) and topographic characteristics (Ganci et al., 2022), greatly enriching our comprehension of lava flow emplacement dynamics. Furthermore, the coarse surface texture, high cohesiveness, and absence of vegetation on these flows result in strong radar signal backscattering immediately after their emplacement. This phenomenon permits meticulous analysis through interferometric SAR (InSAR). Utilizing InSAR-derived ground displacement data from satellite observations, we can effectively characterize the ground deformation associated with lava flow emplacement and its underlying physical mechanisms. These mechanisms often involve substrate deformation, thermal contraction, clast reorganization, compaction of lava flows and densification driven by surface tension stresses, along with discrete surface block movements (Briole et al., 1997; Stevens et al., 2001; Lu et al., 2005; Chaussard, 2016; Kennedy et al., 2016; Wittmann et al., 2017; Carrara et al., 2019; Volkova et al., 2022).
Moreover, the post-emplacement behavior of lava flows on volcanic edifices stands as a prominent driver of significant local ground displacement and heightened hazards in such environments. This underscores the critical importance of studying these signals for an accurate assessment of area-specific risks.
Consequently, the objective of this study is to delve into the intricate kinematics and the contributions to ground deformation stemming from lava flows emitted by Mt. Etna volcano (southern Italy) over the past decade (Figure 1). Mt. Etna stands as the foremost active onshore stratovolcano in Europe. In pursuit of this aim, we harnessed SAR and multispectral satellite data to analyze lava boundaries, thickness, and temporal behavior using multitemporal InSAR analysis and the stereo radargrammetry technique. The outcomes of our analysis provided a comprehensive view of both recent (post-2018) and older (pre-2015) lava flow dynamics on the summit of the Etna volcano for the first time.
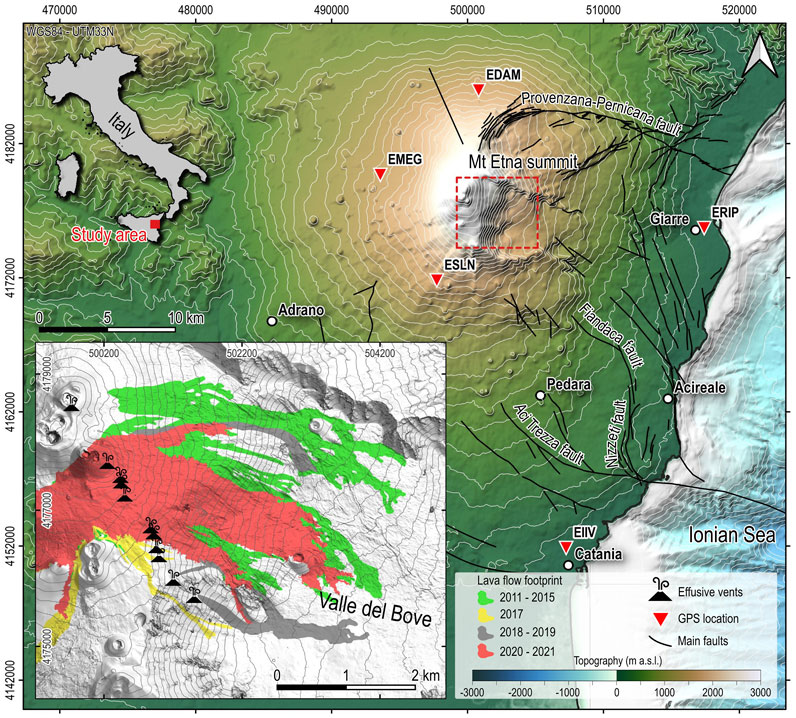
FIGURE 1. Study area overview. Black segments indicate the main tectonic structures, while the red triangles indicate the location of the selected GNSS stations. The dashed red rectangle delineates the study area zoomed in the inset panel where past (2011–2017) and recent (2018–2021) lava flow footprints are shown [data for the pre-2015 period are available from the Etna Observatory geoportal at http://geodb.ct.ingv.it/geoportale/; data for the 2017 and 2020–2021 period are available from Ganci et al. (2023) and De Beni et al. (2021)]. The shaded relief of the Etna volcanic edifice derives from the ALOS 30m DEM. Bathymetry data is taken from the European Marine Observation and Data Network (EMODnet—https://emodnet.ec.europa.eu/en/bathymetry).
1.1 The case study
Mt. Etna (southern Italy) volcano represents an exceptionally well-studied volcanological laboratory (Bonaccorso, 2004). The volcanic edifice, located in a highly complex tectonic context at the boundary between the colliding African and European plates (Tonarini et al., 2001), rises more than 3,300 m above sea level (a.s.l.). Frequent explosive eruptions and effusive activity occur from summit vents and fissures along the volcano flanks. Volcanic activity is often accompanied by shallow earthquakes and seismic swarms, frequently destructive, which increase the hazard in municipalities surrounding the volcano (Azzaro and Barbano, 2000; Azzaro et al., 2013; Bignami et al., 2019; De Novellis et al., 2019; Saroli et al., 2021). Eruptive products at Mt. Etna mainly consist of: 1) pyroclastic materials (i.e., lapilli, bombs, ashes) ejected from the summit vents and deposited on the flanks, 2) volcanic gas clouds, 3) pyroclastic flows, lahars and debris avalanches and 4) lava flows, spreading mainly in the eastern part of the volcano (Andronico et al., 2021; Bisson et al., 2021).
In the last 20 years, periods of long-lasting, low-energy Strombolian activity, usually accompanied by the emission of lava flows at low output rates from vents located at the base of the summit craters (Andronico et al., 2021; De Beni et al., 2021) alternated with sequences of short-lasting paroxysmal events (i.e., violent Strombolian lava fountains), as observed during the 2011–2013 and 2015–2016 eruptions (Behncke et al., 2014; Viccaro et al., 2014; Cannata et al., 2018). After 15 months of quiescence and since February–April 2017 eruption, weak explosive activity resumed at Bocca Nuova and North–East Crater in July 2018, culminating with the eruptive episode of 23–28 August 2018, when Strombolian explosions and lava flows occurred. Then the persistent very weak summit activity was temporarily interrupted by the December 2018 eruption (Borzi et al., 2020). In detail, on 24–27 December 2018, a flank eruption occurred: in the early morning of 24 December, a magmatic dyke intruded on the south-eastern flank of the volcano, leading to an intense seismic swarm culminated, 2 days after, with the strongest Mw 4.9 earthquake that dislocated the Fiandaca fault on the south-eastern flank of the volcano (Figure 1). This phenomenon caused extensive ground deformations along the south-eastern flank of Mt. Etna volcano, and superficial faulting seriously damaged numerous roads and buildings. A main NNW-SSE eruptive fissure, 2 km in length, opened on the eastern flank of the volcano at an altitude of 3,100–2,400 m a.s.l. The main fissure fed lava flows, extending up to about 1,650 m a.s.l., spreading eastward along the Valle del Bove western flank.
Afterward, the resumed weak Strombolian activity persisted for almost 2 years, with some minor events, such as the production of lava flows during the May 2019 eruption, and then shifted towards more energetic manifestations, with a new sequence of paroxysmal eruptions starting in December 2020. From December 2020 to February 2022, more than 60 episodes of ash-rich lava fountaining took place, with the formation of sustained eruptive columns several kilometers high (Andronico et al., 2021; Calvari and Nunnari, 2022; Corsaro and Miraglia, 2022), combined with lava flows emplaced for distances of some kilometers from the emitting crater during each event. This new paroxysmal sequence showed an extraordinary regular periodicity of occurrence in February–April 2021, with one event every 30–50 h, and between May and July 2021, with even shorter time gaps (10–15 h).
All these events produced many lava flows, spreading over several squared kilometers, mainly in the Valle del Bove area (Figure 1), an EW-oriented horseshoe-shaped depression formed about 10 ka ago (Calvari et al., 2004). Thanks to its position and morphology, this erosive depression is a preferential path for lava flows produced during Etna paroxysms, with a decametric accumulation in the last 300 years (Behncke et al., 2005).
Although significant research has delved into the morphological and geometrical characteristics of Etna’s lava flows, utilizing both ground-based and remote sensing techniques (Cappello et al., 2018; Ganci et al., 2018; 2022; 2023; De Beni et al., 2021), the exploration of their post-emplacement kinematic behavior and subsequent effects on the volcanic structure remains a partially addressed aspect. Earlier attempts at this investigation relied on low-resolution ERS-1 SAR images captured between 1991 and 1993 (Briole et al., 1997; Stevens et al., 2001). While these studies hinted at lava flow dynamics, their ability to comprehensively describe these dynamics was limited due to the resolution constraints of the available SAR data and processing algorithms at the time. As such, a comprehensive understanding of the intricate kinematic patterns of lava flows and the resultant impact on the volcanic edifice necessitates a contemporary and more detailed approach.
2 Data and methods
To characterize the kinematics of old and recent lava flows on Mt. Etna summit, we exploited several datasets acquired from Sentinel-1, Sentinel-2 and COSMO-SkyMed satellite missions. Sentinel-1 (S1) SAR data were exploited to evaluate the dynamics of the entire volcanic edifice and the post-emplacement behavior of lava flows emitted by the volcanic vents from January 2016 to July 2021. COSMO-SkyMed (CSK) SAR data were exploited to generate pre- and post-eruption Digital Elevation Models (DEM) to estimate the thickness of the accumulated lava flows. Finally, Sentinel-2 multispectral data (S2) allowed for delimiting the lava boundaries of the recent eruptions of December 2018 and May 2019. An overview of the methods exploited to generate the products, useful in pursuing the purposes of the work, is reported in Table 1. The validation and interpretation of the results from remote sensing data were performed by comparing the InSAR results with GNSS measurements at some continuous stations located on the Mt. Etna edifice (Figure 1), and ancillary data from the literature.

TABLE 1. Overview of the available data and methods used to produce the results.
2.1 SAR data and processing
2.1.1 Sentinel-1 data
The S1 mission includes a constellation of two polar-orbiting satellites (Sentinel-1A and -1B), performing C-band SAR imaging. These data are widely used to monitor sea and land ice movements (Hong and Yang, 2018); oil spills (Rajendran et al., 2021); land-use change (Denize et al., 2018) and ground movements caused by earthquakes; volcanoes; landslides and subsidence (Brunori et al., 2015; De Novellis et al., 2019; Albano et al., 2021b; 2021a; Beccaro et al., 2021; Parsons, 2021; Saroli et al., 2021).
We collected Level-1, Single Look Complex (SLC) SAR data acquired in the Interferometric Wide (IW) swath TOPSAR mode by the Sentinel-1A satellite mission from the Alaska Satellite Facility archive (https://search.asf.alaska.edu/). Data acquired along both descending and ascending tracks were processed through the Small Baseline Subset (SBAS) multi-temporal method (Berardino et al., 2002) of Differential SAR Interferometry (MT-InSAR), allowing to retrieve the ground displacements on a wide area encompassing the Etna volcanic edifice and its surroundings. Time intervals span the January 2016–July 2021 periods. To study the lava flow kinematics before and after the December 2018 eruption, we subdivided the whole investigated period into two different time intervals: T1 from January 2016 to December 2018 and T2 from January 2019 to July 2021. The sharp displacements observed during the 22–28 December 2018 paroxysm (Supplementary Figure S1), which caused ground movements up to 58 cm on the summit area of Mt. Etna (De Novellis et al., 2019), were excluded by the computation of long-term velocities in T1 and T2.
The SBAS technique combines a huge number of SAR differential interferograms characterized by short temporal and spatial baselines, aiming to minimize decorrelation effects and maximize the spatial coverage over the study area (Berardino et al., 2002). The processing of the T1 period was carried out using 88 input images acquired in descending orbit (track n. 124) and 90 images acquired along the ascending orbit (track n. 44). The processing of the T2 period comprised 76 images along the descending orbit and 77 images along the ascending orbit. The MT-InSAR processing was performed using the SARscape software (Sarmap, 2021) operative in the ENVI environment. To improve the signal-to-noise ratio, we applied a multilooking operation equal to 3 and 1 for the range and azimuth direction, respectively, to obtain a final ground resolution of 15 m. We used the ALOS 30 m DEM (https://www.eorc.jaxa.jp/ALOS/en/dataset/aw3d30/aw3d30_e.htm) as the reference elevation data to remove the topographic phase component from each interferogram. We further applied an extension of the Goldstein method (Goldstein and Werner, 1998) filtering approach to remove the interferometric noise. This process takes the coherence-dependent alpha parameter to perform selective filtering so that incoherent areas are filtered more than coherent ones. This approach significantly improves the visibility of the fringes, minimizing the decorrelation effects and signal loss (Sarmap, 2021). The inversion of the interferometric phase was carried out using the Singular Value Decomposition (SVD) technique and the atmosphere phase contribution was estimated and removed applying double filtering in space and time (Berardino et al., 2002), to correctly reconstruct the surface movements at each considered date and the linear displacement rate. A synthesis of the main parameters used in the processing chain are reported in Table 2.

TABLE 2. Main parameters of the Sentinel-1 dataset used in the multi-temporal interferometric processing.
The SBAS processing provides displacement time series and mean ground velocity maps calculated along the Line of Sight (LOS) direction. The availability of both ascending and descending acquisition geometries allowed us to compute the nearly horizontal (east-west) and nearly vertical components of the displacement during the time period covered by both (LOS) elaborations for the areas where both ascending and descending data overlap, according to the geometrical relationships in Dalla Via et al. (2012) (Eqs 1, 2):
where de and dz are the vertical and east-west displacements of a surface point P, Da and Dd are the two displacements measured along the ascending and descending LOS on the same point P, and θa and θd be the look angles for both orbit modes.
Finally, InSAR-derived ground displacements were validated by comparison with the results of Pezzo et al. (2023), who also processed the S1 dataset spanning a similar temporal interval. Moreover, the amplitude and trend of the vertical component of the InSAR time series was compared with those from GNSS measurements at selected geodetic stations located in the study area (red triangles in Figure 1).
2.1.2 COSMO-SkyMed data
We further exploited the amplitude of two pairs of CSK data downloaded from the CSK portal (https://portal.cosmo-skymed.it/) in a radargrammetric-matching work frame to estimate the topographic changes caused by the lava emplacement during the December 2018 and May 2019 eruptions. As for photogrammetry, radargrammetry exploits a stereo acquisition configuration to estimate precise topographic heights. More information about the technique can be found in Bamler (2000) and Raggam et al. (2010). In detail, we used 3-m, high-resolution CSK images acquired in Stripmap HIMAGE mode along the descending orbit on 26 and 27 June, 2016, and on 6 and 13 July, 2019, for pre- and post-eruption DEM generation. Since a larger intersection angle between two SAR images results in a larger parallax, meaning a higher geometric sensitivity to ground elevation (Li et al., 2006), we accurately chose each pair characterized by a large difference between the incidence angles of the images (i.e., equal to 22.3°) to obtain DEMs with good sensitivity to the topography. Table 3 shows the main data features used for the stereo DEM production.
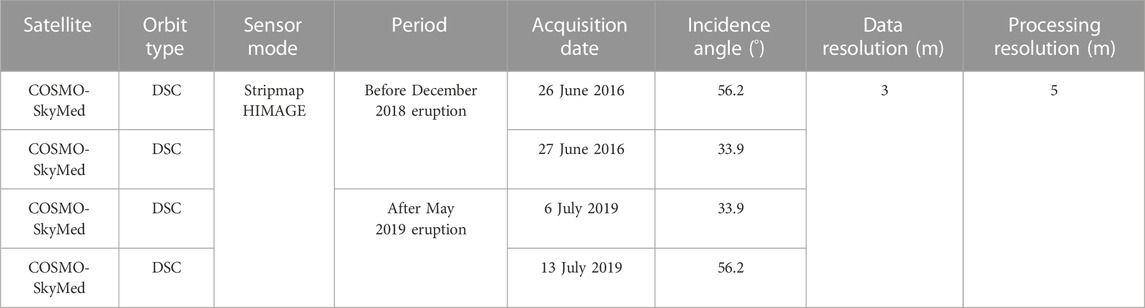
TABLE 3. Main features of the COSMO-SkyMed dataset used for the DEM production.
We used the 2015 Pleiades DEM available in the literature (Palaseanu-Lovejoy et al., 2019) as the reference DEM during the coregistration process to estimate shifts. The outputs were generated through the SARscape software at 5 m of ground resolution. The accuracy of the generated DEMs was estimated through the precision parameter (SD), which represents the standard deviation of the measurements (Eq. 3):
where γ is the intensity cross-correlation, λ is the wavelength, R is the slant range distance, ϑ is the local incidence angle, and B is the baseline (Sarmap, 2021).
The thickness of the accumulated lava flow is then estimated by computing the difference between the post- and the pre-eruption generated DEMs.
2.2 Sentinel-2 multispectral data
S2 is a European wide-swath, high-resolution, multispectral imaging mission comprising a constellation of two polar-orbiting satellites in the same sun-synchronous orbit. The multispectral instrument (MSI) on board samples 13 spectral bands: four bands at 10 m, six bands at 20 m, and three bands at 60 m spatial resolution. The acquired data are designed mainly for land consumption, coastline evolution, and risk mapping applications (Massimetti et al., 2020). The high-resolution bands in the visible and near-infrared domains (VIS-NIR) allow to successfully use such data in volcanic studies (Cappello et al., 2018; Plank et al., 2019).
We used S2 data to retrieve the spatial information, i.e., location, shape, and size, of the lava flows emplaced during the December 2018 and May 2019 paroxysms. S2 Level-2A, downloaded from the Copernicus Open Access Hub (https://scihub.copernicus.eu/) and supplied as 100 × 100 km2 tiles, provide the bottom of atmosphere corrected reflectance images derived from the associated Level-1C products. Limiting the cloud cover and volcanic clouds presence above the lava flows, the images selected have been acquired on 15 January 2019, and 14 June 2019. We defined the boundaries of the two lava flows using the 10-m resolution, band 2 (VIS) of the available S2 images. The first lava flows uppermost areas were difficult to distinguish visually. Therefore, we exploited the reflectance on the supplementary S2 image acquired on 29 December 2018. The obtained lava footprints were further compared and validated with ancillary data footprint provided by literature data.
3 Results and discussion
3.1 Observed global and local ground displacement trends
The multi-temporal SBAS processing of Sentinel-1 SAR data provided mean ground velocity maps of the whole volcanic edifice along the ascending and descending LOS (Supplementary Figure S2) and the associated displacement time series. Negative LOS velocities indicate ground movements away from the satellite, while positive LOS velocities imply ground movements approaching the satellite sensor.
The availability of ascending and descending acquisition geometries allowed us to calculate the horizontal (east-west) and vertical components of the ground displacements during T1 and T2 periods according to Eqs 1, 2, as shown in Figure 2. T1 corresponds to the period before the 2018 eruption, i.e., from January 2016 to December 2018, while T2 is the period following the 2018 event, from January 2019 to July 2021. The errors related to the vertical and horizontal components were estimated using the formula reported by Just and Bamler (1994). The precision value associated with both pre-and post-eruption periods is derived from parameters such as interferometric coherence and wavelength and is shown in Supplementary Figure S3.
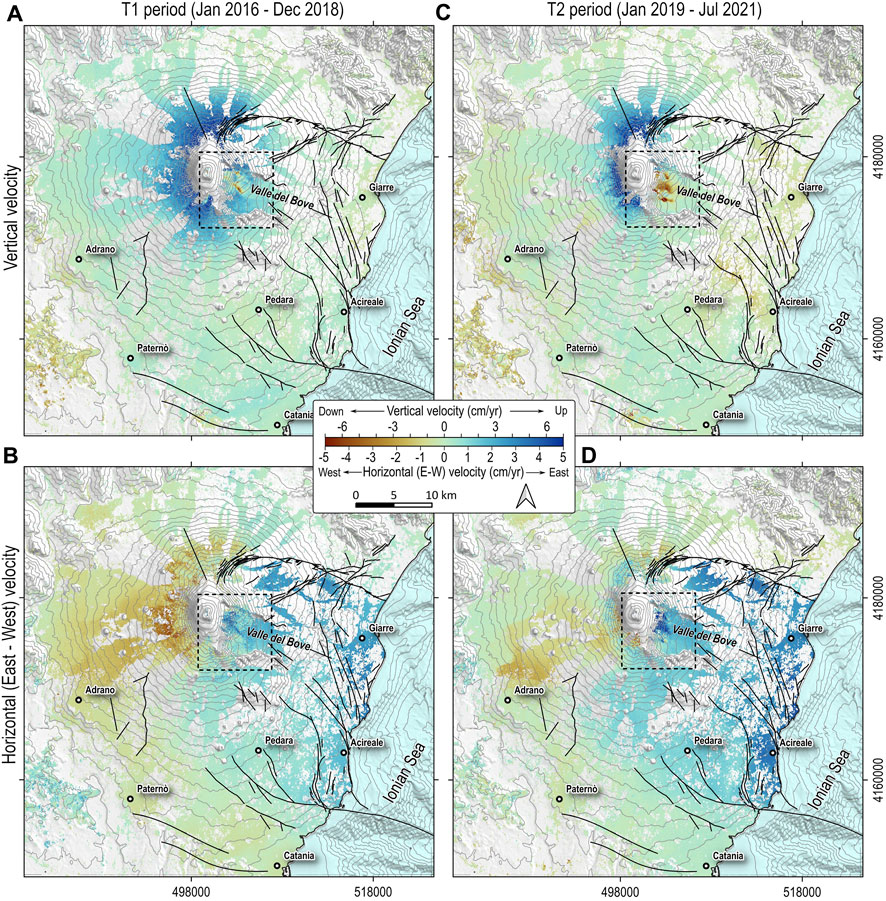
FIGURE 2. Results of the InSAR LOS displacement decomposition expressed as mean vertical and horizontal (E-W) velocities in the T1 (left panels) and T2 (right panels) periods. (A) Vertical and (B) horizontal (East-West) displacement rates in the T1 period. (C) Vertical and (D) horizontal (East-West) displacement rates in the T2 period. The black segments identify the main faults. The dashed black rectangle identifies the Valle del Bove area, zoomed in Figure 3.
Results in Figure 2 were validated by comparing the InSAR-derived vertical displacement time series with those obtained from the analysis of the vertical component of GNSS measurements at selected geodetic stations located in the volcanic area (red triangles in Figure 1). The comparison is plotted in Supplementary Figure S4, together with the standard deviation (Σ), i.e., the error, associated to both InSAR and GNSS measurements. The figure shows an overall agreement between the two measurements, as the InSAR-derived vertical displacements show trends and amplitudes similar to the ones from GNSS measurements.
The obtained mean horizontal and vertical velocity patterns in Figure 2 also agree with the results of Pezzo et al. (2023). In the T1 period (from January 2016 to December 2018), the Etna volcano shows general inflation (Figure 2A), with a measured uplift reaching approximately 7 cm/yr at the summit area. According to Pezzo et al. (2023), such displacement is associated with melt rising along the volcano’s plumbing system, in agreement with the long-lasting inflation phase that started in early 2015, episodically interrupted by small deflations related to short-term volcanic activities (Cannata et al., 2018). Horizontal movements in the same period (Figure 2B) highlight the progressive eastward movement of the eastern flank, with displacement rates reaching approximately 3 cm/yr, mainly confined to the North by the Provenzana-Pernicana fault system and accommodated by the Fiandaca, Nizzeti, and Aci Trezza faults (Ruch et al., 2012) to the South.
In the T2 period (January 2019–July 2021), vertical and horizontal velocity patterns follow the same trends as the T1 period but show different amplitudes. The vertical movements (Figure 2C) show a mean uplift of 5 cm/yr over an area smaller than that observed in the T1 period. Conversely, horizontal displacement rates (Figure 2D) highlight an overall seaward acceleration of the eastern flank of the volcano, with values up to 5 cm/yr. Such a pattern represents the inflation of the volcano, related to a magmatic replenishment of the reservoir feeding the December 2018 volcanic activity, as well as a post-eruptive anelastic deformation of the eastern flank of the volcano in response to the December 2018 dike intrusion (Pezzo et al., 2020; 2023).
Complex deformation patterns can be recognized during both T1 (pre-2018) and T2 (post-2018) periods all over the Valle del Bove area, especially on vertical displacement rates. Here (Figures 2A, C), local subsidence phenomena contrast with the long wavelength uplift signal of the volcano summit recorded on both T1 and T2 periods. A detailed analysis of the Valle del Bove area (Figure 3) reveals that the anomalous displacement patterns overlap with the footprints of both the old (pre-2015) and recent (post-2018) lava flows emitted during volcanic lava fountains (inset in Figure 1). During the T1 period, subsidence patches (up to 7 cm/yr) overlap with the 2011–2015 lava flow footprint (hereinafter referred to as Area A, the green boundary in Figure 3A). The E-W horizontal displacements do not exhibit any substantial anomalies with respect to the long wavelength eastward movement of the Etna flank during the same period (Figure 3B). During the T2 period (Figures 3C, D), two new displacement patterns can be identified on both vertical and E-W displacement rate maps. The first pattern perfectly overlaps with the footprint envelope of the lava flows deposited during the December 2018 and May 2019 paroxysms (from now on Area B, the black boundary in Figures 3C, D). The latter has been delineated by visual inspection of Sentinel-2 images (Supplementary Figure S5) as described in Section 2.2. Vertical velocities within Area B (Figure 3C) suggest clear subsidence (up to −16 cm/yr), while horizontal velocities (Figure 3D) indicate eastward and westward movements, with rates up to +5 cm/yr and −2 cm/yr, respectively, in accordance and opposition to the slope direction.
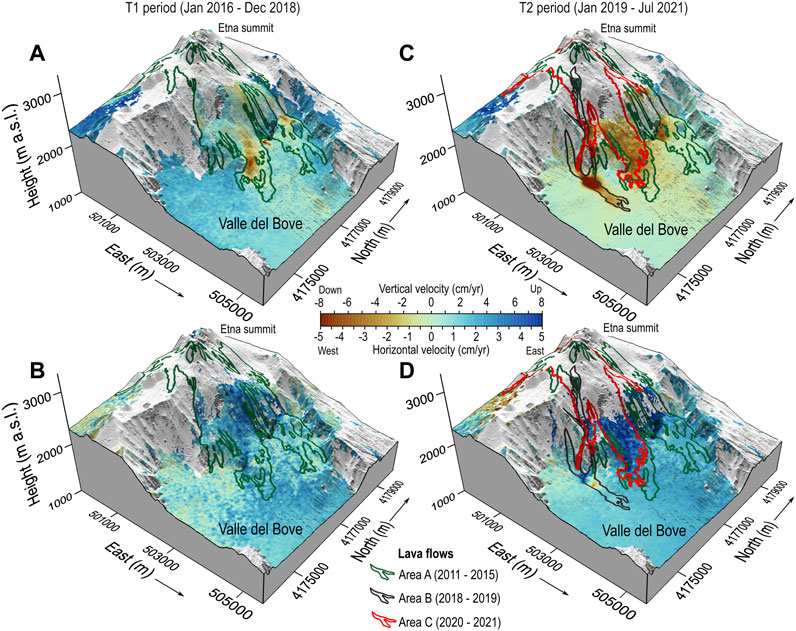
FIGURE 3. 3D view of the Etna volcano summit, showing: (A) the S1 pre-eruption cumulated vertical displacements, (B) the S1 pre-eruption cumulated horizontal displacements in the E-W direction, (C) the S1 post-eruption cumulated vertical displacements and (D) the S1 post-eruption cumulated horizontal displacements. The green, black, and red boundaries correspond to the lava flows emplaced during the Etna paroxysms in the 2011–2015 period (green curve, available at http://geodb.ct.ingv.it/geoportale/), between December 2018 and May 2019 (black curve, this study), and during the February 2020–July 2021 eruption [red curve, modified from Ganci et al. (2023)].
We further compared the subsidence rate in Area B with the slope values and the total thickness of the December 2018 and May 2019 lava flows. The slope was estimated from the 2015 DEM (Ganci et al., 2018), while the lava thickness of area B was estimated using the stereo radargrammetry technique, applied to CSK SAR data, as described in Section 2.1.2 (see also Supplementary Data S1.1, Supplementary Figure S6 and Figure 6C). We observe a cluster of points characterized by low subsidence rates (less than −5 cm/yr) located in areas with low lava thickness (<3 m) (Figure 4A) and slope angles ranging between 2° and 30° (Figure 4B). A positive correlation has been found between subsidence rates and lava thickness, i.e., higher subsidence rates correspond to larger thickness. Moreover, higher subsidence rates develop at lower slope angles, where the lava flow shows the maximum thickness.
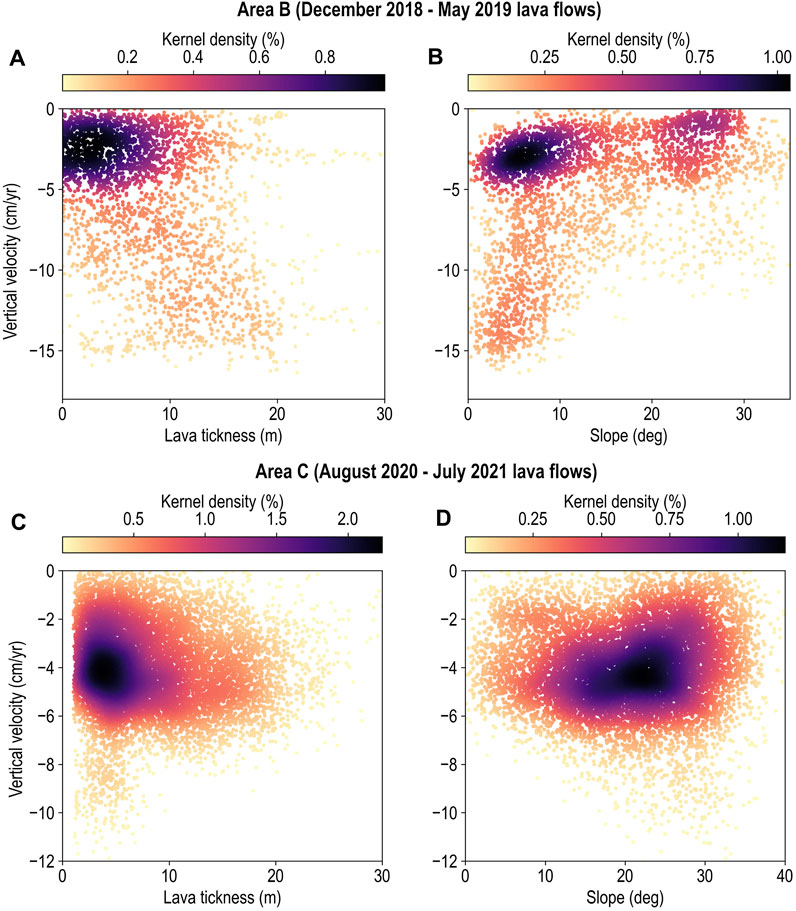
FIGURE 4. Comparison between the InSAR-derived subsidence rate and the lava thickness and ground slope angle for coherent SAR points falling on Area B (A,B) and Area C (C,D).
The second displacement pattern corresponds to the lava flow footprint deposited during the 2020–2021 paroxysms [hereafter referred to as Area C, the red boundary in Figures 3C, D from Ganci et al. (2023)]. Such lava flows overlap with Area A and partly with Area B, showing an overall increase of the vertical and eastward displacement rates compared with the T1 period, with rates up to −8 and 7 cm/yr, respectively. In Area C, we do not identify a clear dependency of subsidence rates on slope angle and lava thickness [the latter defined by Ganci et al. (2023)]. Indeed, a cluster of coherent InSAR points with subsidence rates of approximately −4 cm/yr is identified for lava thickness of approximately 3 m (Figure 4C) and at a slope angle of about 20°–25° (Figure 4D).
To investigate the temporal behavior of the observed ground displacements, we plotted the vertical and horizontal displacement time series (DTS) for all coherent InSAR points falling within the overlap portion between Areas A and C, as well as within area B, before (T1) and after (T2) the December 2018 Etna eruption (Figure 5). We compared these displacement trends with the DTS of coherent points falling on a nearby area in the Valle del Bove, which was not covered by recent lava flows (Area D in Figure 5). The vertical and horizontal DTS distribution is represented by colored bands, which indicate the quantiles calculated every 10% of probability before (T1, shades of pink) and after (T2, shades of blue) the December 2018 eruption. The solid black line represents the median trend of the time series.
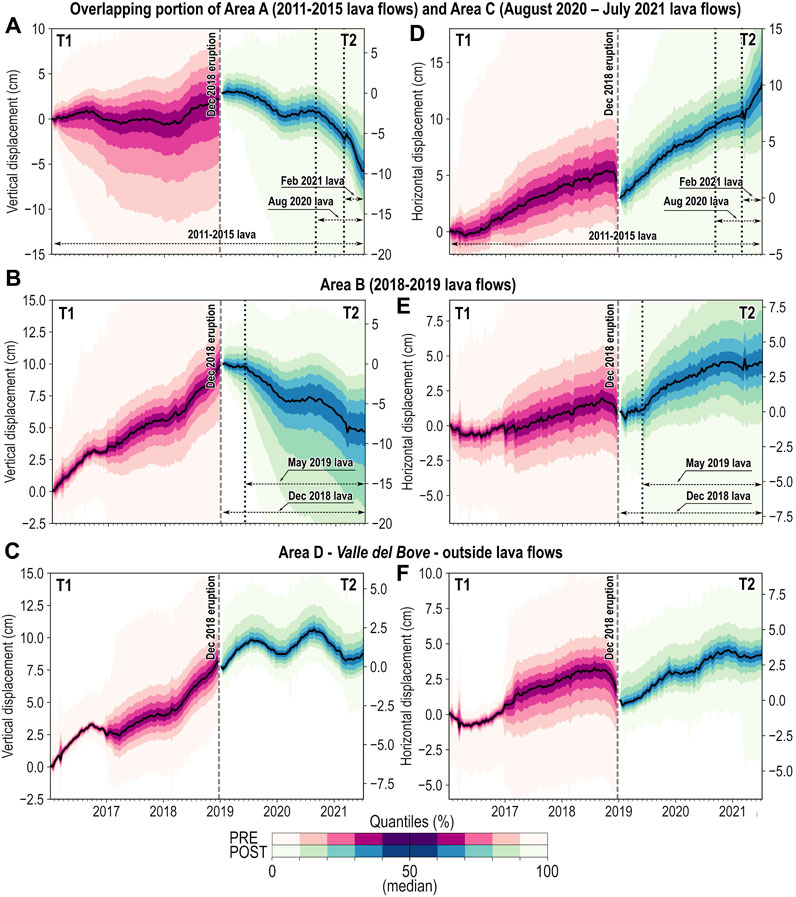
FIGURE 5. Vertical (left panels) and horizontal (E-W) (right panels) displacement time series from InSAR analysis extracted for all the points falling in the investigated areas before (T1) and after (T2) the December 2018 Etna eruption. The black curve defines the median trend, while the deviation from the median trend is represented by shades of pink (T1) and blue (T2) colored bands defining the quantiles calculated every 10%. The vertical dashed lines identify the timing of December 2018, May 2019, August 2020, and February 2021 lava flow emplacements. (A) and (D) refer to the overlap portion between Areas A-C, (B) and (E) refer to Area B, and (C) and (F) refer to Area D (Valle del Bove, outside lava flows).
During T1 (pre-2018) (shades of pink plots in Figure 5), the vertical DTS of points falling in the common portion of Areas A and C (Figure 5A) exhibits a marked variability, with some points experiencing nonlinear subsidence and others showing progressive uplift. This behavior is markedly different from the vertical uplift observed in Areas B (Figure 5B) and D (Figure 5C), which were not covered by lava flows in T1 and therefore show the long-wavelength uplift of the Etna summit caused by volcanic inflation before the 2018 eruption (Pezzo et al., 2023). During T1, the E-W DTS in all the investigated areas (Area A–C in Figure 5D, Area B in Figure 5E, and Area D in Figure 5F) exhibit an overall eastward trend. However, Area A–C (Figure 5D) shows a larger variability in the amplitude and trend of DTS compared to Areas B and D.
In T2 period (post-2018) (shades of blue plots in Figure 5), Area A–C (Figure 5A) exhibits marked subsidence with a superimposed cyclic trend, which contrasts with the cyclic vertical oscillations observed in T2 outside the lava flows in Area D (Figure 5C). E-W displacements in T2 (Figure 5D) still show an eastward trend, but with higher rates than those observed in Area D. Additionally, both vertical and E-W DTS (Figures 5A, D) evidence an acceleration after the August 2020 and February 2021 lava emplacements, with a significant increase following the February 2021 lava flows.
In the same period, Area B (Figure 5B) shows slight subsidence after the emplacement of the December 2018 lava flow, followed by a strong acceleration after the May 2019 lava emplacement in the same area, also characterized by significant variability in the displacement amplitude. Still, vertical DTS in Areas A–C and B significantly differ from cyclic vertical displacements observed outside the lava flows (Area D in Figure 5C). E-W DTS in Area B are still eastward-oriented but show significant variability of both amplitude and rates compared to the E-W DTS in Area D, since some coherent points are moving westward, as observed in Figure 3D.
3.2 Interpretation of the observed displacement trends
Ground displacements observed at volcanoes are often caused by different physical mechanisms comprising: 1) the inflation/deflation of the magmatic system, 2) the dyke intrusion during volcanic paroxysms, 3) the cooling of the magma reservoir or hydrothermal systems, 4) tectonic or gravity-driven motions, such as graben extension or gravitational flank movements, and 5) phenomena associated to the emplacement of lava flows (Solaro et al., 2010; Chaussard, 2016; Kennedy et al., 2016; Wittmann et al., 2017; Urlaub et al., 2018; De Novellis et al., 2019; Saroli et al., 2021; Volkova et al., 2022; Pezzo et al., 2023).
In the context of our study, the availability of high resolution horizontal and vertical displacement rates presents an unprecedented opportunity. For the first time, we can quantitatively evaluate the emplacement and kinematic behaviour of lava flows on the Etna volcano. This wealth of data empowers us to delve into the underlying mechanisms accountable for the observed motions in an unprecedented level of detail. By harnessing these high-resolution datasets, we can unravel how lava flows interact with the volcanic terrain, providing insights into the dynamic processes shaping the landscape post-emplacement. Moreover, this comprehensive analysis affords a unique chance to decipher the interplay between various factors influencing the motion, including terrain morphology, thermal changes, and lava viscosity.
In the case of the Etna volcano, well-known mechanisms such as inflation/deflation of the magmatic system and flank motion result in long-wavelength ground displacements that affect the entire volcano edifice. These mechanisms explain the global ground displacements observed in Figure 2 (Pezzo et al., 2023). It can be ruled out that cooling of the deep magma reservoir or hydrothermal systems is causing these displacements, as this would result in long-wavelength ground subsidence, which is opposite to the observed progressive uplift of the Etna edifice (Figure 2).
In the Valle del Bove area, the lava flows emplaced during past and recent Etna paroxysms seem to be responsible for the observed local displacement patterns. The latter should be associated with several physical mechanisms involving lava flows, such as 1) poroelastic deformation of the substrate, 2) gravity-induced repacking and rearrangement of the vesicle-bearing fluid lava and other void spaces by superposed flows, 3) densification processes, driven by surface tension stresses, 4) viscoelastic strain relaxation of the ground caused by the lava load, 5) thermal cooling and contraction of the solid lava, and 6) discrete motion of surface blocks (Briole et al., 1997; Stevens et al., 2001; Chaussard, 2016; Kennedy et al., 2016; Wittmann et al., 2017).
The Valle del Bove substrate is unlikely to experience poroelastic deformations caused by the lava load because of its nature, according to Branca et al. (2011). The substrate is composed of secular lava flows that have been emplaced over the last 300 years, with a total thickness of around 100 m (Malaguti et al., 2023). The composition of the lava flows varies from basalt to mugearite and has aphyric to highly porphyritic textures. The latter does not host a well-developed aquifer system or contain any clay fraction that would justify an evident time-delayed poroelastic deformation. The second mechanism (gravity-induced repacking) would be an instantaneous process rather than lasting for years (Stevens et al., 2001). Densification processes have the potential to notably diminish the porosity of the erupted magma, thereby contributing to the reduction in lava thickness (Kennedy et al., 2016). However, in our specific scenario, taking into account the typical viscosity and permeability values found in the literature for Etna basalts (Vinciguerra et al., 2005), it seems that the deformations associated with these processes would occur within a few days and might not be discernible through our satellite analysis. The other three mechanisms, i.e., lava load-induced viscoelastic strain relaxation, thermal contraction, and discrete block motion, could produce ground deformations compatible with those observed in the Valle del Bove, as in Figure 3. Indeed, Briole et al. (1997), who investigated with InSAR the deformation associated with the 1989 and 1986–1987 Etna lava flows, concluded that 25 up to 50% of the deformation was related to relaxation of the substrate and the remaining part to thermal contraction of the lava flows. Stevens et al. (2001) also suggested that the thermal contraction and clast repacking during cooling and creep mechanisms of the flow substrate acted at different times and explained the subsidence observed in the 1991–1993 period with SAR interferometry.
During T1, the subsidence observed in Area A (as shown in Figures 3A, 5A) was partially hidden by the global uplift of the Etna summit area (Figure 5C). The observed subsidence is associated with eastward horizontal movements (Figures 3B, 5D), with rates slightly higher than those related to the long-wavelength ones related to the eastern flank instability. We propose that such ground movements are caused by long-term mechanisms, such as the remnant cooling of pre-2015 lava flows and viscous deformation of the substrate, as also suggested by Briole et al. (1997) and Stevens et al. (2001).
During T2, the vertical and horizontal ground displacement patterns and DTS in areas B and C show differences in the dynamics of the most recent lava flows. Area B (2018–2019 lava flows) exhibits the short-term dynamics of the December 2018 and May 2019 lava flows. The maximum vertical and E-W displacements are in the area enclosed by the dashed red circle in Figures 6A–C, where the thickness of the cumulated lava is the greatest, as determined by the analysis of CSK SAR data. Vertical and horizontal displacement profiles along the a-a′ cross-section (Figure 6D) have been depurated of the background eastward motion of the Etna flank (approximately 3.5 cm); the resultant displacement vectors (Figure 6E) reveal contractional behavior of the area, typical of the cooling of young lava flows. This contraction produces vertical subsidence and horizontal displacements converging towards the subsidence depocenter, as observed in Figures 6D, E, leading to the interpretation of the thermal lava contraction as the primary deformation mechanism responsible for the observed displacements, in agreement with other case studies (Wittmann et al., 2017; Volkova et al., 2022). Phenomena such as gravity-induced repacking and rearrangement of the vesicle-bearing fluid lava and other voids occur almost instantaneously, while long-term, viscous deformation of the substrate should be more significant after the complete cooling of the lava flow.
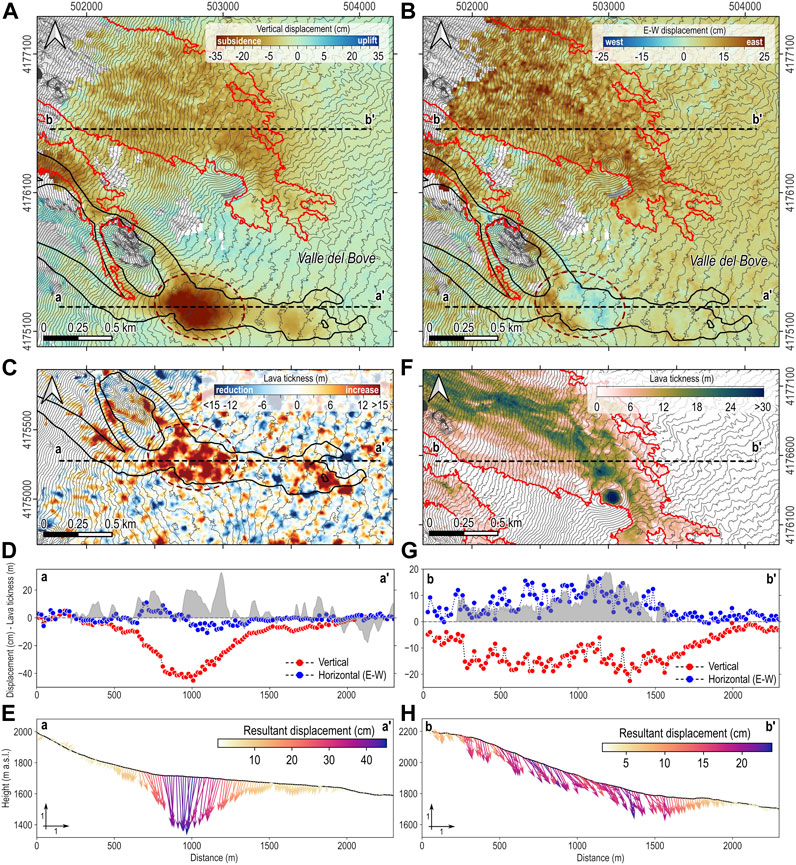
FIGURE 6. Detailed analysis of the lava flow dynamics in the T2 period. (A) Vertical and (B) E-W cumulated ground displacements in the T2 period. (C) Thickness of the lava flows deposited after the December 2018 and May 2019 eruptions (see Section 2.1.2). (D) Vertical and E-W displacement profiles and lava thickness along the a-a′ cross-section in (A,B). (E) Resultant ground displacement vectors along the a-a′ cross-section. (F) Thickness of the lava flows deposited in the August 2020–July 2021 period [modified from Ganci et al. (2023)]. (G) Vertical and E-W displacement profiles and lava thickness along the b-b′ cross-section in (A,B). (H) Resultant ground displacement vectors along the b-b′ cross-.section.
In Area C (2020–2021 lava flows), during the T2 period, we observe the superimposition of long- and short-term lava flow dynamics. From January 2019 to July 2021, we observe the subsidence (T2 in Figure 5A) and eastward motion (T2 in Figure 5D) of the pre-2015 lava flows. The subsidence is more evident than in T1 due to the termination of the large-scale Etna inflation after the December 2018 paroxysm (T2 in Figure 5C). On August 2020, a paroxysm produced a lava flow that partially covered Area C, while the subsequent February 2021 paroxysm covered the whole area with a maximum estimated thickness of approximately 30 m (Figure 6F) (Ganci et al., 2023). As a result, we observe a substantial increase in subsidence and eastward movements (Figures 5A, D), especially after the February 2021 event. Cumulated vertical and eastward displacements spread almost homogeneously all over Area C (Figures 6A, B) regardless of lava thickness or ground slope (Figures 4C, D). Displacement profiles along the b-b′ cross-section show that the amplitude of subsidence and eastward motion (the latter depurated of the large-scale eastward motion of the Etna flank of approximately 3.5 cm) are comparable (Figure 6G). As a result, the cumulated displacement vectors in Figure 6H are more inclined than the ground slope.
We explain such observations as resulting from the superimposition of long-term lava cooling and viscous deformation of the pre-2015 lava flows, combined with recent (post-2020) lava cooling and contraction, as well as local flank collapse. The latter phenomenon occurs on large slope inclinations (approximately 20°–25° from Figure 4D), greater than that of Area B, and likely involves a sliding surface located a few meters below the surface, where the recent lava is still molten and acts as a detachment over which the cooler (and denser) upper lava slides, thus maintaining the coherence in the SAR signal.
4 Conclusion
We demonstrated that the kinematics of old and recent lava flows at a giant stratovolcano can be resolved by using a multidisciplinary approach comprising the processing of Sentinel-2 optical data together with Sentinel-1 and Cosmo-SkyMed radar satellite data through different remote sensing techniques. Vertical and horizontal Sentinel-1 displacement time series at Mt. Etna volcano produced for the 2016–2021 period provided new insights on the emplacement of lava flows during different paroxysms, with respect to the available literature. Our new results permit us to unravel the following:
• The presence of several subsidence areas, opposite in trend with respect to the long-wavelength uplift of the Etna volcanic edifice, which fairly overlap with old (before 2015) and recent (after 2018) lava flow footprints identified with Sentinel-2 multispectral images and with literature data.
• Such areas also show horizontal displacements, directed downslope on areas with high slope angles but often directed upslope on areas characterized by low slope angles and larger lava thickness.
• The observed displacements result mainly from lava emplacement and cooling, producing thermal contraction of the lava body and viscous compaction of the underlying substrate. Both phenomena act at different periods, being the thermal contraction predominant for recent lava flows. Downslope sliding is also invoked, especially for recent lava flows emplaced on high slope areas.
The observed displacements are not negligible with respect to the deformation associated with pressure changes in the magmatic system. Therefore, we should consider lava processes and related ground deformations even decades after the emplacement when interpreting displacement fields to assess volcanic inflation or dike intrusion.
Data availability statement
The raw data supporting the conclusion of this article will be made available by the authors, without undue reservation.
Author contributions
LB performed satellite data analysis and wrote the original draft. MA and LB produced figures. MP provided the GNSS data. MA, CT, CS, GP, MP, and CC contributed writing and reviewing the manuscript. All authors contributed to the article and approved the submitted version.
Funding
The present work is supported by the INGV research project ATTEMPT—Integrated System for Multi-Hazard from Space over Mediterranean.
Conflict of interest
The authors declare that the research was conducted in the absence of any commercial or financial relationships that could be construed as a potential conflict of interest.
Publisher’s note
All claims expressed in this article are solely those of the authors and do not necessarily represent those of their affiliated organizations, or those of the publisher, the editors and the reviewers. Any product that may be evaluated in this article, or claim that may be made by its manufacturer, is not guaranteed or endorsed by the publisher.
Supplementary material
The Supplementary Material for this article can be found online at: https://www.frontiersin.org/articles/10.3389/feart.2023.1211450/full#supplementary-material
References
Albano, M., Barba, S., Bignami, C., Carminati, E., Doglioni, C., Moro, M., et al. (2021a). Numerical analysis of interseismic, coseismic and post-seismic phases for normal and reverse faulting earthquakes in Italy. Geophys. J. Int. 225, 627–645. doi:10.1093/gji/ggaa608
Albano, M., Barba, S., Bignami, C., Carminati, E., Doglioni, C., Moro, M., et al. (2021b). Three-dimensional numerical simulation of the interseismic and coseismic phases associated with the 6 April 2009, Mw 6.3 L’Aquila earthquake (Central Italy). Tectonophysics 798, 228685. doi:10.1016/j.tecto.2020.228685
Amici, S., Piscini, A., and Neri, M. (2014). Reflectance spectra measurements of Mt. Etna: A comparison with multispectral/hyperspectral satellite. ARS 03, 235–245. doi:10.4236/ars.2014.34016
Andronico, D., Cannata, A., Di Grazia, G., and Ferrari, F. (2021). The 1986–2021 paroxysmal episodes at the summit craters of Mt. Etna: insights into volcano dynamics and hazard. Earth-Science Rev. 220, 103686. doi:10.1016/j.earscirev.2021.103686
Azzaro, R., and Barbano, M. S. (2000). Analysis of the seismicity of southeastern sicily: a proposed tectonic interpretation. Ann. Geofis. 43. doi:10.4401/ag-3628
Azzaro, R., Bonforte, A., Branca, S., and Guglielmino, F. (2013). Geometry and kinematics of the fault systems controlling the unstable flank of Etna volcano (Sicily). J. Volcanol. Geotherm. Res. 251, 5–15. doi:10.1016/j.jvolgeores.2012.10.001
Bamler, R. (2000). “Interferometric stereo radargrammetry: absolute height determination from ERS-ENVISAT interferograms,” in IGARSS 2000. IEEE 2000 International Geoscience and Remote Sensing Symposium. Taking the Pulse of the Planet: The Role of Remote Sensing in Managing the Environment. Proceedings (Cat. No.00CH37120). (Honolulu, HI, USA: IEEE), 742–745. doi:10.1109/IGARSS.2000.861689
Beccaro, L., Tolomei, C., Gianardi, R., Sepe, V., Bisson, M., Colini, L., et al. (2021). Multitemporal and multisensor InSAR analysis for ground displacement field assessment at ischia volcanic island (Italy). Remote Sens. 13, 4253. doi:10.3390/rs13214253
Behncke, B., Neri, M., and Nagay, A. (2005). “Lava flow hazard at mount Etna (Italy): new data from a GIS-based study,” in Kinematics and dynamics of lava flows (Geological Society of America). doi:10.1130/0-8137-2396-5.189
Behncke, B., Branca, S., Corsaro, R. A., De Beni, E., Miraglia, L., and Proietti, C. (2014). The 2011–2012 summit activity of mount Etna: birth, growth and products of the new SE crater. J. Volcanol. Geotherm. Res. 270, 10–21. doi:10.1016/j.jvolgeores.2013.11.012
Berardino, P., Fornaro, G., Lanari, R., and Sansosti, E. (2002). A new algorithm for surface deformation monitoring based on small baseline differential SAR interferograms. IEEE Trans. Geosci. Remote Sens. 40, 2375–2383. doi:10.1109/TGRS.2002.803792
Bignami, C., Salvi, S., Albano, M., Guglielmino, F., Tolomei, C., Atzori, S., et al. (2019). “Multi-hazard analysis of Etna 2018 eruption by sar imaging,” in IGARSS 2019 - 2019 IEEE International Geoscience and Remote Sensing Symposium. (Yokohama, Japan: IEEE), 9314–9317. doi:10.1109/IGARSS.2019.8898695
Bisson, M., Spinetti, C., Andronico, D., Palaseanu-Lovejoy, M., Fabrizia Buongiorno, M., Alexandrov, O., et al. (2021). Ten years of volcanic activity at Mt Etna: high-resolution mapping and accurate quantification of the morphological changes by Pleiades and lidar data. Int. J. Appl. Earth Observ. Geoinf. 102, 102369. doi:10.1016/j.jag.2021.102369
A. Bonaccorso (Editor) (2004). Mt. Etna: Volcano laboratory (Washington, DC: American Geophysical Union).
Borzi, A. M., Giuffrida, M., Zuccarello, F., Palano, M., and Viccaro, M. (2020). The christmas 2018 eruption at mount Etna: enlightening how the volcano factory works through a multiparametric inspection. Geochem. Geophys. Geosyst. 21. doi:10.1029/2020GC009226
Branca, S., Coltelli, M., Groppelli, G., and Lentini, F. (2011). Geological map of Etna volcano, 1:50,000 scale. Italian J. Geosci. 130, 265–291. doi:10.3301/IJG.2011.15
Briole, P., Massonnet, D., and Delacourt, C. (1997). Post-eruptive deformation associated with the 1986-87 and 1989 lava flows of Etna detected by radar interferometry. Geophys. Res. Lett. 24, 37–40. doi:10.1029/96GL03705
Brunori, C., Bignami, C., Albano, M., Zucca, F., Samsonov, S., Groppelli, G., et al. (2015). Land subsidence, ground fissures and buried faults: inSAR monitoring of ciudad guzmán (jalisco, Mexico). Remote Sens. 7, 8610–8630. doi:10.3390/rs70708610
Calvari, S., and Nunnari, G. (2022). Comparison between automated and manual detection of lava fountains from fixed monitoring thermal cameras at Etna volcano, Italy. Remote Sens. 14, 2392. doi:10.3390/rs14102392
Calvari, S., Tanner, L. H., Groppelli, G., and Norini, G. (2004). “Valle del Bove, eastern flank of Etna volcano: A comprehensive model for the opening of the depression and implications for future hazards,” in Geophysical monograph series. Editors A. Bonaccorso, S. Calvari, M. Coltelli, C. Del Negro, and S. Falsaperla (Washington, D. C.: American Geophysical Union), 65–75. doi:10.1029/143GM05
Cannata, A., Di Grazia, G., Giuffrida, M., Gresta, S., Palano, M., Sciotto, M., et al. (2018). Space-time evolution of magma storage and transfer at Mt. Etna volcano (Italy): the 2015-2016 reawakening of voragine crater. Geochem. Geophys. Geosyst. 19, 471–495. doi:10.1002/2017GC007296
Cappello, A., Ganci, G., Bilotta, G., Herault, A., Zago, V., and Del Negro, C. (2018). Satellite-driven modeling approach for monitoring lava flow hazards during the 2017 Etna eruption. Ann. Geophys. 61, 1. doi:10.4401/ag-7792
Carrara, A., Pinel, V., Bascou, P., Chaljub, E., and De la Cruz-Reyna, S. (2019). Post-emplacement dynamics of andesitic lava flows at Volcán de Colima, Mexico, revealed by radar and optical remote sensing data. J. Volcanol. Geotherm. Res. 381, 1–15. doi:10.1016/j.jvolgeores.2019.05.019
Chaussard, E. (2016). Subsidence in the parícutin lava field: causes and implications for interpretation of deformation fields at volcanoes. J. Volcanol. Geotherm. Res. 320, 1–11. doi:10.1016/j.jvolgeores.2016.04.009
Corradino, C., Ganci, G., Cappello, A., Bilotta, G., Hérault, A., and Del Negro, C. (2019). Mapping recent lava flows at mount Etna using multispectral sentinel-2 images and machine learning techniques. Remote Sens. 11, 1916. doi:10.3390/rs11161916
Corsaro, R. A., and Miraglia, L. (2022). Near real-time petrologic monitoring on volcanic glass to infer magmatic processes during the february–april 2021 paroxysms of the South-East Crater, Etna. Front. Earth Sci. 10, 828026. doi:10.3389/feart.2022.828026
Dalla Via, G., Crosetto, M., and Crippa, B. (2012). Resolving vertical and easteast-west horizontal motion from differential interferometric synthetic aperture radar: the L’aquila earthquake. J. Geophys. Res. Solid Earth 117. doi:10.1029/2011JB008689
De Beni, E., Cantarero, M., and Messina, A. (2019). UAVs for volcano monitoring: A new approach applied on an active lava flow on Mt. Etna (Italy), during the 27 february–02 march 2017 eruption. J. Volcanol. Geotherm. Res. 369, 250–262. doi:10.1016/j.jvolgeores.2018.12.001
De Beni, E., Cantarero, M., Neri, M., and Messina, A. (2021). Lava flows of Mt Etna, Italy: the 2019 eruption within the context of the last two decades (1999–2019). J. Maps 17, 65–76. doi:10.1080/17445647.2020.1854131
De Novellis, V., Atzori, S., De Luca, C., Manzo, M., Valerio, E., Bonano, M., et al. (2019). DInSAR analysis and analytical modeling of mount Etna displacements: the december 2018 volcano-tectonic crisis. Geophys. Res. Lett. 46, 5817–5827. doi:10.1029/2019GL082467
Denize, J., Hubert-Moy, L., Betbeder, J., Corgne, S., Baudry, J., and Pottier, E. (2018). Evaluation of using sentinel-1 and -2 time-series to identify winter land use in agricultural landscapes. Remote Sens. 11, 37. doi:10.3390/rs11010037
Dietterich, H. R., and Cashman, K. V. (2014). Channel networks within lava flows: formation, evolution, and implications for flow behavior: channel networks within lava flows. J. Geophys. Res. Earth Surf. 119, 1704–1724. doi:10.1002/2014JF003103
Dietterich, H. R., Downs, D. T., Stelten, M. E., and Zahran, H. (2018). Reconstructing lava flow emplacement histories with rheological and morphological analyses: the harrat rahat volcanic field, kingdom of Saudi arabia. Bull. Volcanol. 80, 85. doi:10.1007/s00445-018-1259-4
Favalli, M., Fornaciai, A., Nannipieri, L., Harris, A., Calvari, S., and Lormand, C. (2018). UAV-based remote sensing surveys of lava flow fields: a case study from etna’s 1974 channel-fed lava flows. Bull. Volcanol. 80, 29. doi:10.1007/s00445-018-1192-6
Ganci, G., Cappello, A., Bilotta, G., Herault, A., Zago, V., and Del Negro, C. (2018). Mapping volcanic deposits of the 2011–2015 Etna eruptive events using satellite remote sensing. Front. Earth Sci. 6, 83. doi:10.3389/feart.2018.00083
Ganci, G., Cappello, A., and Neri, M. (2022). Data fusion for satellite-derived Earth surface: the 2021 topographic map of Etna volcano. Remote Sens. 15, 198. doi:10.3390/rs15010198
Ganci, G., Bilotta, G., Zuccarello, F., Calvari, S., and Cappello, A. (2023). A multi-sensor satellite approach to characterize the volcanic deposits emitted during etna’s lava fountaining: the 2020–2022 study case. Remote Sens. 15, 916. doi:10.3390/rs15040916
Goldstein, R. M., and Werner, C. L. (1998). Radar interferogram filtering for geophysical applications. Geophys. Res. Lett. 25, 4035–4038. doi:10.1029/1998GL900033
Griffiths, R. W. (2000). The dynamics of lava flows. Annu. Rev. Fluid Mech. 32, 477–518. doi:10.1146/annurev.fluid.32.1.477
Harris, A. J. L., Pilger, E., Flynn, L. P., Garbeil, H., Mouginis-Mark, P. J., Kauahikaua, J., et al. (2001). Automated, high temporal resolution, thermal analysis of Kilauea volcano, Hawai’i, using GOES satellite data. Int. J. Remote Sens. 22, 945–967. doi:10.1080/014311601300074487
Hong, D.-B., and Yang, C.-S. (2018). Automatic discrimination approach of sea ice in the Arctic Ocean using Sentinel-1 Extra Wide Swath dual-polarized SAR data. Int. J. Remote Sens. 39, 4469–4483. doi:10.1080/01431161.2017.1415486
Just, D., and Bamler, R. (1994). Phase statistics of interferograms with applications to synthetic aperture radar. Appl. Opt. 33, 4361–4368. doi:10.1364/ao.33.004361
Kennedy, B. M., Wadsworth, F. B., Vasseur, J., Ian Schipper, C., Mark Jellinek, A., Von Aulock, F. W., et al. (2016). Surface tension driven processes densify and retain permeability in magma and lava. Earth Planet. Sci. Lett. 433, 116–124. doi:10.1016/j.epsl.2015.10.031
Korotkii, A., Kovtunov, D., Ismail-Zadeh, A., Tsepelev, I., and Melnik, O. (2016). Quantitative reconstruction of thermal and dynamic characteristics of lava flow from surface thermal measurements. Geophys. J. Int. 205, 1767–1779. doi:10.1093/gji/ggw117
Li, Z., Liu, G., and Ding, X. (2006). Exploring the generation of digital elevation Models from same-side ers sar images: topographic and temporal effects. Photogramm. Rec. 21, 124–140. doi:10.1111/j.1477-9730.2006.00356.x
Lombardo, V., Silvestri, M., and Spinetti, C. (2011). Near real-time routine for volcano monitoring using infrared satellite data. Ann. Geophys. 54. doi:10.4401/ag-5336
Lu, Z., Masterlark, T., and Dzurisin, D. (2005). Interferometric synthetic aperture radar study of okmok volcano, Alaska, 1992-2003: magma supply dynamics and postemplacement lava flow deformation: insar study of okmok volcano. J. Geophys. Res. 110. doi:10.1029/2004JB003148
Malaguti, A. B., Branca, S., Speranza, F., Coltelli, M., Del Carlo, P., and Renzulli, A. (2023). Age of the Valle del Bove formation and chronology of the post-collapse flank eruptions, Etna volcano (Italy). J. Volcanol. Geotherm. Res. 434, 107752. doi:10.1016/j.jvolgeores.2023.107752
Massimetti, F., Coppola, D., Laiolo, M., Valade, S., Cigolini, C., and Ripepe, M. (2020). Volcanic hot-spot detection using SENTINEL-2: A comparison with MODIS–MIROVA thermal data series. Remote Sens. 12, 820. doi:10.3390/rs12050820
Oppenheimer, C. (1993). Thermal distributions of hot volcanic surfaces constrained using three infrared bands of remote sensing data. Geophys. Res. Lett. 20, 431–434. doi:10.1029/93GL00500
Palaseanu-Lovejoy, M., Bisson, M., Spinetti, C., Buongiorno, M. F., Alexandrov, O., and Cecere, T. (2019). High-resolution and accurate topography reconstruction of mount Etna from Pleiades satellite data. Remote Sens. 11, 2983. doi:10.3390/rs11242983
Parsons, T. (2021). The weight of cities: urbanization effects on earth’s subsurface. AGU Adv. 2. doi:10.1029/2020AV000277
Pezzo, G., Palano, M., Tolomei, C., De Gori, P., Calcaterra, S., Gambino, P., et al. (2020). Flank sliding: A valve and a sentinel for paroxysmal eruptions and magma ascent at mount Etna, Italy. Geology 48, 1077–1082. doi:10.1130/G47656.1
Pezzo, G., Palano, M., Beccaro, L., Tolomei, C., Albano, M., Atzori, S., et al. (2023). Coupling flank collapse and magma dynamics on stratovolcanoes: the Mt. Etna example from InSAR and GNSS observations. Remote Sens. 15, 847. doi:10.3390/rs15030847
Plank, M., Filizzola, P., Neri, N., Pergola, , Neri, , Nolde, , et al. (2019). The July/August 2019 Lava Flows at the Sciara del Fuoco, Stromboli–Analysis from Multi-Sensor Infrared Satellite Imagery. Remote Sens. 11, 2879. doi:10.3390/rs11232879
Raggam, H., Gutjahr, K., Perko, R., and Schardt, M. (2010). Assessment of the stereo-radargrammetric mapping potential of TerraSAR-X multibeam spotlight data. IEEE Trans. Geosci. Remote Sens. 48, 971–977. doi:10.1109/TGRS.2009.2037315
Rajendran, S., Vethamony, P., Sadooni, F. N., Al-Kuwari, H. A.-S., Al-Khayat, J. A., Seegobin, V. O., et al. (2021). Detection of wakashio oil spill off Mauritius using sentinel-1 and 2 data: capability of sensors, image transformation methods and mapping. Environ. Pollut. 274, 116618. doi:10.1016/j.envpol.2021.116618
Ruch, J., Pepe, S., Casu, F., Acocella, V., Neri, M., Solaro, G., et al. (2012). How do volcanic rift zones relate to flank instability? Evidence from collapsing rifts at Etna. Geophys. Res. Lett. 39, 2012GL053683. doi:10.1029/2012GL053683
Saroli, M., Albano, M., Atzori, S., Moro, M., Tolomei, C., Bignami, C., et al. (2021). Analysis of a large seismically induced mass movement after the December 2018 Etna volcano (southern Italy) seismic swarm. Remote Sens. Environ. 263, 112524. doi:10.1016/j.rse.2021.112524
Solaro, G., Acocella, V., Pepe, S., Ruch, J., Neri, M., and Sansosti, E. (2010). Anatomy of an unstable volcano from InSAR: multiple processes affecting flank instability at Mt. Etna, 1994–2008. J. Geophys. Res. 115, B10405. doi:10.1029/2009JB000820
Spinetti, C., Mazzarini, F., Casacchia, R., Colini, L., Neri, M., Behncke, B., et al. (2009). Spectral properties of volcanic materials from hyperspectral field and satellite data compared with LiDAR data at Mt. Etna. Int. J. Appl. Earth Observation Geoinformation 11, 142–155. doi:10.1016/j.jag.2009.01.001
Stevens, N. F., Wadge, G., Williams, C. A., Morley, J. G., Muller, J.-P., Murray, J. B., et al. (2001). Surface movements of emplaced lava flows measured by synthetic aperture radar interferometry. J. Geophys. Res. 106, 11293–11313. doi:10.1029/2000JB900425
Tonarini, S., Armienti, P., D’Orazio, M., and Innocenti, F. (2001). Subduction-like fluids in the genesis of Mt. Etna magmas: evidence from boron isotopes and fluid mobile elements. Earth Planet. Sci. Lett. 192, 471–483. doi:10.1016/S0012-821X(01)00487-3
Urlaub, M., Petersen, F., Gross, F., Bonforte, A., Puglisi, G., Guglielmino, F., et al. (2018). Gravitational collapse of Mount Etna’s southeastern flank. Sci. Adv. 4, eaat9700. doi:10.1126/sciadv.aat9700
Viccaro, M., Garozzo, I., Cannata, A., Di Grazia, G., and Gresta, S. (2014). Gas burst vs. gas-rich magma recharge: A multidisciplinary study to reveal factors controlling triggering of the recent paroxysmal eruptions at Mt. Etna. J. Volcanol. Geotherm. Res. 278–279, 1–13. doi:10.1016/j.jvolgeores.2014.04.001
Vinciguerra, S., Trovato, C., Meredith, P. G., and Benson, P. M. (2005). Relating seismic velocities, thermal cracking and permeability in Mt. Etna and Iceland basalts. Int. J. Rock Mech. Min. Sci. 42, 900–910. doi:10.1016/j.ijrmms.2005.05.022
Volkova, M. S., Shapiro, N. M., Melnik, O. E., Mikhailov, V. O., Plechov, P. Yu., Timoshkina, E. P., et al. (2022). Subsidence of the lava flows emitted during the 2012–2013 eruption of tolbachik (kamchatka, Russia): satellite data and thermal model. J. Volcanol. Geotherm. Res. 427, 107554. doi:10.1016/j.jvolgeores.2022.107554
Wittmann, W., Sigmundsson, F., Dumont, S., and Lavallée, Y. (2017). Post-emplacement cooling and contraction of lava flows: inSAR observations and a thermal model for lava fields at hekla volcano, Iceland: cooling and contraction of lava flows. J. Geophys. Res. Solid Earth 122, 946–965. doi:10.1002/2016JB013444
Keywords: Mt. Etna volcano, eruptions, remote sensing, ground displacement, lava flow, SAR data, interferometry
Citation: Beccaro L, Albano M, Tolomei C, Spinetti C, Pezzo G, Palano M and Chiarabba C (2023) Insights into post-emplacement lava flow dynamics at Mt. Etna volcano from 2016 to 2021 by synthetic aperture radar and multispectral satellite data. Front. Earth Sci. 11:1211450. doi: 10.3389/feart.2023.1211450
Received: 24 April 2023; Accepted: 05 September 2023;
Published: 15 September 2023.
Edited by:
Juergen Pilz, University of Klagenfurt, AustriaReviewed by:
Ben Matthew Kennedy, University of Canterbury, New ZealandYosuke Aoki, The University of Tokyo, Japan
Qing Zhao, East China Normal University, China
Copyright © 2023 Beccaro, Albano, Tolomei, Spinetti, Pezzo, Palano and Chiarabba. This is an open-access article distributed under the terms of the Creative Commons Attribution License (CC BY). The use, distribution or reproduction in other forums is permitted, provided the original author(s) and the copyright owner(s) are credited and that the original publication in this journal is cited, in accordance with accepted academic practice. No use, distribution or reproduction is permitted which does not comply with these terms.
*Correspondence: Lisa Beccaro, bGlzYS5iZWNjYXJvQGluZ3YuaXQ=
†These authors have contributed equally to this work