 Christine M. Harper
- Department of Biomedical Sciences, Cooper Medical School of Rowan University, Camden, NJ, United States
Lower limb cortical and trabecular bone varies with human behavior, leading to suggestions that activity level decreases have contributed to a more gracile skeleton. Similar trends are likely present in calcaneal morphology due to its locomotor role during heel strike. Such relationships exist in calcaneal trabecular structure; however, they have yet to be investigated in external morphology. Here entire external calcaneal shape is analyzed among three human populations that vary in subsistence strategy, activity level, and footwear use (n = 93) to investigate how calcaneal morphology varies relative to these factors. Calcanei were either surface scanned or micro-CT scanned. Calcaneal external shape was analyzed using a sliding semilandmark analysis with 1,007 semilandmarks. Semilandmarks were allowed to slide along tangent vectors or planes to minimize the bending energy of the thin plate spline interpolation function relative to an updated Procrustes average. Final landmark configurations underwent a Generalized Procrustes Analysis. Shape variation of Procrustes coordinates was summarized using principal components analysis (PCA). Procrustes distances between the average calcaneus of each population were calculated, and resampling statistics run to test for significant differences. The three populations exhibit significantly different calcaneal morphologies (p<0.001 for all pairwise comparisons) and separate along the first three PCs (42.11% of variance). Hunter-gatherers have superoinferiorly taller and mediolaterally wider posterior calcanei than sedentary populations. This likely serves as an adaptation for increased load transfer through the posterior calcaneus due to more active lifestyles. This is supported further by variation among the two industrialized populations. The 19th–20th century industrialized population exhibits a relatively mediolaterally wider posterior calcaneus than the mid-20th century-born population, suggesting there has been further gracilization of the calcaneus with increases in sedentary behavior over the last century.
1 Introduction
The origin of bipedalism was a critical event in the evolution of the human lineage, representing a fundamental shift away from the other apes (Ward, 2002; Harcourt-Smith and Aiello, 2004). The transition to bipedal locomotion transformed the human skeleton, leading to many unique morphologies including a relatively long hindlimb (compared to the forelimb; e.g., McHenry, 1978), a short, broad pelvis (Aiello and Dean, 1990; Rosenberg and Trevathan, 2002), a relatively large bicondylar angle of the femur (Walmsley, 1933; Clark, 1947; Heiple and Lovejoy, 1971; Stern and Susman, 1983; Tardieu and Trinkaus, 1994), and large lower limb joint surfaces for force transmission (Jungers, 1988; Ruff, 1988), to name only a few. The human foot has become particularly specialized due to its critical role in both weight-bearing and propulsion during locomotion (Aiello and Dean, 1990; Harcourt-Smith and Aiello, 2004; McNutt et al., 2018; DeSilva et al., 2019).
Within the foot, the human calcaneus exhibits many significant morphological differences relative to nonhuman primates (Harcourt-Smith and Aiello, 2004; Prang, 2015; McNutt et al., 2018; DeSilva et al., 2019; Harper et al., 2021a). One such feature is a uniquely asymmetric and convex cuboid facet morphology, which is thought to facilitate a closed-packed position of the calcaneocuboid joint during inversion and has been suggested to (along with the windlass mechanism) transform the foot into a rigid-lever during toe-off (Bojsen-Møller, 1979; Harper et al., 2021a). Humans also have a relatively mediolaterally wider and anteroposteriorly shorter calcaneal tuber than nonhuman primates, which is thought to be an adaptation for force-transmission through the posterior calcaneus during heel-strike (Latimer and Lovejoy, 1989; Prang, 2015; Harper et al., 2021a; 2022b). The human calcaneus is also characterized by a uniquely large and plantarly positioned lateral plantar process, which may serve to increase heel contact area with the substrate, potentially lowering peak compressive forces during heel strike (Gill et al., 2014; Boyle et al., 2018).
In addition to locomotor strategy, bony morphology is also affected by factors such as activity level and loading regime (Ruff et al., 1993; Chirchir et al., 2015; Saers et al., 2016; Chirchir et al., 2017; Sorrentino et al., 2020; DeMars et al., 2021). Studies investigating lower limb cortical and trabecular bone have found significant differences among human populations that differ in both subsistence strategy and activity level (i.e., hunter-gatherers vs. agriculturalists) (Ruff et al., 1993; Chirchir et al., 2015; Saers et al., 2016; Chirchir et al., 2017; Sorrentino et al., 2020; DeMars et al., 2021). More sedentary populations generally exhibit a relatively more gracile postcranial skeleton and lower trabecular bone density, which have been attributed to the reductions in mechanical stimuli associated with decreased activity levels and cultural/technological advances (Ruff et al., 1993; Chirchir et al., 2015; Saers et al., 2016; Chirchir et al., 2017; DeMars et al., 2021). When considering foot morphology, changes in footwear, such as transitions from walking barefoot or with soft shoes to the use of more rigid restrictive footwear, must also be considered. Studies have found that footwear use impacts peak plantar pressures during normal walking (e.g., Burnfield et al., 2004) and foot morphology changes with the prolonged use of restrictive footwear (Trinkaus, 2005; Zipfel and Berger, 2007; Sorrentino et al., 2020; Albee, 2022).
Studies investigating foot morphological variation among modern human populations have found significant differences relating to activity level and footwear (Trinkaus, 2005; Zipfel and Berger, 2007; Sorrentino et al., 2020; DeMars et al., 2021; Albee, 2022). In external talar morphology, for example, hunter-gatherers have been noted to have a more robust talar head/neck and a more flexible talar shape than post-industrial populations, which has been suggested to reflect long distance walking and minimal shoe wear (Sorrentino et al., 2020). Other studies have found that the habitual use of rigid footwear can lead to morphological changes in the forefoot, such as a decrease in proximal phalangeal robusticity and an increase in metatarsal torsion, as well as higher incidences of pathologies, such as hallux valgus and pathological lesions on the metatarsals (Barnett, 1962; Mays, 2005; Trinkaus, 2005; Zipfel and Berger, 2007; Drapeau and Forques-Marceau, 2019).
The calcaneus has been of particular interest to researchers investigating this question due to its critical locomotor and weight-bearing roles. During normal human walking heel strike represents the beginning of the stance phase in the gait cycle (Levine et al., 2014), which loads the calcaneus with every step. Previous studies of calcaneal external variation have found significant differences in calcaneal anteroposterior length between Medieval and Post-Medieval populations, which was attributed to changes in footwear (Albee, 2022), and a relatively wider anterior/middle talar facet in non-sedentary populations, thought to be a consequence of relatively higher loading through the calcaneus (Harper et al., 2022b). A recent analysis of whole-bone calcaneal internal structure found that bone volume fraction is relatively higher in hunter-gatherers than mixed-strategy agriculturalists, likely due to increased mechanical loading associated with a more mobile lifestyle (DeMars et al., 2021). The relationships between whole-bone calcaneal external shape and activity level, subsistence strategy, and footwear, however, have yet to be investigated. Recent studies of calcaneal external shape among nonhuman great apes have found significant differences among species/subspecies within a genus that have subtle differences in locomotor repertoires, suggesting that the calcaneus is a fruitful location to investigate these relationships (Harper et al., 2021a; Harper et al., 2021b; Harper et al., 2022b). It is also important to note however, that some morphological differences seen in calcaneal external morphology may also be related to phylogeny and relationships within the genus Homo (e.g., Pablos et al., 2014; Trinakus et al., 2014; Harcourt-Smith et al., 2015; Pablos et al., 2019).
Here the entire external shape of the calcaneus is investigated among three human populations that differ in subsistence strategy, activity level, and footwear to test the hypothesis that calcaneal external morphology is impacted by lifestyle differences among humans. Non-sedentary populations (hunter-gatherers) are predicted to exhibit relatively wider, more robust calcanei than less active populations due to relatively higher mechanical loading through the calcaneus, consistent with findings in other skeletal elements (e.g., Ruff et al., 1993; Trinkaus, 2005; Chirchir et al., 2015; Chirchir et al., 2017; Sorrentino et al., 2020).
2 Materials and methods
2.1 Samples
The sample consists of 93 calcanei from populations that vary in subsistence strategy, activity levels, and footwear use, including hunter-gatherers, a 19th–20th century industrialized working-class population, and a recent mid-20th century-born population (Table 1; Supplementary Table S1). All individuals were skeletally adult and free from obvious skeletal pathology. Age and sex were known for those from the Terry collection at the National Museum of Natural History (NMNH; Washington, D.C.; described below) and the Forensic Anthropology Center at Texas State University (TSU; San Marcos, TX; described below) and were estimated using standard skeletal indicators (i.e., pubic symphysis morphology for age estimation and pelvic morphology for sex estimation; Buikstra and Ubelaker, 1994) for all other individuals. All individuals in the sample were known (or estimated to be) under age 50 at time of death.

TABLE 1. Sample.
The hunter-gatherer sample is a Late-Stone Age population from the Western Coast of South Africa housed at the Iziko Museums of South Africa (IMSA; Cape Town, South Africa) (Zipfel and Berger, 2007; Pfeiffer, 2013). Hunter-gatherers from the western and southern capes of South Africa are assumed to be habitually unshod during this time period and highly active (i.e., non-sedentary) (Trinkaus, 2005; Zipfel and Berger, 2007).
Two populations represent the sedentary industrialized sample. One is from the Terry Collection, an anatomical collection housed at the NMNH, consisting of working-class 19th and early 20th century Euro- and African-Americans from Saint Louis, Missouri (referred to here as the 19th–20th century industrialized population; Hunt and Albanese, 2005). This population would have been habitually shod in restrictive footwear. The other sample is a part of the Texas State University Donated Skeletal Collection, which is curated by the Forensic Anthropology Center at TSU (FACTS; Gocha et al., 2022), and consists of mid-20th century-born Euro-, African-, and Hispanic-Americans who were donated by themselves or their next of kin (referred to here as the mid-20th century-born industrialized population). Although these populations are both representative of modern urban-industrialized societies, there are likely some differences in footwear and activity level. The mid-20th century-born population is also habitually shod, however, footwear changes occurred over the course of the 20th century, for example, athletic shoes transitioned from leather or natural rubber to foam soles around the 1970s (Subotnick et al., 2010). The mid-20th century-born population is also (likely) less active, and thus more sedentary, due to a general increase in sedentary behavior throughout the 20th and early 21st century (e.g., Hill et al., 2003; Owen et al., 2010).
2.2 Data collection
Calcanei housed at the NMNH were scanned with a NextEngine laser scanner (0.1 mm resolution; NextEngine Inc., Santa Monica, CA). Calcanei housed at IMSA were micro-CT scanned using a General Electric Phoenix VTomeX L240 micro-CT system at the Stellenbosch University CT facility at a voxel size of 49μm, while calcanei housed at Texas State University were micro-CT scanned using a North Star Imaging X5000 micro-CT scanner at FACTS at a voxel size of 36 μm. Right calcanei were preferentially scanned, however left calcanei were scanned when right calcanei where unavailable or damaged. Surface models were generated from micro-CT data in Avizo Lite 9.0.1 (FEI Visualization Sciences Group, 2015) and scans from all modalities were cleaned (i.e., small holes filled) in Geomagic Wrap (3D Systems, 2015). Femoral head superoinferior breadth and tibial plateau mediolateral breadth were additionally measured with digital calipers for use in body mass estimation (described below).
2.3 Three-dimensional geometric morphometric analysis
Calcaneal external shape was quantified using a three-dimensional geometric morphometric (3D GM) sliding semilandmark analysis (Gunz et al., 2005) carried out using custom codes in MATLAB 2022b (Mathworks, Inc., Natick, MA). The entire calcaneus was represented by 1,007 sliding semilandmarks, including 916 surface semilandmarks and 91 curve semilandmarks (Figure 1; following Harper et al., 2021a; Harper et al., 2021b; Harper et al., 2022a; Harper et al., 2022c). Fixed landmarks were not included in the analysis as there are sufficient semilandmarks that they are not necessary and to maintain consistency with other sliding semilandmark analyses of the hominoid calcaneus (Bookstein, 1997; Gunz et al., 2005; Harper et al., 2021a; Harper et al., 2021b; Harper et al., 2022a; Harper et al., 2022c). The 91 curve semilandmarks were hand-placed on each calcaneus in Avizo Lite 9.0.1 (FEI Visualization Sciences Group, 2015) along the borders of the articular facets (30 on the anterior/middle talar facet, 30 on the cuboid facet, and 31 on the posterior talar facet; Figure 1) (Harper et al., 2021a; Harper et al., 2021b; Harper et al., 2022a). The anterior and middle talar facets were treated as a single articular facet because the two are fused in a larger portion of the sample (n=57). For those individuals in which the two facets remain unfused, semilandmarks were placed continuously along the medial borders of both facets, the posterior border of the middle talar facet, the lateral borders of both facets, and the anterior border of the anterior talar facet (Supplementary Figure S1; Harper et al., 2021b). The remaining 916 surface semilandmarks were hand-placed on a single template calcaneus in Avizo Lite 9.0.1 (FEI Visualization Sciences Group, 2015). The surface semilandmarks were then warped to all other calcanei using the thin plate spline (TPS) interpolation function established by the 91 articular border landmarks and an additional 15 (unanalyzed) orientation landmarks (Supplementary Figure S2) placed on each calcaneus (Bookstein, 1991; Yang, 2012). These orientation landmarks were used solely for the initial positioning of surface semilandmarks to ensure they were in a consistent order and relative position on each calcaneus prior to sliding. The warped semilandmarks were then projected onto the surface of each calcaneus for use in the sliding semilandmark analysis.
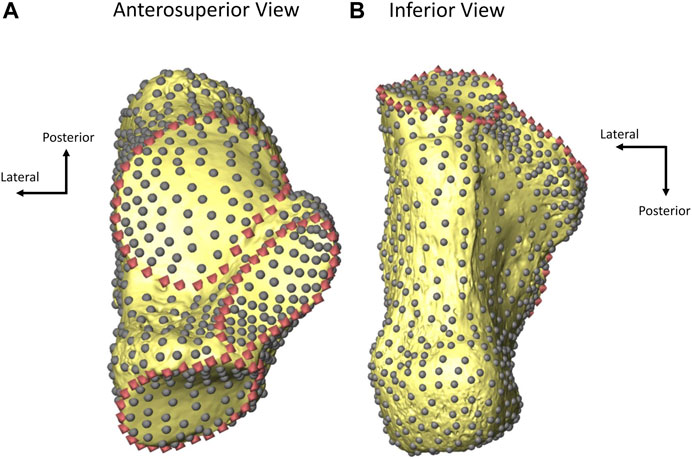
FIGURE 1. A fully landmarked mid-20th century-born calcaneus from an anterosuperior (A) and inferior (B) view. Curve semilandmarks (representing articular facet borders) are represented by pink diamonds and surface semilandmarks are represented by gray dots. Adapted from Harper et al., 2021b.
Curve semilandmarks were allowed to slide along tangent vectors and surface semilandmarks along tangent planes to minimize the bending energy of the TPS interpolation function relative to a reference calcaneus (Gunz et al., 2005). As semilandmarks may slide off the bone during this process, post-sliding semilandmarks were then projected back onto the bony surface (Gunz et al., 2005). These landmark configurations were then subjected to a generalized Procrustes analysis (GPA) to remove the effects of size, location, and orientation (Gower, 1975; Rohlf and Slice, 1990; Zelditch et al., 2012). The average landmark configuration after the GPA was then used as the reference in the next round of sliding. The process of sliding, projecting, and GPA was continued until a stable Procrustes average configuration was reached (Gunz et al., 2005).
2.4 Estimating body mass
Body mass was estimated from femoral head superoinferior breadth using regression equations based on a world-wide sample of modern humans (Ruff et al., 2018). For individuals for which femoral head superoinferior breadth was not available (n = 2), an equation using tibial plateau mediolateral breadth was used to estimate body mass instead (Ruff et al., 2018). Body mass estimation equations based on a wide range of modern humans were utilized for the entire sample, rather than individual body mass estimation equations for each population, because of their relatively low percent standard error of estimates and to ensure consistency in the analysis among the samples (Ruff et al., 2018). Femoral head SI breadth was not collected for the mid-20th century-born industrialized population and thus these individuals were not included in further analyses utilizing estimated body mass (EBM).
2.5 Statistical analyses
Unless otherwise stated, all statistical analyses were run in MATLAB 2022b (MathWorks Inc., Natick, MA). Calcaneal shape variation captured by Procrustes coordinates was summarized using a principal components analysis (PCA) run in shape space (an additional PCA was run in size-shape space; described below). Additional (individual) PCAs were run on Procrustes coordinates representing the anterior/middle talar, cuboid, and posterior talar articular facets, respectively. To test if different human populations significantly differ in calcaneal external shape, Procrustes distances between the average Procrustes configuration of each population were calculated and compared to a distribution of Procrustes distances calculated using resampling statistics with replacement. The resampling with replacement was carried out by pooling the sample of the two populations being compared, randomly assigning an individual to one of the two populations, and returning it to the pool of calcanei so that it could potentially be selected again. This process was continued until each resampled population contained the same number of individuals as the original sample size. The Procrustes distance between the averages of the two resampled populations was then calculated. This process of resampling was carried out 999 times. The sample Procrustes distance was then compared to the distribution of resampled Procrustes distances to calculate a p-value. The same process was used to test for significant sex differences. The alpha value for these analyses was set a priori at 0.05.
An additional PCA was run in size-shape space to evaluate the role of size in human calcaneal shape variation with natural log transformed centroid size (CS) as the size variable (Mitteroecker et al., 2004). To test if there was a significant relationship between calcaneal shape captured by Procrustes coordinates and CS, a Procrustes analysis of variance (ANOVA) was run in R Studio using the geomorph package (Goodall, 1991; Adams and Otárola-Castillo, 2013; R Core Team, 2013; Collyer et al., 2015; Adams and Collyer, 2016). T-tests were additionally run to test for significant sex differences in CS within the populations. The relationship between natural log CS and EBM was additionally analyzed using a reduced major axis (RMA) regression analysis. An RMA regression was chosen because it assumes there is error proportional to the variance in both the x and y terms (Swartz and Biewener, 1992; Sokal and Rohlf, 1998). The relationship was considered allometric if the 95% confidence interval for the slope did not include isometry (0.333). The regression analysis was run in R Studio using the lmodel2 package (R Core Team, 2013).
3 Results
Hunter-gatherers exhibit a significantly different calcaneal morphology from sedentary industrialized humans (p<0.001 based on Procrustes distance resampling statistics; described above). Within the sedentary industrialized sample there are also significant differences between the 19–20th century industrialized and mid-20th century born populations (p<0.001 based on Procrustes distance resampling). The separation among the three populations can be seen across the first three PCs (42.11% of the variance; Figure 2; see Table 2 for morphological interpretations of the individual PCs). There are no significant sex differences in calcaneal shape both broadly among the individuals investigated here and within the three populations (p>0.05).
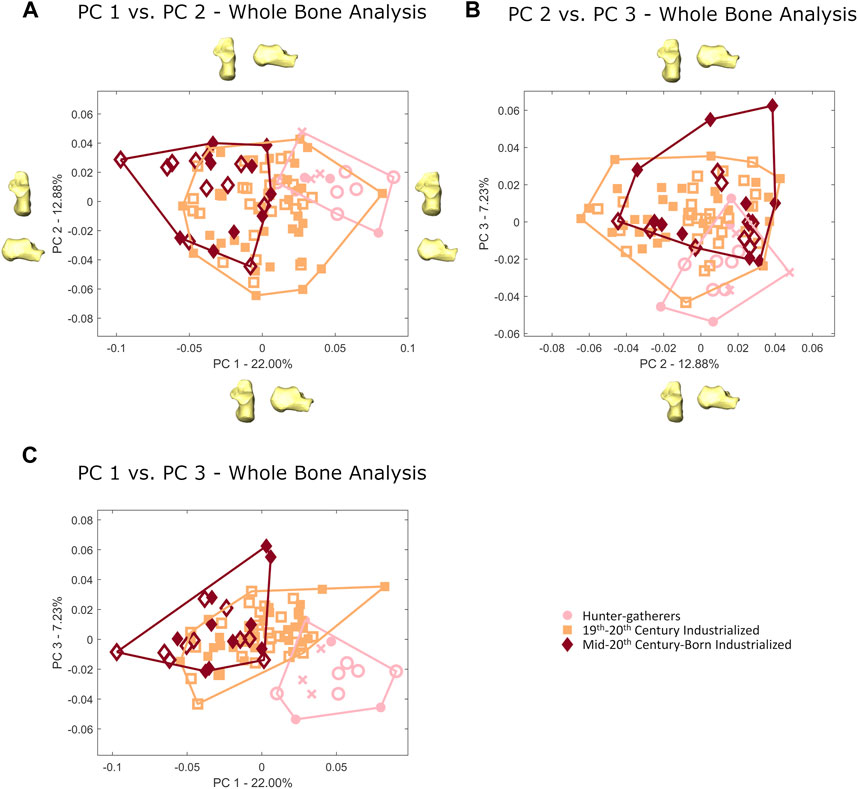
FIGURE 2. Principal component plots of whole bone calcaneal morphology for (A) PC 1 vs. PC 2, (B) PC 2 vs. PC 3 and (C) PC 1 vs. PC 3. Females are represented by open shapes and males are represented by closed shapes. Individuals of unknown sex are represented by crosses. Warps of the average calcaneus taken out two standard deviations along the positive and negative extremes of each PC are provided. Warps for PC 2 are only included in part A.
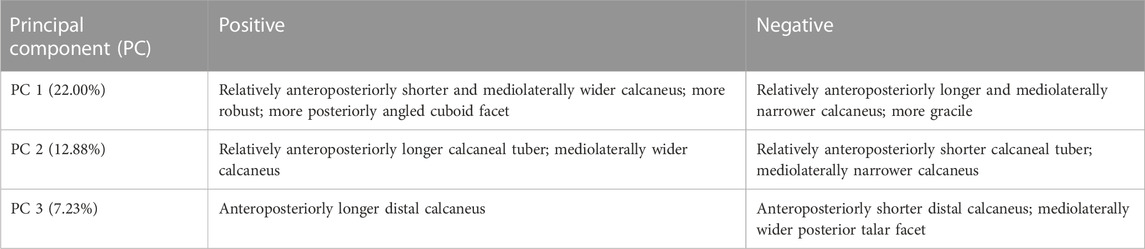
TABLE 2. Morphological variation described by PCs 1–3.
Hunter-gatherers separate from more sedentary modern human populations (19th-20th century industrialized and mid-20th century-born industrialized) along PCs 1–3 (Figure 2). This separation is primarily driven by a difference in calcaneal tuber and tuberosity morphology (there are additional differences in articular facet morphology, described below), with hunter-gatherers exhibiting a relatively mediolaterally wider and superoinferiorly taller posterior calcaneus than more sedentary populations (Figures 3, 4). A difference in posterior calcaneal morphology can also be seen among the two sedentary groups, with 19th–20th century industrialized calcanei exhibiting a relatively mediolaterally wider and superoinferiorly taller calcaneal tuber/tuberosity than the more recent mid-20th century-born industrialized calcanei (Figure 3).
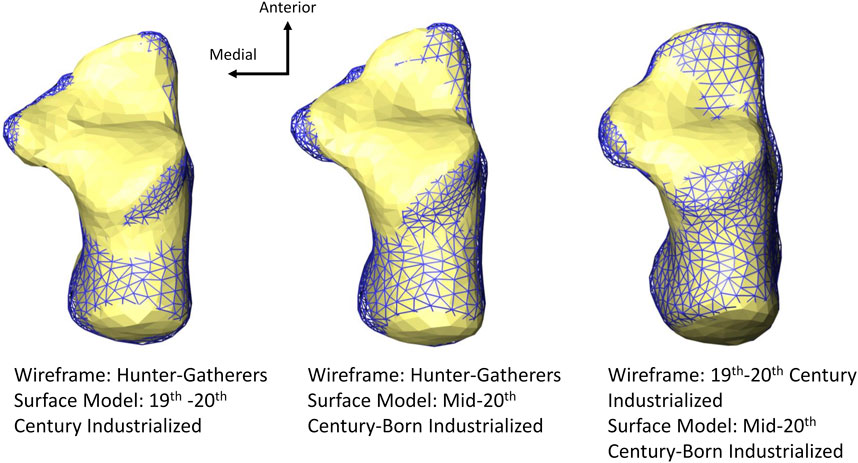
FIGURE 3. Superior view of average calcaneal variation of among populations. The hunter-gatherer population here exhibits a relatively mediolaterally wider posterior calcaneus than the two more sedentary populations (19th–20th century industrialized and mid-20th century-born populations). The 19th–20th century industrialized population exhibits a relatively mediolaterally wider posterior calcaneus than the more recent mid-20th century-born population. All models are scaled by centroid size.
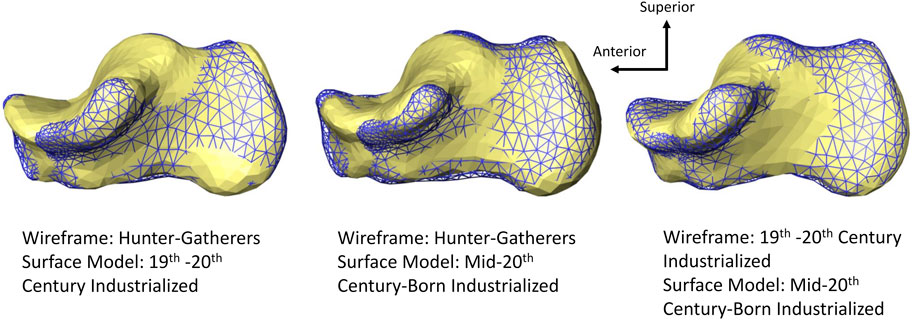
FIGURE 4. Medial view of average calcaneal variation among populations. Hunter-gatherers exhibit a relatively superoinferior taller calcaneal tuberosity than more sedentary groups (19th–20th century industrialized and mid-20th century-born industrialized populations). All models are scaled by centroid size.
The length of the calcaneal tuber (relative to the size of the calcaneus) also differs among the populations (Figure 3). The two sedentary populations have relatively longer calcaneal tubers than hunter-gatherers (Figure 3). Mid-20th century-born industrialized humans also have a relatively longer distal calcaneus (i.e., the distal superior end of the cuboid facet to the most anterior point on the posterior talar facet; Gebo, 1992; Boyer et al., 2013; Harper et al., 2022b) than the other two populations (Figure 3). There is a less distinct separation among groups regarding relative lateral plantar process size. The recent mid-20th century-born industrialized population has the relative smallest lateral plantar process, while hunter-gatherer and 19–20th century industrialized calcanei exhibit lateral plantar processes that are similar in size (Figure 5).
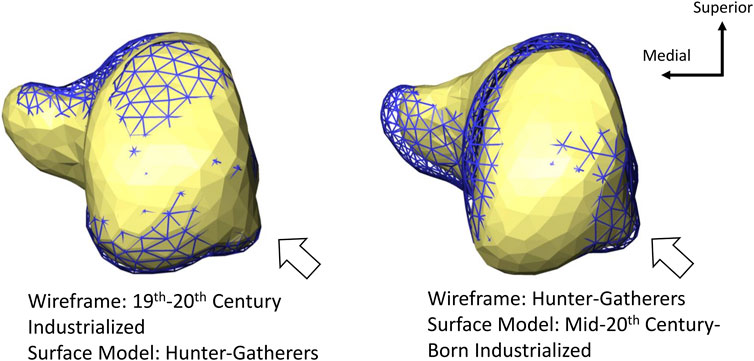
FIGURE 5. Posterior view of average calcaneal variation among populations. The mid-20th century-born population exhibits the relative smallest lateral plantar process (demarcated by the white arrow). All models are scaled by centroid size.
Hunter-gatherers additionally exhibit a relatively more posteriorly angled cuboid facet morphology (i.e., the lateral edge is more anteriorly projecting than the medial edge when whole bone shape is considered) (Figure 4). Although the relative positioning of this articular facet differs, the overall shape of the cuboid facet (nor the anterior/middle talar facet) does not differ among populations (Figures 6A,B). Hunter-gatherers also differ in their posterior talar facet morphology and separate along PCs 1–2 when the shape of the posterior talar facet is analyzed individually (Figure 6C). This is driven by a relatively mediolaterally wider posterior talar facet (Figure 7).
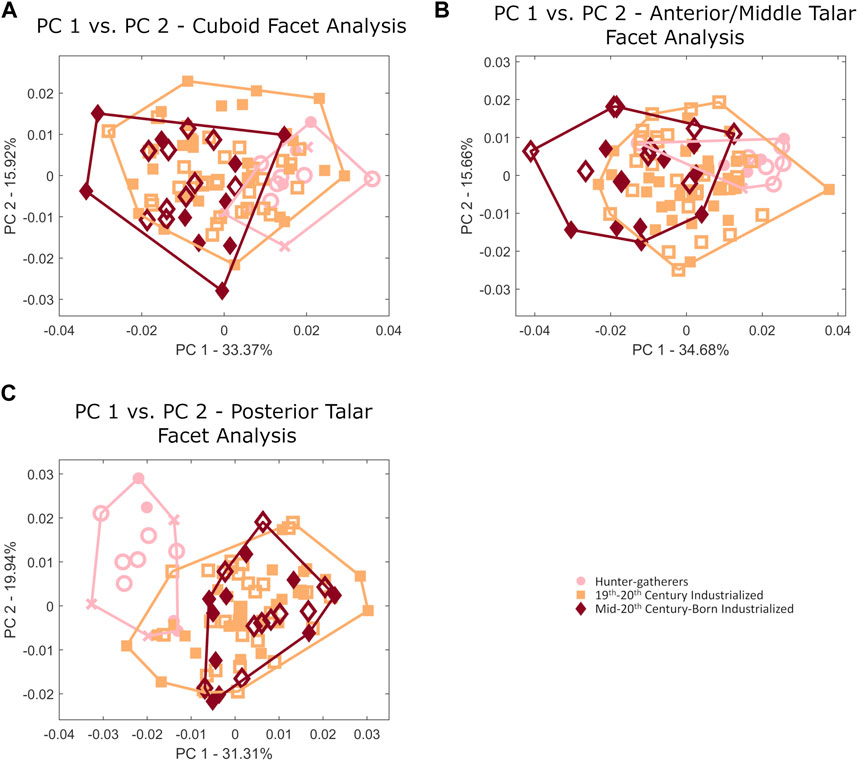
FIGURE 6. Principal component plots of (A) cuboid, (B) anterior/middle talar, and (C) posterior talar articular facet morphology. Females are represented by open shapes and males are represented by closed shapes. Individuals of unknown sex are represented by crosses.
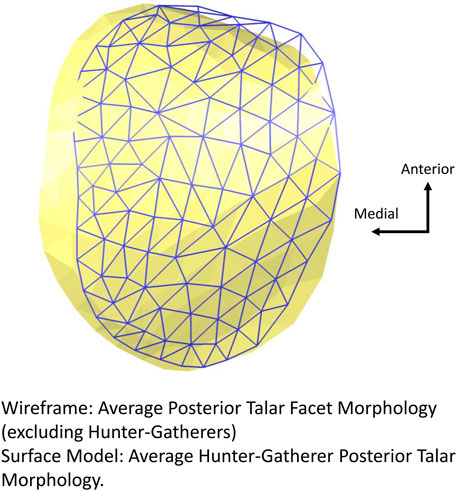
FIGURE 7. Variation in average posterior talar morphology of hunter-gatherers compared to all other populations. Hunter-gatherers exhibit a relatively mediolaterally wider posterior talar facet.
When calcanei are analyzed in size-shape space there is a gradation from hunter-gatherers to sedentary populations across the PC1 (Figure 8A). Calcaneal external shape and CS are also significantly related based on a Procrustes ANOVA (p = 0.001, R2: 0.9302, Z-score: 4.1479). Males and females significantly differ in calcaneal CS in the 19–20th century and the mid-20th century populations (p<0.001). Natural log CS scales to natural log EBM with positive allometry (slope: 0.5293, 95% confidence interval: 0.4693–0.5969), indicating that larger humans have relatively larger calcanei (Figure 8B).
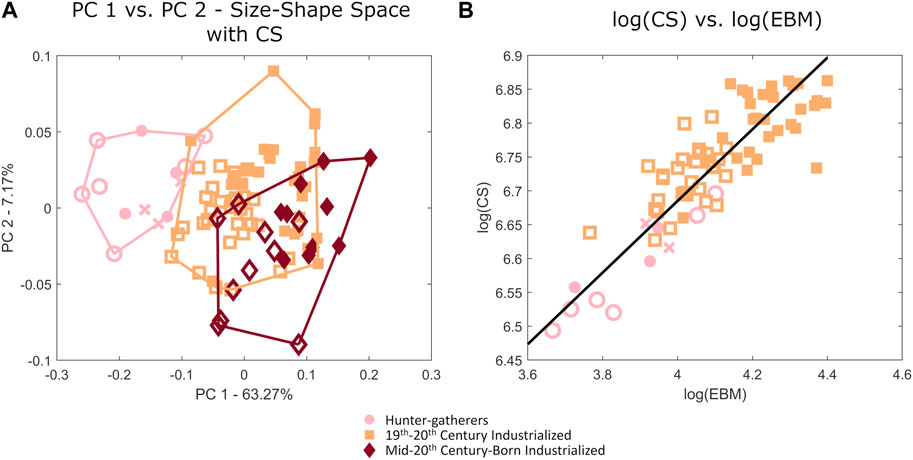
FIGURE 8. (A) Principal component plot of calcaneal variation in size-shape space, as well as (B) a regression plot of log(centroid size) versus log(estimated body mass). Females are represented by open shapes and males are represented by closed shapes. Individuals of unknown sex are represented by crosses.
4 Discussion
Calcaneal morphology differs among non-sedentary and sedentary modern human populations, which is consistent with findings of other postcranial elements, as well as calcaneal internal architecture (e.g., Ruff et al., 1993; Chirchir et al., 2015; 2017; Sorrentino et al., 2020; DeMars et al., 2021).
Hunter-gatherers exhibit a significantly different calcaneal tuber/tuberosity morphology, likely as an adaptation for their proposed more active lifestyles. Their relatively mediolaterally wider calcaneal tuber may serve to better distribute a higher magnitude/more frequent mechanical loads throughout the calcaneus due to higher activity levels and potentially the use of less rigid footwear (e.g., Jungers, 1988; Ruff, 1988; Latimer and Lovejoy, 1989; Prang, 2015). This is consistent with the trend for more terrestrial nonhuman primate taxa to have relatively more robust calcaneal tubers, which has been demonstrated both among great ape genera, as well as within Gorilla and Pan (e.g., Gebo, 1992; Prang, 2015; Harper et al., 2021a; Harper et al., 2021b; Harper et al., 2022b). This is also in agreement with findings that more active human populations have relatively higher calcaneal trabecular bone volume fraction (DeMars et al., 2021). The hunter-gatherer population studied here also exhibits a relatively superoinferiorly taller calcaneal tuberosity than more sedentary groups. Modern humans (regardless of subsistence strategy or activity level) generally have a relatively superoinferiorly taller posterior calcanei for estimated body size than nonhuman primates, which has been suggested to be an adaptation to a potentially increased magnitude of bending stresses (likely the dominant loading regime of the calcaneus), as a consequence of bipedalism (Gierse, 1976; Su et al., 1999; Harper et al., 2022b). It is possible that these bending stresses are even higher in more active populations, necessitating a relatively taller calcaneal tuberosity. The relatively anteroposteriorly shorter calcaneal tubers in the present study hunter-gatherer population is consistent with previous findings that a shorter calcaneal tuber is related to more efficient running (Raichlen et al., 2011) because this population likely would have walked further (and at relatively faster speeds) than more sedentary groups due to their subsistence strategy (e.g., Sorrentino et al., 2020).
Within the two sedentary groups, the more recent mid-20th century-born industrialized population has a relatively mediolaterally narrower and anteroposteriorly longer calcaneal tuber than the 19th–20th century industrialized population, which may be due to an increase in sedentary behavior or changes in footwear over the course of the last century. Technological advances have led to an overall decrease in physical activity level, particularly throughout the mid to late 20th century, as they have contributed to reductions in jobs that require physical labor, an increased prevalence of automobile use, and an increase in sedentary activities/hobbies, such as watching television and playing video games (Hill et al., 2003; Brownson et al., 2005; Owen et al., 2010). A decrease in activity level would likely decrease the frequency/magnitude of the mechanical loads acting on the calcaneus and thus potentially not require a large, robust calcaneal tuber. Simultaneously, footwear has become more technologically advanced and podiatrists, as well as other researchers, have become more involved in shoe design (Subotnick et al., 2010). For example, athletic shoes have transitioned from having a leather mid-sole, which was found to be poor for shock absorption, to relatively heavy natural rubber soles, to foam, which is used in athletic footwear today (Subotnick et al., 2010). Such footwear is (in part) designed to attenuate shock associated with initial heel strike during running as a means of injury prevention (Novachek, 1998) and their regular use (i.e., daily wear outside of exercise) likely reduces mechanical stresses on the calcaneus, thus again, potentially not requiring a robust posterior calcaneus. In addition to their relatively gracile calcaneal tuber/tuberosity, the recent mid-20th century-born industrialized population also exhibits a relatively anteroposteriorly longer distal calcaneus than the other populations for calcaneal size. The distal calcaneus contributes to a portion of the lever arm of the ground reaction force for the triceps surae muscles (e.g., Biewener, 1989). Studies have found that having a relatively long calcaneal tuber, coupled with a relatively short distal calcaneus, serves to increase the effective mechanical advantage of the triceps surae muscles (e.g., Biewener, 1989). It is possible that, due to their relatively sedentary lifestyle and use of technologically advanced footwear, that this degree of effective mechanical advantage is no longer necessary and thus a relaxation of constraints on distal calcaneal length has occurred in recent sedentary groups.
While the differences observed in calcaneal external shape among the two sedentary industrialized populations may provide insight into how recent changes in behavior impact bony morphology, it is important to note that the daily behaviors (i.e., physical activity during life and personal footwear choices) of the individuals included in this study are unknown. As such many of these conclusions are based on general trends in decreases in activity levels and changes in footwear from the 19th-early 20th century to the mid-late 20th century (Hill et al., 2003; Brownson et al., 2005; Owen et al., 2010; Subotnick et al., 2010) and are thus relatively speculative. It is possible that the morphological trends observed here could also be explained in light of differences in ancestry or body proportions (outside of solely body mass) among individuals. Studies investigating calcaneal morphology among a wider range of individuals with known backgrounds may be helpful in addressing these questions further.
The hunter-gatherer calcaneus also differs from that of the other populations in unique articular facet morphologies. The posterior talar facet is relatively mediolaterally wider, which likely serves to increase contact area with the talus, thus providing a potentially larger surface to distribute loads through the subtalar joint. A relatively wider surface may serve to reduce stress and strain and resist potentially higher forces (e.g., Jungers, 1988; Ruff, 1988) associated with their likely higher activity level as a consequence of their subsistence strategy. This is consistent with variations in posterior talar facet morphology among nonhuman primates, as more terrestrial nonhuman hominoids exhibit relatively broader posterior talar facet morphologies than their more arboreal counterparts, which has been suggested to potentially be important for subtalar joint congruence in plantigrade primates (Gebo, 1992; Prang, 2016; Harper et al., 2022b). The hunter-gatherer calcaneus is additionally characterized by a more posteriorly angled, and thus differently positioned, cuboid facet relative to the rest of the calcaneus than the other populations. A relatively posteriorly angled (i.e., the medial aspect of the cuboid facet is more posteriorly positioned than the lateral border) cuboid facet is characteristic of the human calcaneus, compared to that of nonhuman apes, and has been suggested to facilitate a tight-packed position for the calcaneocuboid joint and the transformation of the foot into a rigid lever during toe-off (Bojsen-Moller, 1979; Harper et al., 2021a). It is possible that a more extreme angle may be necessary to achieve functional equivalence at the joint in a habitually unshod, highly active population. It may also indicate that the overall configuration of hunter-gatherer foot may differ slightly in the relative positioning of bones, or in soft tissue/arch height, then in more recent populations. Sorrentino and colleagues (2020) found that the hunter-gatherer foot (although they investigated different hunter-gatherer populations then studied here) was likely more everted while standing and walking based on talar morphology, and it is possible that this may be further facilitated by the calcaneocuboid joint positioning observed here. An examination of the morphology of other foot bones, such as the cuboid, in the present study hunter-gatherer population may help to shed light on this question.
Although more recent sedentary modern humans have a relatively more gracile calcaneus overall, their calcanei are absolutely larger (based on CS) than the more robust non-sedentary calcanei. Their larger calcanei are likely due to increases in body size, which is supported by the positively allometric scaling of calcaneal CS relative to estimated body mass. Relatively larger humans likely necessitate a grossly larger calcaneus to support their body mass, as full body weight (or multiples of body weight depending on activity and gait cycle phase) is transmitted through the calcaneus as a consequence of bipedalism (Chen and Bates, 2000; Jönsson et al., 2019). Sedentary groups (particularly the calcanei of those individuals from the mid-20th century-born industrialized population) are thus characterized by a relatively anteroposteriorly longer, mediolaterally narrower, and overall larger calcaneus than their non-sedentary counterparts, which is consistent with findings that anteroposterior calcaneus length scales to estimated body mass with positive allometry among humans (Harper et al., 2022b).
In conclusion, human calcaneal morphology varies among non-sedentary hunter-gatherer and sedentary industrialized populations with respect to likely differences in activity level, footwear use, and subsistence strategy, likely due to its roles in weight-bearing and heel strike during locomotion. These results add to our growing understanding of the potentially plastic relationships between foot morphology and environment/behavior (e.g., Trinkaus, 2005; Zipfel and Berger, 2007; Sorrentino et al., 2020; DeMars et al., 2021; Albee, 2022), as well as those that exist among postcranial morphology more broadly (e.g., Ruff et al., 1993; Chirchir et al., 2015; Saers et al., 2016; Chirchir et al., 2017; Ruff et al., 2018). The consistent patterns seen across skeletal elements with differences in activity level in humans (and with those seen in more terrestrial nonhuman primate calcanei, e.g., Prang, 2015; Harper et al., 2021a; Harper et al., 2021b) demonstrates the utility of these metrics for reconstructing early hominin activity levels. Understanding the changes to calcaneal morphology (as well as those that potentially exist throughout the foot) seen here in recent sedentary groups may also be of importance in clinical settings for the treatment and management of foot pathologies. Future investigations of other pedal skeletal elements among human populations that vary in activity level, subsistence strategy, and footwear use will provide a more nuanced appreciation of these relationships and a more complete picture of how entire foot morphology varies with different behaviors.
Data availability statement
The raw data supporting the conclusion of this article will be made available by the author, dependent on collections policies.
Author contributions
CH designed the study, collected data, analyzed results, wrote, and edited the manuscript. All authors contributed to the article and approved the submitted version.
Funding
This project was supported by NSF grant BCS-1824630.
Acknowledgments
I would like to thank Dave Hunt at the National Museum of Natural History (Washington, D.C.), Wendy Black, Wilhelmina Seconna, and the Human Remains Advisory Committee at the Iziko Museums for South Africa (Cape Town, South Africa), and Daniel Wescott and Deborah Cunningham, as well as the donors and their next of kin, at Texas State University (San Marcos, TX) for access to skeletal material. For assistance with micro-CT scanning, I would like to thank Anton du Plessis, Stephan le Roux, and Muofhe Tshibalangand at the Stellenbosch University CT Facility and Deborah Cunningham and Devora Gleiber at the Forensic Anthropology Center at Texas State University. I would also like to thank Christopher B. Ruff, Adam D. Sylvester, and Deanna M. Goldstein for helpful feedback and conversations. I am also grateful to Rita Sorrentino and the two reviewers for their helpful comments on the manuscript.
Conflict of interest
The author declares that the research was conducted in the absence of any commercial or financial relationships that could be construed as a potential conflict of interest.
Publisher’s note
All claims expressed in this article are solely those of the authors and do not necessarily represent those of their affiliated organizations, or those of the publisher, the editors and the reviewers. Any product that may be evaluated in this article, or claim that may be made by its manufacturer, is not guaranteed or endorsed by the publisher.
Supplementary material
The Supplementary Material for this article can be found online at: https://www.frontiersin.org/articles/10.3389/feart.2023.1213374/full#supplementary-material
References
Adams, D. C., and Collyer, M. L. (2016). On the comparison of the strength of morphological integration across morphometric datasets. Evolution 70, 2623–2631. doi:10.1111/evo.13045
Adams, D. C., and Otárola-Castillo, E. (2013). geomorph: an r package for the collection and analysis of geometric morphometric shape data. Methods Ecol. Evol. 4, 393–399. doi:10.1111/2041-210X.12035
Albee, M. E. (2022). Tarsal metric trends over the Medieval-Post-Medieval transition in. London: HOMO. doi:10.1127/homo/2022/1551
Barnett, C. H. (1962). The normal orientation of the human hallux and the effect of footwear. J. Anat. 96, 489–494.
Biewener, A. A. (1989). Scaling body support in mammals: Limb posture and muscle mechanics. Science 245, 45–48. doi:10.1126/science.2740914
Bojsen-Møller, F. (1979). Calcaneocuboid joint and stability of the longitudinal arch of the foot at high and low gear push off. J. Anat. 129, 165–176.
Bookstein, F. L. (1997). Landmark methods for forms without landmarks: Morphometrics of group differences in outline shape. Med. Image Anal. 1, 225–243. doi:10.1016/S1361-8415(97)85012-8
Bookstein, F. L. (1991). Morphometric tools for landmark data: Geometry and biology. Cambridge: Cambridge University Press.
Boyer, D. M., Seiffert, E. R., Gladman, J. T., and Bloch, J. I. (2013). Evolution and allometry of calcaneal elongation in living and extinct primates. PLOS ONE 8, 67792. doi:10.1371/journal.pone.0067792
Boyle, E. K., McNutt, E. J., Sasaki, T., Suwa, G., Zipfel, B., and DeSilva, J. M. (2018). A quantification of calcaneal lateral plantar process position with implications for bipedal locomotion in Australopithecus. J. Hum. Evol. 123, 24–34. doi:10.1016/j.jhevol.2018.05.008
Brownson, R. C., Boehmer, T. K., and Luke, D. A. (2005). Declining rates of physical activity in the United States: What are the contributors? Annu. Rev. Public Health 26, 421–443. doi:10.1146/annurev.publhealth.26.021304.144437
Buikstra, J. E., and Ubelaker, D. H. (1994). Standards for data collection from human skeletal remains. Fayetteville: Arkansas Archaeological Society.
Burnfield, J. M., Few, C. D., Mohamed, O. S., and Perry, J. (2004). The influence of walking speed and footwear on plantar pressures in older adults. Clin. Biomech. 19, 78–84. doi:10.1016/j.clinbiomech.2003.09.007
Chen, B., and Bates, B. T. (2000). Comparison of F-scan in-sole and AMTI forceplate system in measuring vertical ground reaction force during gait. Physiother Theory Pract. 16, 43–53. doi:10.1080/095939800307601
Chirchir, H., Kivell, T. L., Ruff, C. B., Hublin, J. J., Carlson, K. J., Zipfel, B., et al. (2015). Recent origin of low trabecular bone density in modern humans. PNAS 112, 366–371. doi:10.1073/pnas.1411696112
Chirchir, H., Ruff, C. B., Junno, J. A., and Potts, R. (2017). Low trabecular bone density in recent sedentary modern humans. Am. J. Phys. Anthropol. 162, 23138–e23560. doi:10.1002/ajpa.23138
Clark, W. E. L. G. (1947). Observations on the anatomy of the fossil Australopithecinae. J. Anat. 81, 300–333.
Collyer, M. L., Sekora, D. J., and Adams, D. C. (2015). A method for analysis of phenotypic change for phenotypes described by high-dimensional data. Heredity 115, 357–365. doi:10.1038/hdy.2014.75
DeMars, L. J. D., Stephens, N. B., Saers, J. P. P., Gordon, A., Stock, J. T., and Ryan, T. M. (2021). Using point clouds to investigate the relationship between trabecular bone phenotype and behavior: An example utilizing the human calcaneus. Am. J. Hum. Biol. 33, 23468. doi:10.1002/ajhb.23468
DeSilva, J., McNutt, E., Benoit, J., and Zipfel, B. (2019). One small step: A review of plio-pleistocene hominin foot evolution. Am. J. Phys. Anthropol. 168, 63–140. doi:10.1002/ajpa.23750
Drapeau, M. S. M., and Forgues-Marceau, J. (2019). Metatarsal torsion in humans and footwear type. Int. J. Osteoarchaeol. 29, 718–727. doi:10.1002/oa.2771
Gebo, D. L. (1992). Plantigrady and foot adaptation in African apes: Implications for hominid origins. Am. J. Phys. Anthropol. 89, 29–58. doi:10.1002/ajpa.1330890105
Gierse, H. (1976). The cancellous structure in the calcaneus and its relation to mechanical stressing. Anat. Embryol. 150, 63–83. doi:10.1007/BF00346287
Gill, C. M., Taneja, A. K., Bredella, M. A., Torriani, M., and DeSilva, J. M. (2014). Osteogenic relationship between the lateral plantar process and the peroneal tubercle in the human calcaneus. J. Anat. 224, 173–179. doi:10.1111/joa.12135
Gocha, T. P., Mavroudas, S. R., and Wescott, D. J. (2022). The Texas state donated skeletal collection at the forensic Anthropology center at Texas state. Forensic Sci. 2, 7–19. doi:10.3390/forensicsci2010002
Goodall, C. (1991). Procrustes methods in the statistical analysis of shape. J. R. Stat. Soc. 53, 285–321. doi:10.1111/j.2517-6161.1991.tb01825.x
Gower, J. C. (1975). Generalized procrustes analysis. Psychometrika 40, 33–51. doi:10.1007/BF02291478
Gunz, P., Mitteroecker, P., and Bookstein, F. L. (2005). “Semilandmarks in three dimensions,” in Modern morphometrics in physical anthropology. Editor D. E. Slice (New York: Springer), 73–98.
Harcourt-Smith, W. E. H., and Aiello, L. C. (2004). Fossils, feet and the evolution of human bipedal locomotion. J. Anat. 204, 403–416. doi:10.1111/j.0021-8782.2004.00296.x
Harcourt-Smith, W. E. H., Throckmorton, Z., Congdon, K. A., Zipfel, B., Deane, A. S., Drapeau, M. S. M., et al. (2015). The foot of Homo naledi. Nat. Commun. 6, 8432. doi:10.1038/ncomms9432
Harper, C. M., Goldstein, D. M., and Sylvester, A. D. (2022a). Comparing and combining sliding semilandmarks and weighted spherical harmonics for shape analysis. J. Anat. 240, 678–687. doi:10.1111/joa.13589
Harper, C. M., Ruff, C. B., and Sylvester, A. D. (2021a). Calcaneal shape variation in humans, nonhuman primates, and early hominins. J. Hum. Evol. 159, 103050. doi:10.1016/j.jhevol.2021.103050
Harper, C. M., Ruff, C. B., and Sylvester, A. D. (2021b). Gorilla calcaneal morphological variation and ecological divergence. Am. J. Phys. Anthropol. 174, 49–65. doi:10.1002/ajpa.24135
Harper, C. M., Ruff, C. B., and Sylvester, A. D. (2022b). Scaling and relative size of the human, nonhuman ape, and baboon calcaneus. Anatomical Rec. 305, 100–122. doi:10.1002/ar.24642
Harper, C. M., Zipfel, B., DeSilva, J. M., McNutt, E. J., Thackeray, F., and Braga, J. (2022c). A new early hominin calcaneus from Kromdraai (South Africa). J. Anat. 241, 500–517. doi:10.1111/joa.13660
Heiple, K. G., and Lovejoy, C. O. (1971). The distal femoral anatomy of Australopithecus. Am. J. Phys. Anthropol. 35, 75–84. doi:10.1002/ajpa.1330350109
Hill, J. O., Wyatt, H. R., Reed, G. W., and Peters, J. C. (2003). Obesity and the environment: Where do we go from here? Science 299, 853–855. doi:10.1126/science.1079857
Hunt, D. R., and Albanese, J. (2005). History and demographic composition of the Robert J. Terry anatomical collection. Am. J. Phys. Anthropol. 127, 406–417. doi:10.1002/ajpa.20135
Jönsson, M., Munkhammar, T., Norrbrand, L., and Berg, H. E. (2019). Foot centre of pressure and ground reaction force during quadriceps resistance exercises; a comparison between force plates and a pressure insole system. J. Biomechanics 87, 206–210. doi:10.1016/j.jbiomech.2019.03.004
Jungers, W. L. (1998). Relative joint size and hominoid locomotor adaptations with implications for the evolution of hominid bipedalism. J. Hum. Evol. 17, 247–265. doi:10.1016/0047-2484(88)90056-5
Latimer, B., and Lovejoy, C. O. (1989). The calcaneus of Australopithecus afarensis and its implications for the evolution of bipedality. Am. J. Phys. Anthropol. 78, 369–386. doi:10.1002/ajpa.1330780306
Mays, S. A. (2005). Paleopathological study of hallux valgus. Am. J. Phys. Anthropol. 126 (2), 139–149. doi:10.1002/ajpa.20114
McHenry, H. M. (1978). Fore- and hindlimb proportions in Plio-Pleistocene hominids. Am. J. Phys. Anthropol. 49, 15–22. doi:10.1002/ajpa.1330490104
McNutt, E. J., Zipfel, B., and DeSilva, J. M. (2018). The evolution of the human foot. Evol. Anthropol. Issues, News, Rev. 27, 197–217. doi:10.1002/evan.21713
Mitteroecker, P., Gunz, P., Bernhard, M., Schaefer, K., and Bookstein, F. L. (2004). Comparison of cranial ontogenetic trajectories among great apes and humans. J. Hum. Evol. 46, 679–698. doi:10.1016/j.jhevol.2004.03.006
Novacheck, T. F. (1998). The biomechanics of running. Gait Posture 7, 77–95. doi:10.1016/S0966-6362(97)00038-6
Owen, N., Sparling, P. B., Healy, G. N., Dunstan, D. W., and Matthews, C. E. (2010). Sedentary behavior: Emerging evidence for a new health risk. Mayo Clin. Proc. 85, 1138–1141. doi:10.4065/mcp.2010.0444
Pablos, A., Gómez-Olivencia, A., Maureille, B., Holliday, T. W., Madelaine, S., Trinkaus, E., et al. (2019). Neandertal foot remains from regourdou 1 (Montignac-sur-Vézère, dordogne, France). J. Hum. Evol. 128, 17–44. doi:10.1016/j.jhevol.2018.11.003
Pablos, A., Martínez, I., Lorenzo, C., Sala, N., Gracia-Téllez, A., and Arsuaga, J. L. (2014). Human calcanei from the Middle Pleistocene site of Sima de los Huesos (Sierra de Atapuerca, Burgos, Spain). J. Hum. Evol. 76, 63–76. doi:10.1016/j.jhevol.2014.05.005
Pfeiffer, S. (2013). “Population dynamics in the South African holocene: Human burials from the west coast,” in The archaeology of the west coast of South Africa (Oxford: Archaeopress), 143–154.
Prang, T. C. (2015). Calcaneal robusticity in Plio-Pleistocene hominins: Implications for locomotor diversity and phylogeny. J. Hum. Evol. 80, 135–146. doi:10.1016/j.jhevol.2014.09.001
Prang, T. C. (2016). Conarticular congruence of the hominoid subtalar joint complex with implications for joint function in Plio-Pleistocene hominins. Am. J. Phys. Anthropol. 160, 446–457. doi:10.1002/ajpa.22982
R Core Team (2013). R: A language and environment for statistical computing. Vienna, Austria: R Foundation for Statistical Computing.
Raichlen, D. A., Armstrong, H., and Lieberman, D. E. (2011). Calcaneus length determines running economy: Implications for endurance running performance in modern humans and Neandertals. J. Hum. Evol. 60, 299–308. doi:10.1016/j.jhevol.2010.11.002
Rohlf, F. J., and Slice, D. (1990). Extensions of the Procrustes method for the optimal superimposition of landmarks. Syst. Zool. 39, 40–59. doi:10.2307/2992207
Rosenberg, K., and Trevathan, W. (2002). Birth, obstetrics and human evolution. BJOG Int. J. Obstetrics Gynaecol. 109, 1199–1206. doi:10.1046/j.1471-0528.2002.00010.x
Ruff, C. B., Burgess, M. L., Squyres, N., Junno, J. A., and Trinkaus, E. (2018). Lower limb articular scaling and body mass estimation in Pliocene and Pleistocene hominins. J. Hum. Evol. 115, 85–111. doi:10.1016/j.jhevol.2017.10.014
Ruff, C. B., Trinkaus, E., Walker, A., and Larsen, C. S. (1993). Postcranial robusticity in Homo. I: Temporal trends and mechanical interpretation. Am. J. Phys. Anthropol. 91, 21–53. doi:10.1002/ajpa.1330910103
Ruff, C. (1988). Hindlimb articular surface allometry in hominoidea and Macaca, with comparisons to diaphyseal scaling. J. Hum. Evol. 17, 687–714. doi:10.1016/0047-2484(88)90025-5
Saers, J. P. P., Cazorla-Bak, Y., Shaw, C. N., Stock, J. T., and Ryan, T. M. (2016). Trabecular bone structural variation throughout the human lower limb. J. Hum. Evol. 97, 97–108. doi:10.1016/j.jhevol.2016.05.012
Sokal, R. R., and Rohlf, F. J. (1998). Biometry: The principles and practice of statistics in biological research. third edition. New York: W.H. Freeman and Company.
Sorrentino, R., Stephens, N. B., Carlson, K. J., Figus, C., Fiorenza, L., Frost, S., et al. (2020). The influence of mobility strategy on the modern human talus. Am. J. Phys. Anthropol. 171, 456–469. doi:10.1002/ajpa.23976
Stern, J. T., and Susman, R. L. (1983). The locomotor anatomy of Australopithecus afarensis. Am. J. Phys. Anthropol. 60, 279–317. doi:10.1002/ajpa.1330600302
Su, S. C., Skedros, J. G., Bachus, K. N., and Bloebaum, R. D. (1999). Loading conditions and cortical bone construction of an artiodactyl calcaneus. J. Exp. Biol. 202, 3239–3254. doi:10.1242/jeb.202.22.3239
Subotnick, S. I., King, C., Vartivarian, M., and Klaisri, C. (2010). “Evolution of athleticfootwear,” in Athletic footwear and orthoses in sports. Editors M. B. Werd, and E. L. Knight (New York: Springer), 3–18.
Swartz, S. M., and Biewener, A. A. (1992). “Shape and scaling,” in Biomechanics – structures and systems: A practical approach. Editor A. A. Biewener (Oxford: Oxford University Press), 21–30.
Tardieu, C., and Trinkaus, E. (1994). Early ontogeny of the human femoral bicondylar angle. Am. J. Phys. Anthropol. 95, 183–195. doi:10.1002/ajpa.1330950206
Trinkaus, E. (2005). Anatomical evidence for the antiquity of human footwear use. J. Archaeol. Sci. 32, 1515–1526. doi:10.1016/j.jas.2005.04.006
Trinkaus, E., Buzhilova, A. P., Mednikova, M. B., and Dobrovolskaya, M. V. (2014). The people of Sunghir: Burials, bodies, and beahvior in the earlier Upper Paleolithic. Oxford: Oxford University Press.
Walmsley, T. (1933). The vertical axes of the femur and their relations. A contribution to the study of the erect position. J. Anat. 67, 284–300.
Ward, C. V. (2002). Interpreting the posture and locomotion of Australopithecus afarensis: Where do we stand? Am. J. Phys. Anthropol. 119, 185–215. doi:10.1002/ajpa.10185
Zelditch, A., Swiderski, D. L., and Sheets, H. D. (2012). Geometric morphometrics for biologists: A primer. London: Elsevier.
Keywords: foot, ankle, geometric morphometrics, bipedalism, foraging
Citation: Harper CM (2023) Human calcaneal variation relative to subsistence strategy, activity level, and footwear. Front. Earth Sci. 11:1213374. doi: 10.3389/feart.2023.1213374
Received: 27 April 2023; Accepted: 13 June 2023;
Published: 26 June 2023.
Edited by:
Rita Sorrentino, University of Bologna, ItalyCopyright © 2023 Harper. This is an open-access article distributed under the terms of the Creative Commons Attribution License (CC BY). The use, distribution or reproduction in other forums is permitted, provided the original author(s) and the copyright owner(s) are credited and that the original publication in this journal is cited, in accordance with accepted academic practice. No use, distribution or reproduction is permitted which does not comply with these terms.
*Correspondence: Christine M. Harper, aGFycGVyY0Byb3dhbi5lZHU=