 Cong-Nghia Nguyen1,2,3
 Bor-Shouh Huang2*
 Tung-Yi Lee4
 Po-Fei Chen3
 Van Duong Nguyen5,6
 Ishmael Narag7Bartolome C. Bautista7Arnaldo Melosantos7
- 1Taiwan International Graduate Program (TIGP)—Earth System Science Program, Academia Sinica and National Central University, Taipei, Taiwan
- 2Institute of Earth Sciences, Academia Sinica, Taipei, Taiwan
- 3Department of Earth Sciences, National Central University, Taoyuan, Taiwan
- 4Department of Earth Sciences, National Taiwan Normal University, Taipei, Taiwan
- 5Graduate University of Science and Technology (GUST), Vietnam Academy of Science and Technology, Hanoi, Vietnam
- 6Institute of Geophysics, Vietnam Academy of Science and Technology, Hanoi, Vietnam
- 7Department of Science and Technology, Philippine Institute of Volcanology and Seismology, Quezon City, Philippines
Luzon Island is a complex setting of seismicity and magmatism caused by the subduction of the South China Sea lithosphere and the presence of a major strike-slip fault system, the Philippine Fault. Previous studies of the structure of this subduction zone have suggested that a ridge subduction system resulted in a slab tearing along the ridge. On the other hand, the Philippine Fault plays an important role in understanding how major strike-slip faults deform and displace at a continental scale. To constrain the lithospheric geological structure in the area and refine the slab tearing model, we performed a P- and S-wave seismic tomography travel time inversion using local earthquakes. The dataset has been combined from seismic phases reported by the International Seismological Centre and new pickings from six broadband seismic stations in northern Luzon. The three-dimensional P- and S-wave velocity models in Luzon Island were analyzed by applying the LOTOS package with a one-dimensional velocity model obtained from the VELEST program. Our tomographic images indicate contrasting velocity structures across the Philippine Fault to a depth of 60 km. Therefore, we suggest that the Philippine Fault might be a lithospheric structure that displaces both the crust and the upper mantle. The results also indicate regions of low-velocity slab windows from a depth of 40 km, which are interpreted as the sites of slab tearing. Compared with focal mechanisms and earthquake occurrence in this region, we propose that slab tearing extends from the fossil ridge and creates regional kinematic perturbations. The tearing produces shallow upwelling magma to stay in the chambers beneath the crust, which is in contrast to the magmatic system observed in other regions.
1 Introduction
Subduction zones are the most active tectonic boundaries on Earth’s surface, showing great variations of volcanism, earthquakes, arc curvatures, and slab properties (Ruff and Kanamori, 1980; Stern, 2002; Hayes et al., 2018). In some subduction zones, the nature of the subduction process is modified by preexisting fossil ridges, which were spreading centers before subduction (Vogt, 1973; Rosenbaum and Mo, 2011). One of the most controversial characteristics of these structures is the different behaviors of magmatism due to the interaction between the subducting slab, the mantle wedge, and the subducting ridge (Tatsumi, 1989). In some fossil ridge subduction zones, the cessation of volcanism appears and develops a volcanic gap zone. The Nazca and Juan Fernández Ridges were considered examples of volcanic gaps formed by the consumption of fossil ridges possibly by causing a flat slab event (Nur and Benavraham, 1983; Bertin et al., 2022); however, recent studies suggest that the passage of the Juan Fernández might cause a large scale eruption in the future (Bertin et al., 2022). In contrast, volcanism might be enhanced as a result of ridge subduction in some places where slab tearing occurs. A typical example is the enhanced volcanism of the Aleutian Ridges by the formation of a slab window beneath Kamchatka (Levin et al., 2002). The different behaviors of the volcanic systems related to ridge subduction might be explained by the different tectonic responses in each particular region, for example,: flattening of slab dip, subduction rollback, and formation of slab windows (Rosenbaum and Mo, 2011).
The Luzon island arc is a region in which the South China Sea oceanic lithosphere has been consumed along the Manila Trench since the Miocene (Defant et al., 1989). As a result, a system of active earthquakes and volcanoes is well developed (Figure 1A). Compared to other ridge subduction systems in the world, the South China Sea ridge subduction system has been less studied to date. The ridge subduction of the South China Sea along the Manila Trench was first proposed based on the distribution and characteristics of two magmatic systems in North Luzon: the active east volcanic chain and the extinct west volcanic chain (Yang et al., 1996). Further investigation of earthquake distribution and focal mechanism data suggests a change in dip angles of the slab caused by the subduction of an extinct spreading ridge—the Scarborough seamount accreted at North Luzon at 16oN (Bautista et al., 2001; Armada et al., 2020), which is consistent with a change in slab deep angle between latitude 16oN and 17oN observed from earthquake occurrences and the slab model (cross sections BB’ and CC’ in Figure 1B). Seismic tomographic studies in this region also support the slab tearing model by imaging the large-scale slab geometry and slab window using P-wave travel time seismic tomography (Fan et al., 2015; Fan et al., 2016). The global P-wave seismic tomography also shows possible images of the slab windows at a depth of less than 100 km at latitude 16oN to 18oN (cross sections AA’, BB’ and CC’ in Figure 1B). These studies have provided evidence for a discontinuity of the slab at depths deeper than 100 km at the extension of the fossil ridge. However, the shallow structure at a local scale, particularly the S-wave velocity in the Luzon island, has not been well constrained.
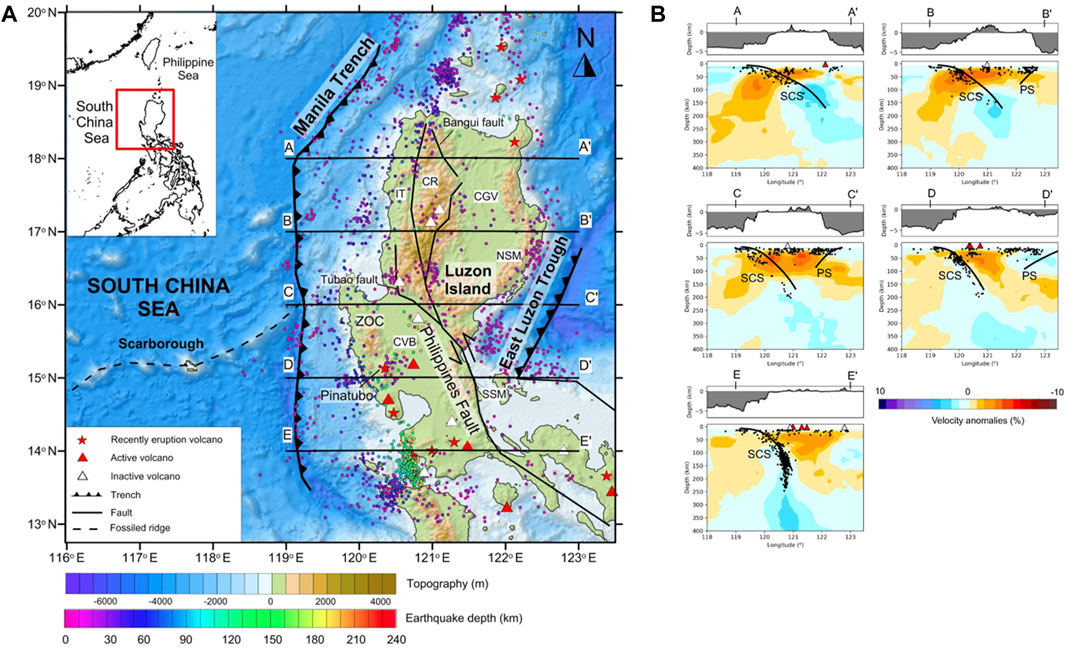
FIGURE 1. (A) Tectonic map of Luzon Island and the surrounding areas. The saw-toothed lines denote trench axes of subduction zones and solid lines denote faults. White triangles denote volacano unrest, red triangles denote active volcanoes, and red stars denote volcanoes with recorded eruptions. The locations of the trenches are modified from Bautista et al. (2001). The bathymetric and topographic data are from Smith and Sandwell (1997), and the location and activities of volcanoes are from Venzke et al. (2002). CVB: Central Valley Basin; CR: Central Cordillera Range; CGV: Cagayan Valley Basin; IT: Ilocos Trough; NSM: North Sierra Madre; SSM: South Sierra Madre; ZOC: Zambales Ophiolite Complex. (B) Earthquake distribution from the EHB catalog (Engdahl et al., 1998) in the selected profiles in (A) and the P-wave teleseismic tomography model from model UU-P07 (Amaru, 2007). Black lines indicate the surface of the subducting slab with depths from the Slab2 database (Hayes et al., 2018). SCS: South China Sea slab; PS: Philippines Sea slab.
Meanwhile, most previous studies on volcanic systems used geochemical methods to identify the characteristics of lavas and magmatic rocks in the region (Defant et al., 1989; Yumul et al., 2000; Castillo and Newhall, 2004; Jego et al., 2005; Hollings et al., 2011). However, despite various studies in the region, the connection between the ridge subduction structure and volcanic activities is not well resolved.
Another major question is the tectonic role of the Philippine Fault in this area. The Philippine Fault is a major left-lateral strike-slip fault that cuts along the whole Philippine Archipelago and extends from Mindanao to northern Luzon (Barrier et al., 1991; Aurelio, 2000). Previous studies were mostly focused on the present slip and stress regime at the crustal level of the fault (Barrier et al., 1991; Aurelio et al., 1997; Aurelio, 2000; Yu et al., 2013; Hsu et al., 2016), while very few studies have discussed the depth of the fault cut through, which is an important tectonic question considering the massive length of the Philippine Fault.
In this study, we performed a simultaneous P- and S-wave seismic tomography of the crust and upper mantle of Luzon Island from local earthquakes to obtain high-resolution tomographic images of subsurface structures. By using both P- and S-wave velocity models, we obtained independent results, which provided reliable evidence for the same structures. The tomographic results also verified the slab tearing caused by the ridge subduction of the South China Sea and identified the sources of regional magmatism. Based on those findings, we constrained the lithospheric geological structure in the area and refined the slab tearing model. We also observed considerable velocity contrasts at both crustal and upper mantle levels across the Philippine Fault to a depth of 60 km. This allowed us to estimate the depth of the Philippine Fault, which may have cut through the crust and reached the upper mantle.
2 Tectonic settings
Luzon Island is part of the Philippines islands and is made up of assemblages of active and inactive terranes, metamorphosed rocks, sedimentary basins, and ophiolite complexes (Lee and Lawver, 1994). Luzon Island is governed by two subduction zone systems: the South China Sea subduction in the west along the Manila Trench and the Philippines Sea subduction in the east along the East Luzon Trough (Figure 1A). While the depths of earthquakes in the East Luzon Trough are rather shallow, up to 80 km (Defant et al., 1989), a well-defined Wadati—Benioff zone deeper than 200 km was used to construct the geometry of the subducting slab along the Manila Trench (Bautista et al., 2001; Hsu et al., 2012) (Figure 1B). The Scarborough seamount chain is identified as the result of post spreading volcanism in the time period of 13–3 Ma and marked the extinct mid-ocean ridge (Hung et al., 2021). The subduction of this fossil ridge has been proposed to cause a slab tear, evidenced by the change in the South China Sea slab angle (Bautista et al., 2001; Fan et al., 2015). However, the exact location of the slab tear is not well constrained, despite a detailed analysis of the earthquake location that revealed a change in the South China Sea slab angle at approximately 16oN within a depth of 200 km (Bautista et al., 2001), and the P-wave tomographic model showed a significant change in the slab angle at 17oN—17.5oN in a much deeper depth (from 200 km to 700 km) (Fan et al., 2015).
Located between the aforementioned two opposite subduction zones is the major 1300-km left lateral Philippine Fault (Figure 1A). The Philippine Fault is considered a trench-linked strike-slip fault behind a subduction zone—the Philippines Trench, particularly the East Luzon Trough in the North Luzon area, as a consequence of oblique subduction (Fitch, 1972; Aurelio, 2000). In this model, the fault accommodates the parallel convergence of oblique subduction while the perpendicular motion is absorbed along the East Luzon Trough. In the Luzon region, the Philippine Fault has been interpreted as the tectonic boundary separating the Zambales-Angat ophiolites from the Northern Luzon volcanic and Eastern Luzon metamorphic belt (Karig, 1983; Karig et al., 1986). Moreover, the fault is also considered to be the boundary between the preserved remnants of the proto-South China Sea and the proto-Philippine Sea Plate (Yumul et al., 2020). These studies suggest that the Philippines Fault can also be considered as a tectonic boundary separating multiple terranes that made up Luzon Island.
Volcanoes and magmatic systems are well developed on Luzon Island, which is interpreted to be related to the east-dipping subduction along the Manila Trench (Defant et al., 1989), while the slab in the East Luzon Trough is too shallow to generate melts (Hamburger et al., 1983). Intense volcanic eruptions have been observed in the area, most notably the 1991 Pinatubo eruption (Bluth et al., 1992) (location in Figure 1A). The active volcanoes are located in the north and south of Luzon Island (approximately 13oN to 15oN and from 18oN to 20oN), while in the central Luzon region, most of the volcanoes are inactive (Figure 1A) (Venzke et al., 2002).
3 Data and method
3.1 P- and S-wave travel time data
The data used in this study are the P- and S-wave arrival times of regional earthquakes compiled from different sets of data, such as from the International Seismology Centre Bulletin (ISC) from 2000 to 2016 (86 stations) and the six broadband stations operated by the cooperation of the Philippine Institute of Volcanology and Seismology (PHIVOLCS) and Institute of Earth Sciences (IES), Academia Sinica from 2014 to 2016 (Figure 2). The locations and periods of the PHIVOLCS - IES stations are listed in the Supplementary Material (Supplementary Table S1). The events were selected within a maximum distance of 8o from a chosen center point of Luzon island (121oN, 16.5oE) with all depths and magnitudes. The data from the ISC bulletin are the first P- and S-wave arrival times of these earthquakes recorded from stations in Luzon Island and the Taiwan region. We handpicked the first P- and S-wave arrival times from the PHIVOLCS-IES station waveform and then calculated the travel times for each event-station pair. These readings obtained from broadband stations were used to improve the quality of the travel time database, especially the S-wave readings. The two databases were then combined to have a total of 92,950 P-wave readings and 49,087 S-wave readings from 21,134 events.
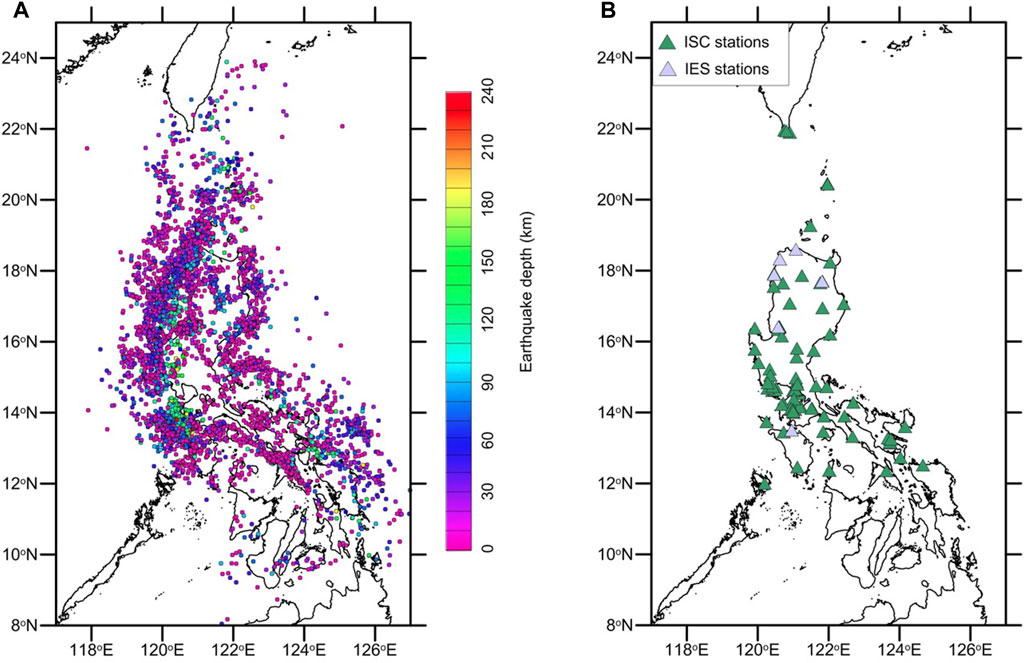
FIGURE 2. Distribution of (A) earthquake events and (B) seismic stations used in this study. The green triangles indicate stations in the ISC catalog, purple triangles indicate stations of the PHIVOLCS-IES network, and circles indicate earthquakes with colors indicating depth.
The ISC catalog data set is large but may contain data errors and poor-quality source locations (Koulakov, 2013). To improve the quality of the data set, we filtered the data using two criteria, namely, choosing only readings with a maximum of 2.0 s of travel time residual and a minimum of eight readings for each event to improve the quality of source relocation. The filtering resulted in a significant reduction of readings and events from the database. The final seismic tomography input included 40,163 P-wave readings and 20,328 S-wave readings from 4,926 events in which there were 1,389 P-wave readings and 1,287 S-wave readings from the PHIVOLCS-IES network, which accounted for 3.13% of the total P-wave readings and 5.75% of the total S-wave readings. The average P- and S-wave readings for each event were 8.15 and 4.12 readings, respectively. These P- and S-wave traveltimes were used to constrain the velocity structure and seismicity distribution of earthquakes in the region. The P-wave and S-wave ray paths of the source receivers are shown in Supplementary Figure S1, S2 for each horizontal section, respectively. The abundance of seismicity from the two subduction zones with a wide range of depths resulted in good coverage of crosscut ray paths. From the coverage of the ray path, we expect the models to be best estimated for the inland region of Luzon Island.
The workflow of this study included: 1) an 1D reference velocity model inversion using the program VELEST (Kissling et al., 1994), and 2) determining the three-dimensional (3D) P- and S-wave velocity models using the Local Tomography Software (LOTOS) (Koulakov, 2009). The results and quality of these velocity structures are herein justified and discussed.
3.2 1D velocity model
In a local tomographic inversion, an appropriate one-dimensional reference velocity model is required and is used as an input for the inversion (Kissling et al., 1994). To define a reliable one-dimensional P-wave velocity model, the VELEST program (Kissling et al., 1994), we first located the earthquake using Hypoinverse (Klein, 2002) to get the maximum azimuthal gap (GAP) and initial travel time residual of each event. We then selected events with GAP <180o and travel time residual <1.0s, which resulted in 526 events. To obtain the best estimation of the average velocity model and test its stability, we used 250 starting P-wave velocity models, in which variations in velocity and depth were added from the base velocity model of CRUST 1.0 (Laske et al., 2013) in the center of the Luzon region. The inversion results in a convergence of the output velocity models from a wide range of inputs, indicating a stable one-dimensional (1D) velocity model for the local structure. Figure 3A shows the results of VELEST inversion, in which the grey velocity models are the result of the inversion while the blue indicates the lowest root-mean-square (rms) travel time residual of 0.751 s. In the study area, various 1D velocity models have been obtained from previous studies including a mantle and transition zone seismic velocity model between the Philippines—Taiwan region (Wright and Kuo, 2007), a velocity model for earthquake relocation of Batangas earthquake sequences (Chen et al., 2020), and a velocity model of the Taal volcano (You et al., 2013). We chose the lowest rms model as the starting input for the tomographic inversion and describe the model in Table 1. Compared to these models, our chosen velocity model is most similar to the CRUST 1.0 model and the model from Wright and Kuo (2007), which represents the regional velocity structure. Furthermore, we calculated the Vp/Vs. ratio of each event using the Wadati plot (Wadati and Oki, 1933) for all the abovementioned events used in VELEST. After that, we took the average Vp/Vs. ratios of these events to get a final Vp/Vs. ratio of 1.73 (Figure 3B). Both the P-wave velocity model and the Vp/Vs. ratio were used as inputs in the LOTOS package to obtain the tomographic inversion.
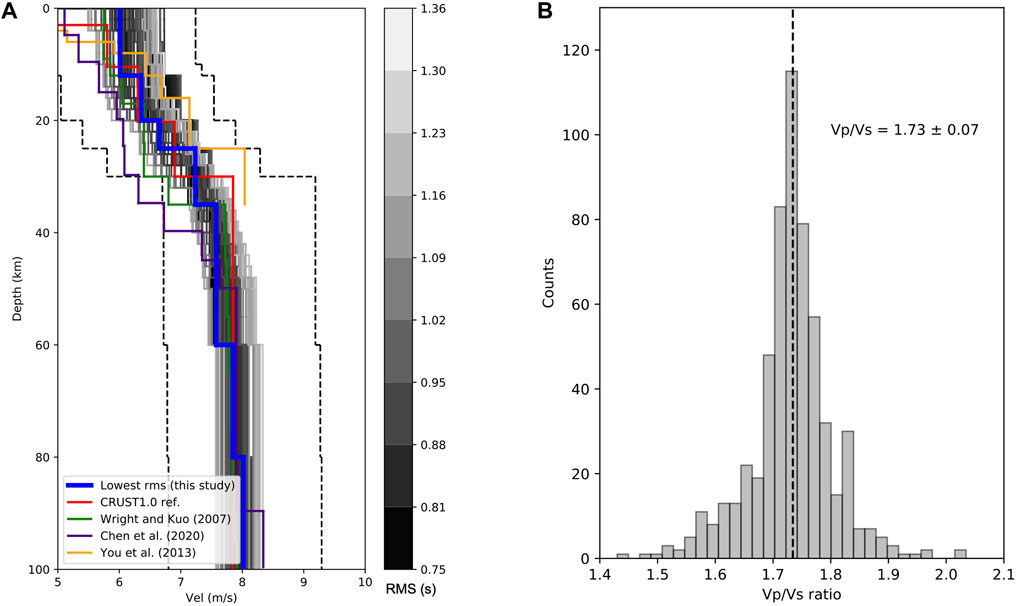
FIGURE 3. (A) 1D velocity model showing results of VELEST inversion (gray line) from a wide range of input velocity models (dash line). The blue line indicates the chosen lowest RMS 1D velocity model. The references model used: CRUST 1.0 (Wright and Kuo, 2007; Laske et al., 2013; You et al., 2013; Chen et al., 2020); (B) histogram of the Vp/Vs. ratio of 526 events obtained from a Wadati diagram.
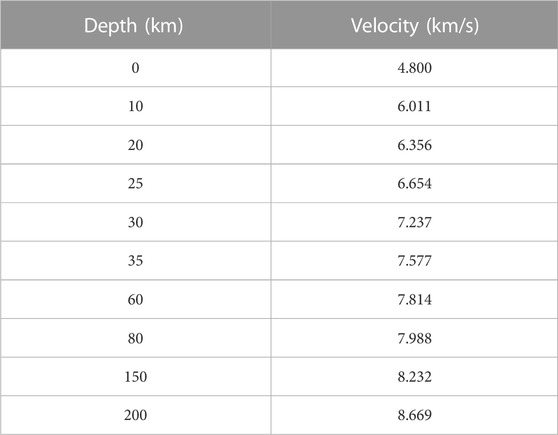
TABLE 1. The starting 1D P-wave velocity model resulted from VELEST for seismic tomographic inversion.
3.3 3D seismic tomography
The 3D seismic tomography inversion was conducted using the LOTOS program for the whole data set (Koulakov, 2009). The LOTOS program is a 3D inversion package designed for local tomography inversion and has been applied to various tectonic settings (Koulakov, 2013; Koulakov et al., 2016; Koulakov et al., 2018; Hua et al., 2019) and different scales, from a small region of a volcano (Koulakov et al., 2016; Koulakov and Vargas, 2018) to a regional area (Raoof et al., 2017).
The input of the program includes a 1D reference model, P- and S-wave traveltimes and locations of selected earthquakes, and seismic stations. The 3D tomographic inversion starts with the initial source location from the inversion of travel time using the input 1-D velocity model. In this step, the source location is calculated based on calculating a goal function that reflects the probability of the event at a current point (Koulakov and Sobolev, 2006). A grid search method is then applied to get the preliminary locations with the extreme value of the goal function.
In the next step, the tomographic inversion was carried out in several iterations. In each iteration, earthquakes were relocated using a modified bending tracing method based on a previously updated 3D velocity model (Um and Thurber, 1987). This technique searched for a 3D ray path with minimum travel time in the parameterization units, which were the nodes. These nodes were constructed with different basic orientations (e.g., 0°, 22°, 45°, and 66°) and then were averaged to reduce the effect of node distributions on the tomographic results. A large sparse matrix including P- and S velocity anomalies, source parameters, and station corrections were simultaneously inverted using the LSQR algorithm (Paige and Saunders, 1982; Van Der Sluis and Van der Vorst, 1987). The input parameters included the number of iterations, damping parameters, weights, and grid size in horizontal, vertical, and depth dimensions. To get the optimal inversion results, we determined these free parameters by using different synthetic tests. After obtaining the optimal free parameters, we applied the 3D inversion to our data and obtained the tomographic images.
4 Resolution validations of the tomographic image
In seismic tomography inversion, assessing the validity of the inversion is a major challenge and different tests have been proposed that can be grouped into two types: sampling test and synthetic test. The usage and theory of these tests have been discussed in detail in previous studies (Koulakov, 2009; Rawlinson et al., 2014; Rawlinson and Spakman, 2016).
In the sampling test, different subsets of the whole data are used to do the tomographic inversion, then the individual resultant images are compared. There are different statistical resampling techniques used in seismic tomography, for example,: jackknifing, bootstrap (Rawlinson et al., 2014), and the odd/even test (Polat et al., 2016). An odd/even test is a method to divide the data into two-halves, where the two subsets are with odd and even numbers of events. This sampling test can be used to assess the effect of the random noises on the inversions, with a higher degree of differences between two results reflecting a higher level of noise effect and vice versa (Polat et al., 2016). We chose this method to test the degree of noise in our data because it is simple and easy to apply.
The synthetic test is another widely used tool in seismic tomography (Koulakov, 2009). In this test, a synthetic pattern of the anomalies is created and the travel times for each source-station pair are then calculated. These calculated travel times are then added noises to replicate the actual random noises in the picking process. In our study, the noise had a predefined average deviation of 0.1s for P-wave travel time and 0.15s for S-wave travel time, because, in reality, the S-wave picks are often less accurate than the P-wave picks. In this process, the synthetic pattern can take the form of an equal space 3D block of positive and negative values (checkerboard test), or an arbitrary form of positive and negative velocity anomalies (Koulakov, 2009). Subsequently, the velocity model and source locations are “forgotten” and then the same inversion processes are applied to the real data, including source locations and velocity model inversion. The resultant images are then compared with the initial models to determine the region that shows good restoration.
In this study, to have a detailed assessment of the quality of inversion, we considered different tests, including the odd-event test and two synthetic tests, namely, the checkerboard resolution test (CRT) and the freeform synthetic test (Koulakov, 2009). By performing these quality tests, we also calibrated the parameters including nodal size, smoothing, damping, and weight of the seismic tomography inversion.
4.1 Checkerboard resolution test
We applied a classic checkerboard resolution test by setting a synthetic model of alternating positive and negative anomalies for horizontal and vertical slices. The amplitude of the anomalies was ±7% with different block sizes of 40 km, 50 km, and 60 km to check the quality of the inverted model for structures with different sizes. In the vertical sections, we created blocks with a depth size of 50 km and defined a change of pattern at a depth of 20 km.
The results of horizontal CRT for a grid size of 50 km are shown in Figures 4, 5, while grid sizes of 40 km and 60 km are shown in Supplementary Figure S3, S4; CRTs for the vertical sections are shown in Supplementary Figure S5.
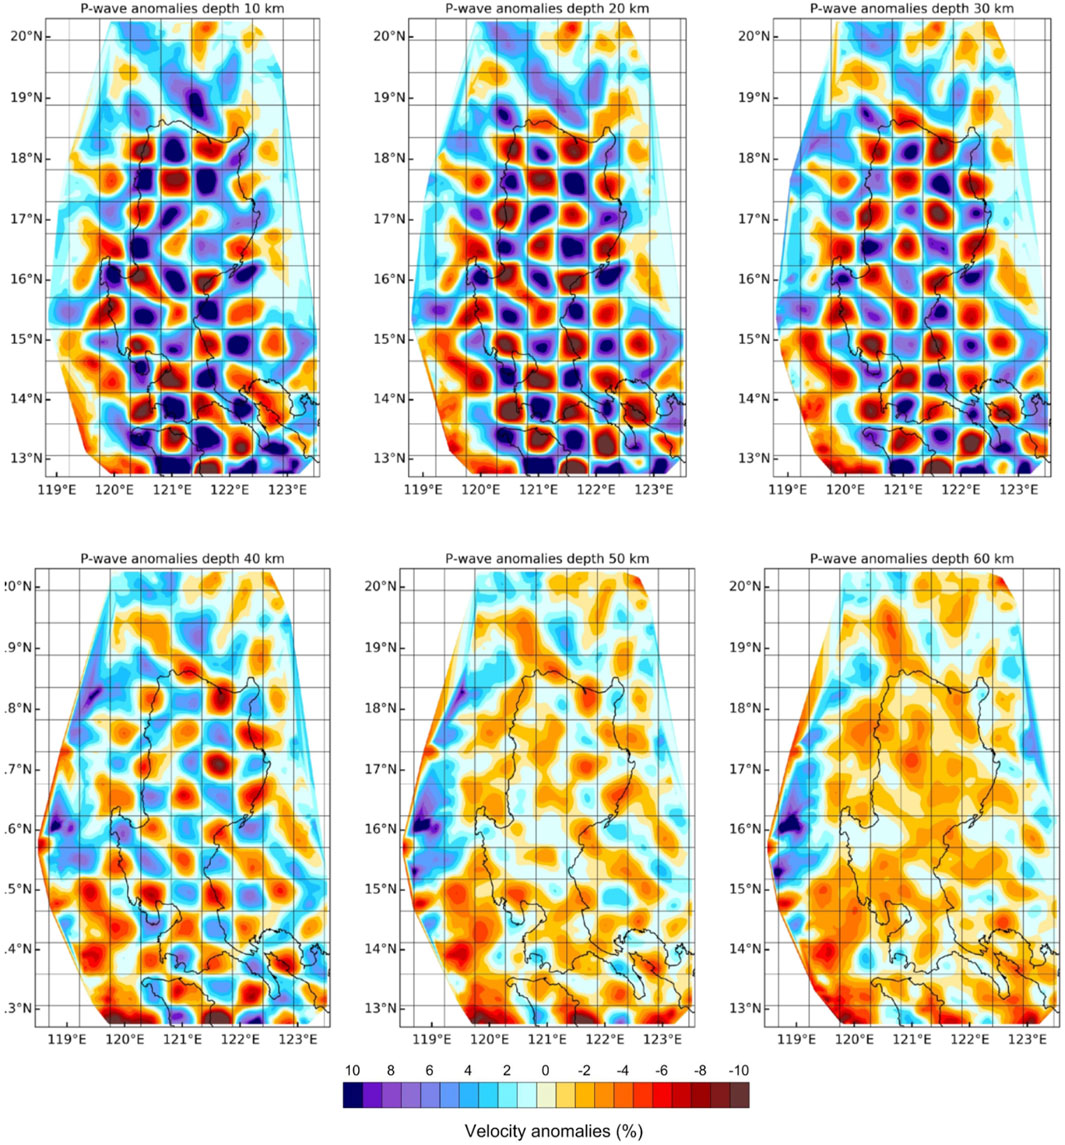
FIGURE 4. Results of the checkerboard resolution test for P-wave at depth layers with a lateral grid interval of 50 km in the longitudinal and latitudinal directions. The layer depth is shown below each map.
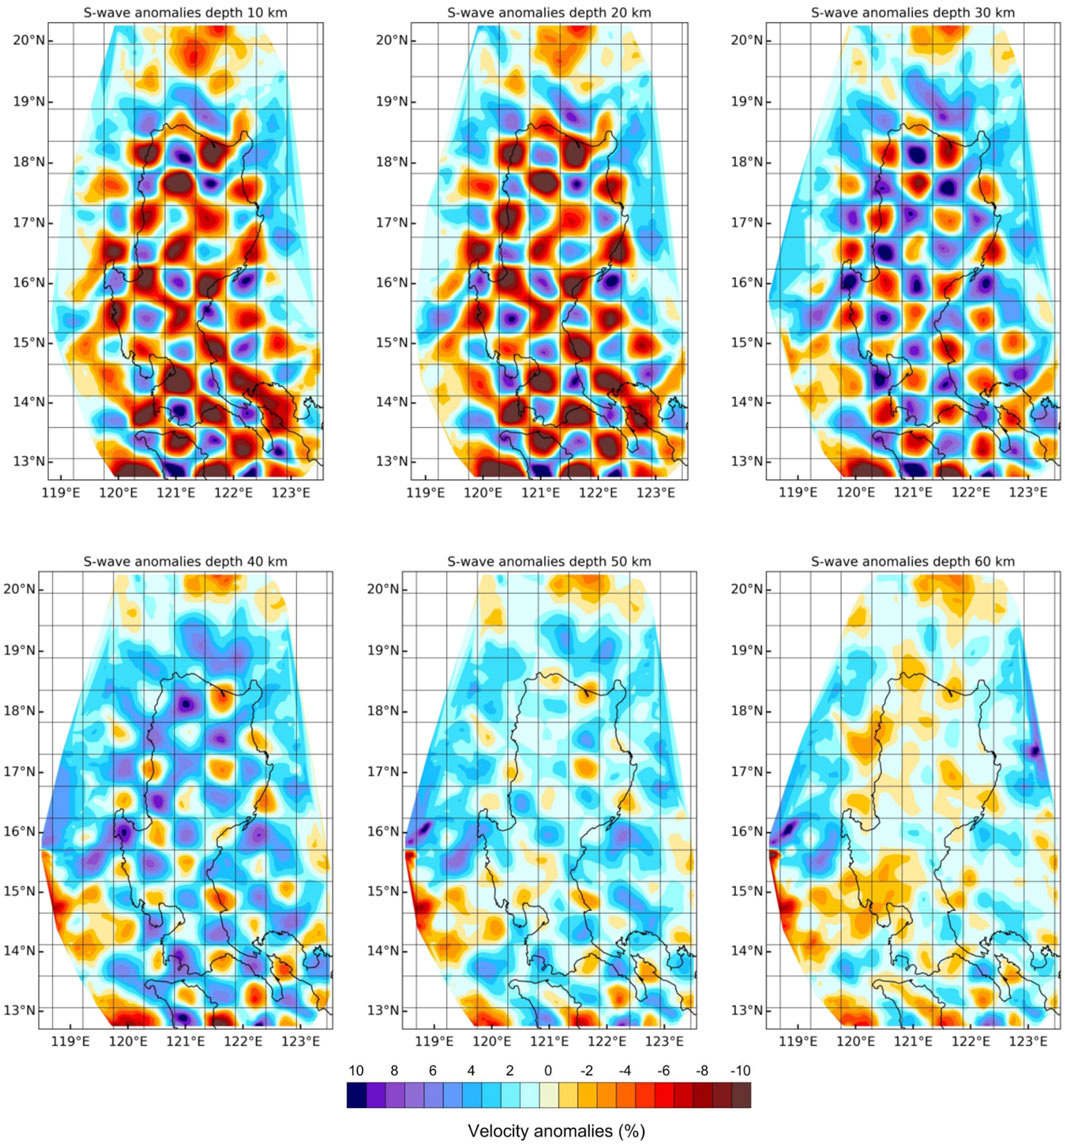
FIGURE 5. Results of the checkerboard resolution test for S-wave at depth layers with a lateral grid interval of 50 km in the longitudinal and latitudinal directions. The layer depth is shown below each map.
In general, the P-wave has a higher resolution quality than the S-wave because of the greater number of crosscut ray paths (Supplementary Figure S1, S2). In the horizontal sections, for the most part from depths of 0–50 km, the P-wave checkerboard could be well recovered in the whole region of Luzon Island, while the offshore region of Luzon Island (north of 19oN) was poorly recovered. For the S-wave, most regions of Luzon Island could be well recovered from 10 to 40 km, and poorly recovered in the deeper part.
In the vertical section (Supplementary Figure S5), the checkerboard test could be well recovered in the inland part to the depth of 70 km in most sections. The CRT results indicated that, for most regions of Luzon Island, the tomographic images could be considered reliable with the highest resolution from a depth of 20–50 km, while the deeper parts should be interpreted with caution. After some trial and error runs, we chose the optimal parameters to represent velocity perturbations, which are shown in Supplementary Table S2. We applied these model parameters to all the other quality tests and tomography inversions.
4.2 Odd-even test
In this test, we split real picking data (Figure 2A) into odd and even groups. Each group data was set as independent input data for inversion analysis. While the checkerboard test or freeform synthetic test are used to determine how the structures can be restored, the odd/even test is used to assess the effect of random noise on the tomographic results. If there are major differences between tomographic results from the odd and even datasets, the random noise may have a notable influence on the inversion, and the seismic tomographic may contain more uncertainties. The results of the odd/even test are shown in Figure 6 and show a horizontal section for P-wave and S-wave. Two layers of each test are presented: one for the shallow layer at 20 km and one for a deeper layer at 40 km. These results from odd/even events were then compared to each other.
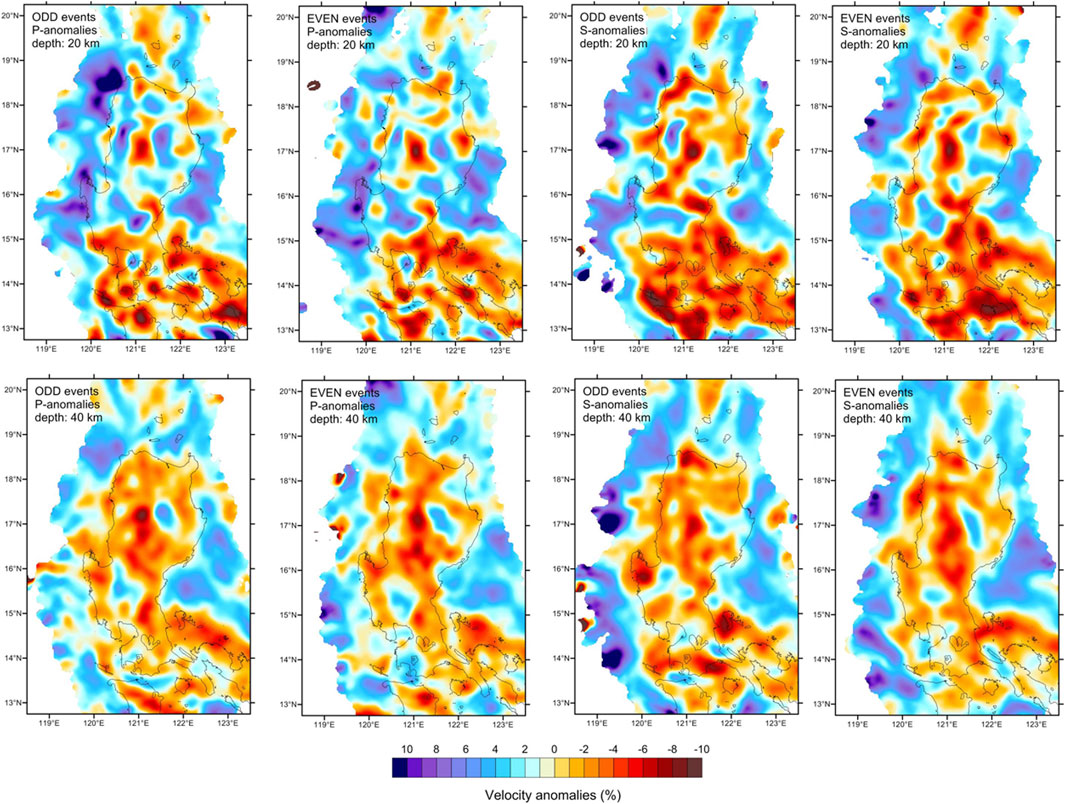
FIGURE 6. Results of the odd/even test in horizontal tomographic images. The data are divided into two subsets based on the number of events and performed independent inversion.
For the P-wave results, the models showed a very high correlation for the inland area in both horizontal sections (the left two columns in Figure 6). Most of the structures with different sizes were preserved in odd and even data inversion. However, both the P- and S-wave results showed a lower degree of correlation for regions with less ray path coverage (Supplementary Figure S1, S2). This reflects a higher degree of randomness and requires caution when interpreting the structure there.
4.3 Freeform synthetic test
Finally, we performed a freeform synthetic test in horizontal and vertical sections (assuming the model with 2D variation and the medium was invariant along the third axis, or named as 2.5D model in explosion Geophysics) to verify the quality of the seismic tomography inversion with structures. The horizontal section freeform velocity model of this synthetic test was integrated from the information of the regional tectonic features in Figure 1 and previously reported tomographic images to design the model as shown in Figure 7. The proposed velocity anomalies were ±6% for P-wave and ±8% (higher amplitude) for S-wave to resemble the previous inversion results (Fan et al., 2015; Fan et al., 2016). The horizontal section model was uniformly extended in a vertical direction from the surface to a depth of 100 km. Using the above-defined velocity models, we calculated the travel times for the event-station pair of all selected events as the synthetic input data. Using this synthetic input data and grid design as used in the case of the odd-even test, the results of this test are shown in Figure 7. In the inverted horizontal slices (Figure 7), the structures from the synthetic setup (shown in black lines) were recovered well even at the depth of 60 km, while the areas outside of the initial structures (i.e., 0% anomalies) were overestimated by ±3%. In this study, the vertical section models were arranged to test several candidate subduction zone models that were modified from the previous inversion results (Fan et al., 2015; Fan et al., 2016) of this area as shown in Supplementary Figure S6. The vertical section model extended in the horizontal direction, with the same velocity distribution of the cross section to the entire model. Supplementary Figure S6 also shows the test results of five vertical section models. In the vertical slices, the recovered P- and S-wave velocity structures showed a high correlation with the synthetic model on the vertical sections with minor smearing. The same as with the horizontal slices, the structures from the synthetic setup (shown in black lines) were recovered well above the depth of 60 km. Based on this test, we concluded that the inversion results in the region of interest were reliable enough for geological interpretation. Combined with the CRT test, we concluded that our models are suitable for interpretation with a depth of up to 60 km, with the most reliable horizontal slices from depths of 20–50 km. At a depth deeper than 60 km, the degrees of smearing were higher, thus, these regions should be interpreted with caution.
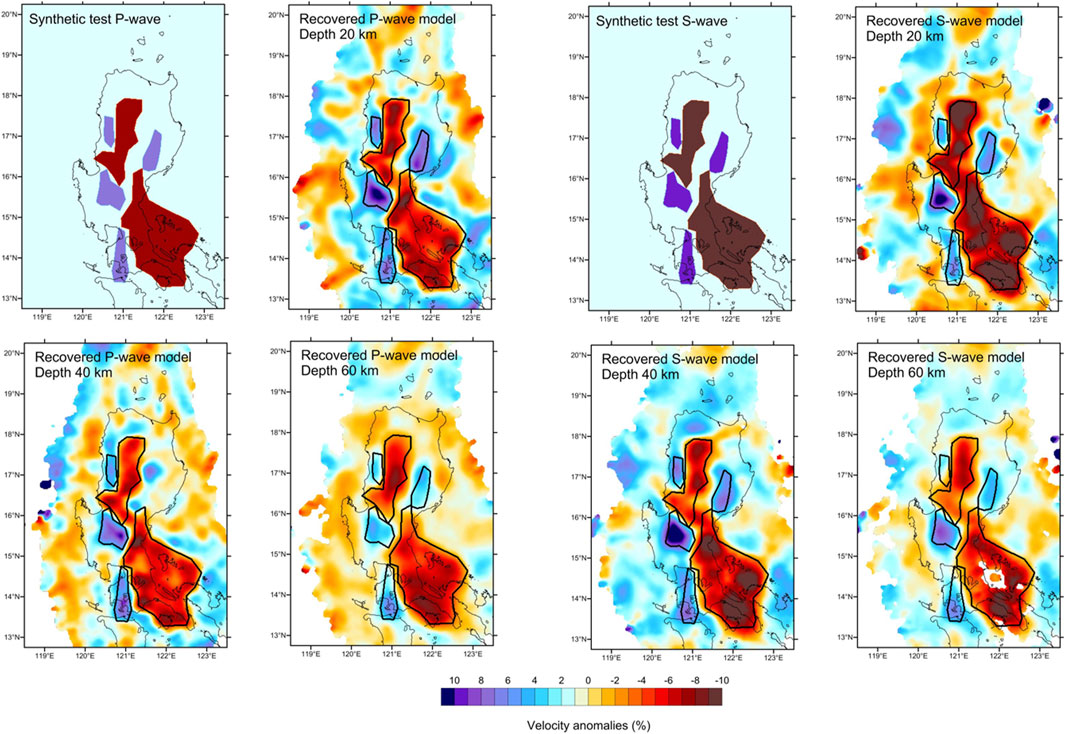
FIGURE 7. Results of the synthetic test with the realistic configuration of patterns in horizontal sections. The proposed velocity structure of the synthetic test referred to the regional tectonic features of Fig.1 to design the model.
5 Analyzed results
As stated in the synthetic test, the main model was obtained by inversion of data using five iterations. The tomographic inversion results in P-wave travel time misfit reduced from 0.523s to 0.441s (15.56% reduction) and S-wave travel time misfit reduced from 0.758s to 0.560s (26.1% reduction). The values of the mean residual and their reduction of P- and S-wave during each iteration are presented in Table 2, while Figures 8A,B show histograms of the P- and S-wave travel time misfit before and after the final iteration, respectively. Figure 8C shows the locations of the earthquakes before and after the inversion, which we will discuss in the next section.
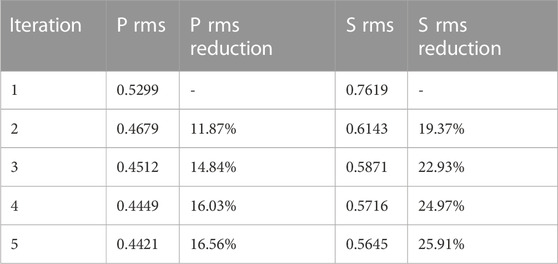
TABLE 2. The P-wave and S-wave residuals from tomographic inversion.
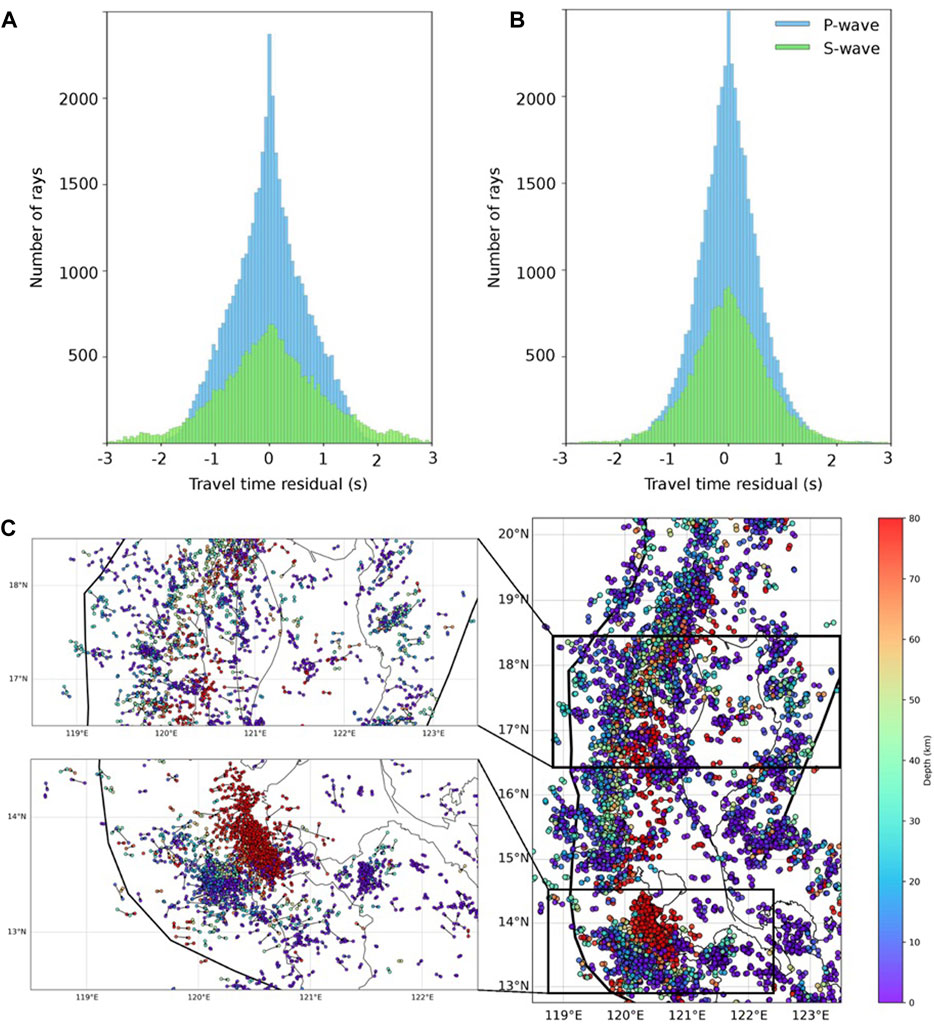
FIGURE 8. Travel time residual histogram (A) before and (B) after the tomographic inversion. The blue and green bars indicate P-wave and S-wave; (C) map showing the earthquake locations change after the inversion, and the arrow indicates points from the original locations to the relocated locations.
The results of seismic tomographic inversion in Luzon Island are presented as horizontal slices of P-wave perturbations (Figure 9) and S-wave perturbations (Figure 10). These images show the velocity anomalies compared with the initial 1D velocity model at the depth of 10 km, 20 km, 30 km, 40 km, 50 km, and 60 km. In P- and S-wave tomographic results, red colors denote the slow velocity anomalies and blue colors indicate high-velocity anomalies. Although the LOTOS program inverts P- and S-wave velocity simultaneously, the link between them is relatively weak and can be considered as independent parameters (Koulakov et al., 2016). Therefore, the high correlations between these results indicate the robustness of tomographic inversion. The Vp/Vs. ratio was also calculated for the vertical cross section by dividing the absolute P-wave velocity by S-wave velocity.
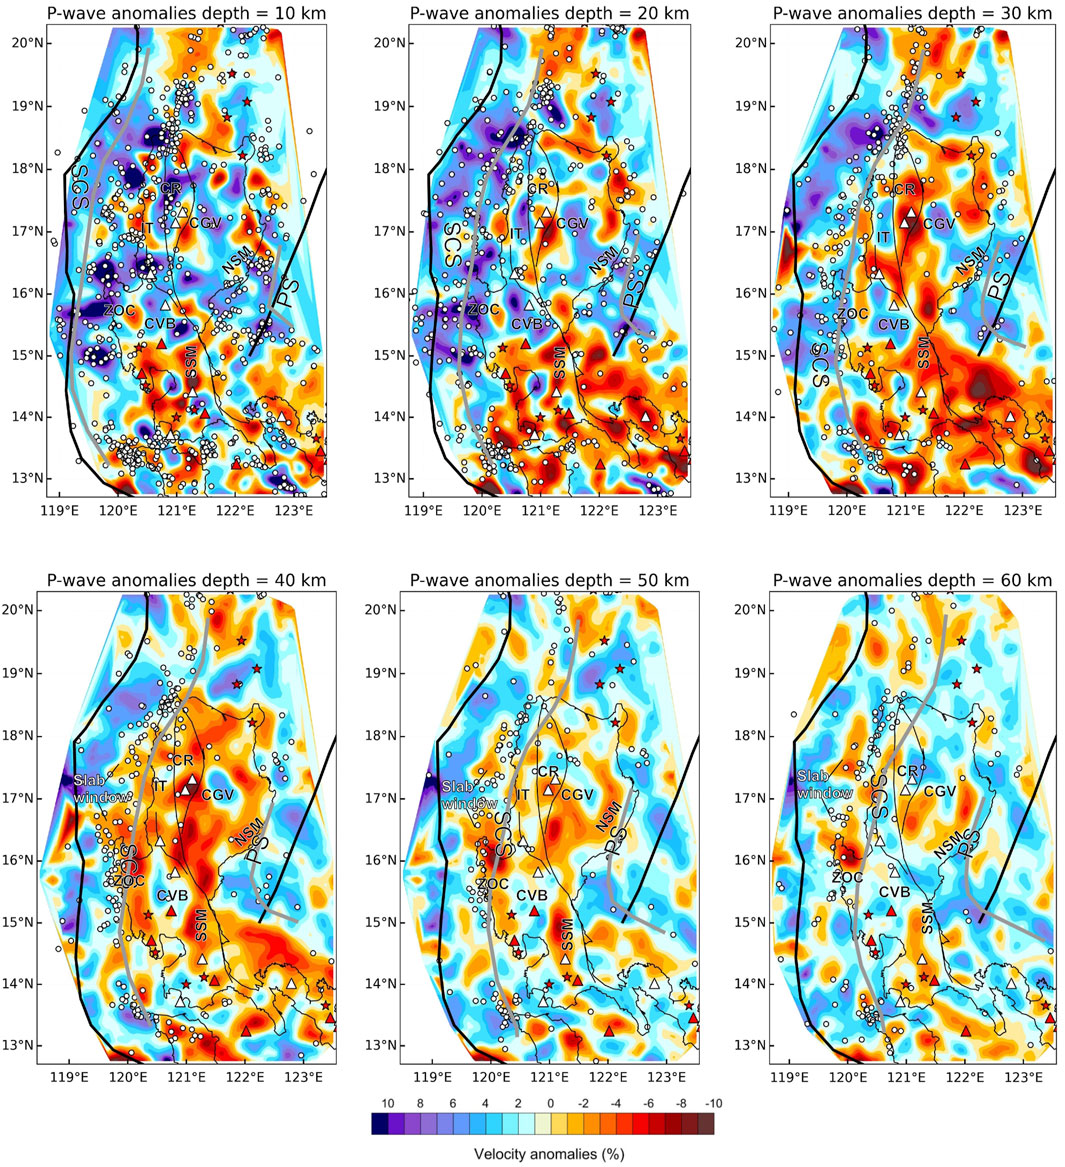
FIGURE 9. Map view of P-wave tomography of different depths. The red and blue colors denote slow and fast velocity perturbations, respectively. Gray lines indicate the subducting slab from the Slab 2 model (Hayes et al., 2018). The symbols and abbreviations are the same as those in Figure 1.
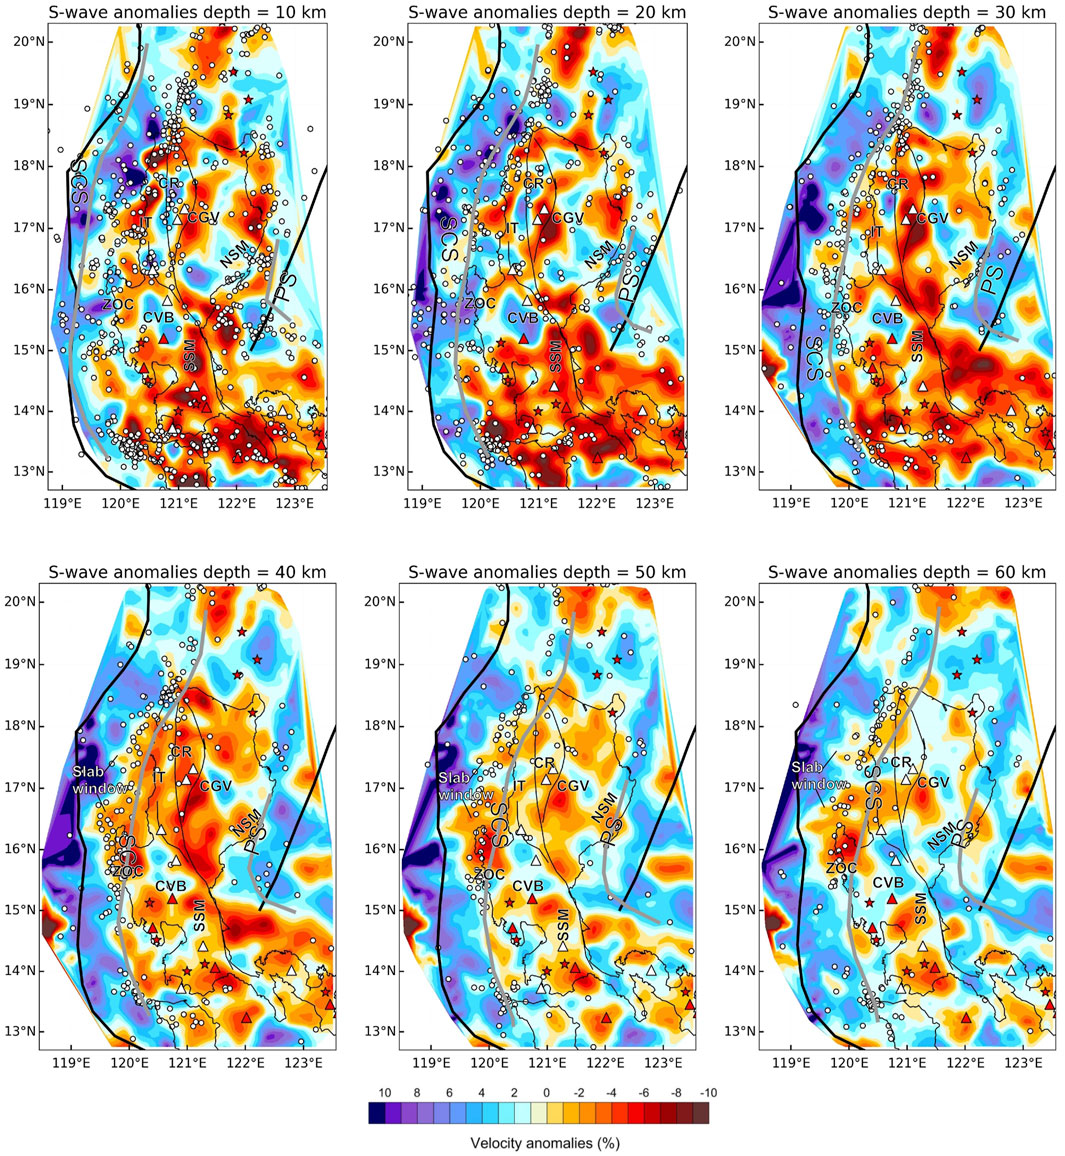
FIGURE 10. Map view of S-wave tomography of different depths. The symbols and abbreviations are the same as those in Figure 9.
Some seismic velocity zones with high values of anomalies could be noted at the slice of shallow depth of 10 km–30 km, as shown in Figures 9, 10. This higher degree of anomaly level might be due to the presence of the high contrasting velocity structure, e.g., subducting slab and magmatic structures (volcanoes and magma chamber) in the study area. Both the absolute velocity of P- and S-wave were much lower in the shallow depth compared to the deeper depth, therefore, the velocity anomalies at the horizontal slice at 10–30 km were generally higher than at a depth of 40–60 km. As a result, we focused on the structures with higher velocity anomalies in the shallow portion.
In the northern Luzon region, the Central Cordillera Range appeared as a region of mostly high-velocity anomalies, except the eastern region near inactive volcanoes, which appeared as a low-velocity zone at the depth of 10 km (16oN-18oN, Figures 9, 10). However, at depths of 20 km and 30 km, contrasting velocity anomaly patterns in the mountain range across the Philippine Fault could be seen, with the western side appearing as a high-velocity zone while the eastern side showed prominent low-velocity anomalies up to 9%. The Cagayan Valley Basin appeared as a mostly high-velocity zone with some small zones of low-velocity in the north and west. To the east, the North Sierra Madre mountain range was characterized by high-velocity anomalies, while low-velocity zones could be found in the South Sierra Madre. To the south, the Zambales Ophiolite Complex consistently appeared as a high-velocity zone. The Central Valley Basin appeared as a high-velocity zone, which shows a sharp velocity contrast with the northeast Philippine Fault and southeast South Sierra Madre up to a depth of 40 km.
Horizontal P- and S-wave velocity models showed high-velocity anomalies of 8%–10% in the west of Luzon Island from a depth of 10 km up to 60 km (Figures 9, 10). These anomalies were interpreted as the subducting slab of the South China Sea lithosphere, which agrees with the relocated earthquake distribution and reference slab model (gray lines). In the east of Luzon Island, the high-velocity anomalies combined with relocated earthquakes parallel to the East Luzon Trough may represent the subducting Philippines Sea Plate slab.
Low-velocity anomalies of up to 8% of both P- and S-wave could be found in most areas of Luzon Island under both active and inactive volcanoes (Figures 9, 10). These low-velocity anomalies exhibited a very high Vp/Vs. ratio (>1.8), suggesting that these low-velocity regions might indicate the area of magmatic storage. The shallow magmatic storage from seismic tomography images characterized by low velocity, especially low S-wave anomalies, and high Vp/Vs. ratio are quite common in subduction zones settings (Tatsumi et al., 1983; Zhao et al., 2000; Wyss et al., 2001; Husen et al., 2003; Koulakov et al., 2009; Koulakov, 2013; Koulakov et al., 2016). Figure 11 shows the P, S perturbations, and Vp/Vs. ratio in vertical sections from 14oN to 18oN, while the dots indicate relocated earthquakes. The earthquake locations define a good image of the Wadati-Benioff zone up to a depth of 100 km. The most notable features were the low P- and S-velocity and high Vp/Vs. region, which is interpreted as regions of magma generation and migration. Because S-velocity is more sensitive to fluid, S-velocity has a higher degree of negative anomalies and results in a high Vp/Vs. ratio in this area. The significance of these magma sources will be further discussed in the next section. The high-velocity zones concentrated with earthquakes were interpreted as the subducting slabs. In these images, the South China Sea slab could be well defined based on the high-velocity anomalies and earthquake distributions, while the Philippine Sea Plate resolution was less clear.
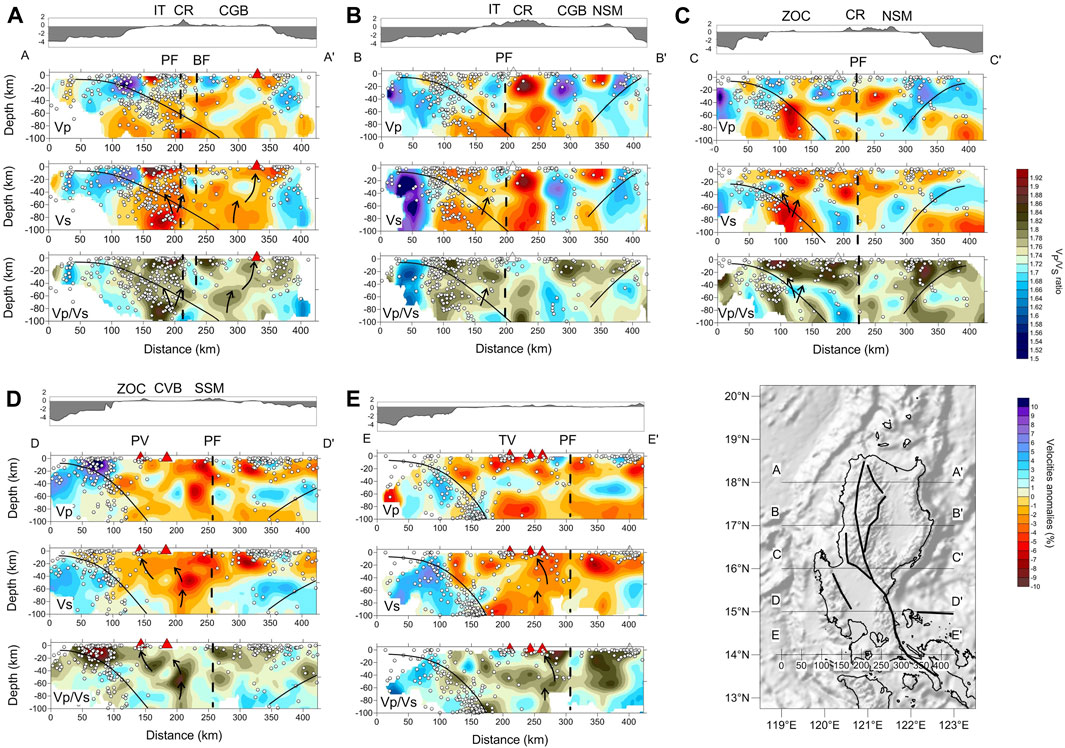
FIGURE 11. P- and S-wave velocity perturbations and Vp/Vs. for selected profiles along 18oN, 17oN, 16oN, 15oN, and 14oN (A–E). The locations of these profiles are in Figure 1. The black arrows indicate the migration path of magmas or melts from the mantle wedge. Red triangles denote the active volcanoes and white triangles denote inactive volcanoes. Dots indicate the locations of the relocated earthquakes. Abbreviations: PF: Philippines Fault; BF: Bangui Fault; PV; Pinatubo volcano; TV: Taal volcano; other abbreviations are the same as Figure 1. See the text for more details.
6 Discussion
6.1 Comparison with previous studies
Our tomographic results and relocation of earthquakes have provided new images of the velocity structures beneath Luzon Island. Compared with seismic tomographic studies that focused on the regional and global scales of Southeast Asia and the Taiwan region (Bijwaard et al., 1998; Lallemand et al., 2001; Li and van der Hilst, 2010), our results have a higher resolution, making it suitable to study the shallow tectonic structures in detail. Currently, the high-resolution tomographic studies for the North Luzon area only focused on the P-wave structure (Fan et al., 2015; Fan et al., 2016; Fan et al., 2017). Our P-wave velocity structures were consistent with their observations in both horizontal slices at the shallow depth (a depth of less than 100 km) and vertical profiles at 14oN to 18oN. The relocation of earthquakes will increase the quality of the data and can be used to trace the slab geometry of the subducted South China Sea slab (Figures 9–11). In our study, we provide a new P- and S-wave seismic velocity model, which delivers high resolution at shallow depth at a lithospheric scale. The tomographic images are suitable to provide new insights into the lithospheric structures of the study area.
6.2 Accreted terranes in the tomographic images
Different accreted terranes have been proposed as constituting Luzon Island, including ophiolites, continental fragments, and island arc elements (Karig, 1983). However, there is very little seismic evidence of these accreted structures. In both horizontal and vertical tomographic images, we could identify distinguishable velocity anomalies corresponding to the different accreted terranes that constitute Luzon Island. In a subduction zone setting, the observed velocity difference might reflect the geological properties (lithology and metamorphism grade) of the corresponding terranes (Eberhart-Phillips and Reyners, 2001; Kuo-Chen et al., 2012; Raoof et al., 2017).
From our results, we could observe the distinctive velocity anomalies corresponding to the surface geological structures. These showed similarities to the Taiwan region, which previous studies have referred to as the Mindoro-Luzon-Taiwan region (Stephan et al., 1986; Defant et al., 1989). Because our P-wave velocity models showed better quality, we interpreted the structure using mainly the P-wave tomographic images. The low-velocity anomalies under the Cordillera Central and the South Sierra Madre (Figures 9, 10 for horizontal sections and vertical cross sections BB’and DD’ in Figures 11B,D) might indicate that low-velocity roots resulted from the thickening of the crust, similar to the Central Range tomographic seismic velocity structure with low-velocity anomalies up to a depth of 54 km (Kuo-Chen et al., 2012). On the other hand, the high-velocity anomalies of the two valleys, namely, the Cagayan Valley Basin and the Central Valley Basin, in depths of 10–30 km, might indicate the metamorphic basement underneath the sedimentary layers (Karig, 1983; Stephan et al., 1986). The Zambales Ophiolite Complex exhibited a distinct high-velocity anomaly zone compared to the volcanic front in the east where active volcanoes are present (Figures 9, 10 and cross sections CC’ and DD’ in Figures 11C,D).
6.3 The depth of the Philippine Fault
The contrast in velocity anomalies of the accreted terranes can also be used to trace the fault systems in the area, in which the faults act as boundaries between the surface geological structures, namely, the Philippine Fault separates the Cordillera Central from Ilocos Trough in the north region (from 16oN—18oN) and from Central Valley Basin in the central region (15oN—16oN) (Figures 11A,B), and the Bangui fault separates the Cordillera Central and Cagayan Valley Basins (Figures 9, 10; Figure 11A). In this section, we examine the velocity contrast at the deeper depth to have a first order of estimation for the depth of the Philippine Fault.
In horizontal slices (Figures 9, 10), at the depth of 20 km–40 km, the Philippine Fault was well defined by the contrast velocity anomalies between the structures on two sides of the fault. In addition, the relocated earthquakes aligned clearly along the fault from the depth of 10–40 km, especially at the northern tip of the fault (15.5oN—18.5oN, Figures 9, 10). At the deeper depth, there were a few events aligned along the faults: scattered events at 16oN-18.5oN at 50 km, two events at 16oN, and six events at 18oN at a depth of 60 km (Figures 9, 10). In the vertical sections (Figure 11), it was clearer to see the Philippine Fault from velocity contrast in both P- and S-wave tomography and Vp/Vs. images in different segments of the fault. In all cross sections, we could observe the significant velocity contrast across the Philippine Fault from the surface to at least 60 km, while in cross sections CC’ and DD’ (Figures 11C,D), the velocity contrast might extend to the depth of 80 km. With the assessment that our tomographic models can be reliable up to 50 km in the horizontal section and up to a maximum of 70 km in the vertical section, we suggest that the observed velocity contrast across the Philippine Fault is reliable to a depth of at least 50 km. This observation of velocity contrast on two sides of the Philippine Fault is consistent with the tomographic images from joint inversion of P-wave local and teleseismic tomography (Fan et al., 2015; Fan et al., 2017).
Figure 12 shows the focal mechanisms of shallow earthquakes (Figure 12A) and their corresponding P- and T-axes with depths of less than 60 km (Figure 12B) overlapping the P-wave velocity anomalies at 40 km. These focal mechanisms corresponding to shallow earthquakes with hypocenter depths of less than 60 km were combined from NEIC (Sipkin, 1994) and CMT solutions (Dziewonski et al., 1981; Ekström et al., 2012) from 1981 to 2013, which contain 133 medium to strong events with the magnitude ranging from 4.7 to 7.7. The strike-slip earthquakes were well distributed along with the major strike-slip fault system with a maximum depth of 33 km, which is consistent with our relocated earthquakes, except for the northern part of the Philippine Fault where earthquakes along the fault were present even at a depth of 40 km (from 17oN to 18oN, Figures 9, 10). Along the fault, most of the earthquakes showed an east-west direction P-axis and a northeast-southwest direction T-axis (Figure 12B), which may imply a relatively homogenous stress pattern. The crustal thickness of the Luzon region was determined to be between 13 and 33 km (Parcutela et al., 2020), which implies that the strike-slip earthquakes related to the Philippine Fault occurred mostly at the crustal level, while at the deeper depth, the displacement was occupied by ductile deformation (Şengör et al., 2019). In other major strike-slip faults, the extension of the fault below the Moho was also revealed by the imaging technique, for example,: the San Andreas fault (Zandt, 1981; Zhu, 2000), North Anatolian Fault (Papaleo et al., 2017), and Altyn Tagh fault (Jiang et al., 2004). Therefore, from the analysis of earthquakes and heterogeneity of seismic velocity, we suggest that the Philippine Fault is a lithospheric scale structure that cuts through the crust and may offset the upper mantle structure along its displacement.
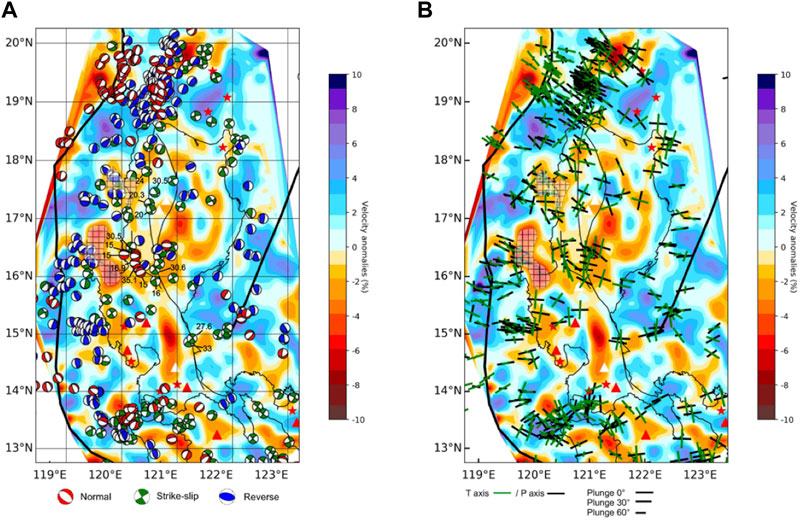
FIGURE 12. (A) Focal mechanism of the shallow earthquake overlying the 50 km depth P-wave anomalies in the study region. The focal mechanisms from earthquakes with hypocenter depths of less than 60 km, combined from NEIC and CMT solutions from 1981 to 2013; numbers indicate the depth in kilometers of selected earthquakes. The oblique stripe denotes the region of suspected slab tearing where earthquakes with normal faulting occur. (B) P- and T-axes of the same earthquakes in (A).
6.4 Slab tearing locations
The slab tearing along the fossil ridge of the South China Sea in the Manila Trench has been proposed using evidence of geochemistry, seismicity, and seismic tomography (Yang et al., 1996; Bautista et al., 2001; Fan et al., 2015; Fan et al., 2016). Our results also indicated two major low-velocity regions, high Vp/Vs. at 16oN to 17oN and around 17.5oN (Figures 11A–C and the grid region in Figure 12) that are separated by a thin high-velocity anomaly slab. These low-velocity anomalies were interpreted as results of high-temperature magmas upwelling through the slab tearing and forming a slab window. An abrupt disruption of earthquake continuity can also be noted in profile C-C’ at depths of 40–100 km, which may suggest a change in the geodynamic scenario in this area. Examples of a similar seismic gap and low-velocity anomalies resulting from slab tearing caused by ridge subduction can be found in the North Andean margin (Gutscher et al., 1999) and the Italian region (Rosenbaum et al., 2008).
The focal mechanism of the shallow earthquakes also supports our calculation of the place of slab tearing (Figure 12). In general, we observed the normal faulting at the outer trench, which shows an extension regime. On the other hand, thrust faulting is the dominant focal mechanism of the subducting slab. However, abnormal earthquakes, which have east-west strike normal focal mechanisms, are found in the extent of the larger proposed slab tearing region (Figure 12) with depths ranging from 15 km to 35 km. These events have a north-south T-axis and a nearly vertical P-axis, corresponding to a north-south extensional regime at the crustal level. This regime fits with our observation of seismic tearing and mantle upwelling in this region, suggesting that the slab tearing may cause the crust to extend in the northeast-southwest direction, thus producing these normal earthquakes in the lower crust. This pattern may imply a change in crust deformation and stress accumulation induced by ridge subduction and slab tearing.
From these observations of seismic tomography and focal mechanisms, we suggest that the fossil ridge of the South China Sea has been subducting beneath Luzon Island and creating slab-tearing regions at a depth of 40 km.
6.5 Subsurface magmatic feeding systems
To constrain the relationship between the volcanic system and the subduction of the South China Sea slab, S-wave velocity and Vp/Vs. ratio were used to trace the subsurface magmatic chamber and feeding veins because the S-velocity and Vp/Vs. ratio are relatively sensitive to the content of fluids and melts (Koulakov et al., 2016). Large veins of low S-wave velocity and high Vp/Vs. ratio were identified under the active volcanoes and regions of magmatic intrusion, allowing us to trace the ascending magmatic path in vertical images (black arrows on Figure 11). To correlate with the deeper structure, we combined our P-wave tomographic images at a depth of less than 100 km and P-wave global seismic tomography model UU-P07 at a depth deeper than 100 km (Amaru, 2007) for three cross sections, namely, along the 17oN, 16oN, and 15oN sections (Figure 13). The combined images showed a good fit of our model with the global model.
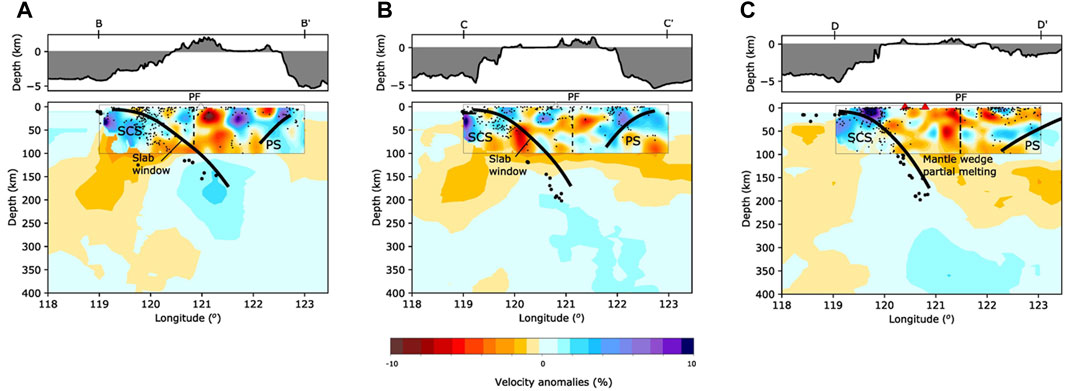
FIGURE 13. Tomographic images of the P-wave velocity model from this study (in the black frame) compared with the global teleseismic model UU-P07 for three profiles at 17°N (BB′-(A)), 16°N (CC′-(B)), and 15°N (DD′-(C)). Black dots indicate the earthquakes, small dots indicate the relocation observed in this study, and big dots indicate data from the EHB catalog. Thick black lines indicate the subduction slab from the Slab 2 model.
In our seismic tomography images, the slab tearing was identified in two regions, as seen in Figure 12. In the vertical section of these regions, the magmatism from slab tearing could be observed at cross sections AA’, BB’, and CC’ where low-velocity bodies ascended through the slab (Figures 11A–C). This observation fits the deeper structure from the model UU-P07 where low-velocity regions were present underneath the subducting slab (Figures 1B, 11A,B). These low-velocity regions can be interpreted as the ascendant of the asthenosphere to the continental crust (Rosenbaum et al., 2008). In a ridge subduction setting, magma may form and be unable to solidify, thus creating a slab window where magma continues to generate and rise (Thorkelson, 1996).
On the other hand, for the southern region, a deep source of magmatism was identified as the mechanism that feeds magma to the volcanoes. In vertical sections (DD’ and EE’ cross sections in Figure 11), the low-velocity anomalies fit well with the occurrences of active volcanoes (the Taal and Pinatubo). The magma resulting from the partial melting of the mantle wedge comes from a depth of at least 100 km (Figure 13C) and rises to accumulate in the magma chamber at a depth of 30–50 km before ascending to feed the surface volcanoes. A thermal model suggests the depth of partial melting by dehydration of subducted slab in the island arc system is likely to be deeper than 100 km (Gill, 1981; Tatsumi et al., 1983; Tatsumi, 1989). The deep source magmatism is widely observed from seismic tomography of the island arc region (Zhao et al., 2000; Nakajima et al., 2001; Husen et al., 2003; Koulakov et al., 2016). We interpret this magma source to be the partial melting of the mantle wedge by the dehydration reaction of the slab, ascending to the shallow magma chamber by interconnected magma veins.
The lack of low-velocity regions at a depth deeper than 100 km at the site of slab tearing regions (Figures 13A,B) might indicate an absence of magmatism from partial melting of the mantle wedge. Another observation is that the volcanoes in the regions related to the slab tearing (around 16oN to 18oN) are mostly inactive, in contrast to the very active volcanoes to both the north and south of these regions. In the subduction regions associated with high bathymetric relief, the phenomenon of reduced volcanism is quite common, which might be explained by the absence of a sufficiently deep slab to generate arc volcanism (Rosenbaum and Mo, 2011). This might also apply to the slab tearing region in our study area as the slab tear might cause a lack of deep slab, while the upwelling asthenosphere does not reach the surface. However, to have a more precise explanation of the area’s volcanism mechanics, further geophysical and geochemical investigations are needed.
7 Conclusion
In this study, we performed a P- and S-wave travel time seismic tomographic inversion on Luzon Island. The tomographic images resulting from the inversion were used to determine and interpret the major structures at the upper mantle level and crustal level.
Figure 14 summarizes the result of our study and proposes the tectonic model of the Luzon region. We identified the seismic velocity contrast corresponding to the different geological structures, which are separated by the Philippine Fault. The relocated earthquakes from this study combined with the reference focal mechanisms were used to trace the fault in the crust. Medium to large strike-slip earthquakes occurring in the crust may suggest a brittle mechanism. At the upper mantle level, we continued to observe the seismic velocity differences across the fault up to the depth of 60 km, where ductile deformation takes place. From these observations, we conclude that the Philippine Fault is a lithospheric structure that cuts through the crust and offsets the upper mantle.
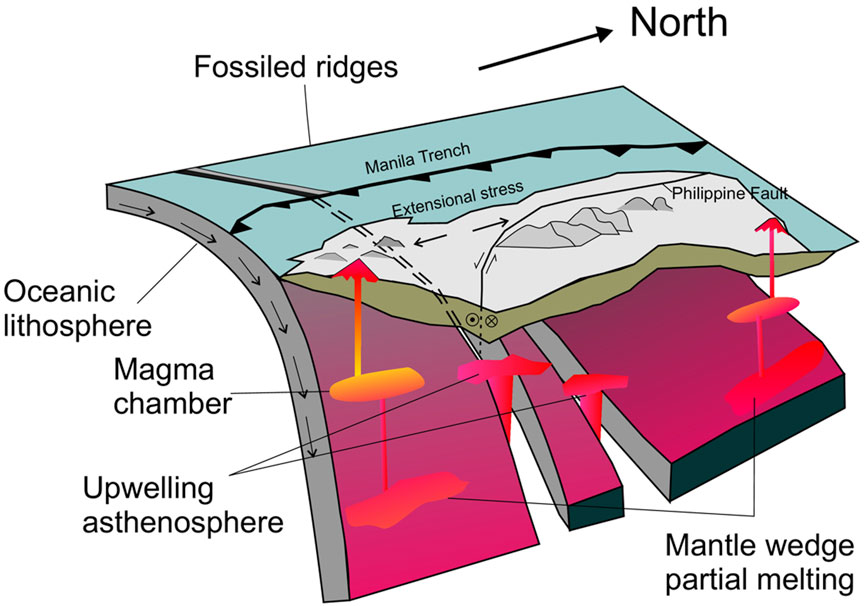
FIGURE 14. Tectonic model of Luzon Island showing the magma formation source from both the mantle wedge melting and asthenosphere upwelling from slab tear sites. The slab tearing occurs in the region where the fossil ridge is subducted. In the central region, the Philippine Fault cuts through the whole crust and offsets the upper mantle.
The tomographic results confirm the presence of slab-tearing regions extended from the fossil ridges in the northern Luzon region. The observation is supported by the unusual extension regime from the focal mechanism in the suspected area in the crust. This slab tear causes the upwelling of the asthenosphere that ascends through the subducting slab. In addition, it also might create a deep slab absence, and hinder the formation of the magma at the mantle wedge. In regions outside of the slab tearing areas, the mantle wedge partial melting occurs and feeds melt material to the subsurface magma chambers and the active volcanoes.
Data availability statement
The original contributions presented in the study are included in the article/Supplementary Material, further inquiries can be directed to the corresponding author.
Author contributions
C-NN, B-SH, and T-YL initiated the original idea and conceptualized research. P-FC and VN provided comments and discussion. IN, BB, and AM performed the collection of the PHIVOLCS and IES seismic network data used in this study. All co-authors contributed to the interpretation of the results and the manuscript writing led by C-NN, T-YL, and B-SH. All authors contributed to the article and approved the submitted version.
Funding
This study was funded by the Vietnam Academy of Science and Technology (VAST) under grant numbers CT0000.02/22-23 and VAST06.02/23-24, and by the Ministry of Science and Technology in Taiwan under grants MOST 108-2116-M-001-011, MOST 108-2116-M-001-010-MY3, and MOST 109-2119-M-001-011.
Acknowledgments
We appreciate the staff of the Philippine Institute of Volcanology and Seismology, and Academia Sinica for collecting the data used in this study. We thank Ivan Koulakov for helping in running the LOTOS tomographic code. We would like to thank two reviewers for their constructive suggestions and comments.
Conflict of interest
The authors declare that the research was conducted in the absence of any commercial or financial relationships that could be construed as a potential conflict of interest.
Publisher’s note
All claims expressed in this article are solely those of the authors and do not necessarily represent those of their affiliated organizations, or those of the publisher, the editors and the reviewers. Any product that may be evaluated in this article, or claim that may be made by its manufacturer, is not guaranteed or endorsed by the publisher.
Supplementary material
The Supplementary Material for this article can be found online at: https://www.frontiersin.org/articles/10.3389/feart.2023.1213498/full#supplementary-material
References
Amaru, M. (2007). Global travel time tomography with 3-D reference models. Utrecht: Utrecht University.
Armada, L. T., Hsu, S. K., Dimalanta, C. B., Yumul, G. P., Doo, W. B., and Yeh, Y. C. (2020). Forearc structures and deformation along the Manila Trench. J. Asian Earth Sci. X (4), 100036. doi:10.1016/j.jaesx.2020.100036
Aurelio, M. A. (2000). Shear partitioning in the Philippines: constraints from Philippine Fault and global positioning system data. Isl. Arc 9, 584–597. doi:10.1111/j.1440-1738.2000.00304.x
Aurelio, M., Barrierj, E., Gaulon, R., and Rangin, C. (1997). Deformation and stress states along the central segmentof the Philippine Fault: implications to wrench fault tectonics. J. Asian Earth Sci. 15, 107–119. doi:10.1016/s0743-9547(97)00001-9
Barrier, E., Huchon, P., and Aurelio, M. (1991). Philippine Fault - a key for philippine kinematics. Geology 19, 32–35. doi:10.1130/0091-7613(1991)019<0032:pfakfp>2.3.co;2
Bautista, B. C., Bautista, M. L. P., Oike, K., Wu, F. T., and Punongbayan, R. S. (2001). A new insight on the geometry of subducting slabs in northern Luzon, Philippines. Tectonophysics 339, 279–310. doi:10.1016/s0040-1951(01)00120-2
Bertin, D., Lindsay, J. M., Cronin, S. J., de Silva, S. L., Connor, C. B., Caffe, P. J., et al. (2022). Probabilistic volcanic hazard assessment of the 22.5–28° S segment of the central volcanic zone of the andes. Front. Earth Sci. 10, 875439. doi:10.3389/feart.2022.875439
Bijwaard, H., Spakman, W., and Engdahl, E. R. (1998). Closing the gap between regional and global travel time tomography. J. Geophys Res-Sol Ea. 103, 30055–30078. doi:10.1029/98jb02467
Bluth, G. J. S., Doiron, S. D., Schnetzler, C. C., Krueger, A. J., and Walter, L. S. (1992). Global tracking of the So2 clouds from the june, 1991 mount-pinatubo eruptions. Geophys. Res. Lett. 19, 151–154. doi:10.1029/91gl02792
Castillo, P. R., and Newhall, C. G. (2004). Geochemical constraints on possible subduction components in lavas of Mayon and Taal Volcanoes, southern Luzon, Philippines. J. Petrology 45, 1089–1108. doi:10.1093/petrology/egh005
Chen, P. F., Su, P. L., Olavere, E. A., Solidum, R. U., and Huang, B. S. (2020). Relocation of the April 2017 Batangas, Philippines, earthquake sequence, with tectonic implications. Terr. Atmos. Ocean. Sci. 31, 273–282. doi:10.3319/tao.2020.01.31.01
Defant, M. J., Jacques, D., Maury, R. C., Deboer, J., and Joron, J. L. (1989). Geochemistry and tectonic setting of the Luzon arc, Philippines. Geol. Soc. Am. Bull. 101, 663–672. doi:10.1130/0016-7606(1989)101<0663:gatsot>2.3.co;2
Dziewonski, A. M., Chou, T. A., and Woodhouse, J. H. (1981). Determination of earthquake source parameters from waveform data for studies of global and regional seismicity. J. Geophys. Res. Solid Earth 86 (B4), 2825–2852. doi:10.1029/jb086ib04p02825
Eberhart-Phillips, D., and Reyners, M. (2001). A complex, young subduction zone imaged by three-dimensional seismic velocity, Fiordland, New Zealand. Geophys. J. Int. 146, 731–746. doi:10.1046/j.0956-540x.2001.01485.x
Ekström, G., Nettles, M., and Dziewoński, A. M. (2012). The global CMT project 2004–2010: centroid-moment tensors for 13,017 earthquakes. Phys. Earth Planet. Interiors 200, 1–9. doi:10.1016/j.pepi.2012.04.002
Engdahl, E. R., van der Hilst, R., and Buland, R. (1998). Global teleseismic earthquake relocation with improved travel times and procedures for depth determination. Bull. Seismol. Soc. Am. 88, 722–743. doi:10.1785/bssa0880030722
Fan, J. K., Wu, S. G., and Spence, G. (2015). Tomographic evidence for a slab tear induced by fossil ridge subduction at Manila Trench, South China Sea. Int. Geol. Rev. 57, 998–1013. doi:10.1080/00206814.2014.929054
Fan, J. K., Zhao, D. P., and Dong, D. D. (2016). Subduction of a buoyant plateau at the Manila Trench: tomographic evidence and geodynamic implications. Geochem. Geophys. Geosystems 17, 571–586. doi:10.1002/2015gc006201
Fan, J. K., Zhao, D. P., Dong, D. D., and Zhang, G. X. (2017). P-wave tomography of subduction zones around the central Philippines and its geodynamic implications. J. Asian Earth Sci. 146, 76–89. doi:10.1016/j.jseaes.2017.05.015
Fitch, T. J. (1972). Plate convergence, transcurrent faults, and internal deformation adjacent to southeast Asia and the western Pacific. J. Geophys. Res. 77, 4432–4460. doi:10.1029/jb077i023p04432
Gill, J. (1981). Orogenic andesites and plate tectonics. Heidelberg: Springer Science & Business Media.
Gutscher, M. A., Malavieille, J., Lallemand, S., and Collot, J. Y. (1999). Tectonic segmentation of the North andean margin: impact of the carnegie ridge collision. Earth Planet. Sci. Lett. 168, 255–270. doi:10.1016/s0012-821x(99)00060-6
Hamburger, M. W., Cardwell, R. K., and Isacks, B. L. (1983). “Seismotectonics of the northern Philippine island arc,” in The tectonic and geologic evolution of Southeast asian seas and islands: Part 2 (Washington, D.C: American Geophysical Union), 1–22.
Hayes, G. P., Moore, G. L., Portner, D. E., Hearne, M., Flamme, H., Furtney, M., et al. (2018). Slab2, a comprehensive subduction zone geometry model. Science 362, 58–61. doi:10.1126/science.aat4723
Hollings, P., Wolfe, R., Cooke, D. R., and Waters, P. J. (2011). Geochemistry of tertiary igneous rocks of northern Luzon, Philippines: evidence for a back-arc setting for alkalic porphyry copper-gold deposits and a case for slab roll-back? Econ. Geol. 106, 1257–1277. doi:10.2113/econgeo.106.8.1257
Hsu, Y. J., Yu, S. B., Loveless, J. P., Bacolcol, T., Solidum, R., Luis, A., et al. (2016). Interseismic deformation and moment deficit along the Manila subduction zone and the Philippine Fault system. J. Geophys Res-Sol Ea. 121, 7639–7665. doi:10.1002/2016jb013082
Hsu, Y. J., Yu, S. B., Song, T. R. A., and Bacolcol, T. (2012). Plate coupling along the Manila subduction zone between Taiwan and northern Luzon. J. Asian Earth Sci. 51, 98–108. doi:10.1016/j.jseaes.2012.01.005
Hua, Y. J., Zhang, S. X., Li, M. K., Wu, T. F., Zou, C. Y., and Liu, L. (2019). Magma system beneath Tengchong volcanic zone inferred from local earthquake seismic tomography. J. Volcanol. Geotherm. Res. 377, 1–16. doi:10.1016/j.jvolgeores.2019.04.002
Hung, T. D., Yang, T., Le, B. M., Yu, Y., Xue, M., Liu, B., et al. (2021). Crustal structure across the extinct mid-ocean ridge in South China sea from OBS receiver functions: insights into the spreading rate and magma supply prior to the Ridge cessation. Geophys. Res. Lett. 48 (3), e2020GL089755. doi:10.1029/2020gl089755
Husen, S., Quintero, R., Kissling, E., and Hacker, B. (2003). Subduction-zone structure and magmatic processes beneath Costa Rica constrained by local earthquake tomography and petrological modelling. Geophys. J. Int. 155, 11–32. doi:10.1046/j.1365-246x.2003.01984.x
Jego, S., Maury, R. C., Polve, M., Yumul, G. P., Bellon, H., Tamayo, R. A., et al. (2005). Geochemistry of adakites from the Philippines: constraints on their origins. Resour. Geol. 55, 163–188. doi:10.1111/j.1751-3928.2005.tb00239.x
Jiang, X. D., Hin, Y., and McNutt, M. K. (2004). Lithospheric deformation beneath the Altyn Tagh and West Kunlun faults from recent gravity surveys. J. Geophys Res-Sol Ea. 109. doi:10.1029/2003jb002444
Karig, D. E. (1983). Accreted terranes in the northern part of the philippine Archipelago. Tectonics 2, 211–236. doi:10.1029/tc002i002p00211
Karig, D. E., Sarewitz, D. R., and Haeck, G. D. (1986). Role of strike-slip faulting in the evolution of allochthonous terranes in the Philippines. Geology 14, 852–855. doi:10.1130/0091-7613(1986)14<852:rosfit>2.0.co;2
Kissling, E., Ellsworth, W. L., Eberhartphillips, D., and Kradolfer, U. (1994). Initial reference models in local earthquake tomography. J. Geophys Res-Sol Ea. 99, 19635–19646. doi:10.1029/93jb03138
Koulakov, I. (2009). LOTOS code for local earthquake tomographic inversion: benchmarks for testing tomographic algorithms. Bull. Seismol. Soc. Am. 99, 194–214. doi:10.1785/0120080013
Koulakov, I., Smirnov, S. Z., Gladkov, V., Kasatkina, E., West, M., El Khrepy, S., et al. (2018). Causes of volcanic unrest at Mt. Spurr in 2004-2005 inferred from repeated tomography. Sci. Rep. 8, 17482. doi:10.1038/s41598-018-35453-w
Koulakov, I., and Sobolev, S. V. (2006). A tomographic image of Indian lithosphere break-off beneath the Pamir-Hindukush region. Geophys. J. Int. 164, 425–440. doi:10.1111/j.1365-246x.2005.02841.x
Koulakov, I. (2013). Studying deep sources of volcanism using multiscale seismic tomography. J. Volcanol. Geotherm. Res. 257, 205–226. doi:10.1016/j.jvolgeores.2013.03.012
Koulakov, I., and Vargas, C. A. (2018). Evolution of the magma conduit beneath the galeras volcano inferred from repeated seismic tomography. Geophys. Res. Lett. 45, 7514–7522. doi:10.1029/2018gl078850
Koulakov, I. Y., Kukarina, E. V., Gordeev, E. I., Chebrov, V. N., and Vernikovsky, V. A. (2016). Magma sources in the mantle wedge beneath the volcanoes of the Klyuchevskoy group and Kizimen based on seismic tomography modeling. Russ. Geol. Geophys. 57, 82–94. doi:10.1016/j.rgg.2016.01.006
Koulakov, I., Yudistira, T., Luehr, B.-G., and Wandono, P, (2009). Svelocity and VP/VS ratio beneath the Toba caldera complex (Northern Sumatra) from local earthquake tomography. Geophys. J. Int. 177, 1121–1139. doi:10.1111/j.1365-246x.2009.04114.x
Kuo-Chen, H., Wu, F. T., and Roecker, S. W. (2012). Three-dimensional P velocity structures of the lithosphere beneath Taiwan from the analysis of TAIGER and related seismic data sets. J. Geophys. Res. Solid Earth 117. doi:10.1029/2011jb009108
Lallemand, S., Font, Y., Bijwaard, H., and Kao, H. (2001). New insights on 3-D plates interaction near Taiwan from tomography and tectonic implications. Tectonophysics 335, 229–253. doi:10.1016/s0040-1951(01)00071-3
Laske, G., Masters, G., Ma, Z., and Pasyanos, M. (2013). Update on CRUST1. 0—a 1-degree global model of Earth’s crust. Geophysical Research Abstracts, 2658.
Lee, T. Y., and Lawver, L. A. (1994). Cenozoic Plate reconstruction of the South China sea region. Tectonophysics 235, 149–180. doi:10.1016/0040-1951(94)90022-1
Levin, V., Shapiro, N., Park, J., and Ritzwoller, M. (2002). Seismic evidence for catastrophic slab loss beneath Kamchatka. Nature 418, 763–767. doi:10.1038/nature00973
Li, C., and van der Hilst, R. D. (2010). Structure of the upper mantle and transition zone beneath Southeast Asia from traveltime tomography. J. Geophys Res-Sol Ea. 115, B07308. doi:10.1029/2009jb006882
Nakajima, J., Matsuzawa, T., Hasegawa, A., and Zhao, D. (2001). Three-dimensional structure of V<i>p</i>, V<i>s</i>, and V<i>p</i>/V<i>s</i> beneath northeastern Japan: implications for arc magmatism and fluids. J. Geophys. Res. Solid Earth 106, 21843–21857. doi:10.1029/2000jb000008
Nur, A., and Benavraham, Z. (1983). Volcanic gaps due to oblique consumption of aseismic ridges. Tectonophysics 99, 355–362. doi:10.1016/0040-1951(83)90112-9
Parcutela, N. E., Dimalanta, C. B., Armada, L. T., and Yumul, G. P. (2020). PHILCRUST3.0: new constraints in crustal growth rate computations for the Philippine arc. J. Asian Earth Sci. X 4, 100032. doi:10.1016/j.jaesx.2020.100032
Paige, C. C., and Saunders, M. A. (1982). Lsqr - an algorithm for sparse linear-equations and sparse least-squares. Acm Trans. Math. Softw. 8, 43–71. doi:10.1145/355984.355989
Papaleo, E., Cornwell, D. G., and Rawlinson, N. (2017). Seismic tomography of the North Anatolian Fault: new insights into structural heterogeneity along a continental strike-slip fault. Geophys. Res. Lett. 44, 2186–2193. doi:10.1002/2017gl072726
Polat, G., Ozel, N. M., and Koulakov, I. (2016). Investigating P- and S-wave velocity structure beneath the Marmara region (Turkey) and the surrounding area from local earthquake tomography. Earth Planets Space 68, 132. doi:10.1186/s40623-016-0503-4
Raoof, J., Mukhopadhyay, S., Koulakov, I., and Kayal, J. R. (2017). 3-D seismic tomography of the lithosphere and its geodynamic implications beneath the northeast India region. Tectonics 36, 962–980. doi:10.1002/2016tc004375
Rawlinson, N., Fichtner, A., Sambridge, M., and Young, M. K. (2014). Seismic tomography and the assessment of uncertainty. Adv. Geophys. 55, 1–76. doi:10.1016/bs.agph.2014.08.001
Rawlinson, N., and Spakman, W. (2016). On the use of sensitivity tests in seismic tomography. Geophys. J. Int. 205, 1221–1243. doi:10.1093/gji/ggw084
Rosenbaum, G., Gasparon, M., Lucente, F. P., Peccerillo, A., and Miller, M. S. (2008). Kinematics of slab tear faults during subduction segmentation and implications for Italian magmatism. Tectonics 27, n/a. doi:10.1029/2007tc002143
Rosenbaum, G., and Mo, W. (2011). Tectonic and magmatic responses to the subduction of high bathymetric relief. Gondwana Res. 19, 571–582. doi:10.1016/j.gr.2010.10.007
Ruff, L., and Kanamori, H. (1980). Seismicity and the subduction process. Phys. Earth Planet. Interiors 23, 240–252. doi:10.1016/0031-9201(80)90117-x
Şengör, A. M. C., Zabcı, C., and Natal'in, B. A. (2019). Continental transform faults: congruence and incongruence with normal plate kinematics. Transform Plate Boundaries Fract. Zones 2019, 169–247. doi:10.1016/B978-0-12-812064-4.00009-8
Smith, W. H., and Sandwell, D. T. (1997). Global sea floor topography from satellite altimetry and ship depth soundings. Science 277, 1956–1962. doi:10.1126/science.277.5334.1956
Stephan, J. F., Blanchet, R., Rangin, C., Pelletier, B., Letouzey, J., and Muller, C. (1986). Geodynamic evolution of the taiwan Luzon Mindoro belt since the late eocene. Tectonophysics 125, 245–268. doi:10.1016/0040-1951(86)90017-x
Tatsumi, Y. (1989). Migration of fluid phases and genesis of basalt magmas in subduction zones. J. Geophys. Research-Solid Earth Planets 94, 4697–4707. doi:10.1029/jb094ib04p04697
Tatsumi, Y., Sakuyama, M., Fukuyama, H., and Kushiro, I. (1983). Generation of arc basalt magmas and thermal structure of the mantle wedge in subduction zones. J. Geophys. Res. 88, 5815–5825. doi:10.1029/jb088ib07p05815
Thorkelson, D. J. (1996). Subduction of diverging plates and the principles of slab window formation. Tectonophysics 255, 47–63. doi:10.1016/0040-1951(95)00106-9
Um, J., and Thurber, C. (1987). A fast algorithm for two-point seismic ray tracing. Bull. Seismol. Soc. Am. 77, 972–986. doi:10.1785/bssa0770030972
Van Der Sluis, A., and Van der Vorst, H. (1987). Numerical solution of large, sparse linear algebraic systems arising from tomographic problems, Seismic tomography. Dordrecht: Springer, 49–83.
Venzke, E., Wunderman, R., McClelland, L., Simkin, T., Luhr, J., Siebert, L., et al. (2002). Global volcanism, 1968 to the present. Smithsonian Institution. Global Volcanism Program Digital Information Series, GVP-4, Available at: http://www.volcano.si.edu/reports/.
Wadati, K., and Oki, S. (1933). On the travel time of earthquake waves.(Part II). J. Meteorological Soc. Jpn. Ser. II 11, 14–28. doi:10.2151/jmsj1923.11.1_14
Wright, C., and Kuo, B. Y. (2007). Evidence for an elevated 410 km discontinuity below the Luzon, Philippines region and transition zone properties using seismic stations in Taiwan and earthquake sources to the south. Earth Planets Space 59, 523–539. doi:10.1186/bf03352715
Wyss, M., Hasegawa, A., and Nakajima, J. (2001). Source and path of magma for volcanoes in the subduction zone of northeastern Japan. Geophys. Res. Lett. 28, 1819–1822. doi:10.1029/2000gl012558
Yang, T. F., Lee, T., Chen, C. H., Cheng, S. N., Knittel, U., Punongbayan, R. S., et al. (1996). A double island arc between Taiwan and Luzon: consequence of ridge subduction. Tectonophysics 258, 85–101. doi:10.1016/0040-1951(95)00180-8
You, S. H., Gung, Y., Lin, C. H., Konstantinou, K. I., Chang, T. M., Chang, E. T. Y., et al. (2013). A preliminary seismic study of Taal volcano, Luzon island Philippines. J. Asian Earth Sci. 65, 100–106. doi:10.1016/j.jseaes.2012.10.027
Yu, S. B., Hsu, Y. J., Bacolcol, T., Yang, C. C., Tsai, Y. C., and Solidum, R. (2013). Present-day crustal deformation along the philippine Fault in Luzon, Philippines. J. Asian Earth Sci. 65, 64–74. doi:10.1016/j.jseaes.2010.12.007
Yumul, G. P., Dimalanta, C., Bellon, H., Faustino, D. V., De Jesus, J. V., Tamayo, R. A., et al. (2000). Adakitic lavas in the central Luzon back-arc region, Philippines: lower crust partial melting products? Isl. Arc 9, 499–512. doi:10.1111/j.1440-1738.2000.00297.x
Yumul, G. P., Dimalanta, C. B., Gabo-Ratio, J. A. S., Queaño, K. L., Armada, L. T., Padrones, J. T., et al. (2020). Mesozoic rock suites along western Philippines: exposed proto-South China Sea fragments? J. Asian Earth Sci. X 4, 100031. doi:10.1016/j.jaesx.2020.100031
Zandt, G. (1981). Seismic images of the deep-structure of the san-andreas fault system, central coast ranges, California. J. Geophys. Res. 86, 5039–5052. doi:10.1029/jb086ib06p05039
Zhao, D. P., Asamori, K., and Iwamori, H. (2000). Seismic structure and magmatism of the young Kyushu subduction zone. Geophys. Res. Lett. 27, 2057–2060. doi:10.1029/2000gl011512
Keywords: Luzon, tomography, slab tearing, magmatic system, the Philippine fault
Citation: Nguyen C-N, Huang B-S, Lee T-Y, Chen P-F, Nguyen VD, Narag I, Bautista BC and Melosantos A (2023) Slab tearing and lithospheric structures in Luzon island, Philippines: constraints from P- and S-wave local earthquake tomography. Front. Earth Sci. 11:1213498. doi: 10.3389/feart.2023.1213498
Received: 28 April 2023; Accepted: 19 September 2023;
Published: 10 October 2023.
Edited by:
Claudia Piromallo, National Institute of Geophysics and Volcanology (INGV), ItalyReviewed by:
Stefano Solarino, Università di Genova, ItalyLuis E. Lara, Austral University of Chile, Chile
Copyright © 2023 Nguyen, Huang, Lee, Chen, Nguyen, Narag, Bautista and Melosantos. This is an open-access article distributed under the terms of the Creative Commons Attribution License (CC BY). The use, distribution or reproduction in other forums is permitted, provided the original author(s) and the copyright owner(s) are credited and that the original publication in this journal is cited, in accordance with accepted academic practice. No use, distribution or reproduction is permitted which does not comply with these terms.
*Correspondence: Bor-Shouh Huang, aHdic0BlYXJ0aC5zaW5pY2EuZWR1LnR3