 Seungjun Lee
 Hyunuk An
 Minseok Kim
 Taeun Kang3
- 1Department of Agricultural and Rural Engineering, Chungman National University, Daejeon, Republic of Korea
- 2Landslides Research Center, Geologic Hazards Division, Korea Institute of Geoscience and Mineral Resources, Daejeon, Republic of Korea
- 3Division for Integrated Water Management, Korea Environment Institute, Sejong, Republic of Korea
Landslides are prevalent natural disasters in mountainous regions worldwide, and the debris flows that accompany them are considered a significant cause of topographical changes. Landslide-debris flows cause property damage and casualties if they occur in densely populated areas, such as cities and rural areas. Sediments entering a dam or reservoir lake can compromise the integrity and functionality of the facility. To minimize such damage, this phenomenon should be elucidated through numerical models and quantitative analyses performed. Despite South Korea having approximately 18,000 dams and reservoirs, with approximately 70% of the country being mountainous, research on landslides and debris flows occurring in the dam and reservoir basins remains insufficient. However, such studies are essential for the continuous operation and management of dams/reservoirs. This study focused on analyzing the damage caused by landslide-debris flow events in a dam or reservoir basin. We established different scenarios based on the distribution of vegetation in the basin to determine the impact of vegetation on slope stability and debris flows.
1 Introduction
Landslides are natural disasters in mountainous regions worldwide, and the debris flows that accompany them are considered to contribute significantly to topographical changes. Landslides triggered by rainfall occur suddenly and are known to generate destructive fast-moving debris flows, (Iverson, 2000; Lai et al., 2018). Landslide-debris flows cause direct property and casualties when they occur in densely populated areas, such as cities and rural areas. Sediments entering a dam or reservoir lake can compromise the integrity and functionality of the facility. The sudden influx of debris flows, as seen in the 1963 Vajont dam disaster in Italy, can result in a large amount of sediment entering the reservoir lake rapidly, causing a tsunami that can lead to secondary flood damage. To minimize such damage, the phenomenon should be elucidated through numerical models and performing quantitative analyses.
Accordingly, various studies to understand and predict landslide-debris flow through numerical models have been conducted (Tran et al., 2017; Lee et al., 2022a). Landslides generally occur in collapse-risk areas, as calculated through slope stability analysis based on the infinite slope theory; representative models include SHALSTAB (Dietrich and Montgomery, 1998), TRIGRS (Baum et al., 2008), and time-varying slope stability analysis (TiVaSS) (An et al., 2016). The Navier–Stokes equation or the shallow-water equation is generally applied to the analysis of debris flow, and FLO-2D (O’Brien et al., 1993), DAN (Hungr, 1995), RAMMS (Christen et al., 2010), r.avaflow (Mergili et al., 2017), and Deb2D (An et al., 2019) are among the representative models. In addition, models that comprehensively analyze landslides and debris flows are being developed and introduced (Hong et al., 2020; Liu and He, 2020; Nian et al., 2021; Shan et al., 2022; Zhou et al., 2022; Wu et al., 2023). In these combined models, the landslide collapse area is calculated through slope stability analysis based on time-varying rainfall data. Accordingly, the debris flow is assumed to occur at the point calculated in the previous slope stability analysis. However, this process has uncertainty in the interpretation of the landslide collapse point and the debris flow. Specifically, combining and analyzing these models inevitably increases the uncertainty, so additional verification and research are essential.
Several researchers have analyzed landslide-debris flow events in urban and rural areas using various methods (Kim H. et al., 2021; Kim S. et al., 2021; Zhao et al., 2022). In the case of South Korea, which is the focus of this study, interest in landslide-debris flow in urban areas has increased following the 2011 Mt. Umyeon landslide in Seoul. Despite South Korea having approximately 18,000 dams and reservoirs, with around 70% of the country being mountainous, research on landslides and debris flows occurring in the dam and reservoir basins has been insufficient. However, such studies are essential for the continuous operation and management of dams/reservoirs (ICOLD, 2009). In particular, to prevent disasters similar to the 1963 Vajont dam disaster in Italy, it is crucial to elucidate these phenomena through numerical models and develop appropriate countermeasures. This study focused on analyzing the damage caused by landslide-debris flow events in dam and reservoir lakes. In addition, mountainous areas with vegetation distribution are usually predominant in basins where dams or reservoirs are constructed. Different researchers have suggested that vegetation could block the debris flow (Lee et al., 2004; Hui et al., 2010; Tang et al., 2014; Kang et al., 2022), and Julian and Torres (2006) and Shen et al. (2017) suggested that vegetation could not only block the debris flow but also inhibit the erosion and entrainment processes that occur during debris flows. Therefore, this study analyzed the effects of landslide-debris flow events on dams or reservoirs and the effects of vegetation in the simulation processes. We established different scenarios based on the distribution of vegetation in the basin and used occurrence frequency rainfall scenarios to determine the impact of vegetation on slope stability.
However, dam and reservoir facilities are typically situated in mountainous areas where obtaining topographical information and data on historical landslide and debris flow events is more challenging than in urban areas with established disaster response systems. This study used satellite map data to identify landslide-debris flow events (Casagli et al., 2004; Haeberlin et al., 2004; Mondini et al., 2011; Martha et al., 2019). For the target event tracked through satellite data, information on the landslide occurrence points was simulated via the time-varying slope stability based on the rainfall data in the target area through the TiVaSS model. The results from the TiVaSS model were used as input data for the Deb2D model to analyze the flow and deposition after ground collapse. An et al. (2016) developed TiVaSS, a numerical model that analyzes slope stability through a three-dimensional (3D) subsurface flow system of the Richard equation, whereas An et al. (2019) developed Deb2D, a numerical model that analyzes debris flows by discretizing the two-dimensional (2D) shallow water equation via the finite volume method (FVM). This study selected the Doam dam located in Gangwon-do, South Korea as the study area. The problem of turbid water in the Doam dam has been aggravated by continuous sheet erosion and intermittent landslides and debris flows, and the dam currently lacks function. Accordingly, the landslide and debris flow events that occurred near Doam dam were tracked using satellite map data, from which the impact of the landslide and debris flow that occurred in the area was quantitatively analyzed.
2 Materials and methods
Previous studies proposed various methods for analyzing slope failure and debris flow and verified the performance of these methodologies. However, complex physical processes, such as landslides and debris flows, have high uncertainty due to soil particle characteristics. Therefore, a series of physical processes should be separately analyzed to minimize errors. Therefore, this study analyzed these processes (slope collapse, liquefaction, and flow) by separating slope collapse from the flow process that occurs after collapse. Slope collapse due to rainfall was analyzed using the TiVaSS model. The flow-deposition process associated with the debris flow was analyzed using the Deb2D model and data from the collapse zone calculated through the TiVaSS model. It was assumed that the slope failure occurred instantaneously. These assumptions are for small basin damage assessment. However, because this study is focuses on the amount of debris flow in large dam basins, the effects of these assumptions are deemed limited. This study assumed that the soil that flowed into the lake directly caused the dam function deterioration by increasing the top of dead storage. In addition, the percentage of the inflow soil volume compared to the water storage was calculated to quantitatively analyze the degradation of dam function due to landslide-debris flow in the dam basin.
2.1 TiVaSS model
The TiVaSS model developed by An et al. (2016) analyzes slope stability based on the infinite slope-stability model as shown in Figure 1, and the shear and normal stress at the slope surface are calculated as follows:
where
where
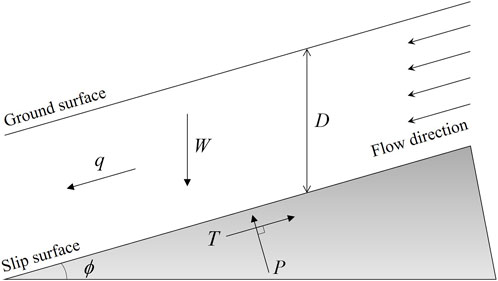
FIGURE 1. Schematic of the infinite slope-stability model (refer to An et al., 2016).
The only time-variant variable in Eq. 4 is the pressure head because effective saturation is usually given as a function of the pressure head. Moreover, in the TiVaSS model, the subsurface flow in saturated soil due to rainfall is interpreted through the 3D Richard equation, which is as follows:
where
In the TiVaSS model, Eq. 5 is discretized within FVM, and the following equation is applied with the Gauss–Green divergence theorem (An and Yu, 2014):
where
2.2 Deb2D model
Flow can efficiently be analyzed if it has a small vertical height relative to the area of the horizontal surface, such as a debris flow, using the shallow-water equation based on the Navier–Stokes equation. The Deb2D model, developed by An et al. (2019), analyzes debris flow using a two-dimensional shallow-water equation based on a rectangular grid that utilizes an adaptive mesh-refinement technique. Therefore, this numerical model requires a shorter time than that required by other models to calculate the flow state. The shallow-water equation is as follows:
where
where
Debris flows cause various interactions with the ground surface during the flow process, with erosion, entrainment, and deposition being essential mechanisms for simulating the debris flow in a numerical model. Calculating
where
where
where
where
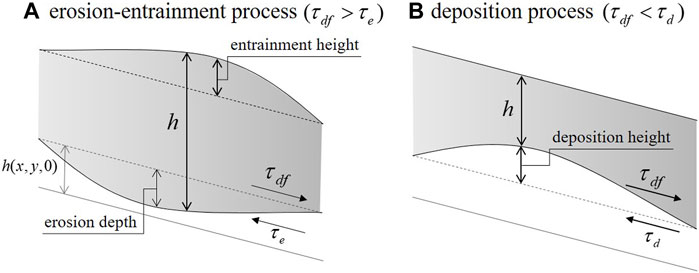
FIGURE 2. Processes of (A) erosion–entrainment and (B) deposition (refer to Lee et al., 2022b).
In this study, Eq. 11 was adopted to consider the effect of resistance caused by vegetation in the debris flow process. However, according to Julian and Torres (2006) and Shen et al. (2017), vegetation not only affects the resistance in the flow process but also affects the erosion process in the soil. Shen et al. (2017) analyzed that the critical shear stress can increase 1.3–2.4 times in the presence of vegetation. Therefore, in this study, the increase in critical shear stress derived from a previous study was considered by assuming that
2.3 Study area and event
2.3.1 Study area
This study analyzed the Doam dam basin located in the upper reaches of the Han River that passes through South Korea. The Doam dam in Daegwallyeong, Pyeongchang-gun, Gangwon-do, is surrounded by mountains, as shown in Figure 3. Doam dam was built in 1991 for hydroelectric power generation. However, the continuous/intermittent inflow of soil into the lake has aggravated the turbid water problem, and the dam lost its function in 2001 until now. The watershed area of Doam dam is 144.9 km2, and the effective capacity is 40 million tons out of a total storage of 51 million tons. According to the Ministry of Land, Infrastructure and Transport (South Korea), the land use in this watershed consists of forest (71.6%), paddy and field (16.5%), grassland (5.9%), bare land (5.1%), water (0.6%), and urban settlement (0.3%), as shown in Figure 4.
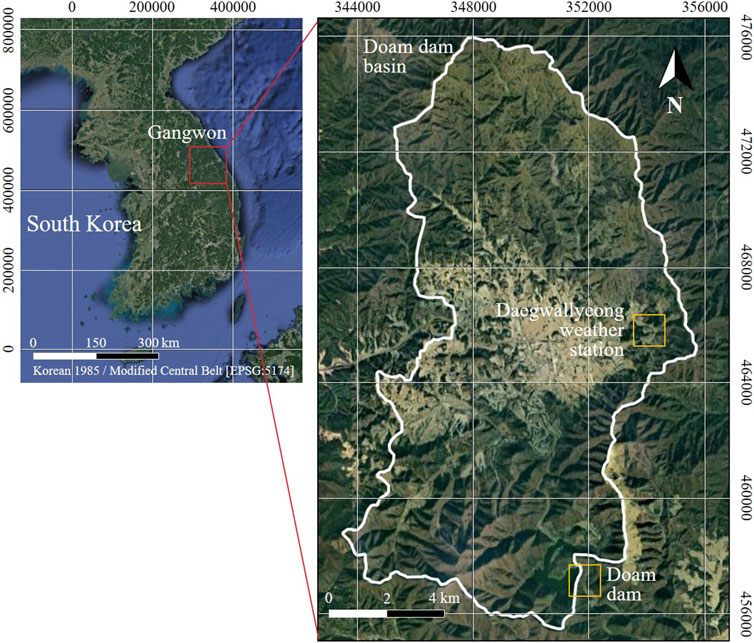
FIGURE 3. Study area: the Doam dam basin in Gangwon, South Korea.
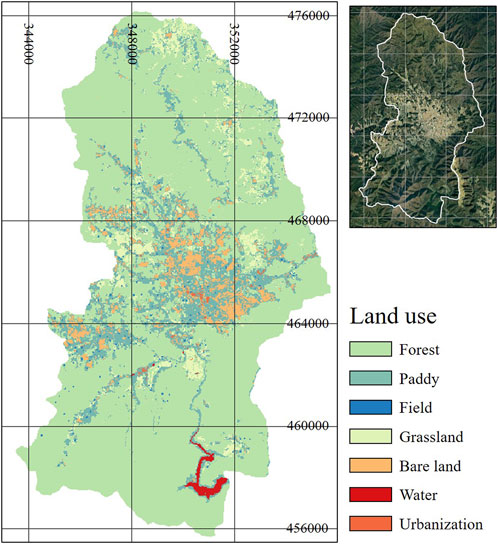
FIGURE 4. Land use map of the Doam dam basin.
Figure 5 shows the topography and characteristics of the Doam dam basin. As shown in Figure 5, the following spatial distribution data of the study area were used in TiVaSS and Deb2D models: digital elevation model (DEM), soil depth, saturated soil weight, friction angle, and soil cohesion (National Geographic Information Institute in South Korea). As shown in Figure 4, because most of the target area consists of forests, it is essential to consider vegetation in the numerical analysis. Therefore, this study leveraged the concept of root reinforcement to represent vegetation, which affects soil cohesion.
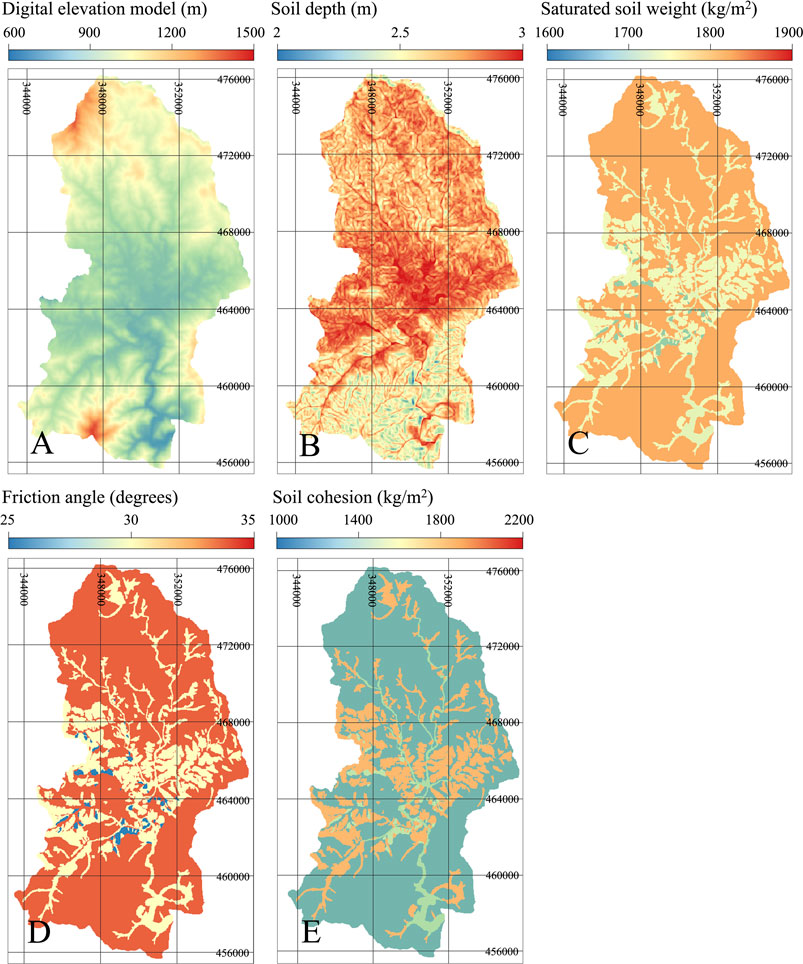
FIGURE 5. 2D topography and characteristic data of Doam dam basin: (A) DEM, (B) soil depth, (C) saturated soil weight, (D) friction angle, and (E) soil cohesion.
To calculate the soil cohesion under the effect of vegetation, a quantitative evaluation of the root reinforcement is necessary. Chok et al. (2015) summarized studies that calculated root reinforcement as a quantitative indicator. The present study used data from the forest of Japan, which has similar geographical/climatic characteristics as South Korea, to determine the root reinforcement of vegetation distributed in the Doam dam basin (3 kPa = 306 kg/m2). This study considered the distribution of vegetation within the Doam dam basin, 1) without vegetation, and 2) with vegetation to evaluate the influence of root reinforcement. Figure 6 demonstrates each scenario.
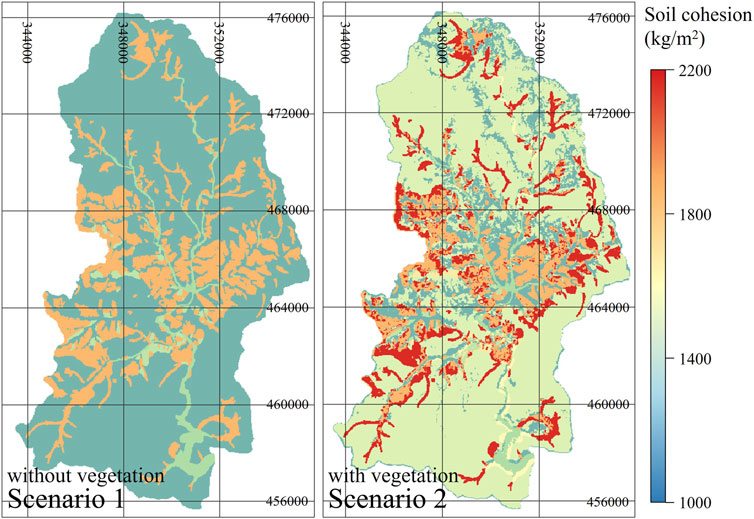
FIGURE 6. Soil cohesion considering root reinforcement for each vegetation distribution scenario.
2.3.2 Study event
Landslide-debris flow events that occur in mountainous areas are of much less interest than those that occur in cities. Therefore, investigating past landslide-debris flow events in the Doam dam basin is challenging. This study attempted to approximate the time and location of the landslide-debris events using satellite maps to overcome the above limitations. As shown in Figure 7, traces of landslide-debris flow were found in the Doam dam basin between 2004 (source: Google Earth) and 2008 (source: Kakao map), and this study investigated the landslide-debris flow events during this period. According to An et al. (2015), rainfall occurred on July 14–20, 2006 in Pyeongchang, Gangwon, where Doam dam is located, due to Typhoon Ewiniar. In particular, the rainfall on July 15–16, 2006 (approximately 320 mm) was reported to cause landslide-debris flow events (Figure 8). Based on this, we assume that the traces observed in Figure 7 were caused by the precipitation in 2006 and simulated this event based on vegetation scenarios.
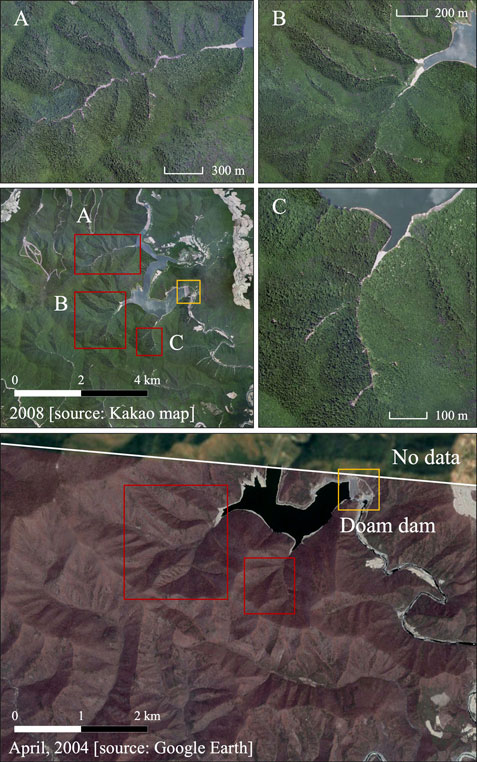
FIGURE 7. Satellite data in 2004 and 2008 for tracking landslide-debris flow events in the Doam dam basin, and traces of landslide-debris flow in (A–C).
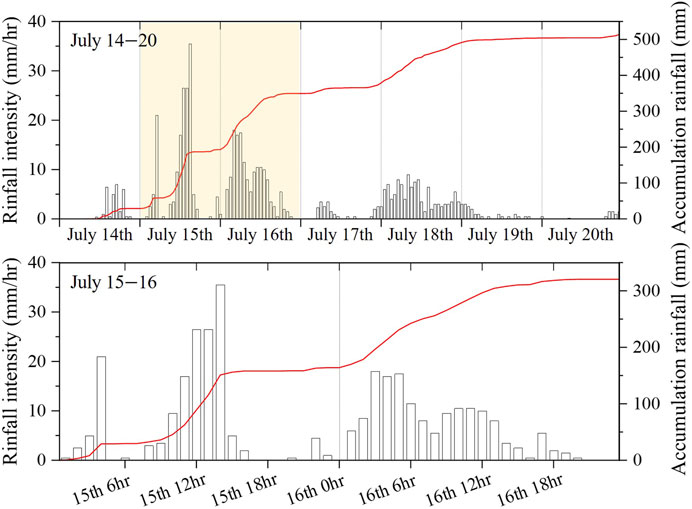
FIGURE 8. Rainfall intensity and accumulation rainfall from 14th 00:00 to 20th 24:00 and 15th 00:00 to 16th 24:00 at Daegwallyeong weather station.
First, to simulate the event, the July 15–16, 2006 rainfall data observed at the Daegwallyeong weather station, which is located closest to Doam dam, were used (Figure 8). In this study, TiVaSS and Deb2D models simulated a series of landslide and debris flow events that occurred in 2006. Based on these simulation results, we evaluated the impact of landslide-debris flow into the Doam dam basin according to the distribution vegetation scenario and evaluated the influence of vegetation. The parameters were calculated based on the field survey (Table 1).
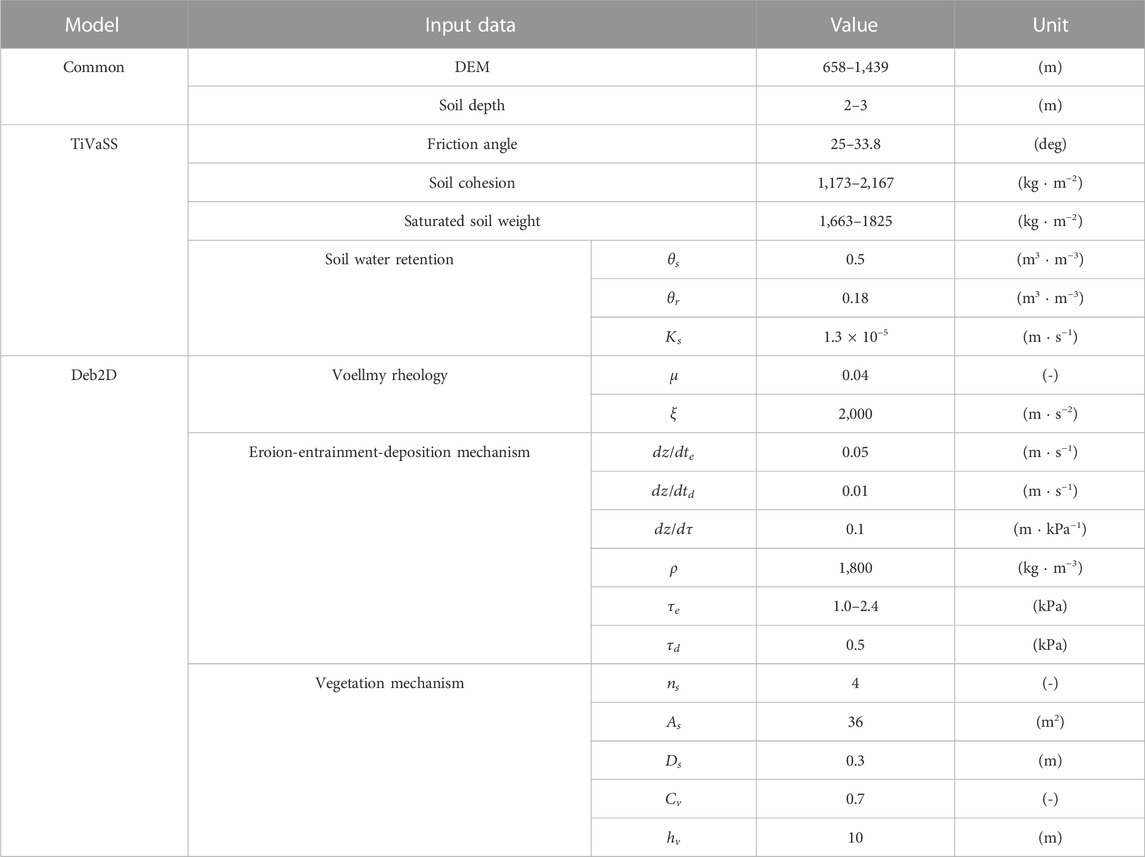
TABLE 1. Parameter settings of models used in this study.
3 Results and discussion
3.1 Scenario analysis
This study simulated the landslide-debris flow event induced by Typhoon Ewiniar in 2006 at the Doam dam basin. However, due to the large scale of the target basin, which covers 144.9 km2, an initial analysis of overall slope stability was performed using a 30 m
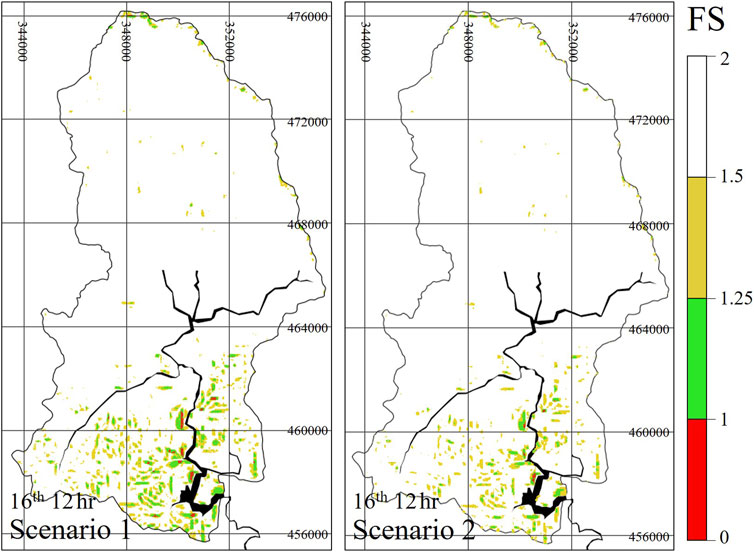
FIGURE 9. Safety-factor (FS) simulation result of Doam dam basin for each vegetation distribution scenario through the low-resolution DEM 30 m by 30 m.
The overall slope stability of the Doam basin analyzed using a low-resolution DEM revealed that the slope would collapse at approximately the 12th hr on the 16th, with many slope failures predicted to occur in the lower part where the Doam dam and lake are located. In scenario 1, which did not consider vegetation, many slopes were analyzed as unstable, particularly near Doam Lake. However, in scenario 2, which considered vegetation, the slopes were analyzed as relatively stable. For precision, we used a high-resolution DEM to perform a detailed analysis of the lower part of the basin, where the areas on the verge of instability were observed.
As shown in Figure 10, the simulation results of the high-resolution DEM indicated that slope failures occurred twice on the lower part of the Doam dam basin at the 10th and 12th hr on the 16th. The collapse occurred near the left bank of the river at the 10th hr and in areas b1 and b2 near the right bank and Doam Lake at the 12 h. In scenario 1, the unstable slopes rapidly increased from the 10th to 12th hr on the 16th. In scenario 2, the influence of vegetation was noticeable, and the slopes previously identified as high-risk areas in scenario 1 were largely stable until the 10th hr. Further, some unstable slopes were observed at the 12th hr. This simulation results reveal that vegetation not only delays the occurrence of slope failures but also reduces their magnitude. Therefore, if vegetation is ignored in the slope stability analysis of areas where vegetation is sufficiently distributed, the risk of slope failures will be overestimated. As illustrated in Figure 6, this phenomenon seems to be due to the increasing cohesion (in Eq. 3) by considering the root reinforcement. As a result, vegetation increased the slope stability (in Eq. 4). The quantitative analysis of these results is summarized in Table 2. For the Doam dam basin, if vegetation were ignored, 297,540 m3 (=2.45 times) of additional slope failures would occur, which is an overestimation. Based on the simulation results shown in Figure 10, this study assumed that debris flow occurred in unstable areas (FS < 1). The a and b2 indicated in Figure 10 demonstrate that TiVaSS well simulated the collapse area in Figures 7A–C, respectively. We analyzed debris flow and the impact on the Doam dam by quantitatively comparing and analyzing the debris flow influx and resulting damage to the Doam dam under different vegetation distribution scenarios.
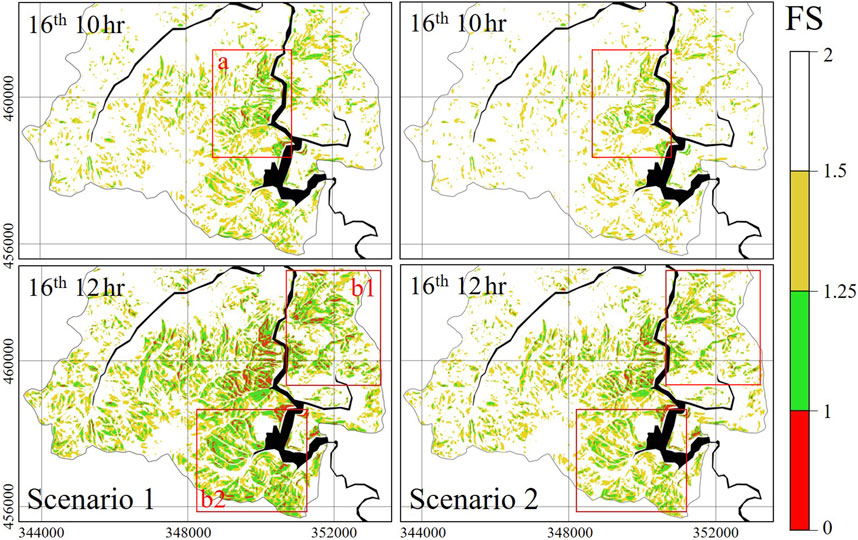
FIGURE 10. Safety-factor (FS) simulation result of the lower Doam dam basin for each vegetation distribution scenario through the high-resolution DEM 10 m by 10 m.
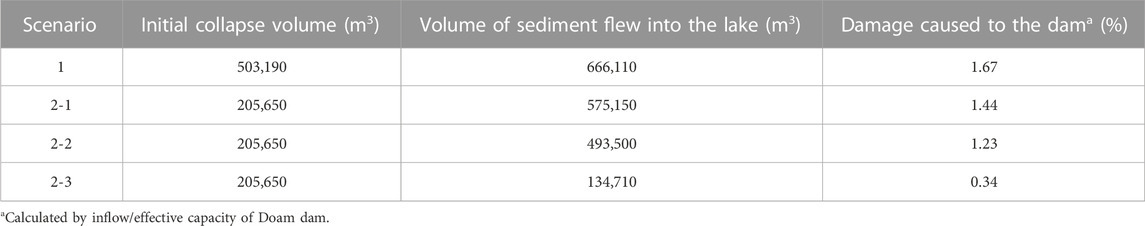
TABLE 2. Simulation results of each vegetation scenario.
In this study, we analyzed the influence of vegetation on the stability analysis and the debris flow analysis models. Based on the simulation results for scenarios 1 and 2 obtained using the TiVaSS model, we divided the two scenarios into three by simulating the presence and absence of vegetation in the debris flow using the Deb2D model. Figure 11 shows the flow height simulation results of the debris flow using a high-resolution DEM, and debris flowed into Doam Lake due to the collapse shown in Figure 10. Scenario 1 in Figure 11 represents the analysis of both TiVaSS and Deb2D models without considering vegetation. Scenario 2-1 presents the effects of considering vegetation in the TiVaSS model but not in the Deb2D model. Scenarios 2-2 and 2-3 represent considering vegetation in both TiVaSS and Deb2D models. We set the critical shear stress as 1.3 kPa in scenario 2-2 and 2.4 kPa in scenario 2-3. Scenarios 1 and 2.1 highlighted the importance of vegetation in slope stability analysis by comparing the amounts of sediment entering the Doam Lake. The importance of vegetation in debris flow analysis was demonstrated through scenarios 2.1 and 2.2/2.3. The debris flows under different vegetation distributions were analyzed based on scenarios 2-2 and 2-3. Scenarios 1 and 2-2/2-3 involved comprehensively evaluating the importance of vegetation in both slope stability and debris flow analysis by comparing the simulation results with and without considering vegetation. As shown in Figure 11, the flow depth of the debris flow decreased under scenario 2-1 compared to under scenario 1, and the deposition range slightly decreased. However, scenario 2.2, in which the vegetation blocked debris flow and increased the critical shear stress 1.3 fold, did not visually differ significantly from scenario 2.1. In scenario 2-3, the flow depth of the debris flow decreased significantly compared to that in other scenarios, and the deposition range decreased significantly. Vegetation effectively reduced the damage caused by landslide-debris flow events by suppressing erosion and entrainment by increasing the critical shear stress rather than simply blocking the flow. Thus, vegetation was more effective in mitigating damage by increasing the critical shear stress rather than by blocking the flow. The quantitative analysis of these results is summarized in Table 2.
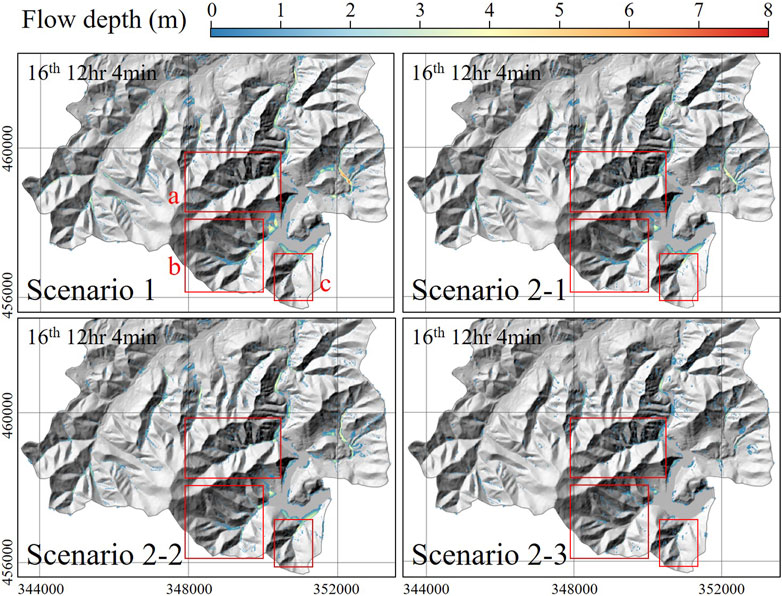
FIGURE 11. Based on the results derived from Figure 10 for each vegetation distribution scenario, simulation results of debris flow height; plotting with landslide-debris flow trace in Figure 7.
As listed in Table 2, a slope collapse of 503,190 m3 resulted in 666,110 m3 of sediment inflow into the Doam Lake in scenario 1, leading to a 1.67% decrease in dam performance. In Scenario 2-1, the TiVaSS model considered vegetation in the Doam dam basin but the Deb2D model did not. Moreover, a slope collapse of 205,650 m3 resulted in 575,150 m3 of sediment inflow, causing a deterioration in function of 1.44%. In Scenario 2-2, in which the TiVaSS and Deb2D models considered vegetation, a slope collapse of 205,650 m3 resulted in 493,500 m3 of sediment inflow into the Doam Lake, causing a function deterioration of 1.23%. In Scenario 2-3, a slope collapse of 205,650 m3 resulted in a sediment inflow of 134,710 m3, causing a 0.34% function deterioration. Four scenarios in Figure 11 illustrate that the Deb2D well simulated the debris flow traces shown in Figures 7A–C. Thus, the TiVaSS and Deb2D models successfully simulated the observed damaged areas traced by satellite images.
When vegetation only was considered in the slope stability analysis, as shown in Figure 12, a substantial reduction of 297,540 m3 in slope collapse was observed compared to that in scenarios where vegetation was not considered. However, in the debris flow analysis, ignoring vegetation produced a minor difference of 90,960 m3 of sediment inflow into Doam Lake. Nevertheless, considering vegetation in both simulation processes reduced the sediment inflow into Doam Lake by 172,610–531,400 m3 compared to when vegetation was ignored in both processes, indicating that vegetation is a critical factor in the analysis of sediment inflow due to landslide-debris flow. As demonstrated in the analysis of scenarios 2-2 and 2-3, even when considering vegetation in the debris flow simulation, the mitigation effect can vary greatly depending on the distribution and type of vegetation. As listed in Table 2, the dam function deterioration caused by landslide-debris flow events can seem relatively insignificant. However, in South Korea, heavy rainfall occurs every year with typhoons, and rainfall intensity is increasing (Kim H. et al., 2021; Yeo et al., 2022). Therefore, considering vegetation is essential when analyzing sediment inflow into the dam/reservoir due to landslide-debris flow over a long period, especially in mountainous areas.
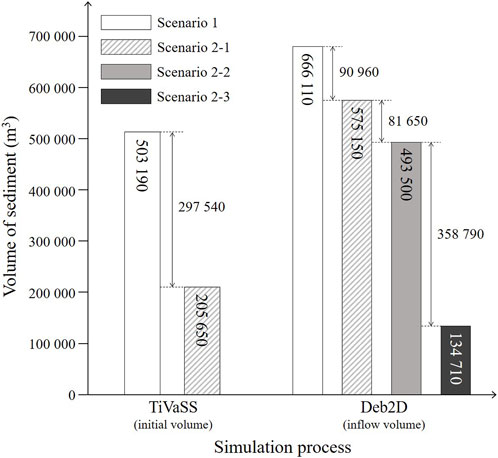
FIGURE 12. Debris flow generation volume and inflow volume to Doam Lake according to the simulation process.
Vegetation increases slope stability and reduces the scale of slope collapse, as shown in Figure 10. Furthermore, it delays collapse and impedes flow and erosion-entrainment processes during debris flow. Therefore, vegetation effectively reduces the damage caused by landslide-debris flow events. This study addressed that increasing the critical shear stress of the topsoil was more effective than blocking the debris flow due to vegetation. It is hard to generalize these simulation results. Therefore, additional research on the role of vegetation in debris flow analysis is necessary.
3.2 Limitation and further study
In this study, TiVaSS and Deb2D models were used to analyze the impact of landslide-debris flow events on dam functions. Additionally, we constructed vegetation distribution scenarios and performed simulation analyses to evaluate the influence of vegetation. We effectively identified the deterioration effects of landslide-debris flow events on dam functions and the effects of vegetation in mitigating damage. However, physical and quantitative comparisons were somewhat limited due to insufficient observational data for validating the simulation results. Thus, collecting data to validate simulation results is necessary to analyze and understand these phenomena.
The commonly used DEM for input data is constructed based on topography, which differs from the actual features of water systems, such as rivers, lakes, and seas, as shown in Figure 13. Therefore, the method used in this study is limited in precisely analyzing the volume of the debris flow that enters lakes, and stimulating the waves generated in the lake due to debris flow is challenging. To accurately analyze the deterioration effects on the dam/reservoir functions and analyze incidents such as the 1963 Vajont dam disaster, additional research, such as that involving a two-layer debris-water system is, necessary. This could solve the problem illustrated in Figure 13.
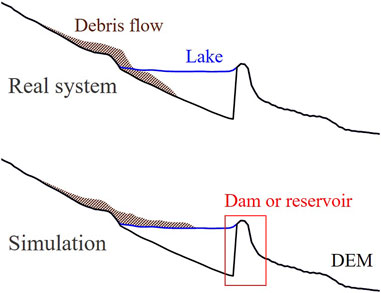
FIGURE 13. Gap between the real system and simulation analysis using DEM.
4 Conclusion
In this study, we analyzed the impact of landslides and debris flows that occurred in the dam basin, which is relatively under-studied. To analyze these phenomena, we used the 3D slope stability analysis model TiVaSS to analyze slope collapse phenomena and the 2D debris flow analysis model Deb2D to analyze the flow of collapsed slopes. Our research focused on the Doam dam basin in South Korea, which has lost its function due to periodic sediment inflows. We simulated the landslide-debris flow events caused by typhoon Ewiniar in October 2006 and made observations based on the satellite data. Additionally, we set scenarios of vegetation distribution within the basin and evaluated the influence of vegetation on slope stability and debris flow.
Based on the simulation results, vegetation distribution increases slope stability and delays slope failure. The slope became more stable against rainfall events through the root reinforcement due to vegetation reinforcing the soil cohesion. Vegetation also helps to mitigate the damage caused by landslide-debris flow by blocking debris flow and preventing volume increases caused by erosion and entrainment processes. Therefore, sufficient vegetation present in the dam or reservoir basin can effectively reduce sediment inflows caused by landslide-debris flow events and maintain the performance and management of the facility. Our study suggests that management of not only the terrain near the dams or reservoirs but also the overall basin is necessary. This kind of research can help establish plans to maintain the performance of dams or reservoirs effectively and in an environmentally friendly way.
Data availability statement
The original contributions presented in the study are included in the article/supplementary material, further inquiries can be directed to the corresponding authors.
Author contributions
SL and HA conceptualized the study. TK helped the model output analyzes. HA and MK reviewed and edited the manuscript. All authors contributed to the article and approved the submitted version.
Funding
This work was supported by the National Research Foundation of Korea (NRF) grant funded by the Korean government (MSIT) (No. 2021R1A2C200553012) and the Basic Research Project of the Korea Institute of Geoscience and Mineral Resources (Project code: 23-3412-1).
Conflict of interest
The authors declare that the research was conducted in the absence of any commercial or financial relationships that could be construed as a potential conflict of interest.
Publisher’s note
All claims expressed in this article are solely those of the authors and do not necessarily represent those of their affiliated organizations, or those of the publisher, the editors and the reviewers. Any product that may be evaluated in this article, or claim that may be made by its manufacturer, is not guaranteed or endorsed by the publisher.
References
An, H., Kim, M., Lee, G., Kim, Y., and Lim, H. (2019). Estimation of the area of sediment deposition by debris flow using a physical-based modeling approach. Quat. Int. 503, 59–69. doi:10.1016/j.quaint.2018.09.049
An, H., Viet, T. T., Lee, G., Kim, Y., Kim, M., Noh, S., et al. (2016). Development of time-variant landslide-prediction software considering three-dimensional subsurface unsaturated flow. Environ. Model. Softw. 85, 172–183. doi:10.1016/j.envsoft.2016.08.009
An, H., and Yu, S. (2014). Finite volume integrated surface-subsurface flow modeling on nonorthogonal grids. Water Resour. Res. 50, 2312–2328. doi:10.1002/2013WR013828
Bartelt, P., Buehler, Y., Christen, M., Deubelbeiss, Y., Graf, C., and McArdell, B. W. (2013). RAMMS–rapid mass movement simulation, A modeling system for debris flows in research and practice, user manual v1.5, debris flow, manuscript update: 31 january 2013. available at: http://ramms.slf.ch/ramms/downloads/RAMMS_DBF_ Manual. pdf.
Baum, R. L., Savage, W. Z., and Godt, J. W. (2008). TRIGRS—a Fortran program for transient rainfall infiltration and grid-based regional slope-stability analysis, version 2.0. Reston, Virginia, USA: U.S. Geological Survey Open-File Report.
Casagli, N., Fanti, R., Nocentini, M., and Righini, G. (2005). Assessing the capabilities of VHR satellite data for debris flow mapping in the Machu Picchu area (C101-1). Landslides Risk Anal. Sustain. Disaster Manag. 61, 61–70. doi:10.1007/3-540-28680-2_6
Chok, Y. H., Jaksa, M. B., Kaggwa, W. S., and Griffiths, D. V. (2015). Assessing the influence of root reinforcement on slope stability by finite elements. Int. J. Geoengin. 6, 12–13. doi:10.1186/s40703-015-0012-5
Christen, M., Kowalski, J., and Bartelt, P. (2010). Ramms: Numerical simulation of dense snow avalanches in three-dimensional terrain. Cold Reg. Sci. Technol. 63, 1–14. doi:10.1016/j.coldregions.2010.04.005
Dietrich, W. E., and Montgomery, D. R. (1998). Shalstab: A digital terrain model for mapping shallow landslide potential. California, USA: Univ. Calif.
Frank, F., McArdell, B. W., Huggel, C., and Vieli, A. (2015). The importance of entrainment and bulking on debris flow runout modeling: Examples from the Swiss alps. Nat. Hazards Earth Syst. Sci. 15, 2569–2583. doi:10.5194/nhess-15-2569-2015
Haeberlin, Y., Turberg, P., Retière, A., Senegas, O., and Parriaux, A. (2004). Validation of Spot-5 satellite imagery for geological hazard identification and risk assessment for landslides, mud and debris flows in Matagalpa, Nicaragua. Int. Soc. Photogramm. Remote Sens. Spat. Inf. Sci. 35, B1.
Hong, M., Jeong, S., and Kim, J. (2020). A combined method for modeling the triggering and propagation of debris flows. Landslides 17, 805–824. doi:10.1007/s10346-019-01294-5
Hui, E. Q., Hu, X. E., Jiang, C. B., and Zhu, Z. D. (2010). A study of drag coefficient related with vegetation based on the flume experiment. J. Hydrodyn. Ser. B 22, 329–337. doi:10.1016/S1001-6058(09)60062-7
Hungr, O. (1995). A model for the runout analysis of rapid flow slides, debris flows, and avalanches. Can. Geotech. J. 32, 610–623. doi:10.1139/t95-063
ICOLD, (2009). Sedimentation and sustainable use of reservoir and river systems. Draft ICOLD Bulletin. Paris, France: International Committee on Large Dams.
Iverson, R. M. (2000). Landslide triggering by rain infiltration. Water Resour. Res. 36, 1897–1910. doi:10.1029/2000WR900090
Julian, J. P., and Torres, R. (2006). Hydraulic erosion of cohesive riverbanks. Geomorphol 76, 193–206. doi:10.1016/j.geomorph.2005.11.003
Kang, T., Jang, C. L., Kimura, I., and Lee, N. (2022). Numerical simulation of debris flow and driftwood with entrainment of sediment. Water 14, 3673. doi:10.3390/w14223673
Kim, H., Lee, J., Park, H., and Heo, J. (2021a). Assessment of temporal probability for rainfall-induced landslides based on nonstationary extreme value analysis. Eng. Geol. 294, 106372. doi:10.1016/j.enggeo.2021.106372
Kim, S., Chun, K., Kim, M., Catani, F., Choi, B., and Seo, J. (2021b). Effect of antecedent rainfall conditions and their variations on shallow landslide-triggering rainfall thresholds in South Korea. Landslides 18, 569–582. doi:10.1007/s10346-020-01505-4
Lai, J., Wang, G., Wang, Z., Chen, J., Pang, X., Wang, S., et al. (2018). A review on pore structure characterization in tight sandstones. Earth-Sci. Rev. 177, 436–457. doi:10.1016/j.earscirev.2017.12.003
Lee, J. K., Roig, L. C., Jenter, H. L., and Visser, H. M. (2004). Drag coefficients for modeling flow through emergent vegetation in the Florida Everglades. Ecol. Eng. 22, 237–248. doi:10.1016/j.ecoleng.2004.05.001
Lee, S., An, H., Kim, M., Lee, G., and Shin, H. (2022a). Evaluation of different erosion–entrainment models in debris-flow simulation. Landslides 19, 2075–2090. doi:10.1007/s10346-022-01901-y
Lee, S., An, H., Kim, M., Lim, H., and Kim, Y. (2022b). A simple deposition model for debris flow simulation considering the erosion–entrainment–deposition process. Remote Sens. 14, 1904. doi:10.3390/rs14081904
Liu, W., and He, S. (2020). Comprehensive modelling of runoff-generated debris flow from formation to propagation in a catchment. Landslides 17, 1529–1544. doi:10.1007/s10346-020-01383-w
Lu, N., and Likos, W. J. (2006). Suction stress characteristic curve for unsaturated soil. J. Geotech. Geoenvironmental Eng. 132, 131–142. doi:10.1061/(ASCE)1090-0241(2006)132:2(131)
Martha, T. R., Roy, P., Khanna, K., Mrinalni, K., and Kumar, K. V. (2019). Landslides mapped using satellite data in the Western Ghats of India after excess rainfall during August 2018. Curr. Sci. 117, 804–812. doi:10.18520/cs/v117/i5/804-812
Mergili, M., Fischer, J. T., Krenn, J., and Pudasaini, S. P. (2017). r.avaflow v1, an advanced open-source computational framework for the propagation and interaction of two-phase mass flows. Geosci. Model Dev. 10, 553–569. doi:10.5194/gmd-10-553-2017
Mondini, A. C., Chang, K. T., and Yin, H. Y. (2011). Combining multiple change detection indices for mapping landslides triggered by typhoons. Geomorphol 134, 440–451. doi:10.1016/j.geomorph.2011.07.021
Nian, T., Wu, H., Takara, K., Li, D., and Zhang, Y. (2021). Numerical investigation on the evolution of landslide-induced river blocking using coupled DEM-CFD. Comput. Geotech. 134, 104101. doi:10.1016/j.compgeo.2021.104101
O’Brien, J. S., Julien, P. Y., and Fullerton, W. T. (1993). Two-dimensional water flood and mudflow simulation. J. Hydraul. Eng. 119, 244–261. doi:10.1061/(ASCE)0733-9429(1993)119:2(244)
Shan, Z., Wu, H., Ni, W., Sun, M., Wang, K., Zhao, L., et al. (2022). Recent technological and methodological advances for the investigation of submarine landslides. J. Mar. Sci. Eng. 10 (11), 1728. doi:10.3390/jmse10111728
Shen, P., Zhang, L. M., Chen, H. X., and Gao, L. (2017). Role of vegetation restoration in mitigating hillslope erosion and debris flows. Eng. Geol. 216, 122–133. doi:10.1016/j.enggeo.2016.11.019
Tang, H., Tian, Z., Yan, J., and Yuan, S. (2014). Determining drag coefficients and their application in modelling of turbulent flow with submerged vegetation. Adv. Water Resour. 69, 134–145. doi:10.1016/j.advwatres.2014.04.006
Tran, T. V., Lee, G., An, H., and Kim, M. (2017). Comparing the performance of TRIGRS and TiVaSS in spatial and temporal prediction of rainfall-induced shallow landslides. Environ. Earth Sci. 76, 315–316. doi:10.1007/s12665-017-6635-4
Wu, H., Nian, T., Shan, Z., Li, D., Guo, X., and Jiang, X. (2023). Rapid prediction models for 3D geometry of landslide dam considering the damming process. J. Mt. Sci. 20, 928–942. doi:10.1007/s11629-022-7906-z
Yeo, M., Nguyen, V., Kim, Y., and Kpodonu, T. (2022). An integrated extreme rainfall modeling tool (SDExtreme) for climate change impacts and adaptation. Water Resour. Manag. 36, 3153–3179. doi:10.1007/s11269-022-03194-1
Zhao, Y., Meng, X., Qi, T., Li, Y., Chen, G., Yue, D., et al. (2022). AI-based rainfall prediction model for debris flows. Eng. Geol. 296, 106456. doi:10.1016/j.enggeo.2021.106456
Keywords: landslides, debris flow, vegetation, dam, numerical modeling
Citation: Lee S, An H, Kim M and Kang T (2023) Assessment of dam function deterioration due to landslide-debris flows: numerical modeling based on vegetation distribution scenarios. Front. Earth Sci. 11:1216096. doi: 10.3389/feart.2023.1216096
Received: 03 May 2023; Accepted: 26 June 2023;
Published: 04 July 2023.
Edited by:
E. Bruce Pitman, University at Buffalo, United StatesCopyright © 2023 Lee, An, Kim and Kang. This is an open-access article distributed under the terms of the Creative Commons Attribution License (CC BY). The use, distribution or reproduction in other forums is permitted, provided the original author(s) and the copyright owner(s) are credited and that the original publication in this journal is cited, in accordance with accepted academic practice. No use, distribution or reproduction is permitted which does not comply with these terms.
*Correspondence: Hyunuk An, aHl1bnVrQGNudS5hYy5rcg==; Minseok Kim, bWluc2Vva19raW1Aa2lnYW0ucmUua3I=