 Ahmed M. Eldosouky1,2*
 Stephen E. Ekwok3
 Ubong C. Ben3
 Christian A. Ulem3
 Kamal Abdelrahman4
 David Gomez-Ortiz5
 Anthony E. Akpan3Anthony Michael George3
 Luan Thanh Pham6*
- 1Department of Geology, Suez University, Suez, Egypt
- 2Academy of Scientific Research and Technology, Cairo, Egypt
- 3Applied Geophysics Programme, Department of Physics, University of Calabar, Calabar, Nigeria
- 4Department of Geology and Geophysics, College of Science, King Saud University, Riyadh, Saudi Arabia
- 5Department of Biology and Geology, Physics and Inorganic Chemistry, Escuela Superior de Ciencias Experimentales y Tecnología (ESCET), Universidad Rey Juan Carlos, Madrid, Spain
- 6Department of Geophysics, Faculty of Physics, University of Science, Vietnam National University, Hanoi, Vietnam
The Abakaliki Anticlinorium and its adjoining areas were appraised with the object of delineating high geothermal potential zones. Spectral depth analysis involving an improved centroid technique was used to analyze high-quality magnetic data. The obtained geothermal parameters were gridded to map various geothermal features within the investigated area. The obtained results varied from 4.99–9.35 km, 2.31–6.15 km, 6.11–16.28 km, 35.63°C–94.93°C/km, and 89.07–237.32 mW/m2 for centroid depth, top depth, Curie point depth, geothermal gradient, and heat flow values, respectively. The delineated semioval structure in the central zone of the investigated region characterized by a shallow Curie point depth (< 8.5 km) correlates with the location of the high-heat flow (>191.0 mW/m2) and geothermal gradient (>74.0°C/km) region. The high geothermal potential of the region is triggered by the massive post-rift tectonic event of the Santonian period related to the Abakaliki Anticlinorium. Further geophysical exploration programs should be carried out before exploitation activities at anomalous geothermal regions.
1 Introduction
Due to challenging energy difficulties in Nigeria, where the demand for electrical power generated from hydropower and hydrocarbon plants exceeds the supply, alternative energy sources (preferentially renewable) are being extensively explored. On the whole, researchers (Nwachukwu, 1976; Avbovbo, 1978; Babalola, 1984) have previous reported the imprints of geothermal resources in the form of warm springs in Nigeria. The Abakaliki Anticlinorium, which is the main constituent unit of the Lower Benue Trough (LBT) like the Anambra Basin, Calabar Flank, and the Afikpo Syncline, is dominated by Santonian intrusions, hydrothermal modification, geologic features, brine fields, and related rift mineralization (Adewumi and Oladoyin, 2015; Ekwok et al., 2020a; Ekwok et al., 2020b; Ephraim et al., 2022).
For some decades, intense geophysical and geological investigations have been carried out in the LBT (Ofoegbu and Onuoha, 1991; Ekwok et al., 2019). Previous studies in the Abakaliki Anticlinorium and contiguous inland basins focused on the exploration for lead–zinc (Mackay, 1946; Bogue and Reynolds, 1951; Farrington, 1952; Dim, 2021; Ani et al., 2023), coal (Simpson, 1955; De Swardt and Casey, 1963), barites (Akpan et al., 2014), brine fields (Eseme et al., 2002; Tijani, 2004; Ekwok et al., 2022a), limestone (Akpan et al., 2004), and hydrocarbon (Ofoegbu and Onuoha, 1991). Recent studies in the Nigerian Benue Trough focused on reconnaissance exploration activities for geothermal energy (Abraham et al., 2015; Nwankwo, 2015; Abraham and Nkitnam, 2017; Chukwu et al., 2018; Abraham et al., 2019; Abdullahi and Kumar, 2020; Ejiga et al., 2022; Alfaifi et al., 2023; Ekwok et al., 2023). These contemporary geoscience studies involved the use of the magnetic surveying technique (Essa et al., 2021; Mehanee et al., 2021). Other geophysical procedures (such as electrical resistivity, gravity, bottom-hole temperature (BHT), seismic, transient electromagnetic, and magnetotelluric processes) are also applied in geothermal energy research and monitoring (Nwachukwu, 1975; Nwachukwu, 1976; Ndombi, 1981; Simiyu and Keller, 1997; Mariita, 2010; Coppo et al., 2015; Ars et al., 2019; Saibi et al., 2021). Nevertheless, high-resolution magnetic data and good geologic knowledge are frequently used in tandem to address uncertainties during the interpretation (Mariita, 2010). Largely, magnetic technology is the most cost-effective geophysical method for acquiring an adequate model for a geothermal structure (Mohammadzadeh-Moghaddam et al., 2016). Yet, this model can be nonunique, which is unexpected in the exploration of geophysics (Mehanee, 2022). Nevertheless, an inverse problem usually connected with magnetic data is often ill-posed, thus making the solution nonunique and unstable (Essa and Elhussein, 2017). However, a reliable solution for an ill-posed problem can be realized by having prior geologic knowledge or the application of some cutting-edge enhancement methods (Essa and Elhussein, 2018).
In this study, magnetic data, which probe different rock properties (Ross et al., 2013; Ekwok et al., 2019; Jackish et al., 2019; Ekwok et al., 2022b), were applied to obtain useful information on buried geothermal anomalies (Abraham et al., 2019) related to the Santonian Abakaliki Anticlinorium and surrounding regions. This geophysical method has been effective in locating faults and fracture zones related to geothermal reservoirs, defining a basement framework in a geothermal region (Nishijimaa and Naritomi, 2017; Witter et al., 2017), and intrusive bodies (Ekwok et al., 2021a) and magma chambers related to the heat source of a geothermal system (Represas et al., 2013). Moreover, the magnetic technique can be used in the mapping of zones with reduced magnetization caused by thermal activities (Georgsson, 2009). It is also a suitable method for hydrothermal system assessment and mapping of buried anomalies caused by magmatic and granitic bodies including geologic features (Ekwok et al., 2022c). Such regions are characterized by different magnetizations from the unaltered host rocks (Abraham et al., 2019). The power spectrum involving the improved centroid technique (Bhattacharyya and Morley, 1965; Lazarian and Esquivel, 2003; Bansal et al., 2011) was employed in the magnetic data to obtain the Curie point depth (CPD), geothermal gradient, and heat flow gridded maps. The computation of these three spectral parameters from the same magnetic data will considerably enhance the dependability of geothermal results. In regions like the Abakaliki Anticlinorium, where deep borehole data are lacking, Curie depth results from magnetic data can be used to map geothermal anomalies (Bansal et al., 2011; Bansal et al., 2013; Salem et al., 2014; Bansal et al., 2016; Abdullahi and Kumar, 2020).
Curie depth is commonly estimated from magnetic data using a spectral analysis approach based on randomly uncorrelated and fractal source distributions (Bansal et al., 2011; Bansal et al., 2016; Ravat et al., 2016). Bansal et al. (2011) presented a robust method for Curie depth estimation by incorporating a fractal parameter into the traditional method proposed by Bhattacharyya and Leu (1977). The improved centroid procedure involves the approximation of the top to the buried magnetic source and estimating the centroid depth to the magnetic anomaly (Bansal et al., 2011). This technique, which has a comparative advantage over conventional techniques (Bansal et al., 2016), allowed the calculation of the depth to the bottom of the magnetic sources. It provides better estimates from the power spectrum plots (log) (Lazarian and Esquivel, 2003; Bansal et al., 2011).
2 Location and geologic setting of the investigated area
The investigated area, which is part of the LBT, covers some parts of the Tertiary-Recent Benin Formation, and Abakaliki Anticlinorium (Figure 1). The study area is bordered in the west, southwest, and south by the Tertiary-Recent Benin Formation. The study location is positioned between longitudes 6,030′E and 8,000′E and latitudes 5,000′N and 7,000′N.
FIGURE 1. Geologic map of the study area.
The sequence of events that resulted in the development of the Benue Trough and its component units has been previously reported (Onuoha and Ofoegbu, 1988). A thick Cretaceous sedimentary sequence occupies the LBT and sits on the granitic and magmatic rocks of the Precambrian basement (Akpan et al., 2014; Akpan et al., 2018). The Albian Asu River Group (ARG), which is composed of bluish–black sandstone units, sits on the Precambrian basement. Overlying the ARG is the Eze-Aku Formation (EAF) composed of sandy and shelly limestones, calcareous shales and siltstones, and calcareous sandstones (Reyment, 1965). The Awgu Shales are marine fossiliferous, gray–bluish shales, limestones, and calcareous sandstones of the Coniacian age. They are covered by the Nkporo Shales (Campanian), which are mostly marine, with some arenaceous sandstone members. Generally, the sedimentary sequences are severely affected by large-scale tectonic events, which occurred in two stages and culminated in the folding of the sediments (Nwachukwu, 1972). The folding episode that occurred in the Santonian period is the main cause of the development of the Abakaliki Anticlinorium. The asymmetry and reversed faults relating to the folds that were formed during this period reveal that they were primarily compressional. Benkhelil (1988) described the Abakaliki Anticlinorium events as a complete orogenic cycle involving sedimentation, magmatism, metamorphism, and compressive tectonics. The associated magmatic events cause the injection of several intrusive bodies into the EAF and ARG.
The sediments of the Abakaliki Anticlinorium (that is, the folded EAF and the ARG) are unconformably placed on top by the Nkporo Shale (Whiteman, 1982). Overlying the Nkporo Shale is the Benin Formation, which consists primarily of porous sands and gravels of varying grain sizes intercalated with thin clay and shale beds (Akpabio and Eyenaka, 2008). Deposits of recent alluvium and beach ridge sands can be found along the shores and estuaries of the Imo and Kwa Ibo rivers, including the flood plains of the creeks (Akpabio and Ekanem, 2009).
3 Materials and methods
3.1 Data acquisition
Fugro Airborne Surveys, Canada, acquired high-quality aeromagnetic data between 2005 and 2010. The data were acquired using a Flux Adjusting Surface Data Assimilation System with a flight-line space of 0.1 km, tie-line space of 0.5 km, and terrain clearance ranging from 0.08 to 0.1 km. Moreover, Fugro Airborne Surveys, Canada, subtracted the regional field from the magnetic data using the 10th (10th) generation of the International Geomagnetic Reference Field (IGRF). The main benefit of the IGRF is the consistency they provide in magnetic field survey practice, which began when the IGRF was made available and widely accepted (Reeves et al., 1997). The data employed in this research were processed into total magnetic intensity (TMI) gridded data. Since the data were collected at low latitude, the magnetic data were reduced to the equator (RTE) (Figure 2). Jain (1988) and Leu (1981) reported that RTE creates more dependable results, particularly at the middle and lower latitudes. The high-quality data were characterized by mean inclination, declination, and total field values of −16.40°, −2.57°, and 32,865.96 nT, respectively.
FIGURE 2. Total magnetic intensity data reduced to the equator.
3.2 Spectral analysis involving the centroid depth method
Spectral analysis using the centroid method (or spectral peak technique) is an effective tool used in the determination of CPD all over the world (Tanaka et al., 1999; Tanaka, 2017). It is often applied using the azimuthally mean power spectrum of magnetic anomalies (Tanaka, 2017; Wang and Liu, 2018). At low wavenumbers, the spectral peak method is based on determining the precise wavenumber of the spectral peak (Ross et al., 2006). In practice, however, most logarithmic power spectra of magnetic anomalies do not exhibit spectral peaks (Bouligand et al., 2009). The centroid technique applied in this research, rather than locating the spectral peak, is based on fitting the slope of the high- and low-wavenumber bands to calculate the top and bottom depths of the magnetic layer (Tanaka et al., 1999). The technique applied here is similar to the technique proposed by Spector and Grant (1970). The top bound and the centroid of a magnetic source, Zt and Z0, respectively, are computed from the power spectrum of magnetic anomalies and applied to approximate the basal depth of a magnetic source Zb.
Assuming that the layer extends infinitely in all horizontal directions, the depth to the top bound of a magnetic source is small compared with the horizontal scale of a magnetic source, and magnetization M(x,y) is a random function of x and y, Spector and Grant (1970) introduced the power–density spectra of the total field anomaly Φ∆T:
where
where A is a constant. For wavelengths less than about twice the thickness of the layer, Eq. 3 approximately becomes
where B is a constant. We could estimate the top bound of a magnetic source by the slope of the power spectrum of the total filed anomaly. On the other hand, Eq. 3 can be rewritten as
where C is a constant. At long wavelengths, Eq. 5 becomes
where 2days is the thickness of the magnetic source. From Eq. 6,
where D is a constant. We could estimate the top bound and the centroid of the magnetic source by fitting a straight line through the high-wavenumber and low-wavenumber parts of the radially averaged spectrum of
The obtained basal depth of the magnetic source is assumed to be the Curie point depth. The obtained Curie point depth reflects the average value of the area. If magnetization in Earth’s crust is arbitrarily and uncorrelatedly distributed, the mean azimuthal power spectrum can be employed to compute Zt and Zb by Eqs 6–8.
Fourier’s law is a central relationship when considering conductive heat conveyance [53]. Fourier’s law assumes the following form in the 1D case, supposing a vertical direction for temperature disparity and a constant temperature gradient dT/dz, where q is the heat flux and k is the coefficient of thermal conductivity.
The Curie temperature (θ) can be well defined as
where Zb is the CPD, supposing there are no heat sources or heat sinks between Earth’s surface and the CPD, dT/dz is constant, and the surface temperature is 0°C. Spector and Grant (1970) proved that any particular depth to a thermal isotherm is in reverse proportion to heat flow. Eqs 9, 10 were used to calculate HF and GG values, which were based on CPD estimates derived from magnetic computations. We utilize the Curie point (h) for magnetite (580°C) with an average thermal conductivity of 1.80 and 2.5 Wm-1 k−1 for regions of sedimentary shale formation and igneous rock/older granite (Abraham et al., 2019), respectively.
4 Results
Some geophysical techniques are powerful tools in mapping geological structures (Pham et al., 2022; Kamto et al., 2023; Pham and Prasad, 2023; Xayavong et al., 2023) and in the appraisal of the lateral extent of several high-temperature geothermal anomalies in young volcanic rocks (Ben et al., 2022a; Ben et al., 2022b). Analysis of magnetic data can offer models that indicate concealed paleo-permeability structures (that is, ancient geologic structures that have influenced the permeability of subsurface formations relating to the geological past) and the magnitude of hydrothermally demagnetized rocks (Ejiga et al., 2022). These paleo-permeable structures, such as fault zones, karst systems, fractures, joints, and shear zones, play a vital role in subsurface fluid migration and resource distribution (Johnson et al., 2016; Smith et al., 2018), as well as serve as weak zones for igneous intrusions (Alfaifi et al., 2023). To ensure that large and small geothermal anomalies are properly mapped, the magnetic data (Figure 2) of the investigated area were divided into 266 spectral blocks with a 50% overlap of each block. The power–spectrum plot was generated for each block, and the associated parameters like Zc, Zot, Zb, GG, and HF were obtained (Table 1), which were then gridded.
TABLE 1. Geothermal parameters obtained from magnetic data.
Table 1 shows that the result of the centroid depth (Zc) varies from 4.99–9.35 km, with an average value of 6.49 km, whereas the top depth (Zot) ranged from 2.31 to 6.15 km, with a mean of 4.00 km. The Zot (2.31–6.15 km), which is like the depth to the basement (Lawal and Nwankwo, 2017), lies within the range of depth solutions reported by previous studies in the LBT (Ekwok et al., 2021b; Ekwok et al., 2021c). The CPD (or Zb) of the investigated area ranged from 6.0 to 15.28 km, and mean values were 8.96 km. The gridded results (Figure 3) indicate low CPD dominance (red) in the central area with a somewhat E–W trend. The geothermal gradient result (Table 1) varied from 35.63°C to 94.93°C/km, and the mean was 67.17°C/km. Furthermore, heat flow varied from 89.09–237.32 mW/m2 with a mean of 168.94 mW/m2. Semioval structures in the central part of the investigated area (Figure 4; Figure 5) reveal a region of high geothermal gradient and heat flow. In general, it was stated by previous research that CPD and other associated parameters rely on geological events (Lawal and Nwankwo, 2017; Ejiga et al., 2022).
FIGURE 3. Curie point depth map.

FIGURE 4. Geothermal gradient map.
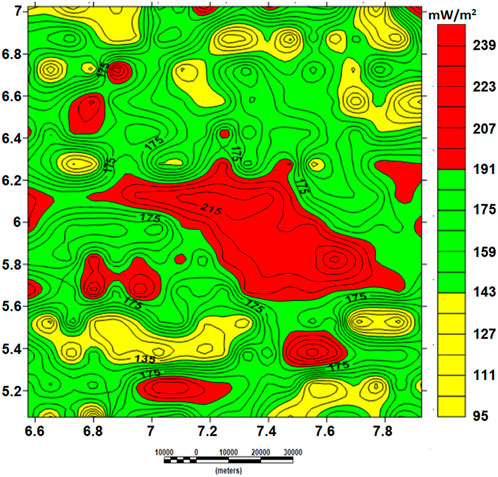
FIGURE 5. Heat flow map.
5 Discussion
Potential field methods are effective procedures in mapping geothermal reservoirs (Nishijimaa and Naritomi, 2017; Abdelrahman et al., 2023; Ekwok et al., 2023) and related geothermal systems (Represas et al., 2013). One of the great advantages of the spectral analysis technique is that it does not require the average interface depth, magnetization vector, and low-pass filter compared with the magnetic inversion (Hang et al., 2019; Pham et al., 2019; Pham et al., 2020). The range of the CPD (6.11–16.28 km) obtained from the investigated area was detected to be lower than the CPD range (9–20 km) stated by Abraham et al. (2019). The GG result of 35.63°C–94.93°C/km observed in this study area is somewhat higher than the previous result (29.0°C–45.8°C/km) of the area (Onuoha and Ekine, 1999; Abraham et al., 2019). The shallow CPD region (Figure 3), which has somewhat E–W orientation, divides the investigated area into sections. The northwestern and northeastern flanks match with the Anambra Basin and Ogoja Syncline (Ekwok et al., 2022a), respectively, whereas the southern part correlates with the Afikpo Syncline. These regions are depocenters (Abraham et al., 2019) characterized by some pockets of relatively low GG and HF (Figure 4; Figure 5). Furthermore, the observed HF values (89.07–237.32 mW/m2) are considerably higher than the results obtained by Abraham et al. (2019) and Onuoha and Ekine (1999). Abraham et al. (2015) and Sharma (2004) reported that areas with HF values >80 mW/m2 reveal a geothermal anomaly in the subsurface. The mapped semioval structure (Figure 4; Figure 5), which coincides with shallow CPD, corresponds to the high-HF (>195 mW/m2) and -GG (>80°C/km) region (red color). It shows the prolific nature of the geothermal resources (Abraham et al., 2019) of the investigated area triggered by Santonian intrusions associated with the Santonian AA (Ekwok et al., 2020b; Ekwok et al., 2021a; Ekwok et al., 2021b; Ekwok et al., 2022a). The 3D evaluations of CPD, GG, and HF (Figure 6) show spike regions dominated by high geothermal potentials. The shallow CPD zones (< 8 km) characterized by spikes (Figure 6A) coincide fairly well with the positions of high-GG (Figure 6B) and -HF regions (Figure 6C). According to Bansal et al. (2011), potential geothermal areas are dominated by high-temperature gradient, high HF, and shallow CPD. Additionally, the igneous-related hydrothermal fluids of the area are believed to be the main source of brine fields (Ekwok et al., 2022b; 2021c; 2020a; 2019) and lead–zinc mineralization of the LBT (Farrington, 1952; Akpan et al., 2014; Ekwok et al., 2022a).
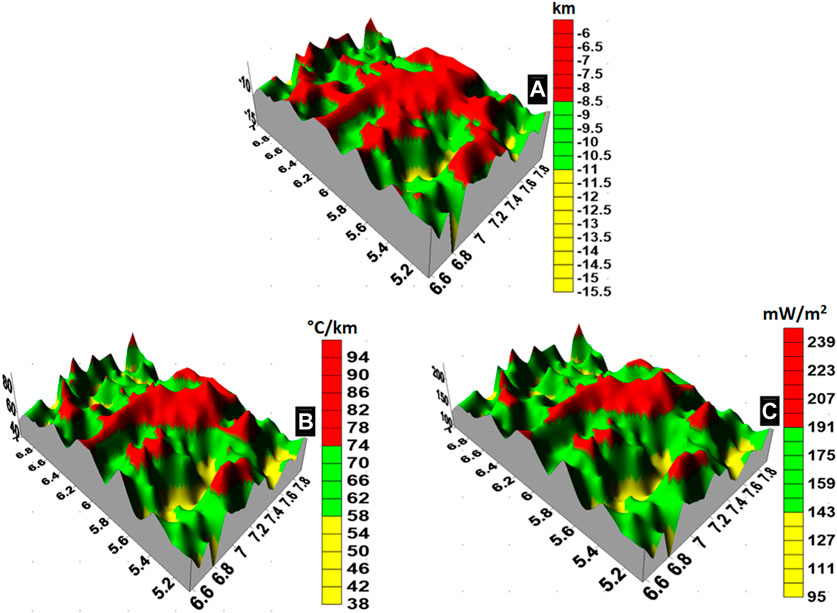
FIGURE 6. (A) 3D Curie point depth, (B) geothermal gradient, and (C) heat flow models obtained from magnetic and gravity data, respectively.
Further investigations in the delineated high geothermal zone involving bottom-hole temperature (BHT), seismic, transient electromagnetic (TEM), or magnetotelluric methods should be carried out.
6 Conclusion
Magnetic data involving spectral depth analysis procedures were analyzed to delineate the geothermal resources of the Abakaliki Anticlinorium and surrounding zones. The centroid depth, top depth, Curie point depth, geothermal gradient, and heat flow values varied from 4.99 to 9.35 km, 2.31 to 6.15 km, 6.11 to 16.28 km, 35.63°C to 94.93°C/km, and 89.07 to 237.32 mW/m2, respectively. The delineated geothermal anomalous zone (Figures 3–6) dominated by a semioval shape reveals the position of shallow-CPD (< 8.5 km), high-HF (>191 mW/m2), and high-GG (>74°C/km) areas. The CPD values are slightly lower, while GG and HF values are relatively higher than those in previous studies carried out in the Benue Trough. However, the top depth result matches very well with previous depth solutions of the studied area. On the whole, the shallow CPD zone is bordered by low geothermal areas of the Anambra Basin, Ogoja Syncline, and Afikpo Syncline in the northwest, northeast, and southern portions, respectively, of the investigated area.
Data availability statement
The original contributions presented in the study are included in the article/Supplementary Material; further inquiries can be directed to the corresponding authors.
Author contributions
AE contributed to writing, scientific development, result interpretation, and review. SE contributed to writing, result interpretation, and data curation and performed the computations. UB contributed to writing and figure preparation and performed the computations. CU contributed to writing and scientific development. KA, DG-O, AA, and AG reviewed, provided critical feedback, and helped shape the research. LP contributed to scientific development, reviewed, provided critical feedback, and helped shape the research. All authors contributed to the article and approved the submitted version.
Acknowledgments
Deep thanks and gratitude to the Researchers Supporting Project number (RSP2023R351), King Saud University, Riyadh, Saudi Arabia for funding this research article.
Conflict of interest
The authors declare that the research was conducted in the absence of any commercial or financial relationships that could be construed as a potential conflict of interest.
Publisher’s note
All claims expressed in this article are solely those of the authors and do not necessarily represent those of their affiliated organizations, or those of the publisher, the editors, and the reviewers. Any product that may be evaluated in this article, or claim that may be made by its manufacturer, is not guaranteed or endorsed by the publisher.
References
Abdelrahman, K., Ekwok, S. E., Ulem, C. A., Eldosouky, A. M., Al-Otaibi, N., Hazaea, B. Y., et al. (2023). Exploratory mapping of the geothermal anomalies in the Neoproterozoic Arabian Shield, Saudi Arabia, using magnetic data. Minerals 13 (5), 694. doi:10.3390/min13050694
Abdullahi, M., and Kumar, R. (2020). Curie depth estimated from high-resolution aeromagnetic data of parts of lower and middle Benue trough (Nigeria). Acta Geod. Geophys. 55, 627–643. doi:10.1007/s40328-020-00314-4
Abraham, E., Itumoh, O., Chukwu, C. H., and Rock, O. N. (2019). Geothermal energy reconnaissance of Southeastern Nigeria from analysis of aeromagnetic and gravity data. Pure Appl. Geophys., 176, 1615–1638. doi:10.1007/s00024-018-2028-1
Abraham, E. M., and Nkitnam, E. E. (2017). Review of geothermal energy research in Nigeria: The geoscience front. Int. J. Earth Sci. Geophys. 3, 0–15. doi:10.35840/2631-5033/1815
Abraham, E. M., Obande, E. G., Chukwu, M., Chukwu, C. G., and Onwe, M. R. (2015). Estimating depth to the bottom of magnetic sources at Wikki Warm Spring region, northeastern Nigeria, using fractal distribution of sources approach. Turk J. Earth Sci. 24 (5), 494–512. doi:10.3906/yer-1407-12
Adewumi, A. J., and Oladoyin, A. (2015). Field geology of Nigeria report for 2015/2016 academic session. Owo, Ondo State: Department of Geological Sciences, Achievers University.
Akpabio, E. A., and Ekanem, E. M. (2009). Water uncertainties in Southeastern Nigeria: Why government should be interested in management. Int. J. Sociol. Anthropol. 2 (2), 38–46. doi:10.5897/IJSA.9000102
Akpabio, I. O., and Eyenaka, F. D. (2008). Aquifer transmissivity determination using geoelectric sounding data at Uyo, Southern part of Nigeria. Int. J. Pure Appl. Sci. Sci. Afr. 7 (1), 81–90.
Akpan, A. E., Chidomerem, T. E., and Akpan, I. O. (2004). Geophysical and laboratory studies of the spread and quality of the Odukpani limestone deposit. Am. J. Environ. Sci. 10 (4), 347–356. doi:10.3844/ajessp.2014.347.356
Akpan, A. E., Ebong, E. D., Ekwok, S. E., and Joseph, S. (2014). Geophysical and geological studies of the spread and industrial quality of Okurike Barite deposit. Am. J. Environ. Sci. 10 (6), 566–574. doi:10.3844/ajessp.2014.566.574
Akpan, A. E., Ekwok, S. E., Ebong, E. D., George, A. M., and Okwueze, E. E. (2018). Coupled geophysical characterization of shallow fluvio-clastic sediments in Agwagune, southeastern Nigeria. J. Afr. Earth Sci. 143, 67–78. doi:10.1016/j.jafrearsci.2018.03.012
Alfaifi, H. J., Ekwok, S. E., Ulem, C. A., Eldosouky, A. M., Qaysi, S., Abdelrahman, K., et al. (2023). Exploratory assessment of geothermal resources in some parts of the Middle Benue Trough of Nigeria using airborne potential field data. J. King Saud Univ. – Sci. 35, 102521. doi:10.1016/j.jksus.2022.102521
Ani, C. C., Akpa, C., and Iduma, U. K. (2023). Appraisal of subsurface structural model, a tool for understanding the influence of geodynamics in base metal occurrence within the Southern Benue Trough, southeastern Nigeria. Model. Earth Syst. Environ., 1–17. doi:10.1007/s40808-023-01748-9
Ars, J. M., Tarits, P., Hautot, S., Bellanger, M., Coutant, O., and Maia, M. (2019). Joint inversion of gravity and surface wave data constrained by magnetotelluric: Application to deep geothermal exploration of crustal fault zone in felsic basement. Geothermics 80, 56–68. doi:10.1016/j.geothermics.2019.02.006
Avbovbo, A. A. (1978). Geothermal gradients in the southern Nigerian basin. Bull. Can. Petroleum Geol. 26 (2), 268–274.
Babalola, O. O. (1984). High-Potential geothermal energy resource areas of Nigeria and their geologic and geophysical assessment. AAPG Bull. 68 (4), 450.
Bansal, A. R., Anand, S. P., Rajaram, M., Rao, V. K., and Dimri, V. P. (2013). Depth to the bottom of magnetic sources (DBMS) from aeromagnetic data of central India using modified centroid method for fractal distribution of sources. Tectonophysics 603, 155–161. doi:10.1016/j.tecto.2013.05.024
Bansal, A. R., Dimri, V. P., Kumar, R., and Anand, S. P. (2016). “Curie depth estimation from aeromagnetic for fractal distribution of sources,” in Fractal solutions for understanding complex system in earth sciences. Editor V. P. Dimri (Berlin: Springer), 19–31.
Bansal, A. R., Gabriel, G., Dimri, V. P., and Krawczyk, C. M. (2011). Estimation of depth to the bottom of magnetic sources by a modified centroid method for fractal distribution of sources: An application to aeromagnetic data in Germany. Geophysics 76 (3), L11–L22. doi:10.1190/1.3560017
Ben, U. C., Ekwok, S. E., Achadu, O-I. M., Akpan, A. E., Eldosouky, A. M., AbdelrahmanGómez-Ortiz, D., et al. (2022b). A novel method for estimating model parameters from geophysical anomalies of structural faults using the manta-ray foraging optimization. Front. Earth Sci. 10, 870299. doi:10.3389/feart.2022.870299
Ben, U. C., Ekwok, S. E., Akpan, A. E., Mbonu, C. C., Eldosouky, A. M., Abdelrahman, K., et al. (2022a). Interpretation of magnetic anomalies by simple geometrical structures using the manta-ray foraging optimization. Front. Earth Sci. 10, 849079. doi:10.3389/feart.2022.849079
Benkhelil, J. (1988). Structure et evolution geodynamique du Basin intracontinental de la Benoue (Nigeria). Bull. Centres Rech. Explor. Prod. Elf-Aquitaine 1207, 29–128.
Bhattacharyya, B. K., and Leu, L. K. (1977). Spectral analysis of gravity and magnetic anomalies due to rectangular prismatic bodies. Geophysics 42, 41–50. doi:10.1190/1.1440712
Bhattacharyya, B. K., and Morley, L. W. (1965). The delineation of deep crustal magnetic bodies from total field aeromagnetic anomalies. J. Geomagnetism Geoelectr. 17, 237–252. doi:10.5636/jgg.17.237
Bogue, R. G., and Reynolds, R. R. (1951). Preliminary report on the lead-zinc deposits of the Abakaliki district, Nigeria geol surv. Nigeria. Report No. 1001.
Bouligand, C., Glen, J. M. G., and Blakely, R. J. (2009). Mapping Curie temperature depth in the Western United States with a fractal model for crustal magnetization. J. Geophys Res. Solid Earth 114 (11), B11104. doi:10.1029/2009JB006494
Chukwu, C. G., Udensi, E. E., Abraham, E. M., Ekwe, A. C., and Selemo, A. O. (2018). Geothermal energy potential from analysis of aeromagnetic data of part of the Niger-delta basin, southern Nigeria. Energy 143, 846–853. doi:10.1016/j.energy.2017.11.040
Coppo, N., Baltassat, J. M., Girard, J. F., Wawrzyniak, P., Hautot, S., Tarits, P., et al. (2015). 3-D magnetotelluric investigations for geothermal exploration in Martinique (Lesser Antilles). Characteristic deep resistivity structures, and shallow resistivity distribution matching heliborne TEM results. arXiv preprint arXiv:1501.06541.
De Swardt, A. M. J., and Casey, O. P. (1963). The coal resources of Nigeria. Bull. Geol. Surv. Niger. 28.
Dim, C. I. P. (2021). Facies analysis and interpretation in southeastern Nigeria's inland basins. Springer Nature.
Ejiga, E. G., and Yusoff, I., Ismail, N. E. H., Kumar, R., et al. (2022). Geothermal energy assessment through the Curie point depth, geothermal gradient, and heat flow around the Akiri hot spring region in Central Nigeria. Environ. Earth Sci. 81, 115. doi:10.1007/s12665-022-10236-9
Ekwok, S. E., Achadu, O.-I. M., Akpan, A. E., Eldosouky, A. M., Ufuafuonye, C. H., Abdelrahman, K., et al. (2022c). Depth estimation of sedimentary sections and basement rocks in the Bornu basin, Northeast Nigeria using high-resolution airborne magnetic data. Minerals 12, 285. doi:10.3390/min12030285
Ekwok, S. E., Achadu, O-I. M., Ugar, S. I., Udoh, J. T., Akpan, A. E., and Ulem, C. A. (2023). Appraisal of the magnetic and geothermal anomalies of bornu basin northeast Nigeria involving aero-magnetic data. Glob. J. Geol. Sci. 21 (1), 117–128. doi:10.4314/gjgs.v21i1.8
Ekwok, S. E., Akpan, A. E., Achadu, O.-I. M., Thompson, C. E., Eldosouky, A. M., Abdelrahman, K., et al. (2022a). Towards understanding the source of brine mineralization in Southeast Nigeria: Evidence from high-resolution airborne magnetic and gravity data. Minerals 12, 146. doi:10.3390/min12020146
Ekwok, S. E., Akpan, A. E., Achadu, O. I. M., and Eze, O. E. (2021a). Structural and lithological interpretation of aero-geophysical data in parts of the lower Benue Trough and obudu plateau, Southeast Nigeria. Adv. pace Res. 68, 2841–2854. doi:10.1016/j.asr.2021.05.019
Ekwok, S. E., Akpan, A. E., Achadu, O. I. M., and Ulem, C. A. (2022b). Implications of tectonic anomalies from potential field data in some parts of Southeast Nigeria. Environ. Earth Sci. 81, 6. doi:10.1007/s12665-021-10060-7
Ekwok, S. E., Akpan, A. E., and Ebong, D. E. (2019). Enhancement and modelling of aeromagnetic data of some inland basins, southeastern Nigeria. J. Afr. Earth Sci. 155, 43–53. doi:10.1016/j.jafrearsci.2019.02.030
Ekwok, S. E., Akpan, A. E., and Ebong, E. D. (2021c). Assessment of crustal structures by gravity and magnetic methods in the Calabar Flank and adjoining areas of Southeastern Nigeria-a case study. Arabian J. Geosciences 14 (4), 308–310. doi:10.1007/s12517-021-06696-1
Ekwok, S. E., Akpan, A. E., Ebong, E. D., and Eze, O. E. (2021b). Assessment of depth to magnetic sources using high resolution aeromagnetic data of some parts of the Lower Benue Trough and adjoining areas, Southeast Nigeria. Adv. Space Res. 67 (7), 2104–2119. doi:10.1016/j.asr.2021.01.007
Ekwok, S. E., Akpan, A. E., Kudamnya, E. A., and Ebong, D. E. (2020b). Assessment of groundwater potential using geophysical data: A case study in parts of cross river state, south-eastern Nigeria. Appl. Water Sci. 10, 144. doi:10.1007/s13201-020-01224-0
Ekwok, S. E., Akpan, A. E., and Kudamnya, E. A. (2020a). Exploratory mapping of structures controlling mineralization in Southeast Nigeria using high resolution airborne magnetic data. J. Afr. Earth Sci. 162, 103700. doi:10.1016/j.jafrearsci.2019.103700
Ephraim, B. E., Oden, M. I., and Obarezi, J. E. (2022). Fracture orientation significance in the study of Pb-Zn mineralization of lower Benue Trough, Abakaliki Se Nigeria. J. Geogr. Environ. Earth Sci. Int., 17–39. doi:10.9734/jgeesi/2022/v26i130330
Eseme, E., Agyingi, C. M., and Foba-Tendo, J. (2002). Geochemistry and Genesis of brine emanations from cretaceous strata of the mamfe basin, Cameroon. J. Afr. Earth Sci. 35, 467–476. doi:10.1016/s0899-5362(02)00171-9
Essa, K. S., and Elhussein, M. (2017). A new approach for the interpretation of magnetic data by a 2-D dipping dike. J. Appl. Geophys. 136, 431–443. doi:10.1016/j.jappgeo.2016.11.022
Essa, K. S., and Elhussein, M. (2018). PSO (particle swarm optimization) for interpretation of magnetic anomalies caused by simple geometrical structures. Pure Appl. Geophys. 175, 3539–3553. doi:10.1007/s00024-018-1867-0
Essa, K. S., Mehanee, S., and Elhussein, M. (2021). Magnetic data profiles interpretation for mineralized buried structures identification applying the variance analysis method. Pure Appl. Geophys. 178, 973–993. doi:10.1007/s00024-020-02553-6
Farrington, J. L. (1952). A preliminary description of the Nigerian lead-zinc field. Econ. Geol. 47, 583–608. doi:10.2113/gsecongeo.47.6.583
Georgsson, L. S. (2009). Geophysical methods used in geothermal exploration. Presented at short course IV on exploration for geothermal resources. organized by UNU-GTP, KenGen and GDC, at Lake Naivasha, Kenya, November 1-22.
Hang, N. T. T., Oksum, E., Minh, L. H., and Thanh, D. D. (2019). An improved space domain algorithm for determining the 3-D structure of the magnetic basement. Vietnam J. Earth Sci. 41 (1), 69–80. doi:10.15625/0866-7187/41/1/13550
Jackish, R., Madriz, Y., Zimmermann, R., Pirttijärvi, M., Saartenoja, A., Heincke, B. H., et al. (2019). Drone-borne hyperspectral and magnetic data integration: Otanmäki Fe-Ti-V deposit in Finland. Remote Sens. 11 (18), 2084. doi:10.3390/rs11182084
Jain, S. (1988). Total magnetic field reduction-the Pole or equator? A model study. Can. J. Explor. Geophys. 24 (2), 185–192.
Johnson, A. I., Knight, R. J., and Becker, M. W. (2016). Groundwater flow and storage within karstic aquifers. J. Hydrology 539, 617–628.
Kamto, P. G., Oksum, E., Pham, L,T., and Kamguia, J. (2023). Contribution of advanced edge detection filters for the structural mapping of the Douala Sedimentary Basin along the Gulf of Guinea. Vietnam J. Earth Sci. doi:10.15625/2615-9783/18410
Lawal, T. O., and Nwankwo, L. I. (2017). Evaluation of the depth to the bottom of magnetic sources and heat flow from high resolution aeromagnetic (HRAM) data of part of Nigeria sector of Chad Basin. Arabian J. Geoscience 10, 378. doi:10.1007/s12517-017-3154-2
Lazarian, A., and Esquivel, A. (2003). Statistics of velocity from spectral data: Modified velocity centroids. Astrophysical J. 592 (1), L37–L40. doi:10.1086/377427
Leu, L. K. (1981). Use of reduction-to-the-equator process for magnetic data interpretation: Presented at the 51st Ann. Int. Mtg, Soc. Expl. Geophy 47, 445. Los Angeles Abstract P 12.
Mackay, R. A. (1946). A comparative study of two lead-zinc occurrences in Plateau and Ogoja Provinces Ann, GeoL surv. Nigeria. Report.
Mariita, N. O. (2010). Application of geophysical methods to geothermal energy exploration in Kenya, GDC and KenGen at Lake Bogoria and Lake Naivasha Kenya: Presented at Short Course V on Exploration for Geothermal Resources organized by UNU-GTP.
Mehanee, S. (2022). A new scheme for gravity data interpretation by a faulted 2-D horizontal thin block: Theory, numerical examples and real data investigation. IEEE Trans. Geoscience Remote Sens. 60, 1–14. doi:10.1109/TGRS.2022.3142628
Mehanee, S., Essa, K. S., and Diab, Z. E. (2021). Magnetic data interpretation using a new R-parameter imaging method with application to mineral exploration. Nat. Resour. Res. 30, 77–95. doi:10.1007/s11053-020-09690-8
Mohammadzadeh-Moghaddam, M., Mirzaei, S., Nouraliee, J., and Porkhial, S. (2016). Integrated magnetic and gravity surveys for geothermal exploration in Central Iran. Arabian J. Geosciences 9, 506. doi:10.1007/s12517-016-2539-y
Ndombi, J. M. (1981). The structure of the shallow crust beneath Olkaria geothermal field, Kenya, deduced from gravity studies. Journ. Volcanol. Geotherm. Res. 9, 237–251. doi:10.1016/0377-0273(81)90006-8
Nishijimaa, J., and Naritomi, K. (2017). Interpretation of gravity data to delineate underground structure in the Beppu geothermal field, central Kyushu, Japan. J. Hydrology Regional Stud. 11, 84–95. doi:10.1016/j.ejrh.2015.11.022
Nwachukwu, S. O. (1976). Approximate geothermal gradients in Niger delta sedimentary basin. AAPG Bull. 60 (7), 1073–1077.
Nwachukwu, S. O. (1975). Geothermal regime of southern Nigeria. Proc. Secon U. N. symposium Dev. use Geotherm. Resour. 1, 205–212. GRC Geothermal Library. pubs.geothermal-library.org/lib/grc/1005046.pdf.
Nwachukwu, S. O. (1972). The tectonic evolution of the the southern portion of the Benue Trough, Nigeria. Geol. Mag. 109, 411–419. doi:10.1017/s0016756800039790
Nwankwo, L. I. (2015). Estimation of depths to the bottom of magnetic sources and ensuing geothermal parameters from aeromagnetic data of Upper Sokoto Basin, Nigeria. Geothermics 54, 76–81. doi:10.1016/j.geothermics.2014.12.001
Ofoegbu, C. O., and Onuoha, K. M. (1991). Analysis of magnetic data over the Abakaliki anticlinorium of the lower Benue Trough, Nigeria. Mar. Petroleum Geol., 8, 174–183. doi:10.1016/0264-8172(91)90005-L
Onuoha, K. M., and Ekine, A. S. (1999). Subsurface temperature variations and heat flow in the Anambra Basin, Nigeria. J. Afr. Earth Sci. 28 (3), 641–652. doi:10.1016/s0899-5362(99)00036-6
Onuoha, K. M., and Ofoegbu, C. O. (1988). Subsidence and evolution of Nigeria's continental margin: Implications of data from afowo-1 well mar. Pet. Geol. 5, 175–181.
Pham, L. T., Do, T. D., Oksum, E., and Le, S. T. (2019). Estimation of Curie point depths in the Southern Vietnam continental shelf using magnetic data. Vietnam J. Earth Sci. 41 (3), 216–228. doi:10.15625/0866-7187/41/3/13830
Pham, L. T., Oksum, E., Gomez-Ortiz, D., and Do, T. D. (2020). MagB_inv: A high performance matlab program for estimating the magnetic basement relief by inverting magnetic anomalies. Comput. Geosci. 134, 104347. doi:10.1016/j.cageo.2019.104347
Pham, L. T., Oksum, E., Kafadar, O., Trinh, P. T., Nguyen, D. V., Vo, Q. T., et al. (2022). Determination of subsurface lineaments in the Hoang Sa islands using enhanced methods of gravity total horizontal gradient. Vietnam J. Earth Sci. 44 (3), 395–409. doi:10.15625/2615-9783/17013
Pham, L. T., and Prasad, K. N. D. (2023). Analysis of gravity data for extracting structural features of the northern region of the Central Indian Ridge. Vietnam J. Earth Sci. doi:10.15625/2615-9783/18206
Ravat, D., Morgan, P., and Lowry, A. R. (2016). Geotherms from the temperature-depth- constrained solutions of 1-D steady-state heat-flow equation. Geosphere 12 (4), 1187–1197. doi:10.1130/ges01235.1
Reeves, C., Reford, S., and Millingan, P. (1997). “Airborne geophysics:old methods, new images,” in Proceedings of the Fourth Decennial International Conference on Mineral Exploration, Australia, 13–30.
Represas, P., Santos, F. A., Ribeiro, J., et al. (2013). Interpretation of gravity data to delineate structural features connected to low temperature geothermal resources at Northeastern Portugal. J. Appl. Geophys. 92, 30–38. doi:10.1016/j.jappgeo.2013.02.011
Ross, H. E., Blakely, R. J., and Zoback, M. D. (2006). Testing the use of aeromagnetic data for the determination of Curie depth in California. Geophysics 71 (5), L51–L59. doi:10.1190/1.2335572
Ross, P. S., Bourke, A., and Fresia, B. (2013). A multi-sensor logger for rock cores: Methodology and preliminary results from the Matagami mining camp, Canada. Ore Geol. Rev. 53, 93–111. doi:10.1016/j.oregeorev.2013.01.002
Saibi, H., Khosravi, S., Cherkose, B. A., Smirnov, M., Kebede, Y., and Fowler, A. (2021). Magnetotelluric data analysis using 2D inversion: A case study from Al- mubazzarah geothermal area (amga), Al-ain, united Arab emirates. Heliyon 7 (6), e07440. doi:10.1016/j.heliyon.2021.e07440
Salem, A., Green, C., Ravat, D., Singh, H. K., East, P., Fairhead, J. D., et al. (2014). Depth to Curie temperature across the central Red Sea from magnetic data using the de-fractal method. Tectonophysics 624-625, 75–86. doi:10.1016/j.tecto.2014.04.027
Sharma, P. V. (2004). Environmental and engineering geophysics. Cambridge: Cambridge University Press, 475.
Simiyu, S. M., and Keller, G. R. (1997). An integrated analysis of lithospheric structure across the East African plateau based on gravity anomalies and recent seismic studies. Tectonophysics 278, 291–313. doi:10.1016/s0040-1951(97)00109-1
Simpson, A. (1955). The Nigerian coalfield: The geology of parts of owerri and Benue provinces. Bull. Geol. Surv. Niger. No 24.
Smith, S. A. F., Jordan, G., and Caine, J. S. (2018). The influence of fault architecture on fluid flow behavior in the upper crust. J. Struct. Geol. 105, 1–14.
Spector, A., and Grant, F. S. (1970). Statistical models for interpreting aeromagnetic data. Geophysics 35, 293–302. doi:10.1190/1.1440092
Tanaka, A. (2017). Global centroid distribution of magnetized layer from world digital magnetic anomaly map. Tectonics 36, 3248–3253. doi:10.1002/2017TC004770
Tanaka, A., Okubo, Y., and Matsubayashi, O. (1999). Curie point depth based on spectrum analysis of the magnetic anomaly data in East and Southeast Asia. Tectonophysics 306 (3), 461–470. doi:10.1016/S0040-1951(99)00072-4
Tijani, M. N. (2004). Evolution of saline waters and brines in the Benue-Trough, Nigeria. Appl. Geochem. 19, 1355–1365. doi:10.1016/j.apgeochem.2004.01.020
Wang, M., and Liu, Z. (2018). The effects of anisotropy of marine magnetic anomalies on the Curie point depth estimates from spectral analysis. Acta Geophys. 66, 1019–1030. doi:10.1007/s11600-018-0197-z
Whiteman, A. (1982). Nigeria: Its petroleum geology. London: Resources and Potential Graham and Trotham.
Witter, J. B., Fournier, D., Schermerhorn, W. D., and Stelling, P. (2017). 3D geophysical inversion modeling of ground magnetic data at Baker hot springs. Washington State, USA: Geothermal Resource Council Transactions. 41.
Xayavong, V., Vu, M. D., Singsoupho, S., Nguyen, D. A., Prasad, K. N. D., Vu, T. M., et al. (2023). Combination of 2D-electrical resistivity imaging and seismic refraction tomography methods for groundwater potential assessments: A case study of khammouane province, Laos. Vietnam J. Earth Sci. 45 (2), 238–250. doi:10.15625/2615-9783/18348
Keywords: Abakaliki Anticlinorium, Southeast Nigeria, magnetic method, spectral analysis, geothermal potential, heat flow
Citation: Eldosouky AM, Ekwok SE, Ben UC, Ulem CA, Abdelrahman K, Gomez-Ortiz D, Akpan AE, George AM and Pham LT (2023) Appraisal of geothermal potentials of some parts of the Abakaliki Anticlinorium and adjoining areas (Southeast Nigeria) using magnetic data. Front. Earth Sci. 11:1216198. doi: 10.3389/feart.2023.1216198
Received: 03 May 2023; Accepted: 17 July 2023;
Published: 04 August 2023.
Edited by:
Mourad Bezzeghoud, Universidade de Évora, PortugalCopyright © 2023 Eldosouky, Ekwok, Ben, Ulem, Abdelrahman, Gomez-Ortiz, Akpan, George and Pham. This is an open-access article distributed under the terms of the Creative Commons Attribution License (CC BY). The use, distribution or reproduction in other forums is permitted, provided the original author(s) and the copyright owner(s) are credited and that the original publication in this journal is cited, in accordance with accepted academic practice. No use, distribution or reproduction is permitted which does not comply with these terms.
*Correspondence: Ahmed M. Eldosouky, ZHJfYS5lbGRvc29reUB5YWhvby5jb20=; Luan Thanh Pham, bHVhbnB0QGh1cy5lZHUudm4=