 Xiaomiao Li1,2
 Tingjiang Peng
 Zhenhua Ma
 Chunhui Song
- 1School of Geography and Tourism, Qufu Normal University, Rizhao, China
- 2MOE Key Laboratory of Western China’s Environmental Systems, College of Earth and Environmental Sciences, Lanzhou University, Lanzhou, China
- 3School of Earth Sciences, Key Laboratory of Western China’s Mineral Resources of Gansu Province, Lanzhou University, Lanzhou, China
The Neogene fluvial–lacustrine sediments of the Tianshui Basin provide records of the interactions among tectonic activity, and climatic and ecological changes on the northeastern Tibetan Plateau (NE TP), from ∼12.4 to 2.6 Ma. We investigated the n-alkane record of a sedimentary sequence from the Tianshui Basin, which reveals shifts in the productivity and sources of n-alkanes. The productivity of n-alkanes doubled many times during ∼4.2–3.2 Ma, accompanied by the increased contribution from aquatic plants; in addition, non-emergent macrophytes occurred sporadically after ∼4.2 Ma but became a significant n-alkane source after ∼3.2 Ma. Changes in the inferred Late Miocene ecology of the region are consistent with the major climate transition in response to global cooling. The oscillations of the types and concentrations of n-alkanes during 4.2–3.2 Ma were likely related to the evolution of the East Asian monsoon (EAM), driven by the tectonic uplift of NE TP and global cooling. The major increase in aquatic plants and biological productivity of this region at ∼3.2 Ma may have been caused by the strengthening of the East Asian summer monsoon (EASM) and the regional tectonic uplift.
1 Introduction
As the frontier of the northeastward growth and expansion of the Tibetan Plateau, the northeastern Tibetan Plateau is sensitive to tectonic activity and climate change, and it is thus regarded as the most promising part of TP to document the uplift process and related environmental changes (Molnar et al., 2010). The paleoenvironmental significance of NE TP is demonstrated by the following. First, the climatic and ecological environment of NE TP changed irreversibly from the Late Miocene onward, with fluctuations in geographical and geomorphological conditions (Chen et al., 2019; Nie et al., 2020; Miao et al., 2022; Richter et al., 2022). Second, the growth of NE TP exerted a profound influence on the onset and strengthening of a modern-like East Asian monsoon system (Liu and Yin, 2002; Tang et al., 2013; Zhang et al., 2015). Third, the enhanced erosion and weathering intensity due to the tectonic uplift increased the generation of materials that made a major contribution to the Aeolian sediments of the Chinese loess Plateau (Yang et al., 2019; Li et al., 2020; Sun et al., 2022). For these reasons, scientific problems related to the tectonic history, weathering and denudation processes, and climatic and ecological evolution of NE TP have attracted much attention for research (Song et al., 2001; Miao et al., 2011; Chen et al., 2019; Yang et al., 2021; Miao et al., 2022).
Over the past few decades, a large amount of paleoenvironmental evidence from mountains and sedimentary basins has indicated that NE TP underwent multiple stages of tectonic activity to attain its modern topography (Song et al., 2001; Fang et al., 2003; Fang et al., 2005; Li et al., 2014; Li et al., 2015; Li et al., 2017). However, the timing of its attainment of its modern altitude and how the regional climate system responded to the mountain building remain controversial. Sedimentary evidence from the Longzhong Basin including an increase in the sediment accumulation rate and the occurrence of widespread boulder deposits in the foreland basin (Song et al., 2001; Fang et al., 2003; 2005; Li et al., 2014; Guo et al., 2017), together with the disintegration of the main planation surface (Guo et al., 2006; Li et al., 2015), indicates that strong tectonic uplift of NE TP occurred since the Middle Pliocene (∼3.6 Ma). The estimates of paleotemperatures and paleoelevations based on oxygen and carbon stable isotopic compositions of carbonates from the Lake Qinghai Basin suggested that the basin paleoelevation might be relatively high (>2.5 km) since the early Pliocene and then uplift up to 1 km due to tectonic activity of NE TP at ∼3.6 Ma (Richter et al., 2022). The mid-Pliocene tectonic uplift of NE TP was thought to create a profound impact on the Asian climate system and induced the simultaneous strengthening of EAM and aridification of the Asian interior (An et al., 2001). However, a recent paleoaltimetry study based on a pollen record from the Qaidam Basin revealed that NE TP was uplifted rapidly and reached a near-modern altitude in the Late Miocene, with consequent changes in regional precipitation and alpine biodiversity (Miao et al., 2022). The variations in EAM are also controversial, which hinders a comprehensive understanding of the climatic effects of the Late Miocene tectonic activity. For example, biomarker evidence from the Xining Basin (Chen et al., 2019) and pollen records from Jiuxi (Ma et al., 2005) and Qaidam basins (Miao et al., 2011; Miao et al., 2019) indicate the intensification of aridification from ∼8 Ma, while a precipitation reconstruction from the Tianshui Basin (Hui et al., 2023) and a record of silicate-weathering intensity from the Linxia Basin (Yang et al., 2021) indicate enhanced monsoon precipitation after ∼8–7 Ma. This disagreement may result from different interpretations of environmental proxies and/or the complexity of the regional response to the tectonic uplift. Hence, it is important to obtain additional long time-series of climatically sensitive proxies from NE TP.
Leaf wax n-alkanes are sensitive to ecological and climatic changes and provide information on changes in the vegetation type, biological productivity, and climatic conditions (Bourbonniere and Meyers, 1996; Ficken et al., 2000; Duan et al., 2014; Liu et al., 2015; Li et al., 2018; Liu et al., 2018). Our previous studies showed that the Neogene sediments of the Tianshui Basin, adjacent to the West Qinling orogenic belt, contain abundant n-alkanes (Peng et al., 2012; Peng et al., 2016). In this study, we report the results of a systematic investigation of n-alkanes, measured at a high stratigraphic resolution, from a fluvial–lacustrine sedimentary sequence spanning the interval of 12.4–2.6 Ma. This record reveals shifts in the productivity of n-alkanes and in their source types, and it provides insights into regional ecological changes in response to EAM evolution, tectonic uplift, and global changes.
2 Geological and geographical settings
The vast Longzhong Basin, bounded by West Qinling to the south, the Qilian Mountains (Mts) to the north, and the Liupan Mts to the east, is the northeastward-expanding frontier of TP (Figure 1). Structurally, it is composed of a series of secondary basins, such as the Xining, Lanzhou, Linxia, and Tianshui basins. Climatically, the basin occupies the boundary between the humid Asian monsoonal climate zone and the dry inland climate and alpine climate zones of TP, at the apex of the monsoon triangle (Li et al., 1988). Geomorphologically, the basin lies within the transition zone between the high-altitude TP and low-altitude North China. The main natural vegetation types from southeast to northwest are open steppe, woodland, typical steppe, and desert steppe. The Cenozoic mammalian fossil-rich basin sediments, derived from the surrounding mountains, have recorded the evolution of the mountain uplift, weathering, and the regional environment.
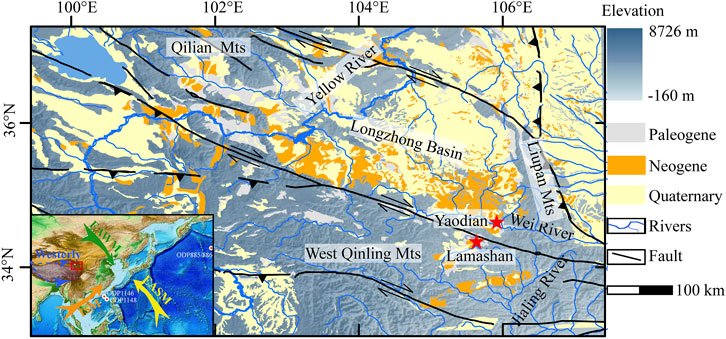
FIGURE 1. Geographical and geological context of the study area. The red pentagram indicates the location of the Lamashan and Yaodian sections.
The Tianshui Basin, as a southeastern sub-basin of the Longzhong Basin, is occupied by warm–temperate forest–grassland under a semi-humid monsoonal climate, with a mean annual temperature and precipitation of 10.8°C and 500 mm, respectively. Tributaries of both the Yangtze River (the Jialing River) and the Yellow River (the Wei River) flow cross the area. Landforms are roughly divided into two parts by the Wei River: to the north of the river are loess landforms and to the south are the North Qinling Mts. Within the Tianshui Basin, Neogene fluvial–lacustrine sediments unconformably overlie the Paleogene Guyuan Group. From bottom to top, these Neogene strata are divided into four formations (Fms): Ganquan, Yaodian, Yangjizhai, and Lamashan Fms (Li et al., 2006). The Ganquan Fm comprises lower alluvial facies and upper flood plain facies; the Yaodian Fm consists mainly of shallow lake facies with channel facies below; the Yangjizhai Fm consists of floodplain facies that unconformably overlie the lacustrine facies of the Lamashan Fm.
3 Materials and methods
A total of 80 samples were obtained from Yaodian (105° 55′E, 34° 38′N) and Lamashan (105° 42′E, 34° 24′N) sections. The samples of Ganquan and Yaodian Fms were obtained from the Yaodian section, while the samples of Yangjizhai Fm were obtained from the Lamashan section (Figure 2A). The results for the Lamashan Fm were reported by Peng et al. (2023). For the Ganquan Fm, we focus on the interval of 12.4–11.7 Ma, which consists of maroon mudstone and interbedded calcareous mudstone with the deepening of horizontal bedding and belongs to flood plain facies. The Yaodian Fm spans the interval of 11.7–7.3 Ma containing abundant fossils of the Hipparion fauna. The lower part (11.7–9.2 Ma) is made up of alternations of floodplain and overbank/channel deposits, and the upper part (9.2–7.4 Ma) belongs to shallow lake facies, consisting of typical “Zebra Beds” gray-green or blue-gray marl (calcareous mudstone), interbedded with maroon mudstone or siltstone. The Yangjizhai Fm, with the age range of 7.3–3.7 Ma, has similar lithologic characteristics to that of the Ganquan Fm, consisting of yellow-brown massive calcareous argillaceous siltstone (marl) interbedded with maroon mudstone. The Lamashan Fm, with the age range of 3.6–2.6 Ma, consists of gray-green calcareous mudstone and marl, interbedded with shale, containing snails and Ostracoda fossils.
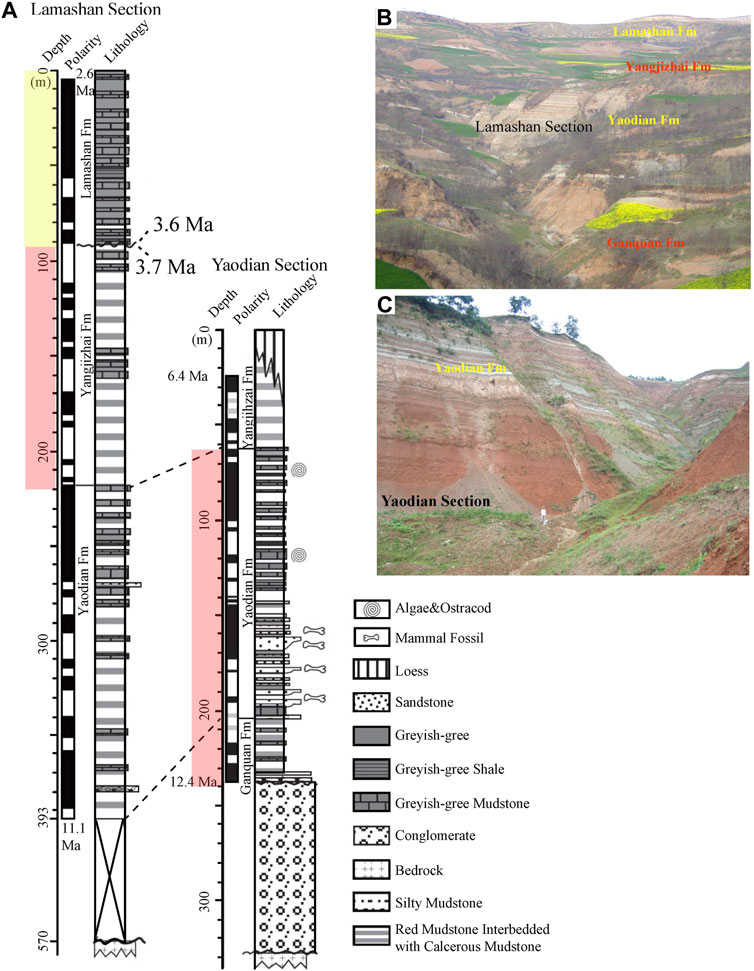
FIGURE 2. (A) Lithology and magnetic stratigraphy of the Lamashan and Yaodian sections (Wang et al., 2012; Liu et al., 2016). Photographs of (B) the Lamashan section and (C) Yaodian section . The red dashed area is the sampling location, and the results for the yellow-dashed area are cited by Peng et al. (2023).
Pretreatment for n-alkane analysis involves grinding 100–120 g samples to pass through a 100-mesh sieve. Total lipids were extracted with a dichloromethane/methanol solvent mixture (9:1, v/v) by Dionex accelerated solvent extraction (ASE) under the following conditions of high temperature (100°C) and pressure (1,000 psi). The extracted lipids were then concentrated by rotary evaporation. After eluting the apolar fraction with methanol, n-alkanes were analyzed by gas chromatography (GC) with cholestane as the internal standard. The heating procedure is as follows: initial temperature (70°C) increased to 210°C at the rate of 10°C/min, then increased to 310°C at the rate of 2°C/min, and held constant for 6 min. The carrier gas was nitrogen with the flow rate of 3 mL/min. The abundances of different carbon chain lengths can be calculated from the ratio of each peak area to the peak area of the standard sample. Pre-processing and analysis were conducted in the State Key Laboratory of Biogeology and Environmental Geology, China University of Geosciences (Wuhan).
The content of n-alkanes (
Cn represents the content of each n-alkane with n carbon atoms.
4 Results
The n-alkane distributions of samples from the Yaodian and Lamashan sections range from n-C15 to n-C35. On average, the short-chain (C15-20), middle-chain (C21-25), and long-chain (C26-35) n-alkanes account for ∼20.3%, 26.1%, and 53.6% in total, respectively (Figure 3A). Total n-alkanes have the range of 17.4–15053.7 ng/g, with the median being 259.8 ng/g. The n-alkane contents were relatively stable during 12.4–7.3 Ma and decreased during 7.3–4.2 Ma, after which there were two significant increases, during the Middle and Late Pliocene (Figure 3B). We used the Mann–Kendall (M-K) mutation test and the Bayesian change-point algorithm (Ruggieri, 2013) to detect change points in the total n-alkane content. The M–K mutation test showed an intersection point of UF and UB at ∼3.2 Ma (within the 95% confidence interval), and the Bayesian approach indicated a change point at ∼3.2 Ma (a posterior probability of 41%). Both results indicated a major change in the productivity of n-alkanes at ∼3.2 Ma (Figure 3C).
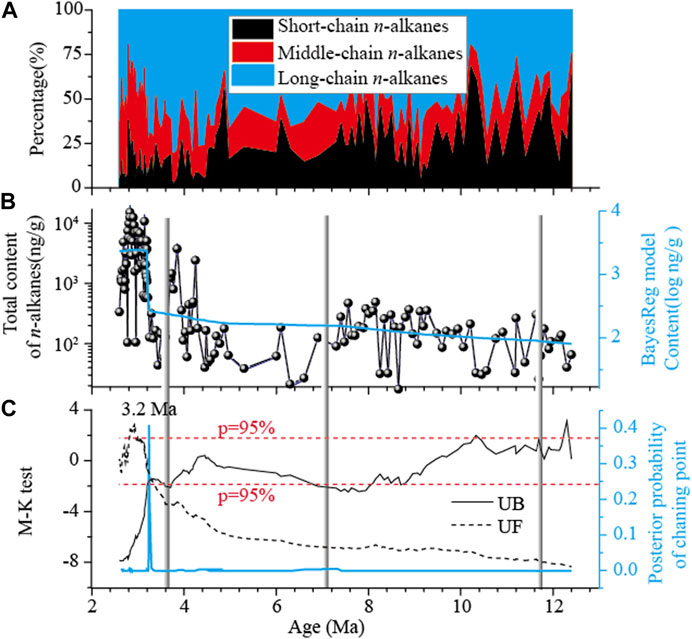
FIGURE 3. (A) Percentages of short-chain (nC15-20), middle-chain (nC21-25), and long-chain (nC26-35) alkanes. (B) Total n-alkane concentration and model values predicted by the Bayesian change-point algorithm, in logarithmic coordinates (blue). (C) Predicted changepoint of the total n-alkane concentration. The blue line indicates the location of the change point (indicated by the “spikes”) based on the Bayesian change-point algorithm. The black line indicates the changepoint (intersection of UF and UF) based on the Mann–Kendall (M–K) mutation test, and the red dashed lines represent the 95% confidence level.
There are various types of n-alkanes in sediments, and five distribution patterns are evident in the sediment of the Tianshui Basin (Figure 4C): Type A has a main peak at n-C21 and n-C23 with a secondary peak at n-C29. Type B has a main peak at n-C25. For types A and B, differences in the content of nC21-29 are relatively small and there is a weak odd/even predominance. Types C, D, and E have a main peak at n-C27, n-C29, and n-C31, respectively, with a pronounced odd/even predominance. We used stratigraphically constrained unweighted pair group average algorithms to perform the hierarchical clustering of all samples based on the n-alkane compositions. The classification results are shown in Figure 4A, and they define two groups with the boundary age of 3.15 Ma. The 12.4–3.15-Ma group is divided into two subgroups with the boundary at ∼4.2 Ma. Thus, we conclude that significant changes in the source of n-alkanes occurred between ∼4.2 Ma and ∼3.15 Ma.
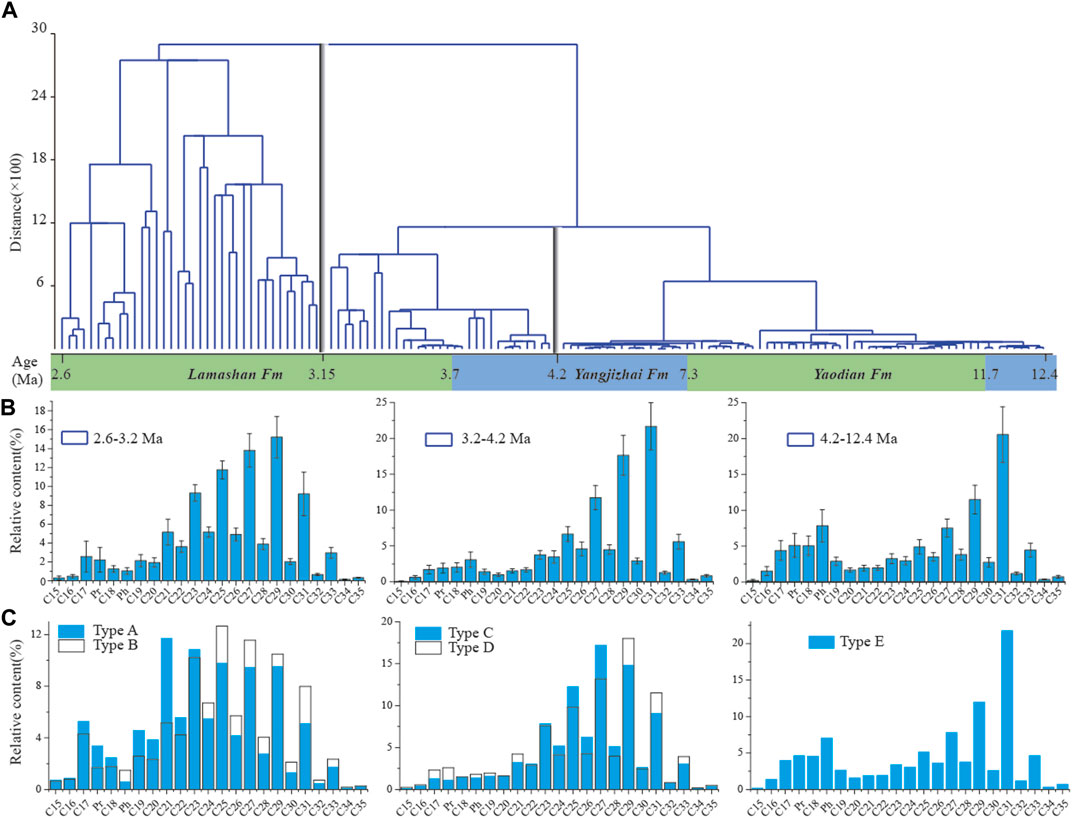
FIGURE 4. (A) Results of hierarchical clustering analysis of samples based on the distribution of n-alkanes. (B) Average distribution of n-alkanes during stages I–III. (C) Average distributions of the five types of n-alkanes.
It is interesting that neither the changepoint of the n-alkane contents (3.2 Ma) nor the classification boundaries for the n-alkane distribution (3.15 Ma and 4.2 Ma) correspond to changes in sedimentary facies, which indicates that these shifts might be results of ecosystem changes in biological productivity and species. Combined with the variations in the content and distribution in n-alkanes, we divided the sequence into three evolutionary stages: Stage Ⅰ (12.4–4.2 Ma), Stage Ⅱ (4.2–3.2 Ma), and Stage Ⅲ (3.2–2.6 Ma).
5 Discussions
5.1 Characteristic parameters of n-alkanes and changes in the n-alkane source
Previous studies indicate that n-alkanes derived from different plant species have different compositional characteristics. For example, the n-alkanes produced by lower plants (e.g., algae, fungi, and photosynthetic bacteria) and non-emergent macrophytes (NEM, e.g., floating leaved and submerged plants) are usually dominated by short-chain components (n-C17-20), with the main peaks of n-C17, n-C18, or n-C19; and by middle-chain components (n-C21-25), with the main peaks of n-C21, n-C23, or n-C25 (Meyers, 2003; Gao et al., 2011; Duan et al., 2014). The n-alkanes produced by emergent macrophytes (EMP), like those of higher terrestrial plants (HTP), have increased abundances of long-chain n-alkanes (n-C26-35), with the main peaks of n-C27, n-C29, or n-C31, and with a pronounced odd/even predominance (Bray and Evans, 1961; Eglinton and Hamilton, 1967; Gao et al., 2011). The occurrence of n-alkane types A, B, C, D, and E in the studied sections indicated that non-emergent macrophytes, emergent plants, and higher terrestrial plants were ecologically important at various times in the past. Types D and/or E occur almost throughout the sedimentary sequence (Figure 5A), which indicated that emergent or higher terrestrial plants were a stable and dominant source of n-alkanes. The diversity of n-alkane sources increased from Stage I to Stage III, which is expressed by the increased number of types (Figure 5A). Specifically, types C, D, and E occurred during Stage I, Type B appeared during Stage II, and Type A appeared during Stage III; this shows that aquatic plants played an increasingly important ecological role. A triangle plot of the n-alkanes shows that the middle-chain-length n-alkane percentage increased substantially from Stage I to Stage III (Figure 5B), which indicates the increased contribution of NEM.
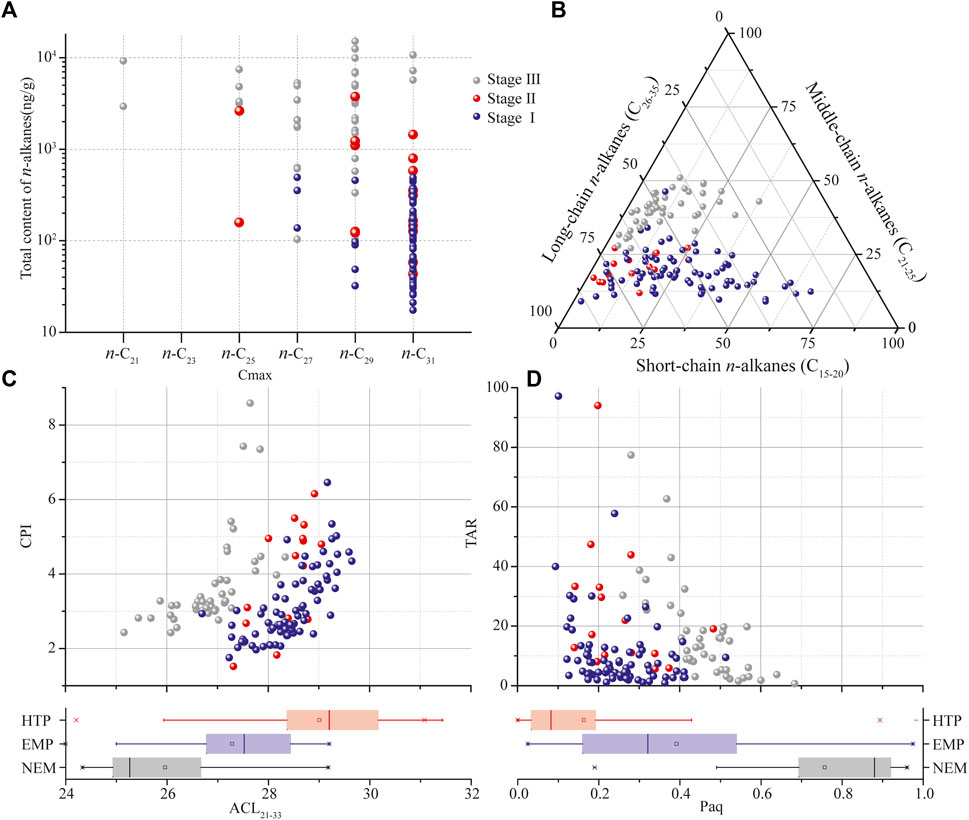
FIGURE 5. Comparison of characteristic n-alkane parameters during the three stages. (A) Distribution of the total alkane concentrations and n-alkane types (Cmax). (B) Triangle diagram of the distributions of short-chain, middle-chain, and long-chain alkanes. Plots of (C) ACL versus CPI and (D) Paq versus TAR. The bottom figures show ACL and Paq values of modern higher terrestrial plants (HTP), emergent plants (EMP), and non-emergent macrophytes (NEM). These data are obtained by Gao et al. (2011), Du et al. (2014), Liu et al. (2015), and Li et al. (2018).
Although the distribution of these three components and n-alkane types can provide information about the origin of n-alkanes, it is difficult to distinguish the sources completely due to complexity of long-chain alkane provenance. A systematic study in Qinghai Lake indicated some submerged and algal plants produce a large proportion of long-chain alkanes (Liu and Liu, 2016). Therefore, it is necessary to compare the characteristic parameters of n-alkanes in sediment and modern plants. Several n-alkane-derived parameters (e.g., ACL, CPI, Paq, and TAR), which describe the compositional features of n-alkanes, can also reflect changes in the origin of n-alkanes and hence the ecological environment. ACL and CPI indicate the chain-length distribution and the odd-carbon number predominance of leaf wax n-alkanes, respectively. Generally, n-alkanes from higher terrestrial plants have higher ACL and CPI values than aquatic plants. Paq and TAR were proposed to indicate the contribution from aquatic macrophytes and lower plants to sedimentary organic matter, and higher Paq and TAR values corresponding to larger contribution from them, respectively (Bourbonniere and Meyers, 1996; Ficken et al., 2000). The differences in the ACL and Paq values of the three stages are much greater than those of CPI and TAR, with these differences mainly evident between Stage Ⅲ and the other two stages (Figures 5C,D). Specifically, ACL and Paq values of Stage Ⅲ are lower and higher than those of the other two stages, respectively. The published data in the CLP (Li et al., 2018) and NE TP (Gao et al., 2011; Duan et al., 2014; Liu et al., 2015; Liu and Liu, 2016) showed THP have the highest ACL and lowest Paq values, NEM have the lowest ACL and highest Paq values, and values of EMP distribute between THP and NEM (Figure 5C, D5). In the Tianshui Basin, the ACL and Paq values of Stage Ⅲ are intermediate between NEM and EMP, while those of Stages Ⅰ and Ⅱ range between EMP and HTP, which indicates the increased contribution from aquatic plants during Stage Ⅲ (Figures 5C,D). Furthermore, the distribution of n-alkane composition and the related parameters during Stage Ⅱ shows several transitional characteristics from Stage Ⅰ to Stage Ⅲ, with most of the values of Stage Ⅱ overlapping with Stage I, and with a minority distributed within the range of Stage Ⅲ. These observations indicate that the contribution of NEM to n-alkanes changed from negligible to dominant.
In summary, the contribution from aquatic plants gradually increased from Stage Ⅰ to Stage Ⅲ, manifested by changes in non-emergent macrophytes, which occurred sporadically during Stage Ⅱ and were then significantly represented during Stage Ⅲ. Additionally, the diversity of n-alkane sources increased from Stage Ⅰ to Stage Ⅲ.
5.2 Regional ecological evolution and its links with climate change and the tectonic uplift
In the following sections, we summarize the evolution of the regional ecological environment in terms of changes in biological productivity and its composition, based on n-alkane components. Generally, the absolute concentrations of both total n-alkanes and the three components repeatedly doubled in a stepwise manner from Stage Ⅰ to Stage Ⅲ, accompanied by an increase in the diversity of n-alkane types, and the increased contribution from aquatic plants (Figure 6). The changes in the plant composition of the Tianshui Basin both within and between the three stages were closely related to the evolution of the EAM system and/or tectonic uplift.
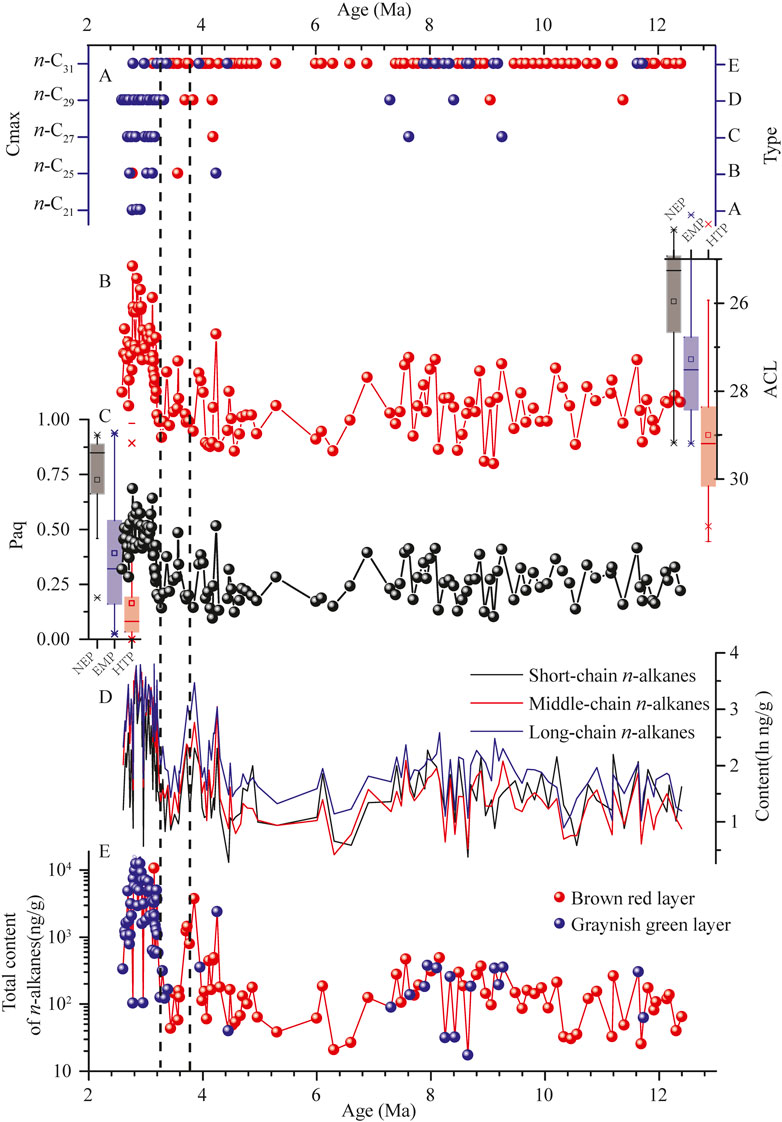
FIGURE 6. Age profiles of (A) n-alkane types, (B) ACL, (C) Paq, (D) concentrations of different chain lengths, and (E) total alkanes in the Tianshui Basin.
5.2.1 Relationship between late Miocene ecological changes and a major climate transition
Stage Ⅰ (12.4–4.2 Ma) is characterized by a low n-alkane content and relatively homogeneous n-alkane sources, compared with the other stages. The n-alkanes compositional analysis indicated that HTP and EMP were the potential sources. Combined with the predominance of the pollen of terrestrial plants (Liu et al., 2016), we infer that HTP was the dominant source of n-alkanes. A pronounced change in n-alkanes composition occurred at 7.4 Ma, which corresponds to a transition from shallow lake facies to floodplain facies (Li et al., 2006). The concentrations of both total n-alkanes and the three components decreased after ∼7.4 Ma, together with the pollen concentration, indicating a decrease in biological productivity, and there was also a corresponding change in n-alkane types. Types C and D occurred sporadically, in addition to the dominant type E, at times when the biological productivity was relatively high. Types C and D mostly occur within the gray or greyish-green sediments, which accumulated in a reducing environment, when aquatic plants reached their highest abundance (Liu et al., 2016). We infer that the occurrence of types C and D indicates a contribution from EMP and/or a relatively humid environment. After 7.4 Ma, when biological productivity reached a minimum, type E was the only type, and at the same time, aquatic taxa almost disappeared from the palynological assemblage (Liu et al., 2016). In addition, the decrease in CPI and increase in ACL after ∼7.4 Ma indicate a decreased n-alkane contribution from aquatic plants.
The synchronous decreases in productivity and in the aquatic contribution to n-alkanes at 7.4 Ma are consistent with a major climatic transition from humid to arid condition at the end of the Late Miocene. Previous studies have documented decreases in the pollen percentages of hygrophilous forest vegetation in the Tianshui (Liu et al., 2016), Qaidam (Miao et al., 2011), and Jiuxi basins (Ma et al., 2005; Figure 7), at the end of the Miocene, accompanied by an increase in steppe vegetation. These changes indicate a decrease in precipitation on the NE TP. Geochemical evidence from the South China Sea indicates a reduction in weathering intensity related to the weakening of the East Asian summer monsoon (Wan et al., 2007; 2010), and at the same time, Aeolian sediments began to accumulate on the Chinese Loess Plateau (An, 2014; Lu et al., 2019). Aeolian sediments were also supplied to the NE TP fluvial–lacustrine system (Fan et al., 2006; Yang et al., 2018), and there was an increase in their contribution to sedimentation in the Pacific Ocean at ∼7–8 Ma (Rea et al., 1998; Shen et al., 2017), indicating the strengthening of aridification of the Asian interior. On a global scale, pronounced cooling occurred in the Late Miocene in both the ocean (Herbert et al., 2016) and on land (Chen et al., 2019; Li et al., 2023; Wen et al., 2023), accompanied by a decrease in pCO2 (Cui et al., 2020; Brown et al., 2022). This generally cool climatic background resulted in the weakening of the Asian summer monsoon, and therefore, we conclude that pCO2-induced global cooling was the main factor driving the aridification and ecosystem changes in the Tianshui Basin during the Late Miocene.
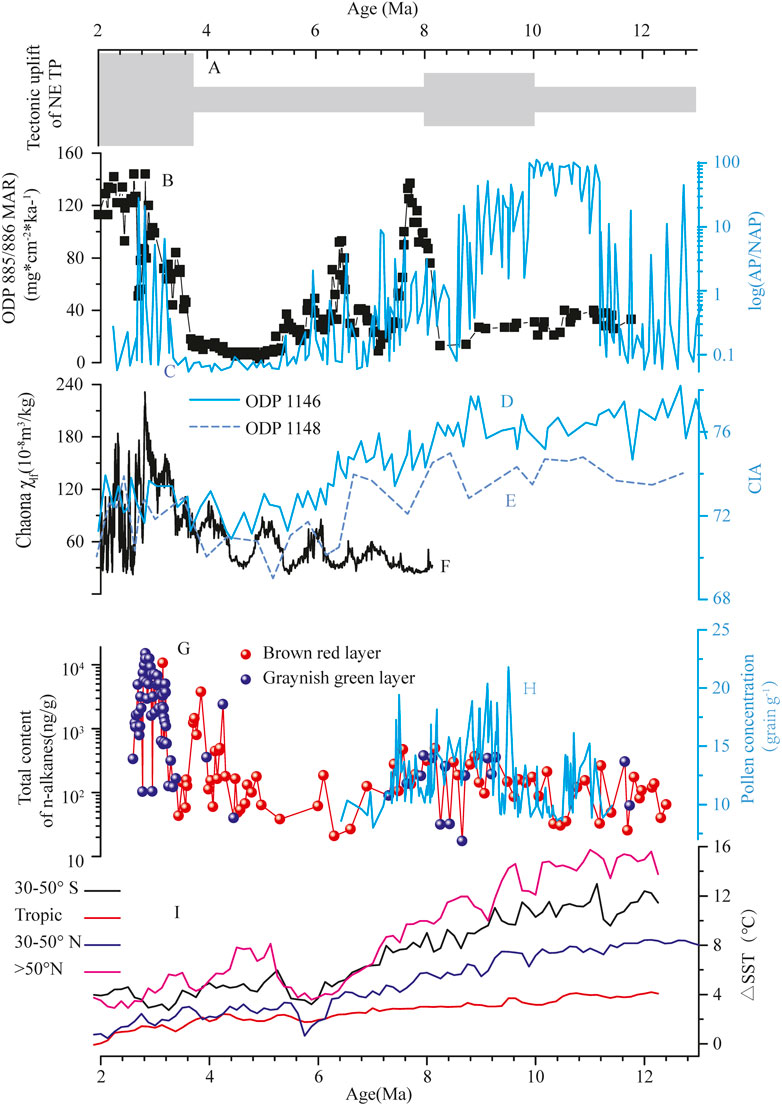
FIGURE 7. Total alkane concentration in the Tianshui Basin compared with other climatic indices and the tectonic activity of NE TP. (A) Schematic model showing the major periods of NE TP uplift (modified Wan et al., 2010). (B) Mass accumulation rate (MAR) of Aeolian dust at ODP 885/886 in the North Pacific Basin (Rea et al., 1998). (C) Log arboreal pollen/non-arboreal pollen (AP/NAP) ratios from the Jiuxi Basin (Ma et al., 2005). Record of the chemical index of alteration (CIA) between ODP 1146 (D, Wan et al., 2010) and ODP 1148 (E, Wan et al., 2007). (F) Magnetic susceptibility (χlf) record of the Chaona section (Song et al., 2007). Concentration of (G) total n-alkanes and (H) pollen in the Tianshui Basin. (I) Stacked sea surface temperature (SST) anomalies of the Northern Hemisphere (NH), Southern Hemisphere (SH), and tropics (Herbert et al., 2016).
5.2.2 Oscillations in n-alkanes and EAM evolution
During Stage Ⅱ (4.2–3.2 Ma), the n-alkane concentration increased intermittently during 4.2–3.6 Ma and then decreased, and both n-alkanes and pollen concentrations (Liu, 2016) decreased during 3.6–3.2 Ma, indicating a decrease in biological productivity. During 4.2–3.6 Ma, the numbers of n-alkane types increased and type B appeared; however, type E remained dominant, while types B, C, and D occurred less frequently. Changes in the concentration and type of n-alkanes were roughly synchronous; for example, aquatic n-alkane types generally occurred when the n-alkane concentration peaked, and then disappeared when the n-alkane concentration decreased significantly. In addition, Paq and ACL were characterized by relatively low and high values, together with occasional extremely high and low values, respectively. The infrequent occurrence of aquatic n-alkane types and the extreme values of n-alkane parameters reflect the occasional dominant contribution of aquatic plants, including NEP. Furthermore, the large oscillations in n-alkane concentrations and parameters, accompanied by shifts in dominance between aquatic and terrestrial plants, may indicate the deepening and shallowing, or even the occasional disappearance, of a lake environment in this region.
The changes in n-alkanes after ∼4.2 Ma, accompanied by the oscillations of the level of an intermittent lake, were likely related to the evolution of the monsoon system. Increases in pedogenesis intensity are observed on the Chinese Loess Plateau at this time (Sun et al., 2010), together with increases in the chemical weathering intensity recorded by sediments of the South China Sea (Wan et al., 2007; Wan et al., 2010), accompanied by a hydroclimatic shift on the North China Plateau, from arid to humid conditions during 4.5–4.2 Ma (Lu et al., 2021). All these changes indicate the strengthening of the summer monsoon intensity. On the other hand, increases in the grain size (Lu et al., 2010) and in the accumulation area, as well as the sedimentation rate of Aeolian sediments on the Chinese Loess Plateau (Lu et al., 2019), combined with increased dust transport to the North Pacific during ∼4–3.6 Ma (Rea et al., 1998; Shen et al., 2017), together indicate the strengthening of the winter monsoon and the aridification of the Asian interior. Although the intensity of both the summer and winter monsoons increased overall, their relative strength, or their influence within the studied region, was different during different stages. Consequently, a lake generally appeared or deepened when the summer monsoon dominated, while the lake shallowed or disappeared when the winter monsoon dominated. Generally, the winter monsoon dominated during most of this stage, while the summer monsoon was occasionally dominant.
The simultaneous strengthening of the Asian summer and winter monsoons, and the aridification of the Asian interior were closely related to the tectonic uplift of the TP (An et al., 2001), especially of the NE TP (Liu and Yin, 2002; Tang et al., 2013). Abundant geomorphological and sedimentological evidence has demonstrated the occurrence of intensive tectonic activity within the NE TP in the Late Pliocene. For example, the main planation surface disintegrated at ∼3.6 Ma (Li et al., 2015); the deposition of extremely coarse conglomerate deposits was initiated in the NE TP, such as the Yumen conglomerate in the Jiuquan Basin (3.58–1.77 Ma, Liu et al., 2011), the Ganjia conglomerate in the Xunhua–Guide Basin (3.6–2.6 Ma, Song et al., 2001; Fang et al., 2005), and the Wuquan conglomerate in the Lanzhou Basin (3.6–2.2 Ma, Guo et al., 2017); and the elevation of Qinghai Lake increased by ∼1 km at ∼3.6 Ma (Richter et al., 2022). In addition, the global climate experienced a cooling trend since ∼4 Ma, which strengthened the winter monsoon but weakened the summer monsoon, resulting in the stronger influence of the winter monsoon on the NE TP compared to the summer monsoon.
5.2.3 Major increase in n-alkane types and content at ∼3.2 Ma and its link to the strengthening of the EASM and tectonic activity
Stage Ⅲ (3.2–2.6 Ma) is characterized by relatively high n-alkane concentrations and multiple n-alkane types. After 3.2 Ma, the concentration of n-alkanes rapidly and repeatedly doubled, accompanied by increased diversity, and peaked at ∼2.8 Ma, after which the n-alkane concentration and diversity both decreased. At times when the n-alkane concentration reached a maximum, types B, C, and E occurred together, accompanied by the dominant type D, while type A occurred only intermittently. This implies that aquatic plants, including NEM and EMP, became one component of a stable and dominant source of n-alkanes. In addition, the higher Paq and lower ACL values indicate the greatly increased contribution from aquatic plants (Peng et al., 2023). The corresponding lithology was dominated by gray-green mudstone, which indicates a long-term reducing environment. At the same time, the presence of high frequencies of pondweed pollen and the cells of Pediastrum indicate an increase in lake volume (Liu, 2016). This evidence indicates the rapid deepening of the lake after ∼3.2 Ma, which maintained a sufficient depth to provide a favorable environment for NEP plants until 2.8 Ma, after which the lake became shallower.
The strengthening of the EASM and regional tectonic uplift in the West Qinling Mts are regarded as the cause of lake deepening at ∼3.2 Ma (Peng et al., 2023). The magnetic susceptibility of Aeolian sediments on the central Chinese Loess Plateau increased continuously from the Early Pliocene, peaked at ∼2.8 Ma, and decreased thereafter (An et al., 2001; Song et al., 2007; Lu et al., 2010; Sun et al., 2010). Additionally, there was the increased pollen representation of hygrophilous forest vegetation in the Jiuxi Basin during 3.2–2.8 Ma (Ma et al., 2005). Together, this evidence indicates that the strengthened summer monsoon significantly influenced the NE TP during 3.2–2.8 Ma, leading to a relatively brief humid period. Additionally, geomorphological and sedimentological evidence suggests the occurrence of tectonic uplift in the West Qinling Mts and the surrounding region, in response to tectonic activity within the NE TP (Song et al., 2001; Fang et al., 2003; Guo et al., 2006). The uplift of the West Qinling Mts caused an increase in precipitation on windward slopes, including within the study region, due to the orographic interception of moisture. On the other hand, the topographic height difference likely increased with the growth of the West Qinling Mts, which caused an increase in the runoff from the high-altitude mountains to the low-altitude basin. The pronounced changes in n-alkanes imply that at ∼3.2 Ma, the West Qinling Mts may have been uplifted to a critical threshold altitude sufficient to alter the local climatic and/or geomorphological conditions.
6 Conclusion
Our systematic investigation of the n-alkanes record of a Neogene fluvial–lacustrine sedimentary sequence in the Tianshui Basin reveals major changes in productivity and source of n-alkanes, which were linked with the tectonic activity of the TP and global climate change. According to the changes in n-alkane concentrations and types, the sequence can be divided into three stages: Stage Ⅰ (12.4–4.2 Ma), characterized by an overall low n-alkane content and relatively homogeneous n-alkane source (HTP-dominated). The synchronous decrease in productivity and in the contribution of an aquatic n-alkane source after 7.4 Ma is correlative with a major climate transition from humid to arid conditions in response to global cooling. During Stage Ⅱ (4.2–3.2 Ma), the n-alkane concentration increased intermittently, accompanied by the occasional dominance of aquatic plants, reflecting the alternating deepening and shallowing or disappearance of an intermittent lake, related to the evolution of the EAM, under the influences of TP uplift and global cooling. Stage Ⅲ (3.2–2.6 Ma) was characterized by relatively high n-alkane concentrations and multiple n-alkane sources. A remarkable increase in aquatic plants and biological productivity occurred within this region at ∼3.2 Ma, possibly caused by the strengthening of the EASM and regional tectonic uplift.
Data availability statement
The original contributions presented in the study are included in the article/Supplementary Material; further inquiries can be directed to the corresponding author.
Author contributions
TP and CS designed the study; ZM, CH, ZL, and TP collected the samples; TP and XL performed the experimental analyses; XL, TP, and ZM wrote the paper with contributions from all other authors. All authors contributed to the article and approved the submitted version.
Funding
This research was supported by the National Natural Science Foundation of China (41971099, 42101156, and 41330745).
Acknowledgments
This paper is dedicated to the memory of Professor Jijun Li for his initial conception of this research topic and his continuous support. The authors sincerely thank Xingqi Liu and two reviewers, who significantly improved the quality of the original manuscript. They thank Jan Bloemendal for modifying and polishing the language on the paper. They also thank Jia Liu, Shanpin Liu, Benhong Guo, and Hao Yu for help with the field work.
Conflict of interest
The authors declare that the research was conducted in the absence of any commercial or financial relationships that could be construed as a potential conflict of interest.
Publisher’s note
All claims expressed in this article are solely those of the authors and do not necessarily represent those of their affiliated organizations, or those of the publisher, the editors, and the reviewers. Any product that may be evaluated in this article, or claim that may be made by its manufacturer, is not guaranteed or endorsed by the publisher.
Supplementary material
The Supplementary Material for this article can be found online at: https://www.frontiersin.org/articles/10.3389/feart.2023.1229346/full#supplementary-material
References
An, Z. S., Kutzbach, J. E., Prell, W. L., and Porter, S. C. (2001). Evolution of Asian monsoons and phased uplift of the Himalaya-Tibetan plateau since late Miocene times. Nature 411 (6833), 62–66. doi:10.1038/35075035
Bourbonniere, R. A., and Meyers, P. A. (1996). Sedimentary geolipid records of historical changes in the watersheds and productivities of Lakes Ontario and Erie. Limnol. Oceanogr. 41 (2), 352–359. doi:10.4319/lo.1996.41.2.0352
Bray, E. E., and Evans, E. D. (1961). Distribution of n-paraffins as a clue to recognition of source beds. Geochimica Cosmochimica Acta 22 (1), 2–15. doi:10.1016/0016-7037(61)90069-2
Brown, R. M., Chalk, T. B., Crocker, A. J., Wilson, P. A., and Foster, G. L. (2022). Late Miocene cooling coupled to carbon dioxide with Pleistocene-like climate sensitivity. Nat. Geosci. 15, 664–670. doi:10.1038/s41561-022-00982-7
Chen, C. H., Bai, Y., Fang, X. M., Guo, H., Meng, Q., Zhang, W., et al. (2019). A late Miocene terrestrial temperature history for the northeastern Tibetan plateau's period of tectonic expansion. Geophys. Res. Lett. 46 (14), 8375–8386. doi:10.1029/2019gl082805
Cooper, J. E., and Bray, E. E. (1963). A postulated role of fatty acids in petroleum formation. Geochimica Cosmochimica Acta 27 (11), 1113–1127. doi:10.1016/0016-7037(63)90093-0
Cui, Y., Schubert, B. A., and Jahren, A. H. (2020). A 23 m.y. record of low atmospheric CO2. Geology 48 (9), 888–892. doi:10.1130/g47681.1
Duan, Y., Wu, Y., Cao, X., Zhao, Y., and Ma, L. (2014). Hydrogen isotope ratios of individual n-alkanes in plants from Gannan Gahai Lake (China) and surrounding area. Org. Geochem. 77, 96–105. doi:10.1016/j.orggeochem.2014.10.005
Eglinton, G., and Hamilton, R. J. (1967). Leaf epicuticular waxes. Science 156, 1322–1335. doi:10.1126/science.156.3780.1322
Eglinton, T. I., and Eglinton, G. (2008). Molecular proxies for paleoclimatology. Earth Planet. Sci. Lett. 275 (1–2), 1–16. doi:10.1016/j.epsl.2008.07.012
Fan, M. J., Song, C. H., Dettman, D. L., Fang, X., and Xu, X. (2006). Intensification of the asian winter monsoon after 7.4 Ma: grain-size evidence from the linxia basin, northeastern tibetan plateau, 13.1 ma to 4.3 ma. Earth Planet. Sci. Lett. 248 (1), 186–197. doi:10.1016/j.epsl.2006.05.025
Fang, X. M., Garzione, C., Van der Voo, R., Li, J., and Fan, M. (2003). Flexural subsidence by 29 Ma on the NE edge of tibet from the magnetostratigraphy of Linxia Basin, China. Earth Planet. Sci. Lett. 210 (3–4), 545–560. doi:10.1016/s0012-821x(03)00142-0
Fang, X. M., Zhao, Z. J., Li, J. J., et al. (2005). Magnetostratigraphy of the Late Cenozoic Laojunmiao anticline in the northern Qilian mountains and its implications for the northern Tibetan plateau uplift. Sci. China 48 (7), 1040–1051. doi:10.1360/03yd0188
Ficken, K. J., Li, B., Swain, D. L., and Eglinton, G. (2000). An n-alkane proxy for the sedimentary input of submerged/floating freshwater aquatic macrophytes. Org. Geochem. 31 (7–8), 745–749. doi:10.1016/s0146-6380(00)00081-4
Gao, L., Hou, J., Toney, J., MacDonald, D., and Huang, Y. (2011). Mathematical modeling of the aquatic macrophyte inputs of mid-chain n-alkyl lipids to lake sediments: implications for interpreting compound specific hydrogen isotopic records. Geochimica Cosmochimica Acta 75 (13), 3781–3791. doi:10.1016/j.gca.2011.04.008
Guo, B. H., Liu, S. P., Peng, T. J., Ma, Z., Feng, Z., Li, M., et al. (2017). Late Pliocene establishment of exorheic drainage in the northeastern Tibetan plateau as evidenced by the wuquan formation in the Lanzhou Basin. Geomorphology 303, 271–283. doi:10.1016/j.geomorph.2017.12.009
Guo, J. J., Han, W. F., and Liang, S. Y. (2006). Tectono—Morphological evolution of the minxian—wudu area on the northeastern margin of the Qinghai—tibet Plateau and plateau uplift. Geol. China 33 (2), 383–392. doi:10.3969/j.issn.1000-3657.2006.02.017
Herbert, T. D., Lawrence, K. T., Tzanova, A., Peterson, L. C., Caballero-Gill, R., and Kelly, C. S. (2016). Late Miocene global cooling and the rise of modern ecosystems. Nat. Geosci. 9 (11), 843–847. doi:10.1038/ngeo2813
Hui, Z. C., Liu, J., Chevalier, M., Wei, X., Chen, P., Zhang, J., et al. (2023). Multiple forcing on late Miocene East Asian summer monsoon precipitation variability in NE Tibetan plateau. Catena 221, 106752. doi:10.1016/j.catena.2022.106752
Li, G., Li, L., Torozo, R., Longo, W. M., Wang, K. J., Dong, H., et al. (2018). Microbial production of long-chain n-alkanes: implication for interpreting sedimentary leaf wax signals. Org. Geochem. 115, 24–31. doi:10.1016/j.orggeochem.2017.10.005
Li, J., Fang, X., Song, C., Pan, B., Ma, Y., and Yan, M. (2014). Late Miocene–Quaternary rapid stepwise uplift of the NE Tibetan Plateau and its effects on climatic and environmental changes. Quat. Res. 81, 400–423. doi:10.1016/j.yqres.2014.01.002
Li, J. J., Feng, Z. D., and Tang, L. Y. (1988). Late quaternary monsoon patterns on the Loess Plateau of China. Earth Surf. Proc. Land. 13, 125–135. doi:10.1002/esp.3290130204
Li, J. J., Ma, Z. H., Li, X. M., Peng, T. J., Guo, B., Zhang, J., et al. (2017). Late Miocene–Pliocene geomorphological evolution of the Xiaoshuizi peneplain in the Maxian mountains and its tectonic significance for the northeastern Tibetan plateau. Geomorphology 295, 393–405. doi:10.1016/j.geomorph.2017.07.024
Li, J. J., Zhang, J., Song, C. H., Zhao, Z., Zhang, Y., Wang, X., et al. (2006). Miocene Bahean stratigraphy in the Longzhong Basin, northern central China and its implications in environmental change. Sci. China Ser. D. 49, 1270–1279. doi:10.1007/s11430-006-2057-y
Li, J. J., Zhou, S. Z., Zhao, Z. J., and Zhang, J. (2015). The qingzang movement: the major uplift of the qinghai–tibetan plateau. Sci. China Earth Sci. 58 (11), 2113–2122. doi:10.1007/s11430-015-5124-4
Li, X. M., Peng, T. J., Ma, Z. H., Li, M., Song, C., Zheng, Y., et al. (2023). Biomarker evidence for late Miocene temperature and moisture from the Alagu planation surface, NE Tibetan Plateau. Chem. Geol. 620, 121335. doi:10.1016/j.chemgeo.2023.121335
Li, X. M., Peng, T. J., Ma, Z. H., Li, P. Y., Feng, Z., et al. (2020). The sources and transport dynamics of eolian sediments in the NE Tibetan Plateau since 6.7 Ma. Geochem. Geophys. Geosystems 21 (3). doi:10.1029/2019gc008682
Liu, D. L., Yan, M. D., Fang, X. M., Li, H., Song, C., and Dai, S. (2011). Magnetostratigraphy of sediments from the yumu Shan, hexi corridor and its implications regarding the late cenozoic uplift of the NE Tibetan plateau. Quat. Int. 236 (1), 13–20. doi:10.1016/j.quaint.2010.12.007
Liu, H., and Liu, W. (2016). N-Alkane distributions and concentrations in algae, submerged plants and terrestrial plants from the Qinghai-Tibetan Plateau. Org. Geochem. 99, 10–22. doi:10.1016/j.orggeochem.2016.06.003
Liu, J., An, Z., and Hu, L. (2018). Leaf wax n-alkane distributions across plant types in the central Chinese Loess Plateau. Org. Geochem. 125, 260–269. doi:10.1016/j.orggeochem.2018.09.006
Liu, J. (2016). Late cenozoic climate change and uplift of the Tibetan plateau—palynological evidence from the Tianshui Basin PhD thesis. Lanzhou, China: Lanzhou University.
Liu, J., Li, J., Song, C., Yu, H., Peng, T. J., Hui, Z. C., et al. (2016). Palynological evidence for late Miocene stepwise aridification on the northeastern Tibetan plateau. Clim. past 12 (7), 1473–1484. doi:10.5194/cp-12-1473-2016
Liu, W., Yang, H., Wang, H. Y., An, Z., Wang, Z., and Leng, Q. (2015). Carbon isotope composition of long chain leaf wax n-alkanes in lake sediments: a dual indicator of paleoenvironment in the qinghai-tibet plateau. Org. Geochem. 83 (84), 190–201. doi:10.1016/j.orggeochem.2015.03.017
Liu, X., and Yin, Z. Y. (2002). Sensitivity of East Asian monsoon climate to the uplift of the Tibetan plateau. Palaeogeogr. Palaeoclimatol. Palaeoecol. 183 (3-4), 223–245. doi:10.1016/s0031-0182(01)00488-6
Lu, H., Wang, X., Li, L., et al. (2010). Aeolian sediment evidence that global cooling has driven late Cenozoic stepwise aridification in central Asia. Geol. Soc. Lond. Spec. Publ. 342 (1), 29–44. doi:10.1144/sp342.4
Lu, H. Y., Wang, X. Y., Wang, X. Y., Chang, X., Zhang, H., Xu, Z., et al. (2019). Formation and evolution of gobi desert in central and eastern asia. Earth Sci. Rev. 194, 251–263. doi:10.1016/j.earscirev.2019.04.014
Lu, J., Yang, H., Griffiths, M. L., Burls, N. J., Xiao, G., et al. (2021). Asian monsoon evolution linked to Pacific temperature gradients since the Late Miocene. Earth Planet. Sci. Lett. 563 (1), 116882. doi:10.1016/j.epsl.2021.116882
Ma, Y. Z., Fang, X., Li, J. J., Wu, F., and Zhang, J. (2005). The vegetation and climate change during neocene and early quaternary in Jiuxi Basin, China. Sci. China (Series D Earth Sci. 48 (5), 676–688. doi:10.1360/03yd0110
Meyers, P. A. (2003). Applications of organic geochemistry to paleolimnological reconstructions: a summary of examples from the laurentian great lakes. Org. Geochem. 34 (2), 261–289. doi:10.1016/s0146-6380(02)00168-7
Miao, Y., Fang, X., Herrmann, M., Wu, F., Zhang, Y., and Liu, D. (2011). Miocene pollen record of KC-1 core in the Qaidam Basin, NE Tibetan Plateau and implications for evolution of the East Asian monsoon. Palaeogeogr. Palaeoclimatol. Palaeoecol. 299, 30–38. doi:10.1016/j.palaeo.2010.10.026
Miao, Y., Fang, X., Sun, J., Xiao, W., Yang, Y., Wang, X., et al. (2022). A new biologic paleoaltimetry indicating Late Miocene rapid uplift of northern Tibet Plateau. Science 378, 1074–1079. doi:10.1126/science.abo2475
Miao, Y., Wu, F. L., Warny, S., Fang, X., Lu, H., Fu, B., et al. (2019). Miocene fire intensification linked to continuous aridification on the Tibetan Plateau. Geology 47, 303–307. doi:10.1130/G45720.1
Molnar, P., Boos, W. R., and Battisti, D. S. (2010). Orographic controls on climate and paleoclimate of asia: thermal and mechanical roles for the tibetan plateau. Annu. Rev. Earth Planet. Sci. 38 (1), 77–102. doi:10.1146/annurev-earth-040809-152456
Nie, J. S., Ren, X., Saylor, J. E., Su, Q., Horton, B. K., Bush, M. A., et al. (2020). Magnetic polarity stratigraphy, provenance, and paleoclimate analysis of Cenozoic strata in the Qaidam Basin, NE Tibetan Plateau. Geol. Soc. Am. Bull. 132 (1-2), 310–320. doi:10.1130/b35175.1
Peng, T. J., Li, J. J., Song, C. H., Guo, B., Liu, J., Zhao, Z., et al. (2016). An integrated biomarker perspective on neogene–quaternary climatic evolution in NE Tibetan plateau: implications for the asian aridification. Quat. Int. 399, 174–182. doi:10.1016/j.quaint.2015.04.020
Peng, T. J., Li, X. M., Hua, H., Li, M., et al. (2023). “Multi-proxy geochemical evidence for late Pliocene temperature and hydroclimate evolution in the Tianshui Basin,” in NE Tibetan plateau (Boulder, Colorado, United States: The Geological Society of America).
Peng, T., Li, J., Song, C., Zhao, Z., Zhang, J., Hui, Z., et al. (2012). Biomarkers challenge early Miocene loess and inferred Asian desertification. Geophys. Res. Lett. 39. doi:10.1029/2012gl050934
Poynter, J. G., Farrimond, P., Robinson, N., and Eglinton, G. (1989). “Aeolian-derived higher plant lipids in the marine sedimentary record: links with palaeoclimate,” in Paleoclimatology & paleometeorology modern & past patterns of global atmospheric transport. Editors M. Leinen, and M. Sarnthein (Netherlands: Springer), 435–462.
Rea, D. K., Snoeckx, H., and Joseph, L. H. (1998). Late Cenozoic eolian deposition in the north Pacific: asian drying, tibetan uplift, and cooling of the northern hemisphere. Paleoceanography 13 (3), 215–224. doi:10.1029/98pa00123
Richter, F., Garzione, G. N., Liu, W. G., Qiang, X., Chang, H., Cheng, F., et al. (2022). Plio-Pleistocene cooling of the northeastern Tibetan Plateau due to global climate change and surface uplift. Geol. Soc. Am. Bull. 135. doi:10.1130/B36302.1
Ruggieri, E. (2013). A Bayesian approach to detecting change points in climatic records. Int. J. Climatol. 33, 520–528. doi:10.1002/joc.3447
Shen, X. Y., Wan, S. M., FranceLanord, C., Clift, P. D., Tada, R., Révillon, S., et al. (2017). History of Asian eolian input to the Sea of Japan since 15 Ma: links to tibetan uplift or global cooling? Earth Planet. Sci. Lett. 474, 296–308. doi:10.1016/j.epsl.2017.06.053
Song, C. H., Fang, X. M., Li, J. J., Gao, J., Zhao, Z., and Fan, M. (2001). Tectonic uplift and sedimentary evolution of the Jiuxi basin in the northern margin of the Tibetan plateau since 13 Ma BP. Sci. China (Series D Earth Sci. 44, 192–202. doi:10.1007/bf02911987
Song, Y. G., Fang, X. M., Torii, M., Ishikawa, N., Li, J., and An, Z. (2007). Late Neogene rock magnetic record of climatic variation from Chinese eolian sediments related to uplift of the Tibetan plateau. J. Asian Earth Sci. 30 (2), 324–332. doi:10.1016/j.jseaes.2006.10.004
Sun, J. M., Ding, Z. L., Xiao, W. J., and Windley, B. F. (2022). Coupling between uplift of the central asian orogenic belt-NE Tibetan plateau and accumulation of aeolian red clay in the inner asia began at ∼7 Ma. Earth-Science Rev. 226, 103919. doi:10.1016/j.earscirev.2022.103919
Sun, Y. B., An, Z. S., Clemens, S. C., Bloemendal, J., and Vandenberghe, J. (2010). Seven million years of wind and precipitation variability on the Chinese Loess plateau. Earth Planet. Sci. Lett. 297, 525–535. doi:10.1016/j.epsl.2010.07.004
Tang, H., Micheels, A., Eronen, J. T., Ahrens, B., and Fortelius, M. (2013). Asynchronous responses of East Asian and Indian summer monsoons to mountain uplift shown by regional climate modelling experiments. Clim. Dyn. 40 (5-6), 1531–1549. doi:10.1007/s00382-012-1603-x
Wan, S. M., Clift, P. D., Li, A. C., and Yin, X. (2010). Geochemical records in the South China sea: implications for east asian summer monsoon evolution over the last 20 ma. Geol. Soc. Lond. Spec. Publ. 342, 245–263. doi:10.1144/sp342.14
Wan, S. M., Li, A. C., Peter, D., et al. (2007). Development of the East asian monsoon: mineralogical and sedimentologic records in the northern south china sea since 20 ma. Palaeogeogr. Palaeoclimatol. Palaeoecol. 152, 37–47. doi:10.1016/j.palaeo.2006.06.013
Wang, X. X., Li, J. J., Song, C. H., Zattin, M., Zhao, Z., Zhang, J., et al. (2012). Late Cenozoic orogenic history of Western Qinling inferred from sedimentation of Tianshui basin, northeastern margin of Tibetan Plateau. Int. J. Earth Sci. 101, 1345–1356. doi:10.1007/s00531-011-0724-5
Wen, Y. X., Zhang, L. M., Holbourn, A. E., Zhu, C., Huntington, K. W., Jin, T., et al. (2023). CO2-forced late Miocene cooling and ecosystem reorganizations in east asia. PANS 120 (5), e2214655120. doi:10.1073/pnas.2214655120
Yang, R., Yang, Y., Fang, X., Ruan, X., Galy, A., Ye, C., et al. (2019). Late Miocene intensified tectonic uplift and climatic aridification on the northeastern Tibetan Plateau: evidence from clay mineralogical and geochemical records in the xining basin. Geochem. Geophys. Geosystems 20, 829–851. doi:10.1029/2018GC007917
Yang, Y., Galy, A., Fang, X., Yang, R., Zhang, W., and Zan, J. (2018). Eolian dust forcing of river chemistry on the northeastern Tibetan plateau since 8 Ma. Earth Planet. Sci. Lett. 464, 200–210. doi:10.1016/j.epsl.2017.02.009
Yang, Y., Ye, C., Galy, A., Fang, X., Xue, Y., Liu, Y., et al. (2021). Monsoon enhanced silicate weathering as a new atmospheric CO2 consumption mechanism contributing to fast late Miocene global cooling. Paleoceanogr. Paleoclimatology 36, e2020PA004008. doi:10.1029/2020PA004008
Keywords: ecological changes, n-alkanes, Tianshui Basin, uplift of the northeastern Tibetan Plateau, global change
Citation: Li X, Peng T, Han C, Liu Z, Ma Z, Li M and Song C (2023) Changes in n-alkane distribution of the Tianshui Basin and its links to the Tibetan plateau uplift and global climate change. Front. Earth Sci. 11:1229346. doi: 10.3389/feart.2023.1229346
Received: 26 May 2023; Accepted: 07 August 2023;
Published: 22 August 2023.
Edited by:
Xingqi Liu, Capital Normal University, ChinaReviewed by:
Mingda Wang, Liaoning Normal University, ChinaGuqoiang Chu, Chinese Academy of Sciences, China
Copyright © 2023 Li, Peng, Han, Liu, Ma, Li and Song. This is an open-access article distributed under the terms of the Creative Commons Attribution License (CC BY). The use, distribution or reproduction in other forums is permitted, provided the original author(s) and the copyright owner(s) are credited and that the original publication in this journal is cited, in accordance with accepted academic practice. No use, distribution or reproduction is permitted which does not comply with these terms.
*Correspondence: Tingjiang Peng, Z2VvcGVuZ3RqQGdtYWlsLmNvbQ==