 Yue Wu1
 Kelvin T. F. Chan1,2,3*
- 1School of Atmospheric Sciences, Sun Yat-sen University, and Southern Marine Science and Engineering Guangdong Laboratory (Zhuhai), Zhuhai, China
- 2Guangdong Province Key Laboratory for Climate Change and Natural Disaster Studies, Sun Yat-sen University, Zhuhai, China
- 3Key Laboratory of Tropical Atmosphere-Ocean System (Sun Yat-sen University), Ministry of Education, Zhuhai, China
Mechanisms of tropical cyclogenesis have been studied for decades. A new one in the South China Sea, namely, PTC-STC is proposed. A subsequent tropical cyclone (STC) in the South China Sea can be induced by a pre-existing tropical cyclone (PTC) over the western North Pacific. The observations, reanalysis, and numerical sensitivity experiments suggest that the terrain of the Philippines (especially Luzon) is geographically essential to the tropical cyclogenesis and development of STC, whereas the intensity and track of PTC are conditionally decisive. If the terrain of the Philippines is replaced by sea, no STC forms. The steep mountain range of Luzon provides static blocking effect that can 1) enhance the upward motion; 2) accumulate warm moist air mass from the westerly and PTC; and 3) constrain the advection of vorticity from the PTC. Meanwhile, the northeasterly from the PTC climbs over the terrains, increases the adiabatic heating, and warms the proximity in the leeside of the mountains. These processes show that the interactions between the PTC and the terrain of the Philippines could provide favorable dynamic and thermodynamic conditions for the tropical cyclogenesis of STC in the low-to-mid troposphere of the South China Sea. Whereas, if the PTC is too strong, it could move into the South China Sea, suppressing the standalone favorable conditions for the tropical cyclogenesis of STC in the South China Sea.
Highlights
• A new tropical cyclogenesis mechanism in the South China Sea, namely, PTC-STC, is proposed: a pre-existing tropical cyclone (PTC) over the western North Pacific can induce a subsequent tropical cyclone (STC) in the South China Sea.
• The terrain of the Philippines is geographically essential to the tropical cyclogenesis of STC.
• The intensity and track of PTC are conditionally decisive to the tropical cyclogenesis of STC.
1 Introduction
Tropical cyclone (TC) is one of the most devastating natural disasters in the world. Its associated heavy rain, strong wind, and storm surges can cause significant economic loss or even casualties in the proximity. Advancing the understanding of how it forms, that is, the tropical cyclogenesis (TCG), largely helps the predictions, preparedness, and disaster mitigations, which has been therefore of great demand and interest for decades.
A pre-existing cyclonic disturbance in the lower troposphere could favor TCG (Gray, 1968). Some studies found that a moist mid-level vortex, conductive to top-down process of mass flux, is the precursor of TCG (Bister and Emanuel, 1997; Ritchie and Holland, 1997; Raymond and López Carrillo, 2011). Whereas, some suggested the bottom-up process dominates the TCG (Hendricks et al., 2004; Montgomery et al., 2006). Wang (2012) proposed that different processes are pronounced in various scales. The former emphasizes how stratiform processes and the mid-level vortex matter, namely, top-down in meso-α scale. The latter attaches importance to deep convection and related low-level convergence, namely, bottom-up in meso-β scale.
Tang et al. (2020) reviewed and summarized the TCG advances in 2014–2019. They categorized the factors contributing to TCG into external and internal ones. In general, the intraseasonal oscillations, monsoon circulations, intertropical convergence zone, mid-latitude troughs, and cut-off lows are categorized as the external factors. The organization of deep convection, development of the moist and warm core, evolution of the “pouch” structure, the roles of friction and mid-level vortex, and the importance of surface fluxes and radiative-convective equilibrium are categorized as the internal factors/processes.
The South China Sea (SCS) is a marginal sea in the western North Pacific (WNP). The TCs in the SCS could pose a catastrophic threat to the communities in the Philippines, South China, and Indochina Peninsula (Zhang et al., 2016; Zhang et al., 2019; Song et al., 2020). Wang et al. (2007) found that during southwest monsoon period, as sea surface temperature and relative humidity well favor the TCG in the SCS, positive lower-tropospheric vorticity and weak vertical wind shear are indicative to the locations of TCG. Yuan et al. (2015) summarized six types of TCG in the SCS from the samples in 2000–2011: 1) synoptic-scale wave train (SWT), 2) TC energy dispersion (TCED), 3) Pacific easterly wave (EW), 4) Borneo vortex (BV), 5) TC southwesterly shear induced vortex (TCSV), and 6) others. Compared with the WNP TCs in the main developing region, the BV and TCSV are the two unique TCG types in the SCS. Park et al. (2015) conducted a case study on Typhoon Mekkhala (2008) over the SCS using observations. They concluded that the pre-Mekkhala lower-tropospheric vortex was initiated by the synoptic perturbations from the two preceding TCs within a large-scale westerly burst related to the Madden Julian Oscillation (MJO). Under the influences of systems in multi scales, the TCG over the SCS could be a combination of multi types.
In this study, we propose a new type of TCG in the SCS: PTC-STC. We discover that a subsequent TC (STC) in the SCS can be induced by a pre-existing TC (PTC) over the WNP. According to the statistics, the ratio of PTC-STC events to the total number of TCs in the SCS is about one-third over 1980–2020. A typical case study in 1999 is conducted by both the reanalysis data and a series of numerical sensitivity experiments. The terrain of the Philippines (Luzon in particular), and the intensity and track of PTC are proposed to be the decisive factors. The introduction of PTC-STC advances and completes the current understanding of TCG in the SCS which helps the proximal communities comprehensively.
2 Data and model
2.1 Best-track data
The China Meteorological Administration (CMA) best-track data (Ying et al., 2014; Lu et al., 2021) is mainly used. Benefiting from more observations, it is one of the best best-track data that gives reliable estimates near China’s water. It provides elementary TC information including 6-hourly TC position, minimum sea-level pressure (MSLP) near the TC center, 2-min mean maximum sustained wind, etc. The best-track data from the Japan Meteorological Agency (JMA) and Joint Typhoon Warning Center (JTWC) are used for comparison. In any case, the selection of best-track data does not matter in the analysis of the PTC-STC in this study.
2.2 Reanalysis data
The National Centers for Environmental Prediction—Climate Forecast System Reanalysis (NCEP-CFSR) data is used for the numerical model (Section 2.3) initial condition. It is a global, high resolution (6-hourly, 0.5° × 0.5°, 37 levels), coupled atmosphere-ocean-land surface-sea ice system designed to provide the best estimates of the state of these coupled domains. It is one of the mainstreams with high recognition and confidence nowadays.
2.3 Numerical model
The Weather Research and Forecasting Model Version 4.0 (WRF v4.0; Powers et al., 2017) is employed. A two-way and triple-nested domain with 43 vertical levels is configured (Figure 1). The horizontal resolutions of the outermost, intermediate, and innermost domains are 36, 12, and 4 km, respectively. For the model physics, the eta microphysics (NOAA, 2001), Rapid Radiative Transfer Model (RRTMG) longwave and shortwave radiation schemes (Mlawer et al., 1997; Iacono et al., 2008), eta similarity surface layer physics (Janjić, 1994), Noah-MP (multi-physics) land surface model (Niu et al., 2011; Yang et al., 2011), Mellor-Yamada-Janjić (MYJ) planetary boundary layer scheme (Mesinger, 1993), and Kain-Fritsch (KF) cumulus scheme (Kain, 2004) are adopted in all domains. The model initial condition is derived from the CFSR and no boundary condition is updated during the simulations. All simulations are run for 72 h which is long enough as mainly the TCG stage of STC is focused on.
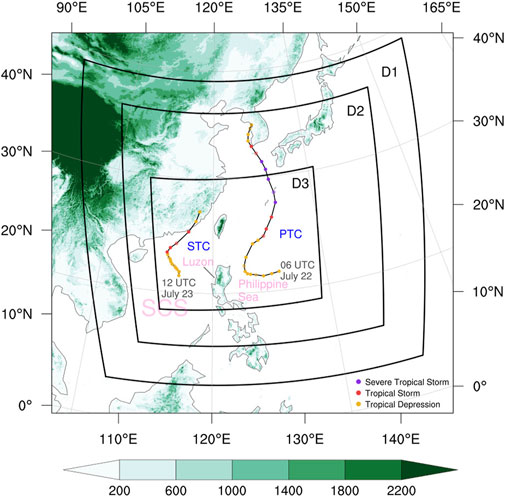
FIGURE 1. A triple-nested model domain and the 6-hourly CMA best tracks of the PTC Neil and the STC Nameless in 1999. Shadings denote the terrain height (unit: m).
2.4 Experimental design
A statistically representative PTC-STC event (PTC Neil and STC Nameless) in 1999 is chosen for the case study (Figure 1). It is explicitly selected from the climatology over 1980–2020 based on the following criteria: 1) the event is in the season that has the most occurrences of PTC-STC events (i.e., July, August or September); 2) the PTC is in the region of the highest spatial density of PTCs; 3) the STC appears after the PTC approaches and/or hits the Philippines; 4) the time difference between PTC and STC is no more than 4 days (Schenkel, 2016); 5) the relative spatial distance between PTC and STC is no more than 2,500 km (Schenkel, 2016).
In the control experiment (CTRL), we run the model with the CFSR data and test the model confidence with the CMA best-track data. The CTRL experiment intends to refine the reanalysis data (from ∼55 km downscaled to 4 km) and produce dependable model results. This not only provides a finer and reliable understanding of the physical processes, but also serves as a benchmark for the comparison with the sensitivity experiments (SEA and IN; see below). We hypothesize that the terrain of the Philippines and the intensity of PTC could matter the TCG in the SCS.
In order to test the importance of the terrain of the Philippines, we replace it by sea from the CTRL experiment, namely, SEA experiment. In addition, to test the dependence on the PTC intensity, we intensify the PTC by inserting a stronger TC-like vortex (maximum wind = 40 m s−1, radius of maximum wind = 50 km) to the CTRL experiment using TC bogus scheme from the WRF model, namely, IN experiment. The initial MSLP of PTC in the CTRL and IN experiments are about 996 hPa and 984 hPa, respectively (Figure 4D).
3 Results
3.1 Overview and CTRL experiment
Figures 1, 2 show the CMA best tracks and reanalyzed lower-tropospheric synoptic evolutions of the PTC-STC event in this study. In general, a PTC Neil (1999) formed over the WNP in late July 1999. It moved westward towards Luzon at first, and then intensified, lingered, and recurved northward on the Philippine Sea. A STC Nameless (1999) subsequently formed and developed over the SCS (Figure 2). Later, Neil moved northeastward and dissipated, while Nameless moved northwestward and made landfall on South China.
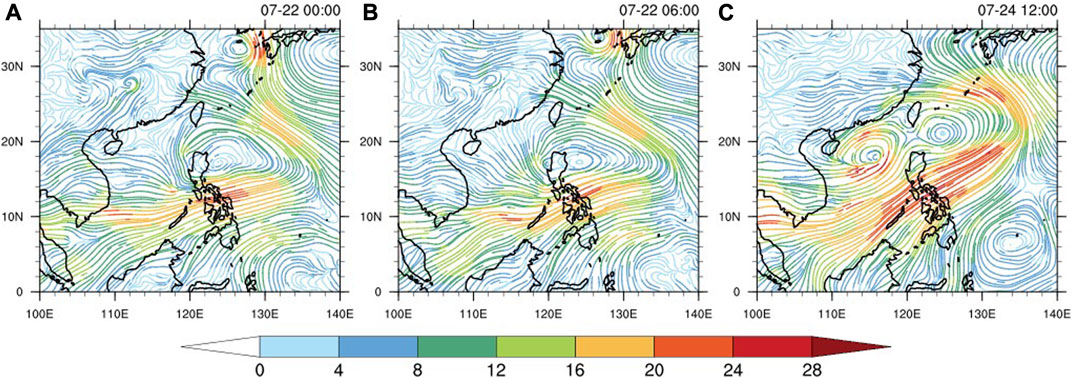
FIGURE 2. CFSR 850-hPa streamlines and wind speed (colors; unit: m s−1) at (A) 00 UTC July 22, (B) 06 UTC July 22, and (C) 12 UTC July 24.
The CTRL experiment starts at 18 UTC July 21, that is, the time when the PTC is in the Philippine Sea and before the STC forms. The model results show that when the PTC is approaching to the east of Luzon, a low-pressure disturbance emerges, develops, and becomes the STC gradually at the adjacent water west of Luzon (Figure 3). Although the STC in the late stage of simulation makes landfall on Luzon which is not in line with the best tracks (Figure 4), the successful simulation of TCG and the development of STC is promising which largely agree with the reanalysis and best-track data (cf. Figures 1–4). Hence, hereafter, the results in the early-to-mid simulation will be mainly examined which is long enough to cover the main focus, PTC-STC, of this study.
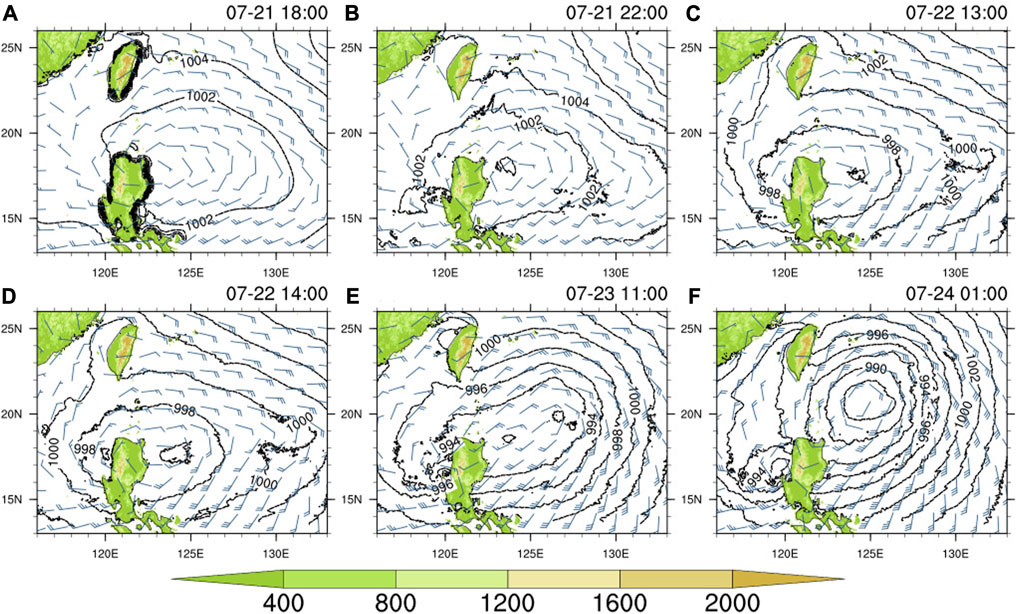
FIGURE 3. MSLP (contours; unit: hPa) and 10-m wind (wind barbs; unit: kt) in the CTRL experiment at (A) 18 UTC July 21, (B) 22 UTC July 21, (C) 13 UTC July 22, (D) 14 UTC July 22, (E) 11 UTC July 23, and (F) 01 UTC July 24. Shadings denote the terrain height (unit: m).
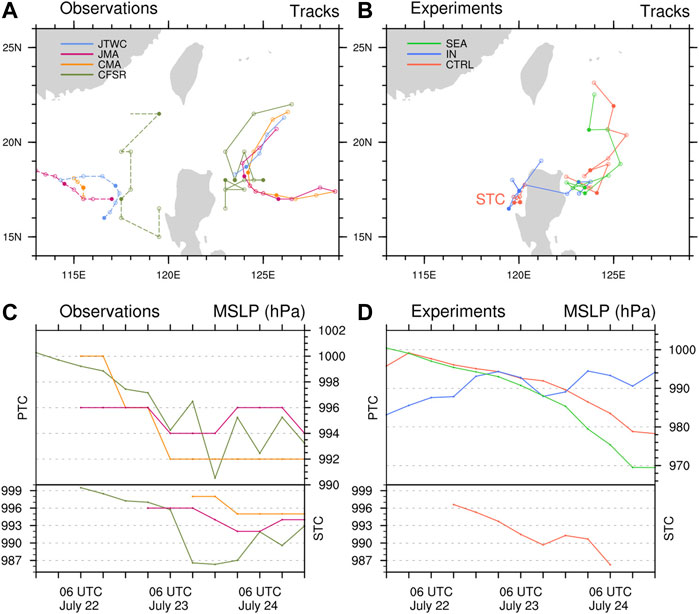
FIGURE 4. Tracks and intensity of PTC and STC (if any) in (A,C) observations (from best-track and reanalysis data) and (B,D) numerical experiments during the key window of STC formation. Tracks and intensity of CFSR, CTRL, SEA, and IN are tracked by the locations and values of MSLP, respectively. The values of MSLP are not given from the JTWC. Among the numerical experiments conducted in this study, only CTRL experiment can simulate the genesis and development of STC.
Dynamically, Figures 5, 6 suggest that the TCG of STC is largely driven by the horizontal advection and vertical propagation of absolute vorticity in the northwest water of Luzon. At early simulation, a weak embryo V around the northern tip of Luzon is found in the lower troposphere (925 hPa; Figure 5A). An embryo V is identified and traced by the local maximum of absolute vorticity. From 19 UTC July 21 to 00 UTC July 22, as the PTC moves westward, the embryo strengthens, and the lower-tropospheric wind nearby changes gradually from northeasterly to northerly or northwesterly such that the embryo is advected cyclonically correspondingly (Figure 5B). The area of embryo shrinks while it intensifies and extends upward to 500 hPa. The meso-α scale averaged vorticity about the center of embryo increases below 850 hPa (Figure 6A, box 1), which is related to the wave pouch which represents a wider cyclonic wind field that could favor the aggregation of vorticity (Dunkerton et al., 2009; Montgomery et al., 2010; Raymond and López Carrillo, 2011; Wang et al., 2012). Soon, the averaged vorticity increases in both meso-α (Figure 6A, box 2) and meso-β (Figure 6B, box 1; related to the self-development of the vortex or local fine perturbations) scales between 1 and 3 km. These imply the advected vorticity from the PTC is mainly confined in the low-to-mid troposphere (below 700 hPa) at the early stage. It is noted that examining the meso-α and meso-β scale averaged vorticity here helps to understand whether the vorticity is prevailed locally or from the larger-scale environment explicitly.
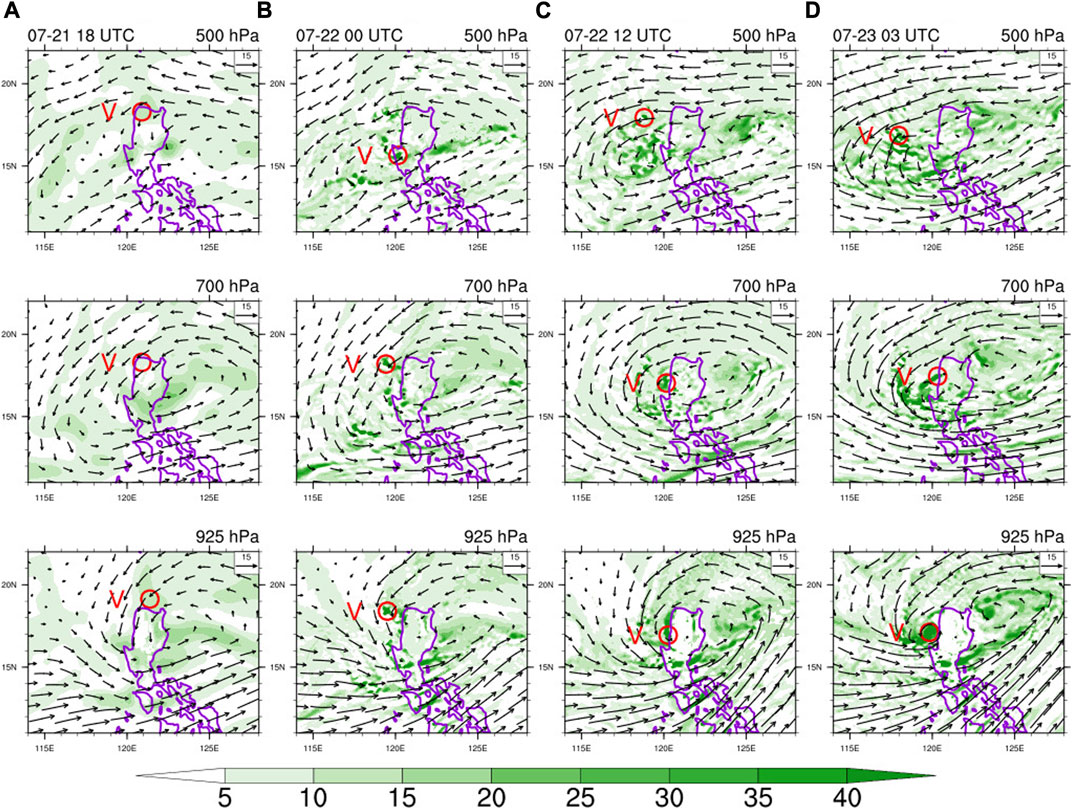
FIGURE 5. Absolute vorticity (shadings; unit: 10–5 s−1) and wind (vectors; unit: m s−1) at multi levels in the CTRL experiment at (A) 18 UTC July 21, (B) 00 UTC July 22, (C) 12 UTC July 22, and (D) 20 UTC July 22. Centers of vorticity embryos V are marked by red circles.
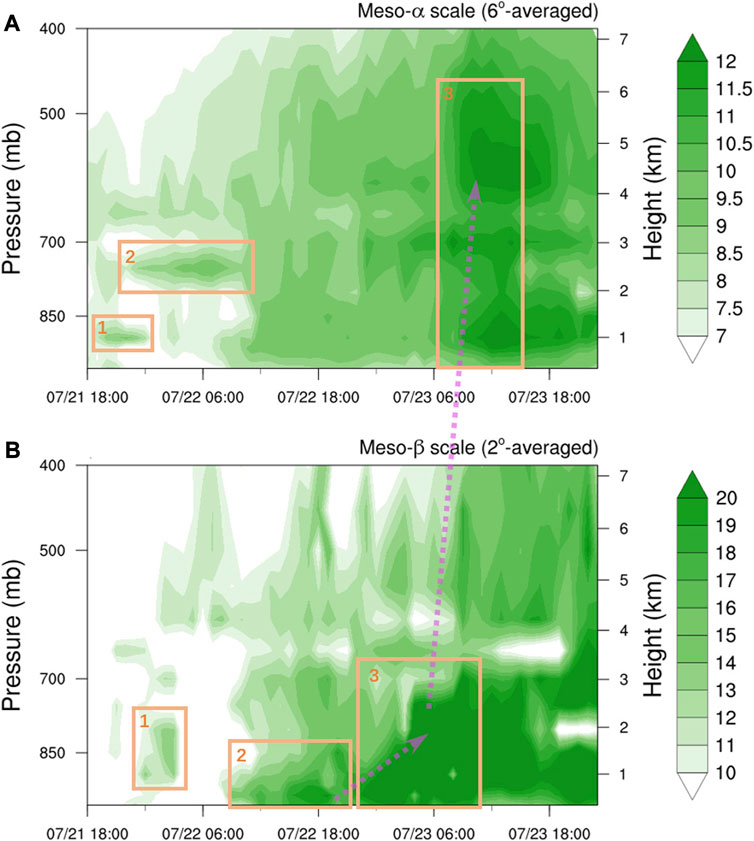
FIGURE 6. Time-height cross sections of the vorticity embryo-following absolute vorticity (shadings; unit: 10–5 s−1) in the CTRL experiment. (A) Meso-α scale 6° × 6° and (B) meso-β scale 2° × 2° box averaged about the centers of embryo V (Figure 5) at different levels (tracked by maximum absolute vorticity). Arrows show the propagation of vorticity.
Later, when the embryo is advected southward or southeastward, hits the mountain and lingers at the periphery (Figure 5C), it intensifies below 1 km after 09 UTC July 22 (Figure 6B, box 2), which is possibly related to the increasing horizontal wind shear caused by the friction of the steep mountain range near the west slope. From 06 to 18 UTC July 22, the vorticity of the embryo continues to transport downward and downscales from meso-α scale to meso-β scale. Meanwhile, the strengthened southwesterly convergence flow generates positive vorticity fragments below 700 hPa in the southern flank of the PTC causing the east-west vorticity fragment belt at 15°N spirals into the PTC center, and thus PTC intensifies gradually.
From 20 UTC July 22 to 03 UTC July 23 (Figure 5D), the horizontal wind shear over the SCS increases with the PTC intensity, provides and propagates positive vorticity upward, and feeds the embryo further. A strong vorticity in meso-β scale soon develops upward to 700 hPa gradually, just along the west side of the mountain range (Figure 6B, box 3). A structural, closed cyclonic circulation begins to appear in the lower troposphere (Figure 5D). At 06 UTC July 23, the meso-α scale averaged vorticity about the center of embryo increases sharply and soon develops throughout low-to-mid troposphere, showing the horizontally expansion and uplift of vorticity (Figure 6A, box 3).
Thermodynamically, no apparent warm core structure appears in the northwest water of Luzon in the early simulation until 05 UTC July 22 (Figure 7A). At 11 UTC July 22, a closed low-pressure disturbance forms at 925 hPa near the southwest side of the mountain range (Figure 7B). This disturbance expands northward at 13 UTC and aligns with the warm air mass near the northwest side of the mountains at 14 UTC (not shown). There is no significant deepening of disturbance from 14 to 22 UTC, but warm air at 500 hPa extends westward (Figure 7C). Subsequently, the disturbance deepens in the lower troposphere, and the warm core low-pressure center emerges in 700–925 hPa due to the adiabatic heating (Bao et al., 2018) and develops upward gradually. The disturbance becomes a tropical depression and coheres vertically with an obvious warm core structure in the low-to-mid troposphere (Figure 9A).
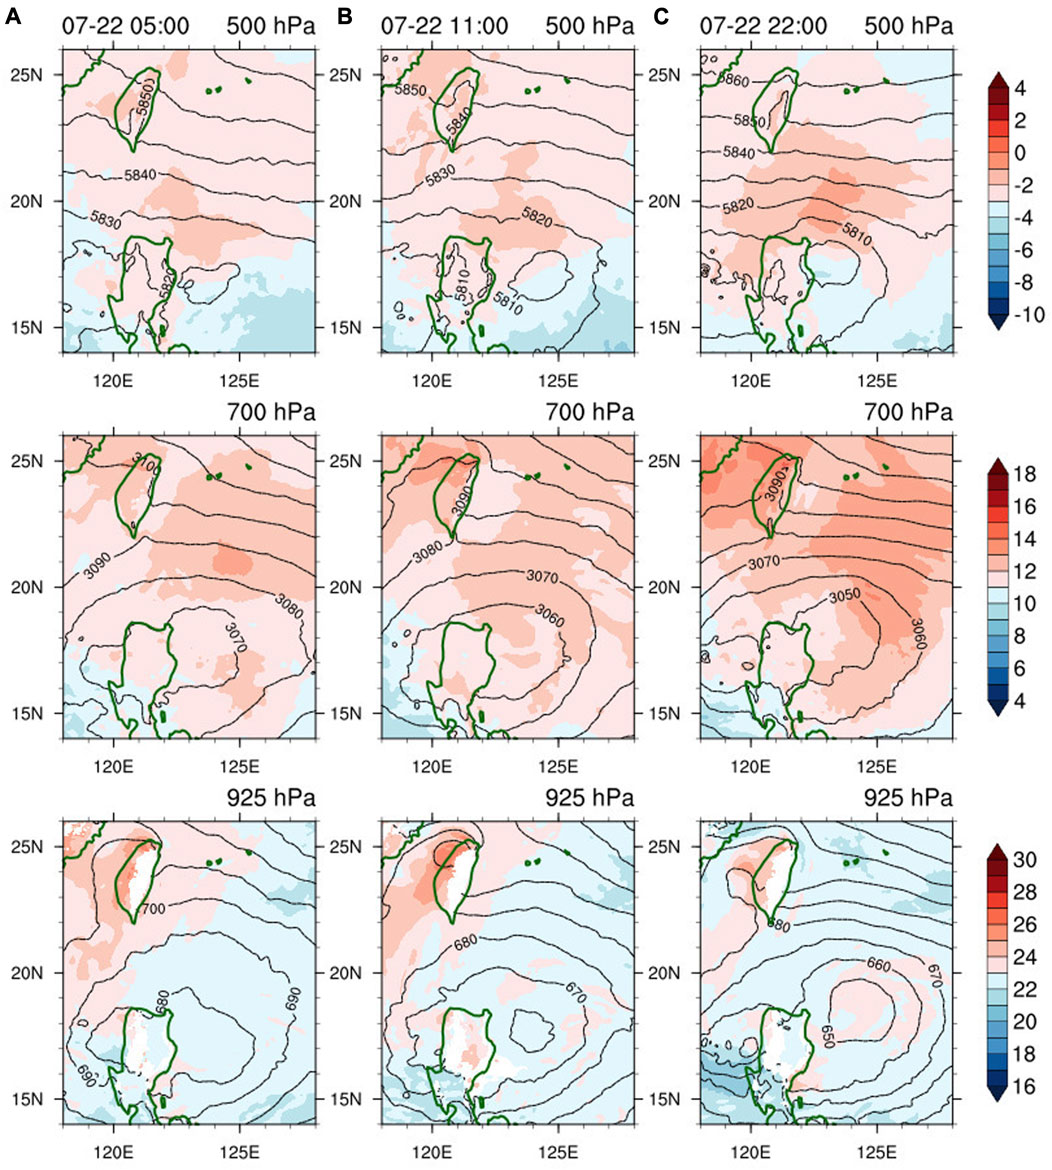
FIGURE 7. Geopotential height (contours; unit: gpm) and temperature (shadings; unit: °C) at multi levels in the CTRL experiment at (A) 05 UTC July 22, (B) 11 UTC July 22, and (C) 22 UTC July 22.
The low-to-mid troposphere is humid during the emergence of STC in the simulation. From the 18–23 UTC July 21, there is strong easterly above 3.5 km (300–650 hPa) with a moisture tongue transporting water vapor westward (Figure 8A), and relatively weak westerly underneath (650–975 hPa) over the SCS (Figure 8A). As the westerly strengthens, the water vapor below 3 km gradually accumulates near the mountains from 00 to 05 UTC July 22 (Figure 9A). With the easterly shear and uplifting over the SCS, the moisture is transported upward along the mountains. At 10 UTC July 22, the water vapor in the lower troposphere extends upward to more than 7 km above the mountain, and a deep column of wet air through the middle troposphere forms (Figure 9A) and tilts westward with height gradually. Later, the inclined wet air column moves westward to 118°E, and another column of wet air extends up from the west side of the mountain to the middle troposphere (Figure 9A).
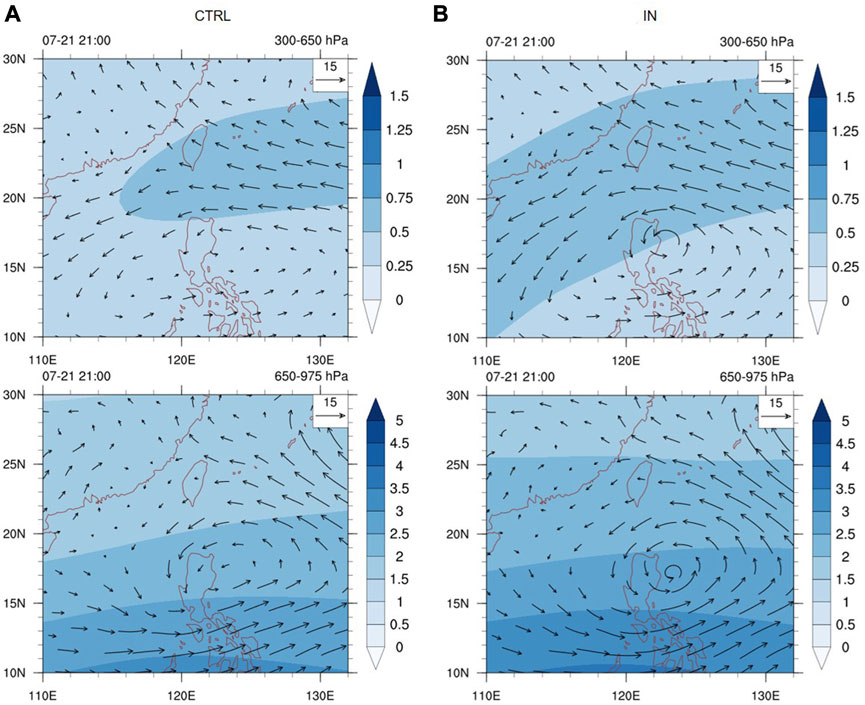
FIGURE 8. Vertically integrated water vapor flux (shadings; unit: kg m−1) and vertically averaged wind (vectors; unit: m s−1) at 21 UTC July 21 in the layers of 300–650 hPa and 650–975 hPa in the (A) CTRL and (B) IN experiments.
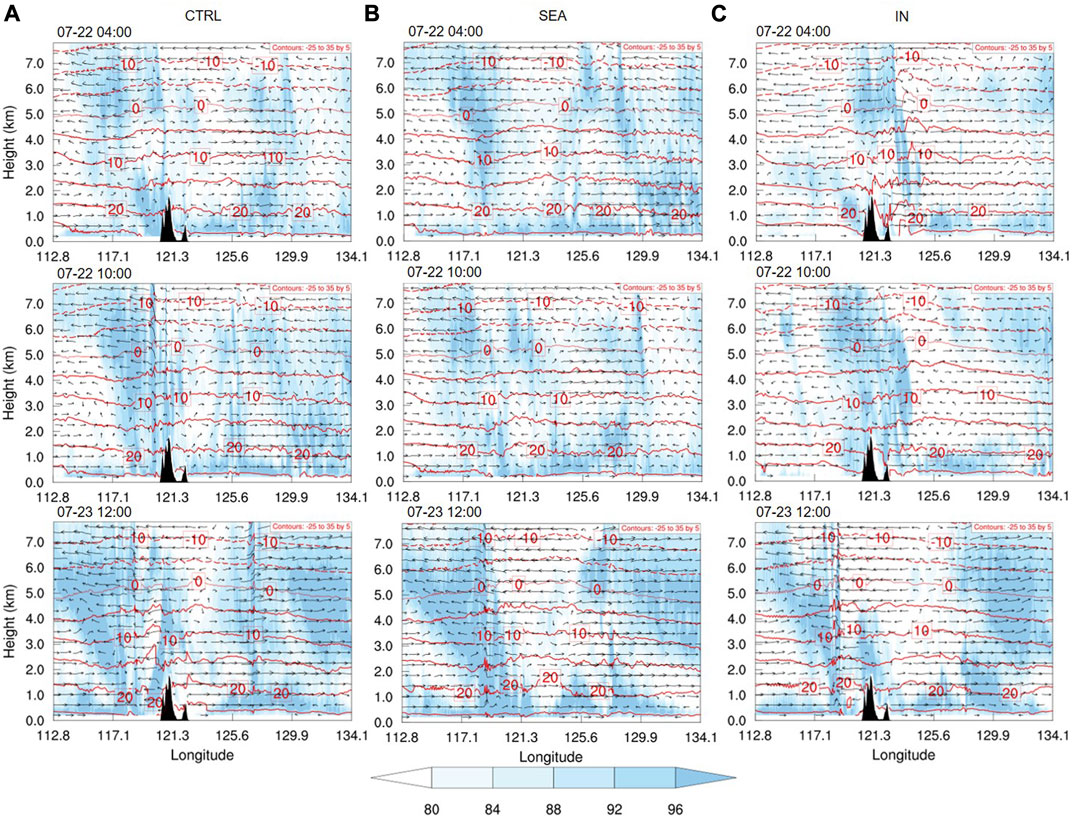
FIGURE 9. Vertical-cross sections of relative humidity (shadings; unit: %), temperature (contours; unit: °C) and wind (vectors; unit: m s−1) at 17°N in the (A) CTRL, (B) SEA, and (C) IN experiments at 04 UTC July 22, 10 UTC July 22, and 12 UTC July 23.
3.2 SEA experiment (terrain effect of the Philippines)
Inspired by both the observations and CTRL experiment (i.e., the TCG location, and the dynamic and thermodynamic evolutions of STC), we hypothesize that the terrain of the Philippines could be decisive to the TCG of STC in the SCS. The SEA experiment shows that if the terrain of the Philippines is replaced by sea, no STC forms in the SCS (Figures 4B, 10).
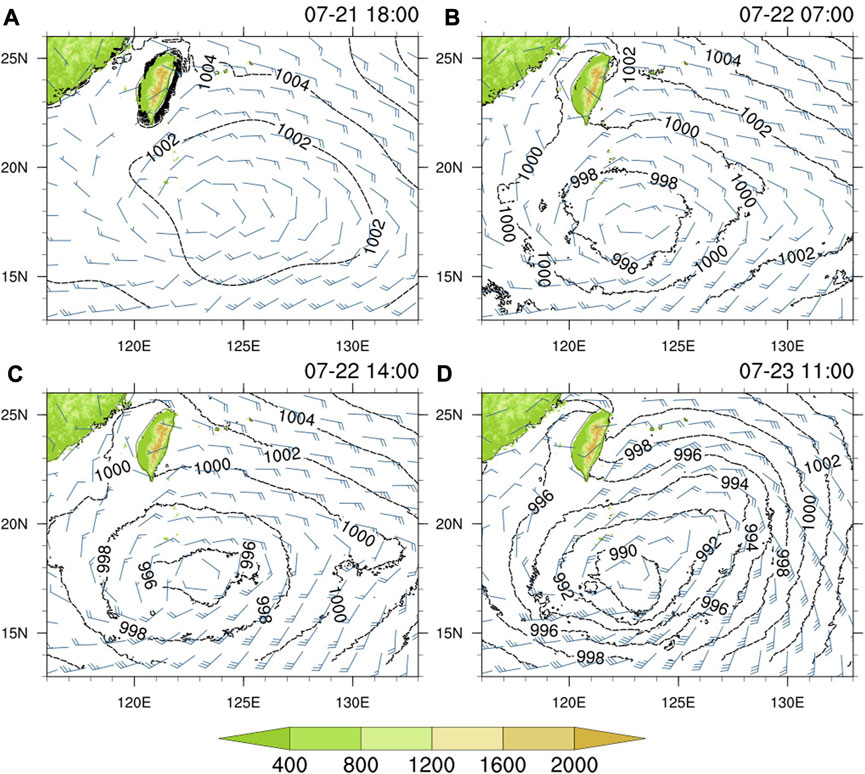
FIGURE 10. As in Figure 3, but in the SEA experiment at (A) 18 UTC July 21, (B) 07 UTC July 22, (C) 14 UTC July 22, and (D) 11 UTC July 23.
In the SEA experiment, 1) the intensity of PTC, so does its cyclonic vorticity, is stronger than that in the CTRL experiment (Figures 4D, 11); 2) a weaker cyclonic vorticity is found near the west coast of the Philippines which corresponds to the absence of southward vorticity advection of the aforementioned vorticity embryo in the CTRL experiment (Figure 11); 3) no significant accumulation of moisture is found near the position of mountains (Figure 9B), compared to the CTRL experiment; 4) the uplift due to the topographic upslope is absent (Figure 9B); and 5) no apparent warm-core low is found in the SCS (Figure 9B). All these remarkable differences suggest that the terrain of the Philippines (steep mountain range of Luzon in particular) is geographically essential to the PTC-STC type of TCG in the SCS because it acts like a physical barrier that can accumulate moisture (Figure 9B), constrain the vorticity embryo, allow upslope lifting, and facilitate cyclonic development in the lower troposphere of the SCS, providing favorable TCG conditions for the STC.
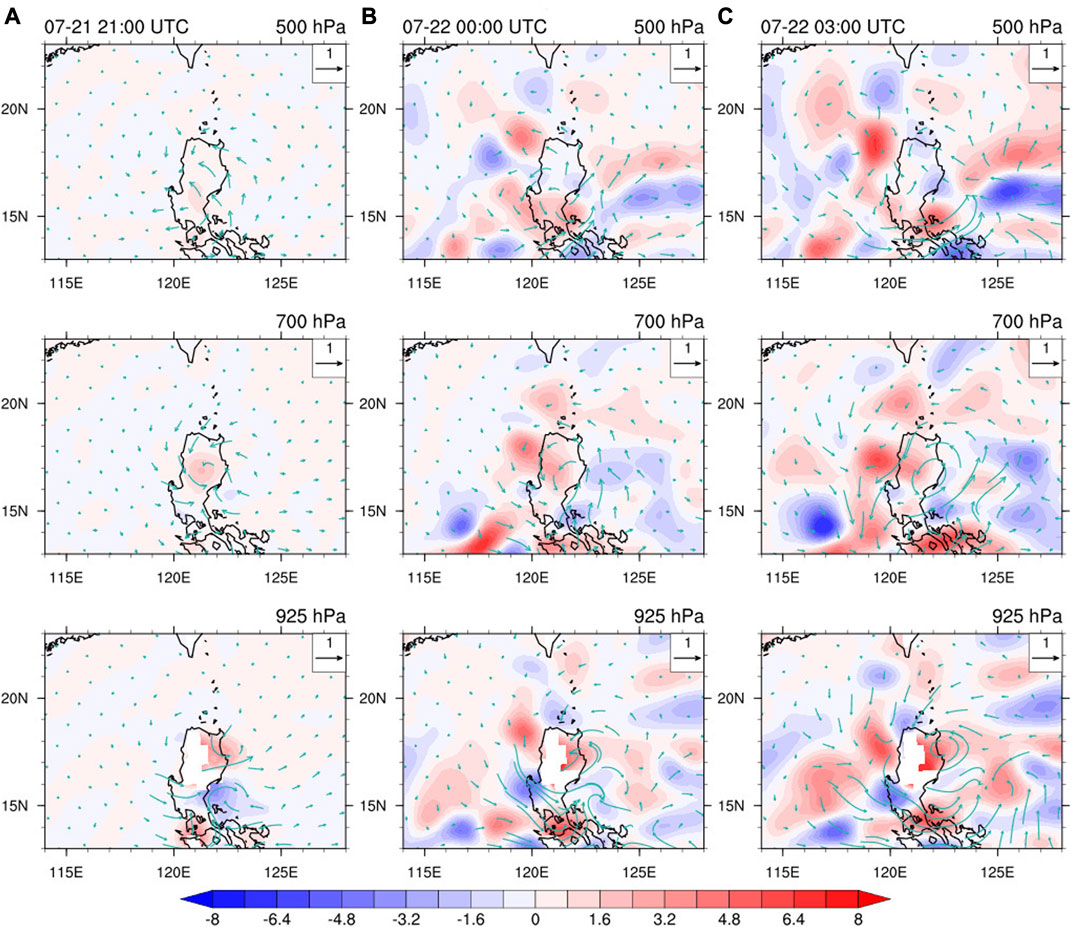
FIGURE 11. Differences in absolute vorticity (shadings; unit: 10–5 s−1) and horizontal wind (vectors; unit: m s−1) between the SEA and CTRL experiments (i.e., SEA minus CTRL) at (A) 21 UTC July 21, (B) 00 UTC July 22, and (C) 03 UTC July 22.
3.3 IN experiment (dependence on PTC intensity and track)
Climatologically, we discover several similar PTC-STC events in recent decades (1980–2020; not shown). Among them, most of the PTCs are not very strong (below typhoon level) and do not move into the SCS. Hence, we further hypothesize that the TCG of STC in the SCS could be PTC intensity and track dependent. The IN experiment shows that if the PTC is strong, the PTC could move into the SCS, the occurrence of TCG of STC is unlikely (Figures 4B, 12).
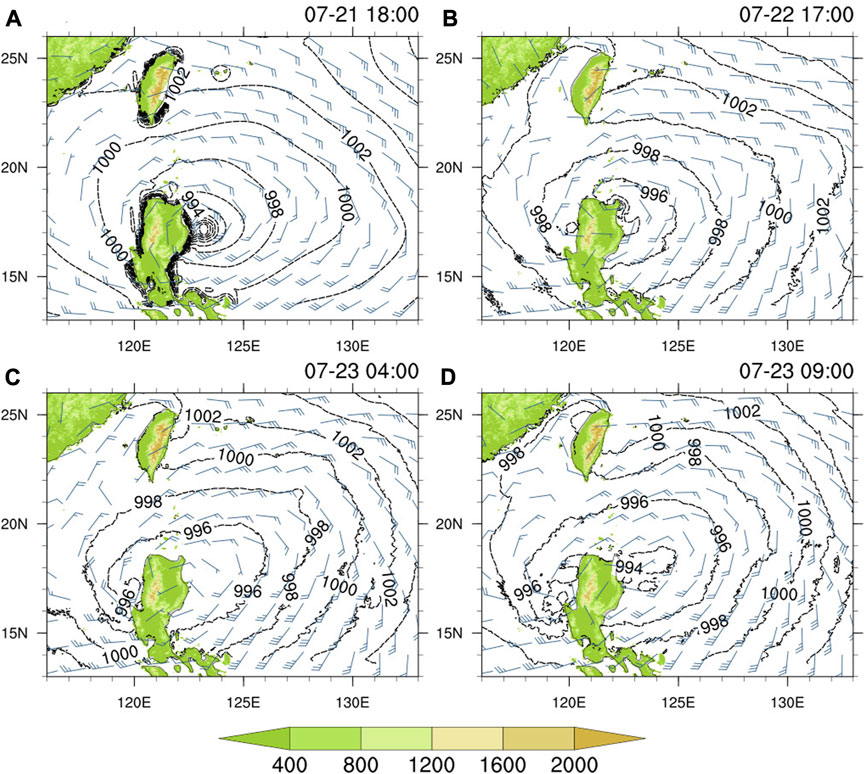
FIGURE 12. As in Figure 3, but in the IN experiment at (A) 18 UTC July 21, (B) 17 UTC July 22, (C) 04 UTC July 23, and (D) 09 UTC July 23.
In the IN experiment, the stronger PTC (Figure 13A) moves northward along the east coast of Luzon from 18 UTC July 21 to 10 UTC July 22, and gradually approaches the island westward (Figures 4, 12A). With the strengthening of PTC, the northeasterly near the west coast of Luzon gets stronger as well and no obvious warm core appears on the leeside. The PTC makes landfall on the northeast coast of Luzon at 17 UTC July 22 (Figure 12B). As it encounters mountains, its warm-core low structure is distorted and weakened (Figure 14B). During the landfall of PTC, a new weak lower-tropospheric low-pressure center emerges on the west side of the mountain range from 14 UTC July 22 and moves southward gradually (Figures 12, 14A, 14B). As less positive vorticity arises near the west coast of Luzon, the subsequent new center soon dissipates (Figure 13B). Instead, the cyclonic low-pressure structure of PTC crosses Luzon and enters the SCS. A new center of PTC appears in the lower troposphere at 00 UTC July 23 and redevelops (Figures 13C, 14C). No standalone STC forms.
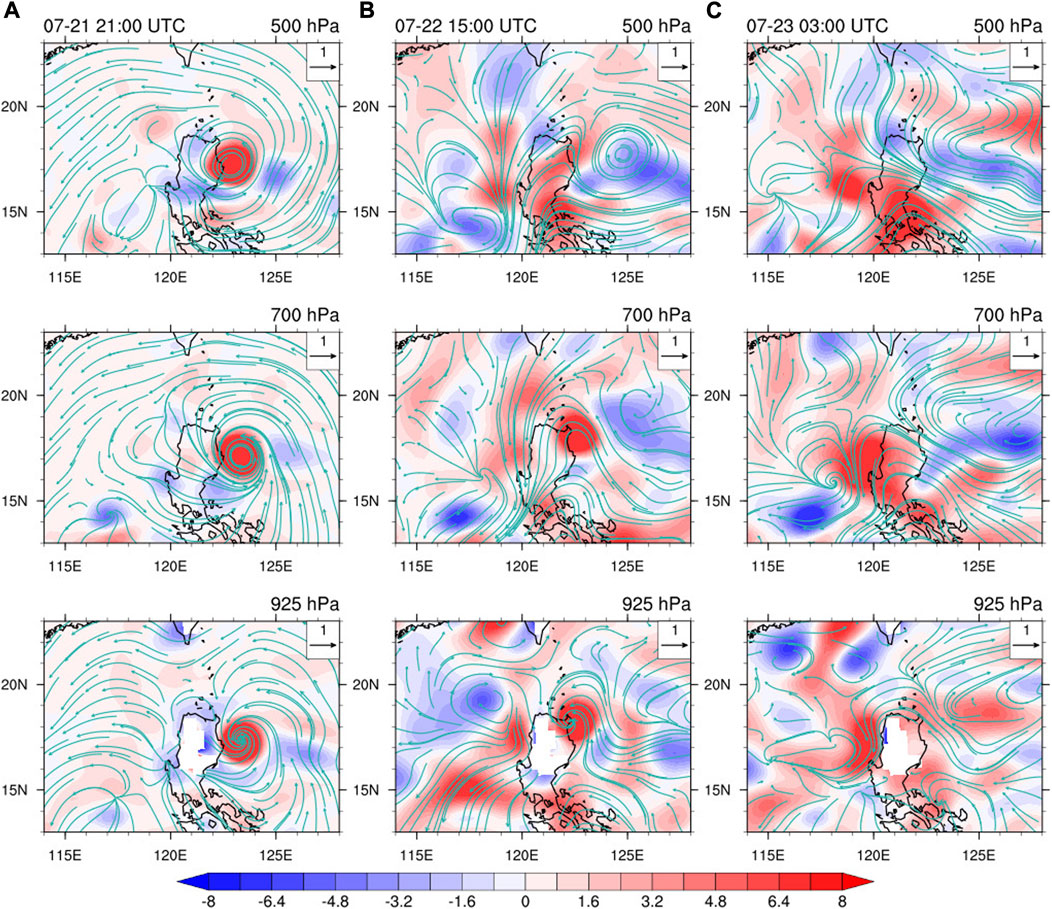
FIGURE 13. Differences in absolute vorticity (shadings; unit: 10–5 s−1) and horizontal wind (vectors; unit: m s−1) between the IN and CTRL experiments (i.e., IN minus CTRL) at (A) 21 UTC July 21, (B) 15 UTC July 22, and (C) 03 UTC July 23.
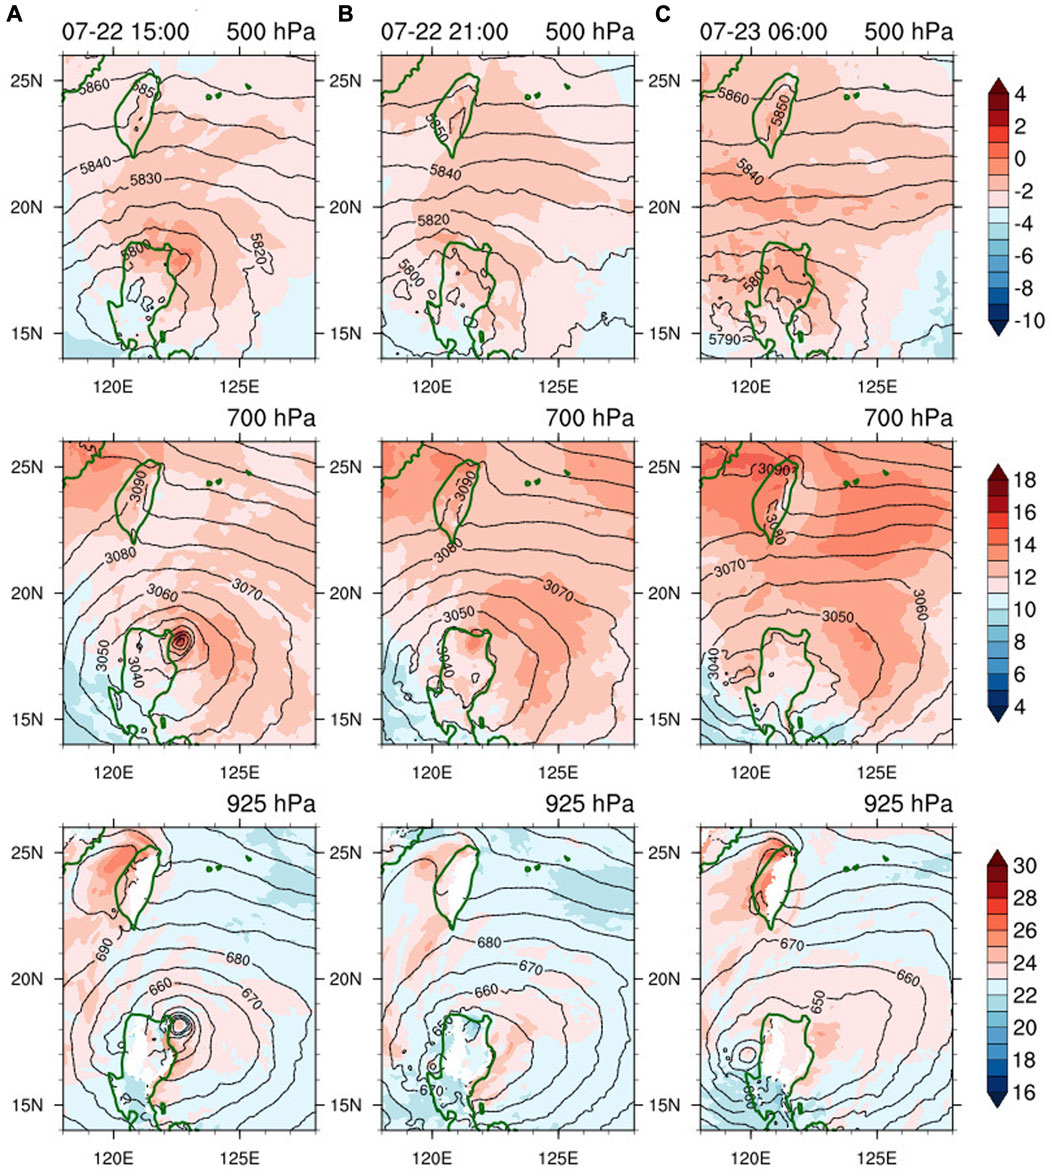
FIGURE 14. As in Figure 7, but in the IN experiment at (A) 15 UTC July 22, (B) 21 UTC July 22, and (C) 06 UTC July 23.
In the process of the intensified PTC approaching and passing through Luzon, the water vapor mainly transports from east to west in 300–650 hPa (Figure 8B), and the water vapor flux in 650–975 hPa is larger than that in CTRL (cf. Figures 8A, B). The wet air on the east side of the mountains is lifted to the middle troposphere, and moves westward gradually (Figure 9C). The water vapor in the lower troposphere over the SCS is also lifted on the west side of the mountains. Compared to the CTRL experiment, the stronger easterly wind above 3 km and less moisture accumulating below 3 km to the west of Luzon in the early stage (cf. Figures 9A, C) could suppress the development of local convective activities over the SCS and thus does not favor the formation of STC.
4 Summary and discussion
A new TCG mechanism in the SCS, namely, PTC-STC, is proposed in this study. It is discovered that a PTC in the WNP can induce a STC in the SCS. The terrain of the Philippines (especially Luzon) is geographically essential to the TCG and development of STC, whereas the intensity and track of PTC are conditionally decisive. If the terrain of the Philippines is replaced by sea, no STC forms. Figure 15 shows the key processes of PTC-STC. The steep mountain range of Luzon provides static blocking effect that can enhance the upward motion, accumulate warm moist air mass from the westerly and PTC, and constrain the advection of vorticity from the PTC. Meanwhile, the northeasterly from the PTC climbs over the terrains, increases the adiabatic heating, and warms the proximity in the leeside of the mountains. These processes show that the interactions between the PTC and the terrain of the Philippines could provide favorable dynamic and thermodynamic conditions for the tropical cyclogenesis of STC in the low-to-mid troposphere of the SCS. Whereas, if the PTC is too strong, the PTC could move into the SCS, the standalone favorable conditions for the TCG would be suppressed, and no STC forms.
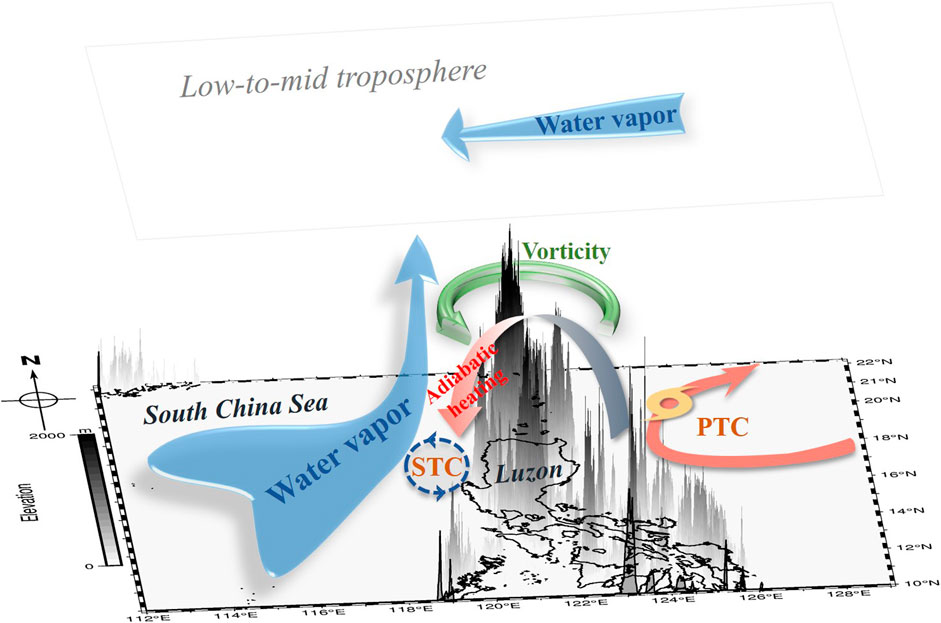
FIGURE 15. Conceptual diagram of PTC-STC.
Notably, although this is just a case study which could not cover all the physical processes of similar events, the observation, reanalysis and simulations suggest that the proposed mechanism and physical reasonings are evident. This study may provide insight into the TCG likelihood in not only the SCS, but also the other regions with similar features. In future, more case studies can be examined to identify new discoveries if any. In addition, a fully idealized sensitivity modelling can be systematically conducted to further test the geometry of terrain (including its height, slope, and shape), and the generic thresholds of intensity and size of PTC, etc.
Data availability statement
The CMA best-track data were obtained from http://tcdata.typhoon.org.cn. The JMA and JTWC best-track data were extracted from https://www.ncei.noaa.gov/data/international-best-track-archive-for-climate-stewardship-ibtracs/v04r00/access/csv/. The NCEP-CFSR reanalysis data were downloaded from https://rda.ucar.edu/datasets/ds094.0. The original contributions presented in the study are included in the article/Supplementary material, further inquiries can be directed to the corresponding author.
Author contributions
KC conceived the idea and supervised the study. YW performed the analysis. All authors contributed to the article and approved the submitted version.
Funding
This study was jointly supported by the National Key R&D Program of China (2019YFC1510400), the National Natural Science Foundation of China (41975052), the Guangdong Basic and Applied Basic Research Foundation (2023A1515010741), the Innovation Group Project of the Southern Marine Science and Engineering Guangdong Laboratory (Zhuhai) (311021001), and the Guangdong Province Key Laboratory for Climate Change and Natural Disaster Studies (2020B1212060025).
Conflict of interest
The authors declare that the research was conducted in the absence of any commercial or financial relationships that could be construed as a potential conflict of interest.
Publisher’s note
All claims expressed in this article are solely those of the authors and do not necessarily represent those of their affiliated organizations, or those of the publisher, the editors and the reviewers. Any product that may be evaluated in this article, or claim that may be made by its manufacturer, is not guaranteed or endorsed by the publisher.
References
Bao, X. W., Ma, L. M., Liu, J. Y., Tang, J., and Xu, J. (2018). Formation and development of a mountain-induced secondary center inside Typhoon Morakot (2009). Adv. Atmos. Sci. 35, 1160–1176. doi:10.1007/s00376-018-7199-2
Bister, M., and Emanuel, K. A. (1997). The genesis of Hurricane Guillermo: TEXMEX analyses and a modeling study. Mon. Weather Rev. 125, 2662–2682. doi:10.1175/1520-0493(1997)125<2662:tgohgt>2.0.co;2
Dunkerton, T. J., Montgomery, M. T., and Wang, Z. (2009). Tropical cyclogenesis in a tropical wave critical layer: Easterly waves. Atmos. Chem. Phys. 9, 5587–5646. doi:10.5194/acp-9-5587-2009
Gray, W. M. (1968). Global view of the origin of tropical disturbances and storms. Mon. Weather Rev. 96, 669–700. doi:10.1175/1520-0493(1968)096<0669:gvotoo>2.0.co;2
Hendricks, E. A., Montgomery, M. T., and Davis, C. A. (2004). The role of “vortical” hot towers in the formation of tropical cyclone Diana (1984). J. Atmos. Sci. 61, 1209–1232. doi:10.1175/1520-0469(2004)061<1209:trovht>2.0.co;2
Iacono, M. J., Delamere, J. S., Mlawer, E. J., Shephard, M. W., Clough, S. A., and Collins, W. D. (2008). Radiative forcing by long-lived greenhouse gases: calculations with the AER radiative transfer models. J. Geophys. Res. Atmos. 113, D13103. doi:10.1029/2008JD009944doi:D13103
Janjić, Z. I. (1994). The step–mountain eta coordinate model: further developments of the convection, viscous sublayer, and turbulence closure schemes. Mon. Weather Rev. 122, 927–945. doi:10.1175/1520-0493(1994)122%3c0927:TSMECM%3e2.0
Kain, J. S. (2004). The Kain-Fritsch convective parameterization: an update. J. Appl. Meteorology Climatol. 43, 170–181. doi:10.1175/1520-0450(2004)043<0170:TKCPAU>2.0
Lu, X. Q., Yu, H., Ying, M., Zhao, B. K., Zhang, S., Lin, L. M., et al. (2021). Western North Pacific tropical cyclone database created by the China Meteorological Administration. Adv. Atmos. Sci. 38, 690–699. doi:10.1007/s00376-020-0211-7
Mesinger, F. (1993). Forecasting upper tropospheric turbulence within the framework of the Mellor-Yamada 2.5 closure. Res. Activities Atmos. Ocean. Model. 18, 4–28.
Mlawer, E. J., Taubman, S. J., Brown, P. D., Iacono, M. J., and Clough, S. A. (1997). Radiative transfer for inhomogeneous atmospheres: RRTM, a validated correlated-k model for the longwave. J. Geophys. Res. Atmos. 102, 16663–16682. doi:10.1029/97JD00237
Montgomery, M. T., Lussier, L. L., Moore, R. W., and Wang, Z. (2010). The genesis of Typhoon Nuri as observed during the tropical cyclone structure 2008 (TCS-08) field experiment–part 1: the role of the easterly wave critical layer. Atmos. Chem. Phys. 10, 9879–9900. doi:10.5194/acp-10-9879-2010
Montgomery, M. T., Nicholls, M. E., Cram, T. A., and Saunders, A. B. (2006). A vortical hot tower route to tropical cyclogenesis. J. Atmos. Sci. 63, 355–386. doi:10.1175/jas3604.1
Niu, G. Y., Yang, Z. L., Mitchell, K. E., Chen, F., Ek, M. B., Barlage, M., et al. (2011). The community Noah land surface model with multiparameterization options (Noah-MP): 1. Model description and evaluation with local-scale measurements. J. Geophys. Res. Atmos. 116, D12109. doi:10.1029/2010JD015139doi:D12109
NOAA, (2001). National oceanic and atmospheric administration changes to the ncep meso eta analysis and forecast system: increase in resolution, new cloud microphysics, modified precipitation assimilation, modified 3DVAR analysis. https://www.emc.ncep.noaa.gov/users/mesoimpldocs/mesoimpl/eta12tpb/.
Park, M. S., Kim, H. S., Ho, C. H., Elsberry, R. L., and Lee, M. I. (2015). Tropical cyclone Mekkhala’s (2008) formation over the South China Sea: Mesoscale, synoptic-scale, and large-scale contributions. Mon. Weather Rev. 143, 88–110. doi:10.1175/MWR-D-14-00119.1
Powers, J. G., Klemp, J. B., Skamarock, W. C., Davis, C. A., Dudhia, J., Gill, D. O., et al. (2017). The weather research and forecasting model: overview, system efforts, and future directions. Bull. Am. Meteorological Soc. 98, 1717–1737. doi:10.1175/BAMS-D-15-00308.1
Raymond, D. J., and López Carrillo, L. (2011). The vorticity budget of developing typhoon Nuri (2008). Atmos. Chem. Phys. 11, 147–163. doi:10.5194/acp-11-147-2011
Ritchie, E. A., and Holland, G. J. (1997). Scale interactions during the formation of Typhoon Irving. Mon. Weather Rev. 125, 1377–1396. doi:10.1175/1520-0493(1997)125<1377
Schenkel, B. A. (2016). A climatology of multiple tropical cyclone events. J. Clim. 29, 4861–4883. doi:10.1175/JCLI-D-15-0048.1
Song, J., Duan, Y., and Klotzbach, P. J. (2020). Revisiting the relationship between tropical cyclone size and intensity over the western North Pacific. Geophys. Res. Lett. 47. doi:10.1029/2020GL088217doi:e2020GL088217
Tang, B. H., Fang, J., Bentley, A., Kilroy, G., Nakano, M., Park, M.-S., et al. (2020). Recent advances in research on tropical cyclogenesis. Trop. Cyclone Res. Rev. 9, 87–105. doi:10.1016/j.tcrr.2020.04.004
Wang, G., Su, J., Ding, Y., and Chen, D. (2007). Tropical cyclone genesis over the South China Sea. J. Mar. Syst. 68, 318–326. doi:10.1016/j.jmarsys.2006.12.002
Wang, Z., Dunkerton, T. J., and Montgomery, M. T. (2012). Application of the marsupial paradigm to tropical cyclone formation from northwestward propagating disturbances. Mon. Weather Rev. 140, 66–76. doi:10.1175/2011MWR3604.1
Wang, Z. (2012). Thermodynamic aspects of tropical cyclone formation. J. Atmos. Sci. 69, 2433–2451. doi:10.1175/jas-d-11-0298.1
Yang, Z. L., Niu, G.-Y., Mitchell, K. E., Chen, F., Ek, M. B., Barlage, M., et al. (2011). The community Noah land surface model with multiparameterization options (Noah-MP): 2. Evaluation over global river basins. J. Geophys. Res. Atmos. 116, D12110. doi:10.1029/2010JD015140doi:D12110
Ying, M., Zhang, W., Yu, H., Lu, X., Feng, J., Fan, Y., et al. (2014). An overview of the China Meteorological Administration tropical cyclone database. J. Atmos. Ocean. Technol. 31, 287–301. doi:10.1175/JTECH-D-12-00119.1
Yuan, J. N., Li, T., and Wang, D. X. (2015). Precursor synoptic-scale disturbances associated with tropical cyclogenesis in the South China Sea during 2000–2011. Int. J. Climatol. 35, 3454–3470. doi:10.1002/joc.4219
Zhang, C., Hu, C., Huang, G., Yao, C., Zheng, Z., Wang, T., et al. (2019). Perspective on landfalling frequency and genesis location variations of southern China typhoon during peak summer. Geophys. Res. Lett. 46, 6830–6838. doi:10.1029/2019GL083420
Keywords: tropical cyclogenesis, South China Sea (SCS), numerical simulation, western North Pacific (WNP), binary typhoons events, terrain effects
Citation: Wu Y and Chan KTF (2023) Subsequent tropical cyclogenesis in the South China Sea induced by the pre-existing tropical cyclone over the western North Pacific: a case study. Front. Earth Sci. 11:1235748. doi: 10.3389/feart.2023.1235748
Received: 06 June 2023; Accepted: 21 August 2023;
Published: 06 September 2023.
Edited by:
Kevin Cheung, E3-Complexity Consultant, Sydney, NSW, AustraliaReviewed by:
Haikun Zhao, Nanjing University of Information Science and Technology, ChinaDifei Deng, University of New South Wales Canberra, Australia
Copyright © 2023 Wu and Chan. This is an open-access article distributed under the terms of the Creative Commons Attribution License (CC BY). The use, distribution or reproduction in other forums is permitted, provided the original author(s) and the copyright owner(s) are credited and that the original publication in this journal is cited, in accordance with accepted academic practice. No use, distribution or reproduction is permitted which does not comply with these terms.
*Correspondence: Kelvin T. F. Chan, Y2hlbnRoMjVAbWFpbC5zeXN1LmVkdS5jbg==