 O. Kost
 J. Sliwinski
 N. Gies
 M. Lueder3
 H. Stoll
- 1Geological Institute, ETH Zürich, Zurich, Switzerland
- 2School of Earth and Environmental Sciences, University of St Andrews, Scotland, United kingdom
- 3Institute of Geological Sciences, University of Bern, Bern, Switzerland
Trace elements and calcite fabrics in stalagmites are increasingly employed as indicators of past environmental conditions. The drivers of trace element concentrations and fabrics reflect a complex interplay of factors during crystal growth, and accurate interpretation of geochemical proxies requires a clear understanding of the incorporation of the proxy signal in the stalagmite. We employ a series of non-destructive techniques to compare the spatial distribution of water, organic components, and trace elements and in relationship with calcite fabrics, and evaluate if these distributions are consistent with recent hypotheses about controlling factors on crystal fabrics, fluid inclusions, and element incorporation. We use for the first time Fourier Transformation Infrared Focal-Plane Array (FTIR-FPA) imaging to show the distribution of molecular water (3,400 cm−1 absorbance) and organic matter (2,983 cm−1) in calcite. To test if entrapped water in speleothem calcite affects the abundance or distribution of trace elements, the element distribution (Na, Mg, Sr, U, Al, Y, and Zn) is mapped by Laser Ablation Inductively Coupled Plasma Mass Spectrometry (LA-ICP-MS). Transmitted Light Microscope imaging constrains crystal fabrics. We find that stalagmite areas with strong Organic Matter fluorescence via Confocal Laser Scanning Microscopy coincide with areas of high Fourier Transformation Infrared absorbance at 2,983 cm−1, suggesting common co-location of multiple organic matter types in the stalagmite. While microscopic fluid inclusions visible in transmitted light are also detected by FTIR 3400 cm−1 absorbance, the FTIR additionally detects submicroscopic fluid inclusions, but not evident in transmitted light microscopy. In most samples, Na concentration is elevated in regions of high fluid inclusion density, suggesting that a significant portion of Na may be hosted in entrapped water rather than in the calcite. Only samples with 100-fold higher Y, feature Na concentrations which appear dominated by coupled Y-Na substitution and little influenced by fluid inclusion hosted Na. Our analysis provides new evidence of the influence of fluid inclusions on trace element content of stalagmites and illustrates the utility of several non-destructive imaging techniques to improve interpretations of proxy signals based on trace elements.
Highlights
• In situ FTIR analysis in stalagmites distinguishes free water from organic matter
• Free water is present throughout stalagmite calcite (often) without visible fluid inclusions
• Na concentration can be controlled by fluid inclusions in some but not all stalagmites
• KSr and KMg agree with literature, while KNa and KU are highly variable
• Diagenetic sealing of crystallites may explain lateral chemical variations
1 Introduction
Speleothems provide a time-resolved archive for past conditions (Fairchild and Baker, 2012). Environmental changes outside and within the cave may be recorded in geochemical proxies such as carbon and oxygen isotopes and trace elements in the calcite, oxygen and hydrogen isotopic ratio and noble gas content of fluid inclusions (FIs), and variations in organic biomarkers. At the same time, environmental conditions are also thought to influence physical properties of calcite such as fluorescence, layer thickness, fabrics.
While there is great interest in employing speleothem geochemistry to infer past environmental conditions, there is growing awareness that the variations in the geochemical composition of a speleothem result not only from the direct influence of varying environmental factors but also from the potentially complex interplay between calcite growth mechanisms and the organic and inorganic dissolved components in dripwater. In this study, we focus particularly on the significance of organic complexes and FI’s for speleothem geochemistry. Organic chelating complexes enhance the mobility of insoluble elements so they may be transported to the stalagmites in dripwater (Hartland et al., 2014) but the effective complexation of transition metals can limit their subsequent incorporation into calcite (e.g., Lindeman et al., 2022). Organic molecules may also affect crystal growth and the density of crystal defects and pores (Chalmin et al., 2013; Green et al., 2016; Pearson et al., 2020). In addition to the direct substitution for Ca2+ (Bardelli et al., 2011), trace elements may be incorporated at interstitial sites (Ishikawa and Ichikuni, 1984) or crystal lattice defects (Busenberg and Plummer, 1985), or by sorption to an existing mineral surface (Paquette and Reeder, 1995; Curti, 1997; Rimstidt et al., 1998). Consequently, changes in crystal defect density may influence element incorporation. Although, many organic molecules are incorporated in calcite in proportion to their abundance in dripwater (Pearson et al., 2020), the net effect of higher organic concentrations on the concentration of trace elements in stalagmites has not been widely evaluated in natural samples.
Despite the wide application of FIs in speleothems for water oxygen and hydrogen isotopes and noble gas analysis (Affolter et al., 2014; Ghadiri et al., 2018) or liquid-vapor homogenization temperatures (Krüger et al., 2011; Meckler et al., 2015), previous studies have not evaluated the FIs control on the distribution of microscopic and sub-microscopic water in stalagmites nor the effect of FIs on trace element concentrations. Most previous studies in stalagmites assume trace elements are hosted in the solid calcite. Yet, elements with the lowest partition coefficients in calcite, such as Na, could be affected by trapped fluid phases in the calcite since the largest portion of the element remains in the liquid phase. Intersection of a FI by laser ablation sampling or micromilling could contribute significantly to the total measured concentration of such an element. Sliwinski and Stoll (2021) and Borsato et al. (2007) hypothesized invisible submicroscopic FIs might affect trace element distributions in calcite but did not assess this mechanism.
Calcite growth mechanisms have been studied in real time using Atomic Force Microscopy (e.g., Renard et al., 2013), but similar work has not been undertaken for cave-analogue precipitation conditions. Precipitation mechanisms involving metastable intermediates has been observed in few cave systems (Demény et al., 2016), but sample collection and storage practices could accelerate transformation to more stable phases, leaving precursor phases undetected. Observation of final speleothem fabrics remains one of the primary approaches to evaluate the relationships between crystallite size, orientation, and porosity resulting from crystal growth, and the trace element and organic concentrations (Chiarini et al., 2017).
In this study, we employ a novel application of the Fourier Transformation Infrared (FTIR) microscopy technique to map at high resolution the distribution of molecular water and OH as well as certain groups of aliphatic organic molecules in stalagmites. We combine these new maps with detailed petrographic characterization of calcite fabrics in thin section and confocal microscopy (fluorescence), as well as laser ablation maps of the distribution of Sr, Mg, U, Y, Zn, and Na in the studied area. The selection of measured elements is on one hand given by the laser ablation technique and depicts a set of elements of scientific interest in recent years. We focus on a set of actively growing stalagmites from NW Spain for which modern dripwater chemistry is known from a 16 months monitoring study (Kost et al., 2023; Sliwinski et al., 2023); additionally, we examine one fossil stalagmite from the same cave. Several of these samples have been investigated in other studies using LA-ICP-MS to understand the interplay of Sr and Y in stalagmites (Sliwinski et al., 2023).
We use this set of core observations to constrain current hypotheses about the relationships between crystal defects and FIs, organic carbon incorporation, and trace element incorporation in stalagmites. The combination of FTIR maps of water distribution with LA-ICP-MS maps of Na concentrations allows us to test the hypothesis that FIs affect the measured Na concentrations in stalagmites. We therefore assess whether organics and colloidally delivered elements follow similar spatial distribution patterns in the stalagmites. Additionally, we evaluate if there are relationships between the FI abundance and individual crystallites and whether FIs are more prevalent in organic rich or organic-poor areas of the speleothems. Finally, we evaluate the relationship between non-colloidally transported trace elements, and the distribution of organics, defects, and FIs, addressing monovalent Na as well as divalent Sr and Mg.
2 Methods
2.1 Samples
In total 3 actively growing stalagmite chips (MR, PG and SS) were sampled by chipping and sawing off a small part at the top of the growth surface. PG (PG2) and SS (SS1 and SS2) refer to monitored sites “Playground” and “Skyscraper” in Kost et al. (2023). MR (MR1) refers to sample MUS (“Mushroom”) in Sliwinski et al. (2023). Active growth was confirmed by detection of the 14C bomb spike which also constrains average growth rates over the last several decades (Sliwinski et al., 2023). In addition, we examine the sample GLA, a fossil stalagmite with a hiatus and clear optical difference below and above the hiatus (“milky” and “glassy” calcite respectively) (Figure 1). XRD confirms that all samples are exclusively calcite.
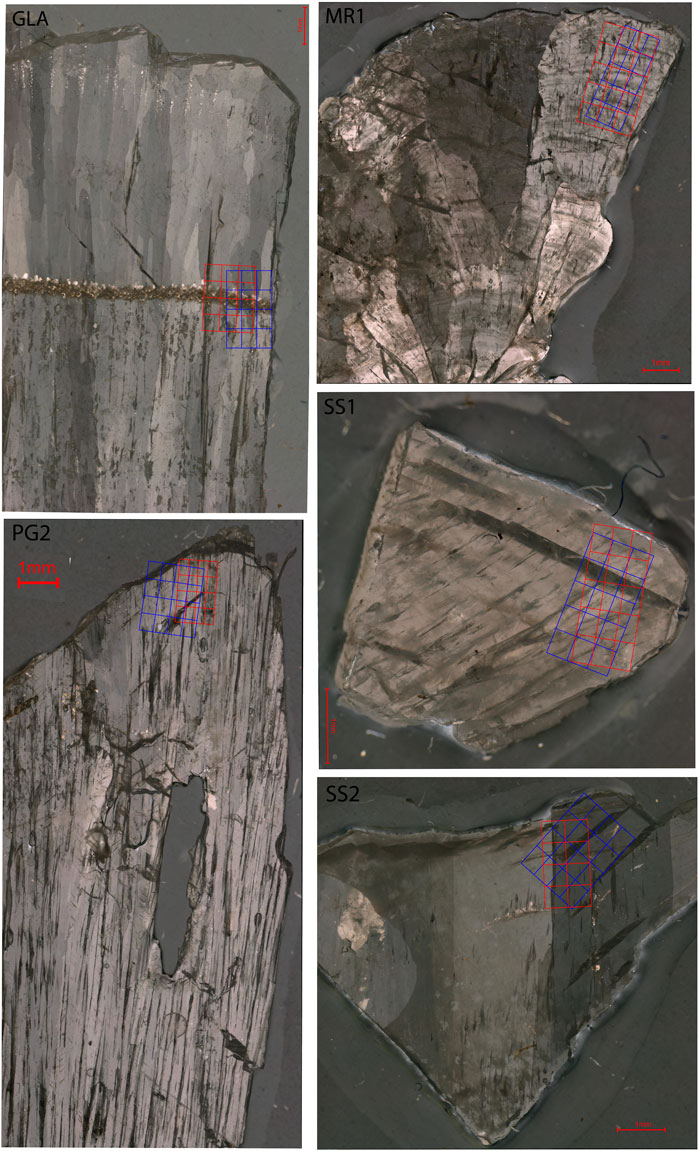
FIGURE 1. Full cross polarized transmitted light images of all samples with investigated areas (blue and red grids). The red bar marks 1 mm length scale.
The samples cover a range of different growth rates from 3 μm/yr (GLA) to 150 μm/yr (MR) (Table 1). The active samples span a range of drip rates and modeled growth seasonality, from only a single growth season (PG), to growth during both summer and winter but growth cessation during fall and spring (SS) (Kost et al., 2023). While the MR dripwater was not monitored for a full year and we cannot definitively infer its growth season, the cave ventilation in that sector is more similar to SS and it thus potentially records multiple growth seasons yearly. MR derives from the lower gallery with an active cave stream which periodically floods adjacent terraces. Additionally, active samples span a range of dripwater chemistries, from high Mg/Ca and U/Ca (PG) to lower Mg/Ca and Sr/Ca (SS) (Kost et al., 2023). Since GLA is a fossil stalagmite, dripwater chemistry and growth seasonality are not independently constrained, but its location in the cave was nearest SS.
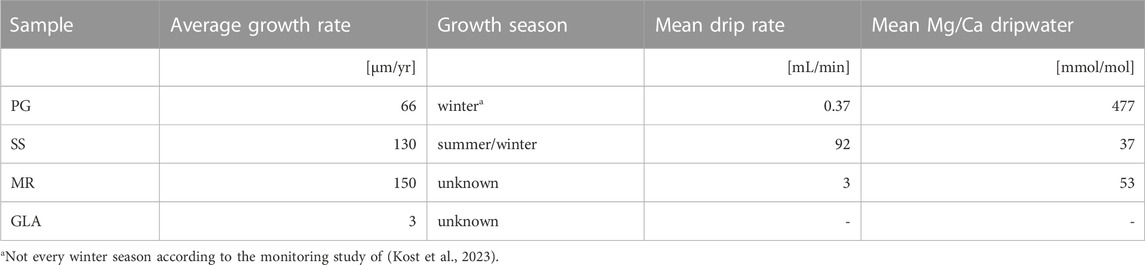
TABLE 1. Sample information based on monitoring data by Sliwinski et al. (2023) and (Kost et al., 2023).
The samples were cut in quarter sections and prepared as a double side polished 500 µm thick sections for the following set of analyses. To assess the addressed research questions a set of methods are applied to get the necessary information about the FI distribution and other crystal features affecting trace element distribution.
2.2 Digital microscope imaging
Transmitted light (TL) images were taken with the Keyence VHX-6000 digital microscope at ETH Zurich to reveal layering, calcite fabric including FIs (Frisia, 2015; Chiarini et al., 2017) and detrital particles. Water filled FIs appear clear and bright under the microscope, whereas empty FIs appear black due to refractive effects. The presented microscope images are scans through the whole thick section providing a focused image of all depth levels (sequential focal plane). Hence, visible features such as FIs can be deep in the sample or at the surface. This is necessary for comparison with the fluid content maps (FTIR-images) which detect absorbance through the whole section. Images taken with the analyzer using a cross polarizer show individual crystallites with different extinction angles, illustrating crystal boundaries or crystal zoning (Figure 1).
2.3 Confocal Laser Scanning Microscopy (CLSM)
Fluorescence maps were generated with CLSM at the Scientific Center for Optical and Electron Microscopy (ScopeM) at ETH Zurich using an Olympus Fluoview 3,000. A 488 nm laser was used for excitation of the sample by detecting the fluorescence in a window of 490–555 nm. To produce a map automatic stitching of two averaged 1024 × 1024 pixels frames at 100x magnification was automatically performed by the microscope control software (CellSens). This technique is explained in more detail in Sliwinski and Stoll (2021). Fluorescence is generally attributed to the presence of fluorescent organic compounds. However, CLSM maps may also be disrupted by refractive effects in a few regions where the surface is open due to defects or voids. The CLSM images further help to distinguish between crystal defects within the 500 µm section (spotted in TL images but not visible by CLSM) and defects situated at the very surface where the laser maps are ablated. Refractive effects in the focal plane (sample surface) result in higher fluorescence, but in a characteristic fashion that makes them easy to distinguish from true fluorescence. Crystal defects seen in the TL image but not visible in the CSLM image are not situated at the top of the sample, hence should not affect LA-maps.
The fluorescence from the applied CLSM method is commonly interpreted as a first order indication of the concentration of OM in a region of the stalagmite (Sliwinski and Stoll, 2021), although the single wavelength excitation (488 nm) and a narrow detection window of 490–555 nm are sensitive to only a narrow range of compounds and therefore may not capture all OM in stalagmites (Sliwinski and Stoll, 2021; Endres et al., 2023).
2.4 Fourier Transformation Infrared Focal-Plane Array (FTIR-FPA) imaging
Transmission FPA-FTIR spectroscopy maps were acquired at University of Bern using a Bruker Tensor II spectrometer with a globar infrared source, equipped with a Bruker Hyperion 3,000 microscope. The closed Plexiglas chamber was purged with dried air during measurements to limit the interference of environmental CO2 and H2O on measurements. Data was collected with a focal plane array (FPA) detector, composed of 64 × 64 liquid nitrogen cooled mercury cadmium telluride (MCT) detector elements on a square array in a wavenumber range of 900–4,000 cm−1 with a resolution of 8 cm−1 and an average over 64 scans. To improve the signal-to-noise-ratio, a binning of 4 was used, resulting in 16 × 16 pixel with a pixel size of 10.8 × 10.8 µm. To minimize organic contamination the samples have been rinsed with isopropanol and mounted on the sample stage in a dry condition.
FTIR records the energy specific absorption of vibrating, bending, and stretching atomic bonds caused by radiation passing through the sample. The absorbance of molecular H2O and OH creates a characteristic broadband peak located at wavenumber 3400 cm−1 (Stünitz et al., 2017). Additional absorbance at wavenumber of ∼2,900 cm−1 is due to aliphatic C-H stretching in organic components with-CH2 and-CH3 groups. In lower wavenumbers, organic components at 1,540 to 1,640 cm−1 due to aromatic C=C double bonds and H bonded to C=O, and 1,370 to 1,430 cm−1 due to COO- symmetric stretching, may overlap with the asymmetric stretch vibration of the CO3 group in the 1,400–1,500 cm−1 range (Lebron and Suarez, 1996). The most commonly described organic components in stalagmites, such as lignin and its backbone, aromatics, and humic acids are all attributed to absorbances at wave numbers in the 1,650 to 1,265 cm−1 range (Artz et al., 2008).
Here we present linear absorbance intensity maps from the 3,400 cm−1 band, a 2,983 cm−1 band from organics, and the linear absorbance ratio of the 3,400 cm−1 to the 2,983 cm−1 bands (Figure 2). The latter ratio is evaluated to show the ratio of absorption of organic bonds vs. H2O or OH bonds. For the data processing of the FTIR-FPA maps, the atmospheric correction and concave rubber band correction with 64 points and four iterations was performed in OPUS® version 8.5. A deconvolution of each spectrum was performed in the software package SpecXY (Gies et al., in preparation) to obtain the intensity of the water peak at 3,400 cm−1 and reduce the impact of signal noise and possible overlapping peaks present in the spectra (Figure 2). FTIR features a linear relationship between measured linear absorbance and water/trace element content. However, the linear absorption coefficient needed for the conversion of absorbance to water content is not well defined for calcite. Thus, we conservatively report linear absorbance values for the 2,983 cm−1 and 3,400 cm−1 bands, and for the 3,400 cm−1 band, relative distribution maps are calculated by normalizing the linear absorbance to the maximum linear absorbance of each sample. Additionally, we explore a quantitative conversion of the deconvoluted 3,400 cm−1 broadband peak, employing the wavenumber specific calibration of (Paterson, 1982) to calculate quantified water maps in µg/g (ppm H2O) similar to the approach of (Stünitz et al., 2017), using ϵi factor of 1/3 as the orientation factor for uniaxial crystals (Paterson, 1982).
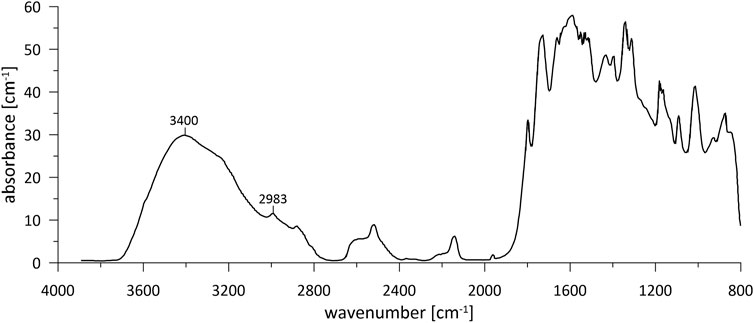
FIGURE 2. Representative FTIR spectrum (800–4,000 cm−1) from sample SS2 indicating the 3,400 cm−1 bands (water) and 2,983 cm−1 bands (organics) which are processed in this study.
2.5 Laser Ablation Inductively Coupled Plasma Mass Spectrometry (LA-ICP-MS) mapping
The thick sections were glued on conventional microscope glass plates and mounted in the Laurin Technic S155 2-volume laser ablation system at ETH Zurich. A 193 nm ASI Resolution ArF excimer laser ablates in a 370 mL/min high purity He and 5.0 mL/min N2 atmosphere. Ar (1.0 L/min) carries the sample mixture to the Agilent 8,800 Triple Quadrupole ICP-MS where it is ionized and analyzed in single quadrupole mode without reaction cell or subsequent mass filter. To obtain chemical maps, parallel lines were ablated using a 20 × 20 µm square spot with a scan speed of 20 μm s−1 at an ablation rate of 10 Hz and ablation energy of 4 J cm−2. The sampling depth is less than 10 µm (Sliwinski and Stoll, 2021). For each laser track a precleaning ablation was performed to reduce contamination. NIST- 612 was used for standardization which was performed on the Iolite 4.0 software (Paton et al., 2011). Since NIST-612 is a synthetic glass, additional reference materials (pressed carbonate powders by µ-standards: BAM RS-2-NP; ECRM-752-1*-NP; JCt-1*-NP) are used in a quality check analysis (a typical example is shown in Supplementary Figure S1). Due to the matrix mismatch of the NIST-612 standard and the sample (glass vs. calcite respectively) and different concentration ranges for some elements (e.g., Na is orders of magnitude higher in NIST-612 compared to our samples) the absolute concentrations may be biased by up to 20% as examined by the quality check analysis (Supplementary Figure S1). Nevertheless, qualitative interpretation of differences within and between samples is reasonable since offsets (if any) would be constant. We report element concentrations and additionally calculate trace element to Ca ratios normalizing to 40% Ca in the measured solid. We do not show data for any point in which Ca counts per second (CPS) were <8,00,000 to avoid mapping open voids, pores and fractures. For subsequent evaluation of trace elements controlled by processes other than the presence of detrital clays, we apply a filter with a cutoff of >6 ppm Al (Supplementary Figure S1).
2.6 Spatial referencing and map visualization
The presented maps were aligned manually by visual fitting using Adobe Illustrator 2023. Prominent features visible in all produced images (cracks, edges, pores, layers, etc.) were used to reference the different images.
The IR absorbance is integrated over the whole 500 µm thick section, and therefore it does not give any information about the depth where the water is situated. While this is consistent with the detection of FIs by transmitted light microscopy (where sequential focal planes are added together), it may be at odds with CLSM and LA-ICP-MS data, which are both sampled from the uppermost ∼10 μm of the surface. One challenge is that FTIR-maps and TL images visualize FIs throughout the whole 500 µm section, however, LA-maps record <10 μm at the surface where potential FIs could be ruptured and lose fluid during sample preparation and therefore the true FI influence may be underestimated by LA scans. Within this 10 µm depth of the ablation, larger pores of dimension 10 µm or larger are more likely to intersect the surface and be exposed during polishing and potentially opened, whereas some fraction of smaller <2 µm pores are more likely to remain intact and closed within that ablation depth range. Thus, the discrepancy between LA scans and FIs estimates would be most significant for the larger FIs of similar dimension as the depth ablation crater.
3 Results
3.1 Calcite fabrics and fluorescence
3.1.1 Calcite fabrics
The rapidly growing active stalagmites (SS, MR and PG) are all comprised of porous columnar microcrystalline (Pcm; according to Chiarini et al., 2017) calcite fabric and appear generally milky with a detailed region of study which is encompassed within a single crystallite (or two crystallites in case of SS2) (Figure 1). Crystallites are 2–6 mm large and elongated in growth direction. In contrast, the order of magnitude slower growing fossil stalagmite (GLA) is composed of columnar and columnar open (C & Co) fabrics with very clear compact columnar calcite, in which the area of interest spans several crystallites of varying extinction angle and crystallites are smaller than in the rapidly growing active stalagmites (0.5–2 mm). A new set of crystallites is established in GLA above the prominent detrital layer of the hiatus. A more detailed petrographic description of all samples is given in the Supplementary Text S1.1). .
3.1.2 Organic distribution in fluorescence and FTIR at 2,983 cm−1
In samples with a strong CLSM fluorescence signal, the intensity of FTIR absorbance at 2,983 cm−1, attributed to aliphatic C-H stretching in organic components, exhibits a generally similar spatial distribution as fluorescence (Figures 3–7). In SS2, areas of higher CLSM fluorescence are also higher in 2,983 cm−1 absorbance (Figure 4). In SS1, narrow low fluorescence bands perpendicular to growth layers are also low in 2,983 cm−1 absorbance (Figure 5). Bundles of growth layers of higher fluorescence are also high in 2,983 cm−1 absorbance, although the artifact from refraction on a defect or internal porosity in the FTIR image complicates the visualization of this contrast somewhat. The high fluorescence in the hiatus of GLA is also peak area of 2,983 cm−1 absorbance (Figure 3). Likewise, the PG2 sample which has very limited fluorescence has a 2,983 cm−1 absorbance map dominated by grid processing issues which could be consistent with very low absolute 2,983 cm−1 absorbance (Figure 7). In MR1, fluorescence resolved little structure in the stalagmites, because it is dominated by imperfections in the surface topography or near-surface defects causing reflection artifacts (Figure 6). In contrast, the 2,983 cm−1 absorbance map reveals not only high concentrations in the infill of a fracture (epoxy?), but also shows variation in 2,983 cm−1 intensity among different growth layers not resolved by CLSM fluorescence. CLSM also resolves internal ruptures. In SS2, two parallel fractures crosscutting layers at intermediate angle are visible in CLSM fluorescence due to reflection (Figure 4). Along the vertical crystallite boundary in SS2, CLSM reflection is also noted (Figure 4).
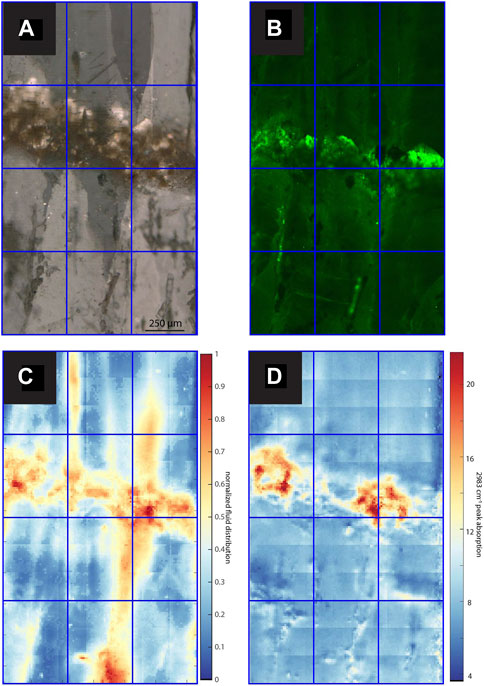
FIGURE 3. Images and maps of GLA. (A) TL image with sequential focal plane and crossed polars (B) CLSM image, (C) normalized intensity map of the linear absorbance of the 3,400 cm−1 band, (D) linear absorbance of the 2,983 cm−1 band.
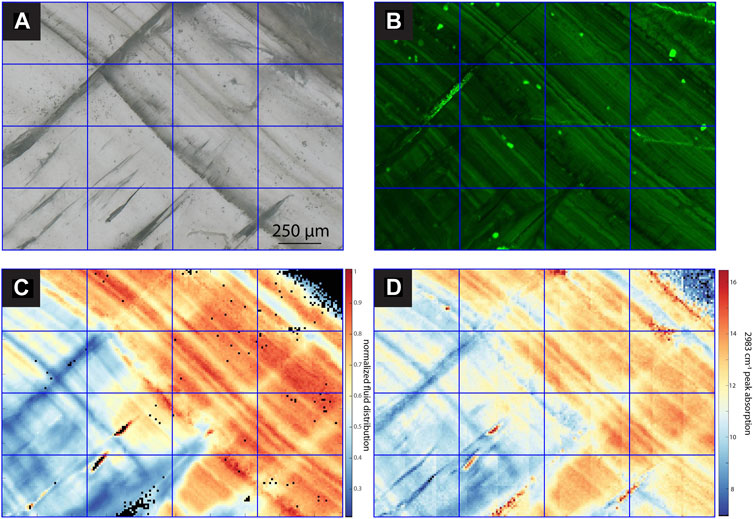
FIGURE 4. Images and maps of SS2. (A) TL image with sequential focal plane (B) CLSM image, (C) normalized intensity map of the linear absorbance of the 3,400 cm−1 band, (D) linear absorbance of the 2,983 cm−1 band.
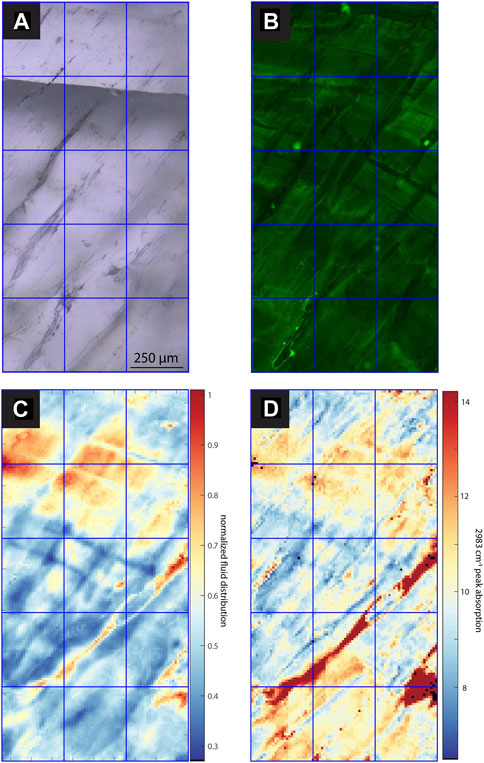
FIGURE 5. Images and maps of SS1. (A) TL image with sequential focal plane (B) CLSM image, (C) normalized intensity map of the linear absorbance of the 3,400 cm−1 band, (D) linear absorbance of the 2,983 cm−1 band.
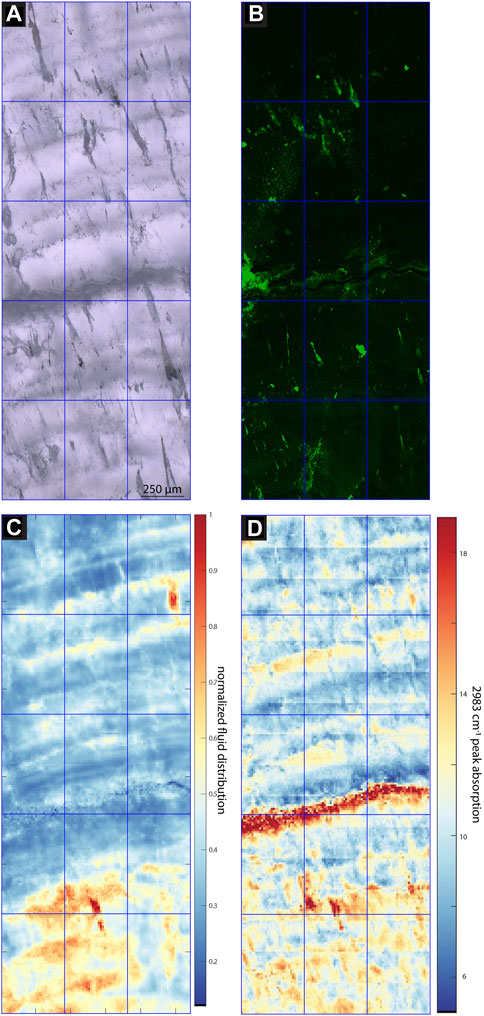
FIGURE 6. Images and maps of MR1. (A) TL image with sequential focal plane (B) CLSM image, (C) normalized intensity map of the linear absorbance of the 3,400 cm−1 band, (D) linear absorbance of the 2,983 cm−1 band.
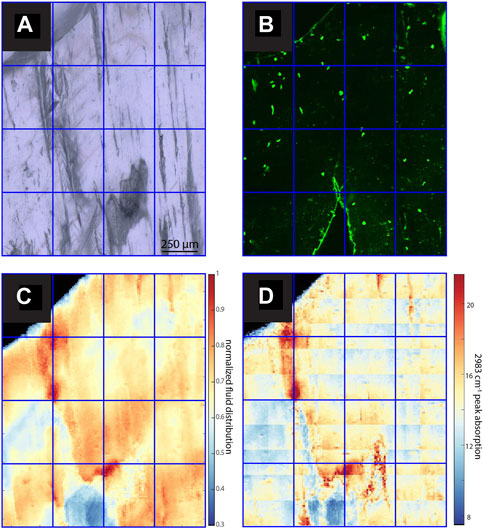
FIGURE 7. Images and maps of PG2. (A) TL image with sequential focal plane (B) CLSM image, (C) normalized intensity map of the linear absorbance of the 3,400 cm−1 band, (D) linear absorbance of the 2,983 cm−1 band.
Among the active chips, one (SS1, SS2) exhibits clear fluorescent laminations (Figures 4, 5), whereas the other fossil and active stalagmites exhibit none. Both prepared samples, SS1 and SS2, show regular fluorescent layering (<50 µm). Comparison with the estimated growth rate over the last 60 years (14C bomb peak) implies subannual layering since layer spacing is mostly smaller than the estimated annual growth rate (ca. 130 μm yr−1), although annual scale layering cannot be excluded if average growth rate were slower in the sampled intervals. Several bundles of fluorescent layers comprise super-annual banding, which is mirrored by bands of FIs.
3.2 Distribution of visible fluid inclusions and FTIR OH vibrational mode
Operationally, in this study FIs of <20 µm are considered; no efforts have been made to distinguish FIs from a genetic point of view (primary, secondary or pseudosecondary). This threshold is introduced as an operational limit since sample preparation opens larger pores. Both techniques employed here detect FIs (TL images) or H2O (FTIR) throughout the whole 500 µm section (sequential focal planes). With the resolution of our TL images, we identify readily the FIs greater than about 1 µm in diameter. We differentiate between FIs and macroscopic features appearing within the calcite which we call “elongated voids”. Those are mostly not water filled but contain detrital particles and likely represent macroscopic defects in the calcite lattice and/or open FIs.
All samples contain regions with microscopic FIs visible in TL microscopy (Figures 3–7). Active samples SS1 (Figure 5), SS2 (Figure 4) and MR1 (Figure 6) show bands of higher FI density along some growth layers. Elongated FI can be as large as 20 µm in length (e.g., SS1). In all samples, the majority of visible FIs are <8 µm. In these FI-rich layers, the density of FIs is relatively high (impossible to count). Compared to the other active samples, PG2 reveals fewer and more homogeneously distributed FIs (Figure 7). Elongated voids (distinctly different than FIs and often filled with detrital particles) in PG2 are disturbing the clear appearance of calcite. GLA features clusters of inclusions between the crystallites (Figure 3).
The FTIR mapping technique identifies water in both visible microscopic as well as submicroscopic FIs (<<1 µm). Regions of high intensity of the 3,400 cm−1 band (O-H bonding) also feature a high linear absorbance ratio of the 3,400 to 2,983 cm−1 bands (Figure 8) as expected if spatial variations in water, rather than spatial variations in organic phases, dominated the spatial distribution of the 3,400 cm−1 band. Therefore, we compare the normalized intensity maps of the 3,400 cm−1 band with the distribution of FIs and here describe both as spatial variations in water content. The normalized intensity of the 3,400 cm−1 band varies significantly, up to 5-fold, in different areas of a given sample (Figure 8).
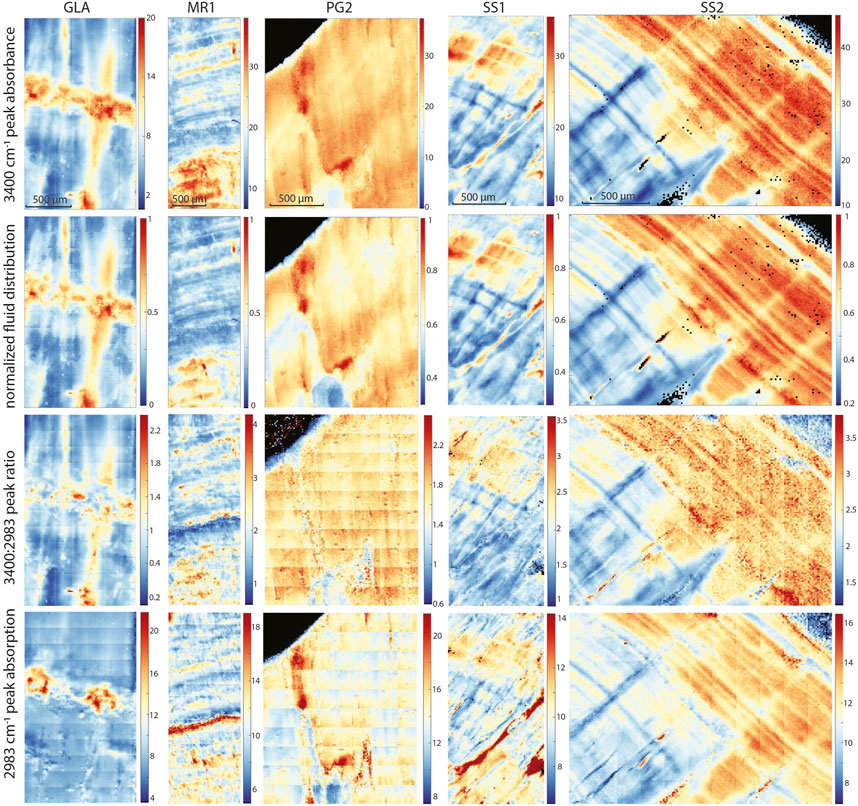
FIGURE 8. For all samples, FTIR map comparison showing linear absorbance at 3,400 cm−1, normalized linear absorbance of the 3,400 cm−1 band, ratio of linear absorbances of the 3,400 cm−1 and 2,983 cm−1 bands, and linear absorbance at 2,983 cm−1.
In case of PG2 the more homogenous intensity of the 3,400 cm−1 band confirms the observations made in TL images with a generally low FI density homogeneously distributed without clusters or bands of FIs as observed in the other samples (Figure 6). In MR1 and SS2, visible bands of high FI density coincide with bands of higher IR absorbance of the 3,400 cm−1 band (normalized FI distribution in Figures 4, 6). However, even within these samples, the bands with highest FI density do not necessarily indicate highest IR absorbance of the 3,400 cm−1 band (MR1 or SS2). The amplitude of variations in water content is high, with some areas featuring 10 times less water than the maximum in MR1 (Figure 6). Also, the size of the FIs does not seem to affect total IR absorbance of the 3,400 cm−1 band. For example, the elongated FIs along a growth-layer parallel textural discontinuity in SS2 do not yield the highest IR absorbance of the 3,400 cm−1 band in this sample; rather highest IR absorbance of the 3,400 cm−1 band coincides with other zones with finer FIs (Figure 4). It is possible that large FIs lost part of their water either during sample preparation (cutting and polishing) or enclose air trapped during closure of the pore.
A slightly different presentation is seen in SS1 (and SS2), which shows patches of high IR absorbance of the 3,400 cm−1 band not obviously correlated with higher visible FI density, as well as FI trails along growth layers with rather low 3,400 cm−1 band absorbance (Figures 5, 6). SS1 features smaller variations with a relative water content ranging only between 30% and 100% of the maximum water density. The appearance of the FTIR image looks like a honeycomb pattern. The visible FI bands in SS1 are not controlling the IR absorbance of the 3,400 cm−1 band but rather clear compact calcite with low visible FI density reveals high IR absorbance suggesting water in compact calcite (Figure 5). Consequently, the normalized intensity map of the of the 3,400 cm−1 band suggests water where it is not expected from the visual FI distribution.
From both normalized intensity maps of the 3,400 cm−1 band and TL, high water concentrations are observed in GLA along the hiatus, 10 times higher than the minimum (Figure 3). The elevated IR absorbance fingers above the hiatus coincide with higher visible FI density and often follow crystallite boundaries (Figure 3). The quantification of water content (Supplementary Figure S4, Supplementary Text S1.2) suggests water contents in the range of 0.05%–0.25% in most samples.
3.3 Distribution of detrital clays and associated elemental enrichment in hiatus, pores and fractures
All our samples show the presence of detrital particles in TL microscopy, and these correspond with regions of very high Al content in LA-ICP-MS maps (Supplementary Figure S1). Al shows a bimodal distribution, with high Al zones reaching 10–20 ppm at maximum and concentrations in the visibly cleaner calcite closer to 1 ppm.
Detrital minerals are concentrated in the hiatus, along fractures, and in pores. The most prominent detrital contributions are recorded in GLA which represents a hiatus spanning thousands of years (Supplementary Figure S1). In GLA, detrital layers occur only along this hiatus horizon and just below it in infilled voids. In SS2 there are distinct layers of detrital enrichment marked by high Al content and detrital particles in TL; one such layer coincides with a change in calcite fabric and appears to represent a discontinuity in growth conditions (Supplementary Figure S1). MR1 features a layer of enriched Al along the fracture, and also in some layers in the lower portion of the sample which coincide with FI-rich bands. Detrital enrichment in fractures is also seen in PG2 (in growth direction and opening into pore, Supplementary Figure S1) and SS2 (fissure fracture within crystallite seen Supplementary Figure S1). In contrast, the fracture along the crystal boundary detected in SS2 or the fracture in SS1 (Supplementary Figure S1) is not very prominent in Al (no detrital contamination, hence fracture likely originates from sample preparation). Furthermore, detrital particles and Al enrichment are noted in inter- and intra-crystalline pores.
3.4 Average element concentrations in detrital-free calcite
3.4.1 Average composition and trace element partitioning
The average composition of the stalagmites differs significantly in some elements (Figure 8). Mg concentration is nearly 10-fold higher in GLA (median concentration: 3,500 ppm) and PG2 (3,600 ppm) than in SS1 (250 ppm), SS2 (300 ppm) and MR1 (320 ppm). U concentration in PG2 (2.2 ppm) is nearly 10-fold higher than in other stalagmites. Y concentration in SS1 (16 ppm) and SS2 (25 ppm) is 10-fold higher than PG2 (1.8 ppm) and 100-fold higher than GLA (0.1 ppm) and MR1 (<0.1 ppm). Average Sr concentrations are similar among most stalagmites (30–35 ppm) but about 2-fold higher in PG2 (78 ppm). Mean Na concentrations are similarly high in SS1 (55 ppm), SS2 (52 ppm), and PG2 (68 ppm), but 2-fold lower in MR1 (28 ppm), and 5-fold lower in GLA (10 ppm).
For actively growing stalagmites with monitored dripwater chemistry, average partition coefficients were calculated for the mean stalagmite concentration (Figure 9). This calculation assumes that the range in dripwater chemistries over the 16-month monitoring period at each site is representative of dripwater chemistry at that site over the several decades period of growth integrated in the average LA-ICP-MS map. If this latter assumption is not sustained, then we could overestimate the partition coefficients in proportion to the degree of Ca depletion. Based on these assumptions, the range in Sr (0.07–0.12) and Mg (0.022–0.04) partition coefficients is within the ranges reported in previous publications (Tremaine and Froelich, 2013 and references in their Table 4). Sr partitioning is slightly higher in the high Mg PG2 compared to other samples. U partitioning varies over a greater range than previous reports (Day and Henderson, 2013), with our estimates including samples both higher (SS2) and lower (MR1) than published range. Inferred Na partitioning is similar to previous estimates in PG2 and MR1. However, for SS1 and SS2 (same stalagmite sample), the calculated effective stalagmite partition coefficients are more than twice as high as the highest endmember DNa (1.3*10–3) derived by Füger et al. (2019) and several orders of magnitude higher than the DNa derived by Devriendt et al. (2021).
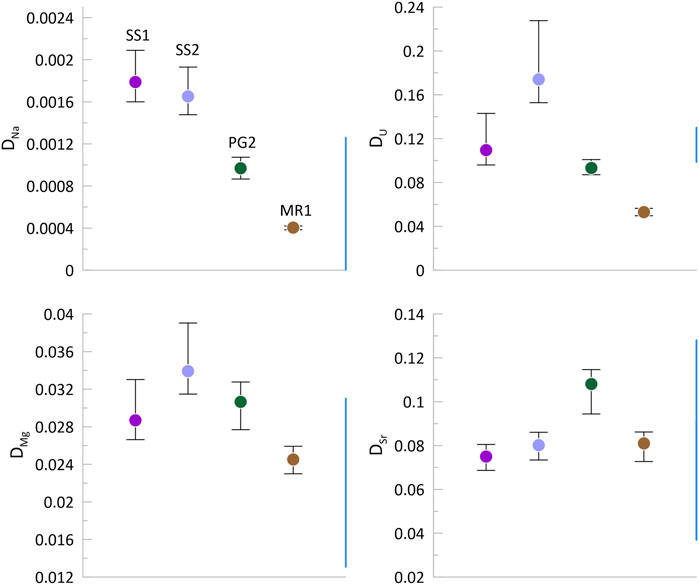
FIGURE 9. Partition coefficients of elements based on the median concentration illustrated in Figure 8, and the mean and range of dripwater chemistry for that location, from Sliwinski et al. (2023).
3.4.2 Spatial distribution of Sr, Mg, Na, Y, U, and Zn
Spatial variations are pronounced for most elements (Figures 10–14). Y-enriched bands are evident among growth layers on 60–150 µm length scale for SS2, PG2, and SS1 (Figures 11, 12, 14). Comparison with the estimated growth rate implies this could be annual scale layering, especially in SS1 if its growth rate in the imaged section were faster than average (Table 1).
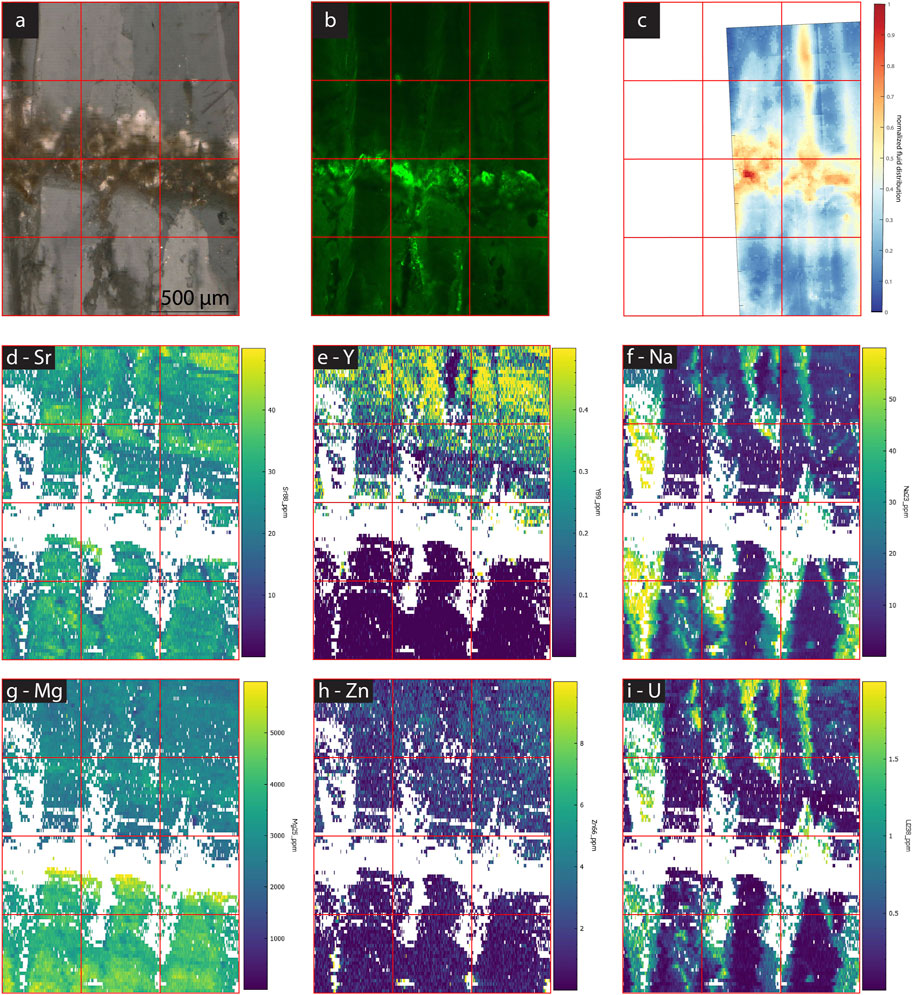
FIGURE 10. Images and maps of GLA. (A) cross polarized TL image, (B) CLSM image, (C) normalized linear absorbance of the 3,400 cm−1 band indicating water distribution, (D–I) LA-ICP-MS element maps of different elements (concentrations in ppm) as labeled in each image.
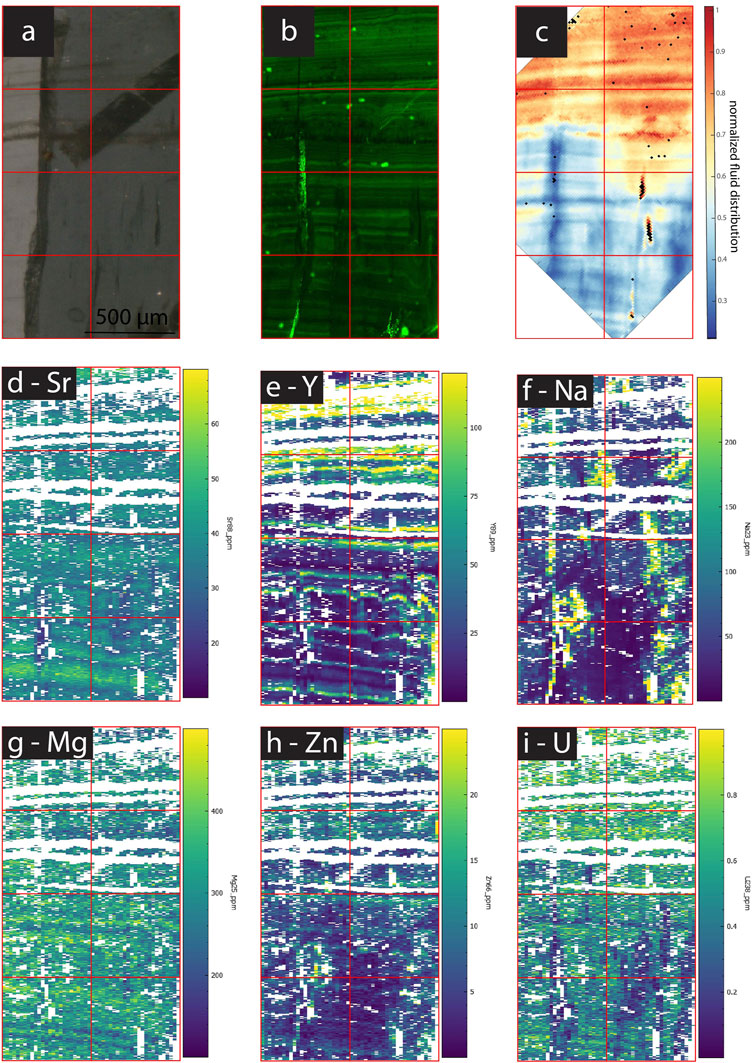
FIGURE 11. Images and maps of SS2. (A) cross polarized TL image, (B) CLSM image, (C) normalized linear absorbance of the 3,400 cm−1 band indicating water distribution, (D–I) LA-ICP-MS element maps of different elements (concentrations in ppm) as labeled in each image.
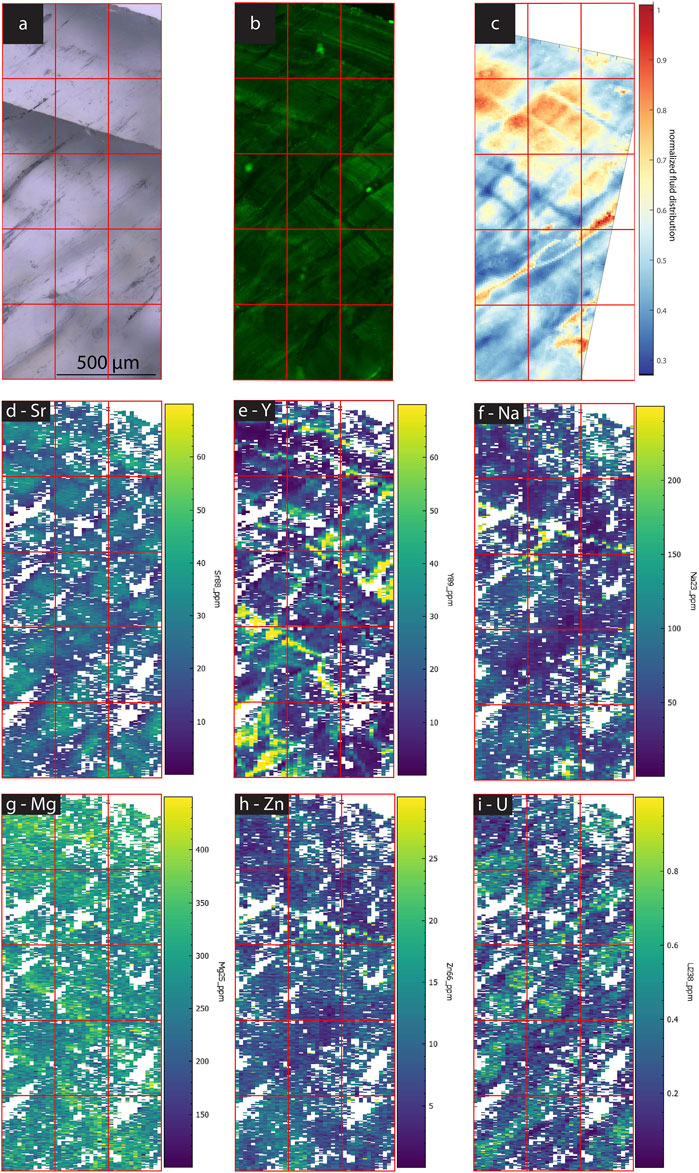
FIGURE 12. Images and maps of SS1. (A) TL image, (B) CLSM image, (C) normalized linear absorbance of the 3,400 cm−1 band indicating water distribution, (D–I) LA-ICP-MS element maps of different elements (concentrations in ppm) as labeled in each image.
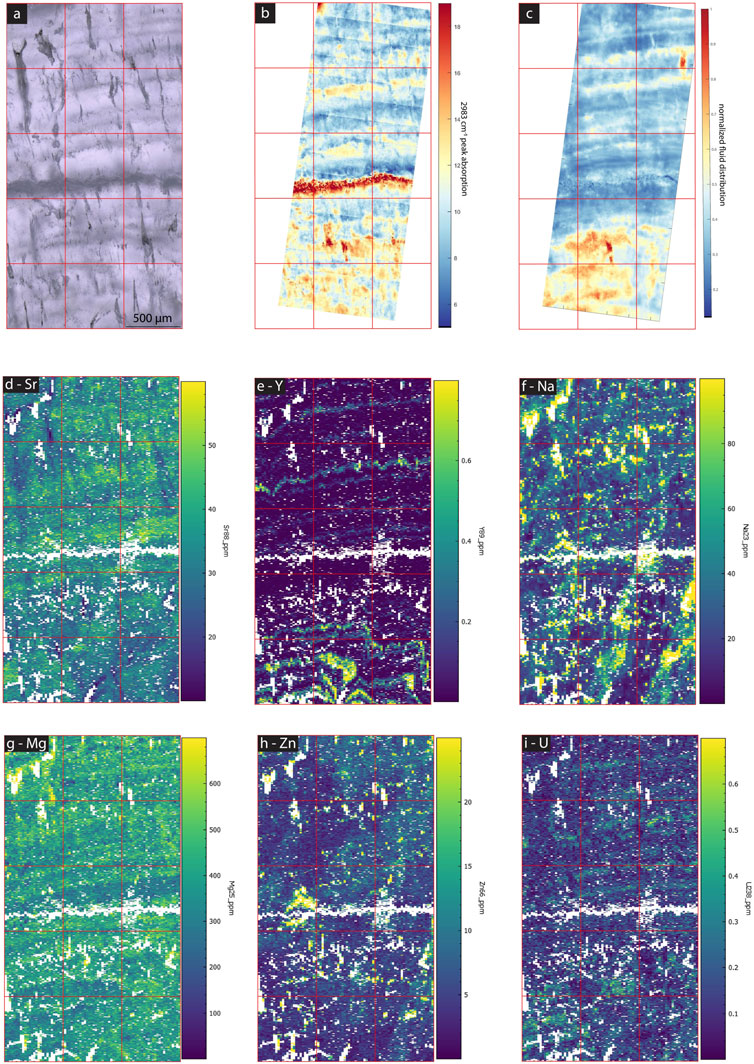
FIGURE 13. Images and maps of MR1. (A) cross polarized TL image, (B) normalized linear absorbance of the 2,983 cm−1 band, (C) normalized linear absorbance of the 3,400 cm−1 band indicating water distribution, (D–I) LA-ICP-MS element maps of different elements (concentrations in ppm) as labeled in each image.
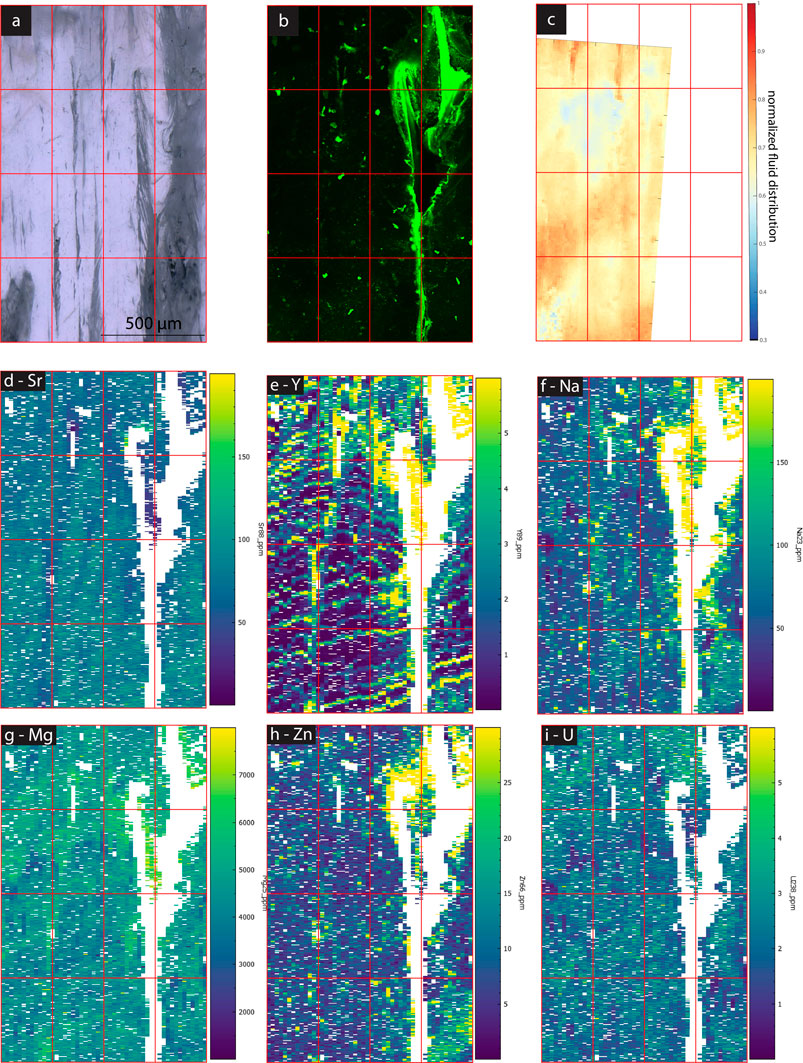
FIGURE 14. Images and maps of PG2. (A) cross polarized TL image, (B) CLSM image, (C) normalized linear absorbance of the 3,400 cm−1 band indicating water distribution, (D–I) LA-ICP-MS element maps of different elements (concentrations in ppm) as labeled in each image.
At longer timescale, variations in other elements occur among growth layers in some of the actively growing samples as well as GLA. For example, SS1 (Figure 12) and SS2 (Figure 11) show distinct variations between growth layers in Mg, Sr, Y and weaker signal variations in U and Zn. Growth layers do not show a consistent relationship of elemental covariation, for example, in the upper part of SS2, Y has strong variation but Sr is more stable. Yet, in the lower half of this sample Y show up to 5-fold changes and clear inverse correlation with Sr (less than 2-fold range). PG2 (Figure 14) has no significant variation among growth layers, with the exception of Y. MR1 (Figure 13) features some high frequency Y variations, which do not appear to be annual, and weak variation in Sr and U. Water and elongated void-rich growth layers are not correlated with unusually high or low concentrations of Mg, Sr, or U in MR1, PG1, SS1 or SS2 (Figures 11–14).
In all samples except PG2, there is elemental variation perpendicular to growth layers. In SS1 (Figure 12) and SS2 (Figure 11), these are narrow zones crosscutting annual growth layers, which are lower in Sr, U, and Y, and lower in fluorescence. The narrow zones are also lower in water content in SS1. Many of these features are visible in TL images as dark zones, which in the visual image appear to be voids. In contrast, the broad portions of the growth layer between these crosscutting features reveals clearer calcite, elevated Sr and brighter fluorescence. In GLA (Figure 10), above the hiatus the crosscutting features coincide with the boundaries among crystallites, and affect U and Na strongly (enrichment), but also affect Sr and Y (depletion).
4 Discussion
4.1 Evaluation of methods for mapping the spatial distribution of water and organics in stalagmites
While FTIR has been employed previously on aggregate stalagmite samples or decarbonated stalagmite powder (Gázquez et al., 2012; Martínez-Pillado et al., 2020), the present study illustrates the novel application of FTIR microscopy to map the spatial distribution of water (3,400 cm−1 band) and organic molecules (2,983 cm−1 band) in a speleothem section.
For the detection of organics, one advantage of FTIR spectroscopy is that it is less sensitive to the topography of the polished stalagmite surface and near-surface reflection effects compared to CLSM, as observed in our sample MR1 (Figure 6). Although not exploited here, the technique could have the potential to distinguish an array of organic components through full deconvolution of the organic peaks in the in the 1,650 to 1,265 cm−1 wavenumber range, as completed for analysis of peat samples (Artz et al., 2008). This contrasts with standard CLSM which typically uses a narrow excitation/emission pair.
In this study, CLSM was limited to detecting organic components excited at 488 nm and fluorescing in the window of 490–555 nm, a small fraction of the total fluorescent organic constituents delivered to speleothems in this cave(Endres et al., 2023), and potentially emphasizing components such as lignin (Sliwinski and Stoll, 2021). From FTIR, we focused on the 2,983 cm−1 band of the asymmetric CH2 component which is expected in fats, waxes, and lipids. Our initial, qualitative comparison of CLSM and the FTIR 2983 cm−1 band suggests that they are generally elevated in the same regions of the speleothems, although they likely target differing classes of organic material. One explanation is that various classes of organic components are co-located in the same zones of the stalagmite, i.e., bands high in lignin are also high in lipids and waxes. Future studies in precisely co-referenced maps could quantitatively compare the intensity variations of the 2,983 cm−1 band and other FTIR organic bands in the 1,650 to 1,265 cm−1 wavenumber range with the CLSM fluorescence maps.
For the detection of water, one advantage of FTIR spectroscopy is that it has the potential to detect submicroscopic FIs smaller than those resolved by standard transmitted TL microscopy. Indeed, we find that through the 3,400 cm−1 band, it is possible to detect zones with high density of microscopic FIs but also identify high water content in areas where no microscopic FIs were recognized (e.g., SS1; Figure 5). Additionally, the linear absorbance readily quantifies the scale of changes in water abundance in different regions of the sample.
One challenge with FTIR microscopy is that the 3,400 cm−1 band detects OH which may be present as free water (e.g., in FIs), as interstitial H2O in the crystal lattice or as OH groups bound to organic molecules (and other phases). In previous FTIR application on bulk samples, the 3,400 cm−1 band is routinely attributed to water in biominerals (Engin et al., 2006) but in abiogenic minerals it is commonly attributed to OH groups in organic compounds (Gázquez et al., 2012). Here, to compare the distribution of the OH peak with organic components, we also quantified the distribution of an organic-attributed band (2,983 cm−1). Because of the interference of the CO3 group in the region of the most commonly described organic components of stalagmites in the 1,650 to 1,265 cm−1 wavenumber range (Artz et al., 2008; Martínez-Pillado et al., 2020), we focused on the linear absorbance of the 2,983 cm−1 band of the asymmetric CH2 component which is expected in fats, waxes, and lipids.
As a first order qualitative test of whether sectors of the stalagmite high in 3,400 cm−1 band linear absorbance were only located in areas of high abundance of organics, we mapped the ratio of the 3,400 cm−1 band linear absorbance to 2,983 cm−1 band linear absorbance. If all elevated 3,400 cm−1 band linear absorbance were proportionally due to elevated 2,983 cm−1 band, then this ratio would be constant spatially across the stalagmite. Yet, we observe that regions of high 3,400 cm−1 band linear absorbance are also characterized by a high 3,400 cm−1 band to 2,983 cm−1 band ratio, implying increased OH stretching relative to CH2 stretching of aliphatics. We have interpreted this as evidence that a significant portion of the 3,400 cm−1 band linear absorbance signal reflects free water. This interpretation assumes that the 2,983 cm−1 band linear absorbance is representative of the abundance distribution of the broad suite of organic components which could feature OH groups. In future work, such an interpretation could be more rigorously tested by a full deconvolution of the organic peaks in the 1,650 to 1,265 cm−1 wavenumber range.
4.2 Effects of variable organic distribution in stalagmites
4.2.1 Is the FI and void density higher in organic rich growth layers?
Because greater concentrations of dissolved organic matter (DOM) in dripwaters translate to greater concentrations of OM in stalagmites (Chalmin et al., 2013; Pearson et al., 2020), layers of higher abundance of organic components in the stalagmite may reflect times of higher dripwater DOM delivery. Experimental calcite precipitation at varying concentrations of dissolved organic matter types typical of karst dripwaters, showed significant effects of OM incorporation on calcite fabric (Pearson et al., 2020). Compared to no DOM, the low DOM experiments featured more rounded rhombohedral corners and higher density of micron to sub-micron kinks which may represent active sites of DOM adsorption. The higher DOM experiments featured chiral rhombohedral morphology and elongation of the longest axis of crystals, and corners and pits with high step density and a larger number of pores. Greater density of pores may further enhance the concentration of OM in the stalagmite. These laboratory results are consistent with prior description that due to the incorporation of OM into the calcite lattice, more crystal defects (on sub-microscopic scale) are expected (Green et al., 2016; Phillips et al., 2016).
However, in the samples examined here, we find that growth layers with greater density of FIs and of high 3,400 cm−1 band linear absorbance coincide with low fluorescence (e.g., SS1, SS2 and MR1; Figures 4–6). The fluorescent layering disappears in FI bands (especially elongated FIs) suggesting low organic incorporation in those zones contrasting with higher organic concentrations in compact calcite (i.e., discontinuity in SS2; Figure 4). Similarly, the CLSM images often show low fluorescence in disturbed calcite fabrics, suggesting low organic content in these fabrics. Across the different examined growth layers, the range of organic contents evident from fluorescence and 2,983 cm−1 band linear absorbance may not encompass a wide enough variation in DOM content to significantly alter the growth mechanisms and fabrics.
4.2.2 What is the relationship of organics and colloidally delivered elements?
Some previous studies have documented a close spatial correspondence between fluorescence and elements such as Y, Zn and some other transition metals, a correlation often attributed to a colloidal transport (chelate complexes) and incorporation into calcite (e.g., Hartland et al., 2012; Rutlidge et al., 2014; Sliwinski and Stoll, 2021). In comparing the different samples examined here, we observe that the samples with higher fluorescence (SS1 and SS2) are also much higher in Y than the samples with low fluorescence (MR1, PG2 or GLA), suggesting substantially lower organic content correlates with lower Y concentrations. The same trend is revealed for Zn. One explanation is that organic compounds in dripwater may carry colloidally complexed elements such as Y and Zn (Hartland et al., 2012).
However, within an individual sample, our new results show the incorporation of both organics and colloidally transported elements into calcite to be more complex. Colloidally transported elements such as Y exhibit strongest variation among different growth layers and more limited lateral variations in our active stalagmites. Variation in dripwater chemistry and/or cave environmental parameters over time may contribute to these temporal variations. Yet, unlike results from slower growing fossil stalagmites from the same cave (La Vallina Cave) presented by Sliwinski and Stoll (2021), the growth layers of elevated Y and Zn of recently grown stalagmites examined here do not correlate persistently with elevated fluorescence (consistent with Sliwinski et al., 2023 investigating Y in other regions of the same samples). Rather, Y is elevated in water rich layers identified from 3,400 cm−1 band absorbance in MR1 (Figure 13) and in SS2 (Figure 11). In contrast, PG2 (Figure 14) and SS1 (Figure 12) show layers of high Y without any relationship with water.
We also do not see an ubiquitous covariation of Y and Zn as suggested by Chiarini et al. (2017) or Sliwinski and Stoll (2021) and described in many annually banded stalagmites (Borsato et al., 2007; Borsato et al., 2023). The correlation of Y and Zn is clear only in SS1 (Figure 12) and SS2 (Figure 11). Thus, more diverse delivery and incorporation mechanisms of Y and Zn appear to operate in the active growth of recent samples. Seasonal Y banding in fossil samples from this cave has been described to result from the interplay of driprate and colloid delivery and CaCO3 deposition rate (Sliwinski et al., 2023). For example, colloidally transported elements may reach higher concentrations in the stalagmite in the seasons of slowest CaCO3 deposition because they are subject to less dilation; the season of slowest CaCO3 deposition depends on the interplay of cave and soil pCO2 as well as drip rates (Kost et al., 2023; Sliwinski et al., 2023). Potentially, fossil stalagmites from this cave may reflect a different synchronization of ventilation, soil CO2, and drip rate than those occurring in the last decades of growth of active stalagmites (MR, PG and SS; Figures 11–14) under the recently changing environment. An altered seasonal ventilation regime due to rapid anthropogenic changes in exterior temperature in recent decades (Gonzalez-Hidalgo et al., 2016; Chazarra-Bernabé et al., 2020) relative to the longer-term adjustment of cave temperature, may contribute to disruption of seasonal cycles in cave ventilation and CO2 which in turn affect the season of maximum and minimum CaCO3 deposition.
The above discussion assumes a trace element delivery that is constant in time, either aided by colloids or fully dissolved in the dripwater. However, another mechanism contributing to element delivery to stalagmites is dry aerosol deposition (Dredge et al., 2013; Kost et al., 2023), which is likely an important mechanism during growth cessation, for example, due to stop in drip flow. For example, block fall or strong ventilation winds can raise dust within the cave which can deposit on the stalagmite surface. The visible detrital minerals and high Al content (Supplementary Figure S1) could be consistent with such a process during the hiatus in GLA. We cannot distinguish if detrital elements present in pores and fractures have been transported in by drip water, or if pores accumulate and trap detritals from drip water wash in or dry aerosol deposition. However, the ever-present possibility of this type of deposition means that the traditional soluble-colloidal division of elements cannot always be an accurate model.
4.3 The distribution of water in stalagmites
The formation mechanism of the pores in calcite, which may contain water, is still debated (e.g., Chiarini et al., 2017; Frisia et al., 2018). Molecular scale studies have shown growth defects deviating from the ideal spiral growth as one source of voids (De Yoreo and Vekilov, 2003). Laboratory precipitation experiments suggested higher dripwater DOM promotes more defects and pores (Chalmin et al., 2013; Green et al., 2016; Pearson et al., 2020), while trace element additives similarly introduce morphological deformations that may give rise to entrapped pores (Meldrum and Hyde, 2001; Wasylenki et al., 2005). Crystal defects could also be promoted by organic coating or impurities in the calcite lattice, for example, by clays. While it has been proposed that faster growth results in more crystal defects, Chiarini et al. (2017) suggest that more porous calcite forms at slower growth rates due to incorporation of elements inducing crystal lattice defects.
Our set of samples does not reveal a clear relationship of pores or water with average decadal-scale stalagmite growth rate defined by the bomb spike (Table 1). We do not recognize a greater number of pores or microscopic FIs in the faster growing active stalagmites (MR1, SS) compared to the slower PG2. We do observe that the more homogeneously distributed FIs occur in PG2, which precipitates calcite during a single season (Kost et al., 2023). In contrast, in SS and MR1 FIs are concentrated in certain growth layers. We do not resolve a fluid rich and fluid poor alternation within each yearly increment, as seen in some studies (Wassenburg et al., 2021). It is possible that the multiple growth seasons in SS condition the formation of inclusion rich layers during some environmental conditions. However, our data do not constrain the mechanism. Because we cannot resolve growth rate differences among individual growth layers or phases, it is possible that within-sample growth rate variations do correlate with FI density.
One important observation is an enrichment of visible and elongated FIs from TL images superimposed on condensed phases of growth as revealed, for example, by GLA or SS2 (Figures 3, 4). The higher IR absorbance at 3,400 cm−1 observed along hiatuses and growth discontinuities with detrital layers (GLA, SS2) is likely due to water bound to clays. At the same time, elongated voids around the GLA hiatus, potentially triggered by detrital minerals, also coincide with visible FIs indicating discrete free water regions (Figure 3). Similarly, SS1 and SS2 do reveal a higher water content in organic rich areas (e.g., upper part in SS2; Figure 4), which seems to be consistent with the observations of Pearson et al. (2020) suggesting DOM to promote crystal defects. However, in SS1, the areas of higher water content paradoxically coincide with the most transparent, microscopic FI and void free calcite.
Maps of FTIR absorbance at 3,400 cm−1 also suggest regions of higher water content in stalagmites which do not coincide with microscopic FIs visible in TL images (e.g., honeycomb pattern in SS1; Figures 5, 12). We interpret these regions must contain submicroscopic FIs as suggested by Sliwinski and Stoll (2021), Borsato et al. (2007) and Chiarini et al. (2017). Such submicroscopic FIs undetected by TL microscopy dominate the water distribution in SS1 and PG2 and potentially influence on the distribution of the most incompatible trace elements.
In PG2, dominated by dispersed submicroscopic FIs, high water content coincides with void-rich calcite (Figure 7). This pattern is evident in other samples, with the exception of SS1 (low water in elongated voids). This suggests that water remains in crystal defects or is adsorbed to the calcite surface in some crystal defects or fractures. However, in some major fractures, i.e., in SS2, the water content is low, suggesting that the stage of fracturing may affect water distribution and fractures generated during sampling or preparation do not affect water distribution. Meanwhile, some larger inter- (between crystallites) and intra-crystal pores (within crystallites) pores with visible detrital contamination do not yield higher IR absorbance in other sections (e.g., SS1, PG2; Figures 5, 7) and may have lost their water during closure or sample preparation.
4.4 Do fluid inclusions increase the measured Na concentrations?
The average partition coefficients for Na for some of our actively growing stalagmites (SS1 and SS2), using median Na of the laser maps (Figure 9), are higher than estimated from previous experimental calcite precipitation (Füger et al., 2019). Either the laboratory determined partition coefficients are not representative of Na incorporation into calcite in these speleothem growth settings, and/or simple partitioning from the drip water to calcite does not account for the main process hosting Na in the speleothem calcite. Because the absolute partition coefficient of Na is more than an order of magnitude lower than the other measured trace elements, Na would be the element most sensitive to contribution from microscopic or sub-microscopic FIs.
The distribution of water in stalagmites suggests that FIs could control spatial variations in Na within some samples, but not others. Within SS1 and SS2, FTIR suggests water is dominantly in submicroscopic FIs in compact calcite, in which polishing during sample preparation would impart minimal disruption of FIs at the scale of laser ablation depth (<10 μm), so these very small FIs may be more likely to be intersected by the laser path and record an appreciable trace element signature. Yet, the high water enriched zones in SS1 and SS2 do not show elevated Na. This suggests that in this sample, most of the Na is hosted in the calcite lattice or interstitially (i.e., not in the fluids). Additionally, cave monitoring suggests very limited (<10%) temporal variation in the Na concentration of an individual drip over a seasonal cycle probably due to strong buffering of concentration by cation exchange in soils (Tadros et al., 2019; Kost et al., 2023). At length scales similar to annual growth increments, and laterally along the same growth increment, there are much larger (>2-fold) spatial variations in Na concentrations in stalagmites. These larger variations do not correspond to changes in the water content in most cases, and therefore likely reflect variable effective incorporation in the calcite itself. As shown by Füger et al. (2019), Na incorporation depends on growth rate. Therefore, it is possible that changes in growth rates along a growth surface can result in such lateral variations.
In contrast, in MR1, detailed imaging shows two bands of high 3,400 cm−1 band absorbance with coincident microscopic inclusions visible in TL (Figure 12). High Na spots are more frequent within these bands and especially corresponding to elongated voids in the TL image. In GLA, the only sample in which the studied region is comprised of multiple crystallites, the 3,400 cm−1 band absorbance suggests concentration of water between the crystallites, although visible FIs in TL are not concentrated at these boundaries (Figure 3). Where FTIR indicates water between crystallites, high Na and U concentrations occur in these boundary areas (Figure 10). Also, in GLA, very locally-distributed clusters of high FI density with twice the water absorbance are enriched in Na by a factor of 2 at the ablation surface while other high water regions do not affect Na likely because the FIs are situated deeper in the sample than the laser ablation depth.
To reconcile these observations of diverse response in MR1 and GLA vs. SS1 and SS2, we propose that FIs do enrich the Na concentrations measured by LA-ICP-MS. However, this effect is more easily detectable in stalagmites with initially low calcite Na concentration. For instance, MR1 has at least fourfold lower Na incorporation and Na concentration than SS1 and SS2. Although partitioning cannot be calculated for the fossil stalagmite GLA, due to lack of corresponding dripwater, it features the lowest average Na concentration of all stalagmites, roughly twofold lower than MR1 and fivefold lower than SS1 and SS2 (Figure 15). In these samples, the FIs and/or the associated voids locally enhance Na.
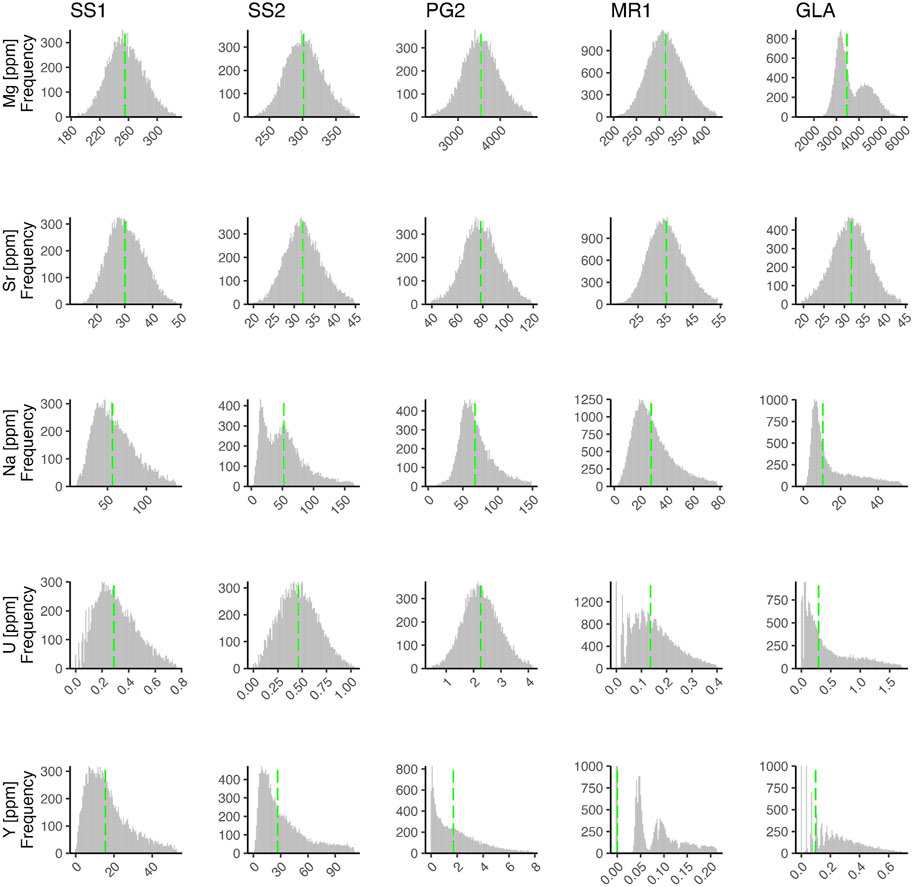
FIGURE 15. Histograms of elements Mg, Si, Na, U, and Y in all samples based on LA-ICP-MS mapped area for all mapped pixels in which the Al content was <6 ppm (and Ca counts were >800,000 CPS), in order to evaluate the concentrations in calcite with limited effect from embedded detrital phases. The green line illustrates the median concentration.
In contrast, we propose that other factors raise the background Na partitioning into calcite in SS1 and SS2 and therefore the additional Na contribution from FIs is a negligible proportion of the total measured Na. Thus, paradoxically, FI Na is not responsible for the anomalously high Na partition coefficients in SS1 and SS2 compared to laboratory calcite experiments (Figure 15). The higher Na partitioning in the SS1 and SS2 calcite is not likely attributable to growth rate, since its growth rate is similar to MR1 (Table 1). SS1 and SS2 form under faster drip rates and feature much higher fluorescence, organic content as well as Y concentration. The causes of high Y concentration in this sample are detailed in (Sliwinski et al., 2023). The very high concentration of Y3+ may increase Na+ incorporation in order to maintain charge balance via coupled substitution (Voigt et al., 2017), potentially explaining the water-unrelated enrichment of Na in SS1 and SS2.
If the quantitative estimates of water content, in the 0.1 to 0.25 volume % range (Supplementary Figure S3,S4, Supplementary Text S1.2) are accurate, then a water-free effective Na partition coefficient two orders of magnitude lower in MR1, PG2, and GLA than in SS1 or SS2 would be consistent with the observed water content and bulk Na concentration. Assuming such partition coefficients, the spatial variation in water content in MR1 could lead to over 2 to 3-fold changes in the total (water+calcite) Na concentration of the sample. A similar magnitude spatial variation in water content would lead to only 5% and 2% spatial variations in Mg concentration in MR1 and PG2, respectively. Spatially varying water content would induce <1% variation in Sr concentrations.
4.5 Controls on spatial variations in trace element incorporation
4.5.1 Relationship of voids with partitioning in different growth layers
It has been proposed that Sr partitioning is favored in compact calcite because of the sterically unhindered space provided by the spiral growth mechanism, whereas Mg favors porous microcrystalline fabric (Chiarini et al., 2017). We observe contrasting associations between Sr and compact vs. void-rich growth layers, which suggests that controls on Sr incorporation may be more complex. In SS1, we observe that the growth layers with highest Sr are those with low density of voids and visible FIs, although FTIR suggest that these high Sr calcite layers feature more submicroscopic FIs (Figure 12). In MR1, we observe minimal Sr in growth layers featuring larger FIs and greater water content (Figure 13), however in this sample the high water content layers are not the most compact calcite. These observations suggest that the submicroscopic textures regulating FI density may be the most significant scale in which Sr incorporation and water incorporation is coupled during deposition of growth layers under varying conditions.
4.5.2 The origin of crosscutting features
While the variation of trace elements, organics, and voids among growth layers can be readily attributed to changing dripwater or cave conditions over time, lateral variations along growth layers require novel explanations. In many of our active samples, we observe variations in water content and trace elements, and sometimes fluorescence, which crosscut growth layers. In thin section images, similar crosscutting zones of disrupted layers have been reported elsewhere (e.g., Figure 1 in Martín-Chivelet et al., 2013; Figure 2C in Treble et al., 2017). In our actively growing stalagmites, these features are not related to individual crystallites since the polarized images reveal big single crystals and disturbance within the area of homogeneous extinction. Nevertheless, it is possible that elongated crystallites reveal disturbed zones or crystal splitting due to strain built up between competing minerals of same optical properties. This might be revealed in the often observed radial structure of a polished stalagmite slab showing individual crystals (so called Spherocrystals) due to chemical splitting (Self and Hill, 2003). This phenomenon may also occur on the submillimeter scale as observed in our samples. Alternatively, we cannot rule out that multiple crystals grew separately but at the same orientation and left residual intra-crystallite variation and suturing, but no change in extinction angles.
These narrow crosscutting zones could also arise as contraction features if CaCO3 deposition proceeded by precursor phases with a higher unit cell volume such as monohydrocalcite (MHC) or amorphous calcium carbonate (ACC), so that transformation to calcite leaves space behind which can be filled by secondary precipitation. The secondary infill may have a different chemical composition. Since ACC traps more trace elements (Blue et al., 2017; Littlewood et al., 2017), the calcite sectors inherited from the precursor phases would be expected to retain higher trace element concentrations, compared to zones of secondary infill precipitated directly by ion growth of calcite. Secondary infillings might form at slower rates due to slower degassing in thicker water films, since these vertical disturbed zones are often marked by a concavity in the growth layer. The potential for secondary precipitation and void closure is consistent with other studies analyzing FI noble gas content which led to the suggestion of a long closure process for some pores by secondary carbonate infilling (Ghadiri et al., 2018).
Where such crosscutting features are prevalent in speleothems, they may be intersected by LA-ICP-MS line tracks, introducing pronounced transient anomalies in elements such as Sr which could be misinterpreted as growth layers of anomalously low Sr. Careful examination of calcite fabric by either transmitted light or CLSM might prove useful to avoid such zones when configuring laser ablation tracks. As this study highlights, LA maps combined with other non-destructive mapping techniques such as TL images, FTIR or CLSM yield the most detailed information about trace element distribution and allows to interpret trace element variations in relation to crystal features, organics, FIs and other phases.
5 Conclusion
We combined non-destructive mapping techniques with LA-ICP-MS trace element mapping in a high-resolution study examining one to 2 decades of growth in three active stalagmites, and centuries of growth in a fossil stalagmite. Using FTIR to map the distribution of water in calcite, we find that water is not only hosted in microscopic FIs visible in transmitted light microscopy, but can also be hosted in compact calcite without visual defects as submicroscopic FIs. Our results suggest that these FIs can host a significant fraction of highly incompatible elements such as Na, in stalagmites with low Na incorporation in the calcite phase. It remains to be explored whether FIs also host significant fraction of Li, a monovalent ion with effective partitioning coefficients in calcite 10-fold higher than Na (Füger et al., 2019) but still 100-fold lower than Mg (Wassenburg et al., 2020). If fluid Li were significant and variable, it would need to be considered in the interpretation of Li isotopic records of speleothems. Our results also suggest that coupled substitution of Y3+ and Na+increases solid phase Na incorporation in stalagmites with high Y delivery. These first estimates of the significance of fluid-hosted trace elements suggest that reconstruction of past changes in dripwater Na concentrations would require accounting for the role of FIs as well as the apparent effect of organic colloids and/or coupled substitution on incorporation rates. Direct measurement of Na content in FIs would circumvent these challenges if suitable analytical methods could be devised.
In active stalagmites, we observe that fluorescent organic matter is generally co-located with areas of high 2,983 cm−1 band linear absorbance, highlighting the potential of FTIR as an additional technique to map the distribution of organics in stalagmites. In one sample (MR1), 2,983 cm−1 band absorbance distinguishes organic rich growth layers not resolved in fluorescence. Among the different active stalagmites, the sample with greatest fluorescence also corresponds to highest Y, but within a given sample, growth layers with highest concentrations of colloidally transported elements do not universally coincide with peak fluorescence or FTIR 2983 cm−1 band absorbance. We also find that layers with higher concentrations of organic matter do not feature a higher density of voids or FIs.
In several active stalagmites, apparently within a single crystallite, growth layers are interrupted by narrow crosscutting zones of lower fluorescence and Sr content. Several crystallization processes may contribute to these disturbed zones. When such zones are intersected by LA-ICP-MS single line transects across the stalagmite, they may be misinterpreted as anomalously low Sr growth layers. This study demonstrates the importance of assessing controlling mechanisms of trace element distribution and incorporation into stalagmite samples to better constrain the relationship between speleothem trace elements and paleoenvironmental interpretations.
Data availability statement
The raw data supporting the conclusion of this article will be made available by the authors, without undue reservation.
Author contributions
OK and HS conceived and designed the research; HS supervised the study; OK performed FTIR analyses under supervision of NG and ML, OK performed all other lab analyses; data processing was completed by OK with NG, ML, and JS; OK, JS, and HS wrote and edited the paper, all co-authors reviewed the manuscript. All authors contributed to the article and approved the submitted version.
Funding
This work was supported by ETH Zürich (grant number ETH-1318-1).Open access funding by ETH Zurich.
Acknowledgments
We thank Laura Endres for assistance processing speleothem histograms, and Stefano Bernasconi for discussion of fluid inclusions as influence on Na in stalagmites.
Conflict of interest
The authors declare that the research was conducted in the absence of any commercial or financial relationships that could be construed as a potential conflict of interest.
Publisher’s note
All claims expressed in this article are solely those of the authors and do not necessarily represent those of their affiliated organizations, or those of the publisher, the editors and the reviewers. Any product that may be evaluated in this article, or claim that may be made by its manufacturer, is not guaranteed or endorsed by the publisher.
Supplementary material
The Supplementary Material for this article can be found online at: https://www.frontiersin.org/articles/10.3389/feart.2023.1240888/full#supplementary-material
References
Affolter, S., Fleitmann, D., and Leuenberger, M. (2014). New online method for water isotope analysis of speleothem fluid inclusions using laser absorption spectroscopy (WS-CRDS). Clim. Past. 10, 1291–1304. doi:10.5194/cp-10-1291-2014
Artz, R. R. E., Chapman, S. J., Jean Robertson, A. H., Potts, J. M., Laggoun-Défarge, F., Gogo, S., et al. (2008). FTIR spectroscopy can be used as a screening tool for organic matter quality in regenerating cutover peatlands. Soil Biol. Biochem. 40, 515–527. doi:10.1016/j.soilbio.2007.09.019
Bardelli, F., Benvenuti, M., Costagliola, P., Di Benedetto, F., Lattanzi, P., Meneghini, C., et al. (2011). Arsenic uptake by natural calcite: an XAS study. Geochimica Cosmochimica Acta 75, 3011–3023. doi:10.1016/j.gca.2011.03.003
Blue, C. R., Giuffre, A., Mergelsberg, S., Han, N., De Yoreo, J. J., and Dove, P. M. (2017). Chemical and physical controls on the transformation of amorphous calcium carbonate into crystalline CaCO3 polymorphs. Geochimica Cosmochimica Acta 196, 179–196. doi:10.1016/j.gca.2016.09.004
Borsato, A., Fairchild, I. J., Frisia, S., Wynn, P. M., and Fohlmeister, J. (2023). The Ernesto Cave, northern Italy, as a candidate auxiliary reference section for the definition of the Anthropocene series. Anthropocene Rev. 10. doi:10.1177/20530196221144094
Borsato, A., Frisia, S., Fairchild, I. J., Somogyi, A., and Susini, J. (2007). Trace element distribution in annual stalagmite laminae mapped by micrometer-resolution X-ray fluorescence: implications for incorporation of environmentally significant species. Geochimica Cosmochimica Acta 71, 1494–1512. doi:10.1016/j.gca.2006.12.016
Busenberg, E., and Plummer, N. L. (1985). Kinetic and thermodynamic factors controlling the distribution of SO32− and Na+ in calcites and selected aragonites. Geochimica Cosmochimica Acta 49, 713–725. doi:10.1016/0016-7037(85)90166-8
Chalmin, E., Perrette, Y., Fanget, B., and Susini, J. (2013). Investigation of organic matter entrapped in synthetic carbonates—a multimethod approach. Microsc. Microanal. 19, 132–144. doi:10.1017/s1431927612013773
Chazarra-Bernabé, A., Lorenzo Mariño, B., Rodríguez Ballesteros, C., and Botey, M. R. (2020). Análisis de las temperaturas en España en el periodo 1961-2018. Agencia Estatal de Meteorologia (AEMET).
Chiarini, V., Couchoud, I., Drysdale, R., Bajo, P., Milanolo, S., Frisia, S., et al. (2017). Petrographical and geochemical changes in Bosnian stalagmites and their palaeo-environmental significance. Int. J. Speleology 46, 33–49. doi:10.5038/1827-806x.46.1.2057
Curti, E. (1997). Coprecipitation of radionuclides: basic concepts, literature review and first applications. Würenlingen: Paul Scherrer Institute (PSI).
Day, C. C., and Henderson, G. M. (2013). Controls on trace-element partitioning in cave-analogue calcite. Geochimica Cosmochimica Acta 120, 612–627. doi:10.1016/j.gca.2013.05.044
Demény, A., Németh, P., Czuppon, G., Leél-Őssy, S., Szabó, M., Judik, K., et al. (2016). Formation of amorphous calcium carbonate in caves and its implications for speleothem research. Sci. Rep. 6, 39602. doi:10.1038/srep39602
Devriendt, L. S., Mezger, E. M., Olsen, E. K., Watkins, J. M., Kaczmarek, K., Nehrke, G., et al. (2021). Sodium incorporation into inorganic CaCO3 and implications for biogenic carbonates. Geochimica Cosmochimica Acta 314, 294–312. doi:10.1016/j.gca.2021.07.024
De Yoreo, J. J., and Vekilov, P. G. (2003). Principles of crystal nucleation and growth. Rev. Mineralogy Geochem. 54, 57–93. doi:10.2113/0540057
Dredge, J., Fairchild, I. J., Harrison, R. M., Fernandez-Cortes, A., Sanchez-Moral, S., Jurado, V., et al. (2013). Cave aerosols: distribution and contribution to speleothem geochemistry. Quat. Sci. Rev. 63, 23–41. doi:10.1016/j.quascirev.2012.11.016
Endres, L., Jacquin, C., Kaushal, N., Kost, O., Stoll, H. M., Gonzalez Lemos, S., et al. (2023). Climatic and cave settings influence on drip water fluorescent organic matter with implications for fluorescent laminations in stalagmites. Quaternary Research, 1–21. doi:10.1017/qua.2023.41
Engin, B., Demirtaş, H., and Eken, M. (2006). Temperature effects on egg shells investigated by XRD, IR and ESR techniques. Radiat. Phys. Chem. 75, 268–277. doi:10.1016/j.radphyschem.2005.09.013
Fairchild, , and Baker, I. A. A. (2012). Speleothem Science: from process to past environments. Wiley-Blackwell.
Frisia, S. (2015). Microstratigraphic logging of calcite fabrics in speleothems as tool for palaeoclimate studies. Int. J. Speleology 44, 1–16. doi:10.5038/1827-806X.44.1.1
Frisia, S., Borsato, A., and Hellstrom, J. (2018). High spatial resolution investigation of nucleation, growth and early diagenesis in speleothems as exemplar for sedimentary carbonates. Earth-Science Rev. 178, 68–91. doi:10.1016/j.earscirev.2018.01.014
Füger, A., Konrad, F., Leis, A., Dietzel, M., and Mavromatis, V. (2019). Effect of growth rate and pH on lithium incorporation in calcite. Geochimica Cosmochimica Acta 248, 14–24. doi:10.1016/j.gca.2018.12.040
Gázquez, F., Calaforra, J.-M., Rull, F., Forti, P., and García-Casco, A. (2012). Organic matter of fossil origin in the amberine speleothems from el soplao cave (cantabria, northern Spain).
Ghadiri, E., Vogel, N., Brennwald, M. S., Maden, C., Häuselmann, A. D., Fleitmann, D., et al. (2018). Noble gas based temperature reconstruction on a Swiss stalagmite from the last glacial–interglacial transition and its comparison with other climate records. Earth Planet. Sci. Lett. 495, 192–201. doi:10.1016/j.epsl.2018.05.019
Gonzalez-Hidalgo, J. C., Peña-Angulo, D., Brunetti, M., and Cortesi, N. (2016). Recent trend in temperature evolution in Spanish mainland (1951–2010): from warming to hiatus. Int. J. Climatol. 36, 2405–2416. doi:10.1002/joc.4519
Green, D. C., Ihli, J., Thornton, P. D., Holden, M. A., Marzec, B., Kim, Y.-Y., et al. (2016). 3D visualization of additive occlusion and tunable full-spectrum fluorescence in calcite. Nat. Commun. 7, 13524. doi:10.1038/ncomms13524
Hartland, A., Fairchild, I. J., Lead, J. R., Borsato, A., Baker, A., Frisia, S., et al. (2012). From soil to cave: transport of trace metals by natural organic matter in karst dripwaters. Chem. Geol. 304-305, 68–82. doi:10.1016/j.chemgeo.2012.01.032
Hartland, A., Fairchild, I. J., Müller, W., and Dominguez-Villar, D. (2014). Preservation of NOM-metal complexes in a modern hyperalkaline stalagmite: implications for speleothem trace element geochemistry. Geochimica Cosmochimica Acta 128, 29–43. doi:10.1016/j.gca.2013.12.005
Ishikawa, M., and Ichikuni, M. (1984). Uptake of sodium and potassium by calcite. Chem. Geol. 42, 137–146. doi:10.1016/0009-2541(84)90010-x
Kost, O., González-Lemos, S., Rodríguez-Rodríguez, L., Sliwinski, J., Endres, L., Haghipour, N., et al. (2023). Relationship of seasonal variations in drip water δ13CDIC, δ18O, and trace elements with surface and physical cave conditions of La Vallina cave, NW Spain. Hydrol. Earth Syst. Sci. 27, 2227–2255. doi:10.5194/hess-27-2227-2023
Krüger, Y., Marti, D., Staub, R. H., Fleitmann, D., and Frenz, M. (2011). Liquid–vapour homogenisation of fluid inclusions in stalagmites: evaluation of a new thermometer for palaeoclimate research. Chem. Geol. 289, 39–47. doi:10.1016/j.chemgeo.2011.07.009
Lebron, I., and Suarez, D. L. (1996). Calcite nucleation and precipitation kinetics as affected by dissolved organic matter at 25°C and pH > 7.5. Geochimica Cosmochimica Acta 60, 2765–2776. doi:10.1016/0016-7037(96)00137-8
Lindeman, I., Hansen, M., Scholz, D., Breitenbach, S. F. M., and Hartland, A. (2022). Effects of organic matter complexation on partitioning of transition metals into calcite: cave-analogue crystal growth experiments. Geochimica Cosmochimica Acta 317, 118–137. doi:10.1016/j.gca.2021.10.032
Littlewood, J. L., Shaw, S., Peacock, C. L., Bots, P., Trivedi, D., and Burke, I. T. (2017). Mechanism of enhanced strontium uptake into calcite via an amorphous calcium carbonate crystallization pathway. Cryst. Growth & Des. 17, 1214–1223. doi:10.1021/acs.cgd.6b01599
Martín-Chivelet, J., Muñoz-García, M. B., Ortega, A. I., Cruz-Martínez, J., Garralón, A., and Turrero, M. J. (2013). Speleothem microstratigraphy: some clues for paleoclimate series reconstruction at centennial to decadal scales.
Martínez-Pillado, V., Yusta, I., Iriarte, E., Álvaro, A., Ortega, N., Aranburu, A., et al. (2020). The red coloration of Goikoetxe Cave’s speleothems (Busturia, Spain): an indicator of paleoclimatic changes. Quat. Int. 566-567, 141–151. doi:10.1016/j.quaint.2020.04.006
Meckler, A. N., Affolter, S., Dublyansky, Y. V., Krüger, Y., Vogel, N., Bernasconi, S. M., et al. (2015). Glacial–interglacial temperature change in the tropical West Pacific: a comparison of stalagmite-based paleo-thermometers. Quat. Sci. Rev. 127, 90–116. doi:10.1016/j.quascirev.2015.06.015
Meldrum, F. C., and Hyde, S. T. (2001). Morphological influence of magnesium and organic additives on the precipitation of calcite. J. Cryst. Growth 231, 544–558. doi:10.1016/s0022-0248(01)01519-6
Paquette, J., and Reeder, R. J. (1995). Relationship between surface structure, growth mechanism, and trace element incorporation in calcite. Geochimica Cosmochimica Acta 59, 735–749. doi:10.1016/0016-7037(95)00004-j
Paterson, M. (1982). The determination of hydroxyl by infrared absorption in quartz, silicate glasses and similar materials. Bull. minéralogie 105, 20–29. doi:10.3406/bulmi.1982.7582
Paton, C., Hellstrom, J., Paul, B., Woodhead, J., and Hergt, J. (2011). Iolite: freeware for the visualisation and processing of mass spectrometric data. J. Anal. Atomic Spectrom. 26, 2508–2518. doi:10.1039/c1ja10172b
Pearson, A. R., Hartland, A., Frisia, S., and Fox, B. R. (2020). Formation of calcite in the presence of dissolved organic matter: partitioning, fabrics and fluorescence. Chem. Geol. 539, 119492. doi:10.1016/j.chemgeo.2020.119492
Phillips, B. L., Zhang, Z., Kubista, L., Frisia, S., and Borsato, A. (2016). NMR spectroscopic study of organic phosphate esters coprecipitated with calcite. Geochimica Cosmochimica Acta 183, 46–62. doi:10.1016/j.gca.2016.03.022
Renard, F., Montes-Hernandez, G., Ruiz-Agudo, E., and Putnis, C. V. (2013). Selenium incorporation into calcite and its effect on crystal growth: an atomic force microscopy study. Chem. Geol. 340, 151–161. doi:10.1016/j.chemgeo.2012.12.017
Rimstidt, J. D., Balog, A., and Webb, J. (1998). Distribution of trace elements between carbonate minerals and aqueous solutions. Geochimica Cosmochimica Acta 62, 1851–1863. doi:10.1016/s0016-7037(98)00125-2
Rutlidge, H., Baker, A., Marjo, C. E., Andersen, M. S., Graham, P. W., Cuthbert, M. O., et al. (2014). Dripwater organic matter and trace element geochemistry in a semi-arid karst environment: implications for speleothem paleoclimatology. Geochimica Cosmochimica Acta 135, 217–230. doi:10.1016/j.gca.2014.03.036
Self, C. A., and Hill, C. A. (2003). How speleothems grow: an introduction to the ontogeny of cave minerals. J. Cave Karst Stud. 65, 130–151.
Sliwinski, J. T., Kost, O., Endres, L., Iglesias, M., Haghipour, N., González-Lemos, S., et al. (2023). Exploring soluble and colloidally transported trace elements in stalagmites: the strontium-yttrium connection. Geochimica Cosmochimica Acta 343, 64–83. doi:10.1016/j.gca.2022.12.023
Sliwinski, J. T., and Stoll, H. M. (2021). Combined fluorescence imaging and LA-ICP-MS trace element mapping of stalagmites: microfabric identification and interpretation. Chem. Geol. 581, 120397. doi:10.1016/j.chemgeo.2021.120397
Stünitz, H., Thust, A., Heilbronner, R., Behrens, H., Kilian, R., Tarantola, A., et al. (2017). Water redistribution in experimentally deformed natural milky quartz single crystals—implications for H2O-weakening processes. J. Geophys. Res. Solid Earth 122, 866–894. doi:10.1002/2016jb013533
Tadros, C. V., Treble, P. C., Baker, A., Hankin, S., and Roach, R. (2019). Cave drip water solutes in south-eastern Australia: constraining sources, sinks and processes. Sci. Total Environ. 651, 2175–2186. doi:10.1016/j.scitotenv.2018.10.035
Treble, P. C., Baker, A., Ayliffe, L. K., Cohen, T. J., Hellstrom, J. C., Gagan, M. K., et al. (2017). Hydroclimate of the Last Glacial Maximum and deglaciation in southern Australia's arid margin interpreted from speleothem records (23–15 ka). Clim. Past. 13, 667–687. doi:10.5194/cp-13-667-2017
Tremaine, D. M., and Froelich, P. N. (2013). Speleothem trace element signatures: a hydrologic geochemical study of modern cave dripwaters and farmed calcite. Geochimica Cosmochimica Acta 121, 522–545. doi:10.1016/j.gca.2013.07.026
Wassenburg, J. A., Riechelmann, S., Schröder-Ritzrau, A., Riechelmann, D. F. C., Richter, D. K., Immenhauser, A., et al. (2020). Calcite Mg and Sr partition coefficients in cave environments: implications for interpreting prior calcite precipitation in speleothems. Geochimica Cosmochimica Acta 269, 581–596. doi:10.1016/j.gca.2019.11.011
Wassenburg, J. A., Vonhof, H. B., Cheng, H., Martínez-García, A., Ebner, P.-R., Li, X., et al. (2021). Penultimate deglaciation Asian monsoon response to North Atlantic circulation collapse. Nat. Geosci. 14, 937–941. doi:10.1038/s41561-021-00851-9
Keywords: FTIR mapping, CLSM, LA-ICP-MS, fluid inclusions, stalagmites, trace element incorporation, calcite
Citation: Kost O, Sliwinski J, Gies N, Lueder M and Stoll H (2023) The influence of fluid inclusions, organics, and calcite fabric on trace element distributions in stalagmites. Front. Earth Sci. 11:1240888. doi: 10.3389/feart.2023.1240888
Received: 15 June 2023; Accepted: 26 October 2023;
Published: 07 November 2023.
Edited by:
Haiwei Zhang, Xi’an Jiaotong University, ChinaReviewed by:
Valentina Rimondi, Università di Firenze, ItalyJose Mirao, University of Evora, Portugal, Portugal
Copyright © 2023 Kost, Sliwinski, Gies, Lueder and Stoll. This is an open-access article distributed under the terms of the Creative Commons Attribution License (CC BY). The use, distribution or reproduction in other forums is permitted, provided the original author(s) and the copyright owner(s) are credited and that the original publication in this journal is cited, in accordance with accepted academic practice. No use, distribution or reproduction is permitted which does not comply with these terms.
*Correspondence: H. Stoll, aGVhdGhlci5zdG9sbEBlcmR3LmV0aHouY2g=