 Stéphanie Dupré1*
 Jean-Paul Foucher1
 Catherine Pierre2Carole Decker3Graham Westbrook4Stephan Ker1
 Karine Olu3Jean-Pierre Donval1Jean-Luc Charlou1Marie-Madeleine Blanc-Valleron5Hervé Nouzé1
- 1UMR GEO-OCEAN, IFREMER, Plouzané, France
- 2UMR LOCEAN, Sorbonne Université, Paris, France
- 3UMR BEEP, IFREMER, Plouzané, France
- 4School of Geography, Earth & Environmental Sciences, University of Birmingham, Birmingham, United Kingdom
- 5UMR-CR2P, CNRS-MNHN, Paris, France
We investigated fluid seepage within the Nyegga pockmark field (600–900 m water depths) off mid-Norway from Remotely Operated Vehicle dives at the so-called CNE sites (CNE01 to CNE17). The seafloor morphology of some of these features corresponds to pockmarks and adjacent ridges, with the latter being the focus of present seepage activity. These structures are underlain by chimneys above a gas-charged zone with, in some cases, a substantial body of hydrate-invaded sediment (down to 1.3 s in two-way travel time at CNE03). Present-day methane-rich fluid seepage through the seabed is indicated by chemosynthetic fauna, in particular Siboglinidae polychaetes (Oligobrachia haakonmobiensis webbi and Sclerolinum contortum), microbial mats and associated Rissoidae gastropod (Alvania sp.) grazers, and confirmed by measured in situ bottom-water methane anomalies, up to 2,130 nL/L. No free-gas bubble emissions were observed or acoustically identified. The presence of authigenic carbonates reveals past seepage with very low δ13C values (down to −58‰) indicating that the major source of carbon was methane carried by the venting fluids. The ages of major periods of methane venting are provided by vesicomyid bivalve shells (Isorropodon nyeggaensis) present in two sedimentary layers, 14,930 and 15,500 14C yr BP (ca. 17,238 and 17,952 cal yr BP), respectively, corresponding to the time of Melt Water Pulse IA. The seafloor morphology and pattern of seepage -chemosynthetic fauna and microbial mat distribution and dissolved methane concentration-are remarkably heterogeneous. Pore-water chemistry profiles in a gravity core taken only 40 m from major seepage sites indicate no seepage and anaerobic methane oxidation at a sub-bottom depth of about 2 m. Present-day seepage from the studied pockmark-chimney fluid-flow system charged with gas hydrate is dominated by the advection of methane solution in pore water. Some of this methane could result from the dissolution of hydrate in the chimney, most of which would have formed during an earlier period (post-LGM times) of history of the chimney, when it was venting free gas. However, the presence of free gas beneath this chimney is probably why the water entering the chimney is already saturated with methane and the process of hydrate formation in the chimney continues today.
1 Introduction
Pockmarks are commonly interpreted as sites of hydrodynamic removal of sediment caused by focused fluid discharge through the seabed (Judd and Hovland, 2007). Mainly associated with light hydrocarbon gases, pockmarks, since their first discovery off Nova Scotia (King and MacLean, 1970) have been identified and studied worldwide at numerous continental margins, in particular offshore Norway (Vogt et al., 1999b). Marine fluid-flow systems are relevant for geohazards with i) triggering of sedimentary instabilities in relation or not with gas hydrate dissociation (Bünz et al., 2003), ii) their relationships with earthquakes (Field and Jennings, 1987) and iii) possible massive methane release into the ocean and the atmosphere (Borges et al., 2016). Cold seeps are also hotspots for biology with the establishment of chemosynthetic organisms and microbial communities and the potential to provide specific habitats (Sibuet and Olu, 1998; Vanreusel et al., 2009).
The studied area is located on the continental slope off mid-Norway within the Nyegga pockmark field and lies at water depths of 600–800 m, ∼20–30 km from the northern Storegga slide scar (Figure 1). This area comprises pockmark features above gas chimneys labelled CNE01 to CNE17 (CNE standing for ChimNEy) from east to west (Figure 2A). The CNE sites were identified previous to this study at the seafloor and in depth using conventional bathymetric mapping and seismics, respectively. These data that we can qualify as ‘vintage’ were acquired during the Hydratech marine expedition (Nouzé et al., 2002; Nouzé et al., 2004) with a few of the unpublished seismic lines presented here. Although the Nyegga pockmark field has been investigated for many years (e.g., Mienert et al., 1998; Vogt et al., 1999a; Vogt et al., 1999c; Berndt et al., 2003; Bünz et al., 2003; Bünz and Mienert, 2004) resulting in significant geophysical acquisition and to a less extent geological sampling, near-bottom investigation including biological studies is limited to a few sites (e.g., G11, see location in Figure 1B; Hovland et al., 2005; Hovland and Svensen, 2006) and there has been no multidisciplinary investigation to date for the CNE area.
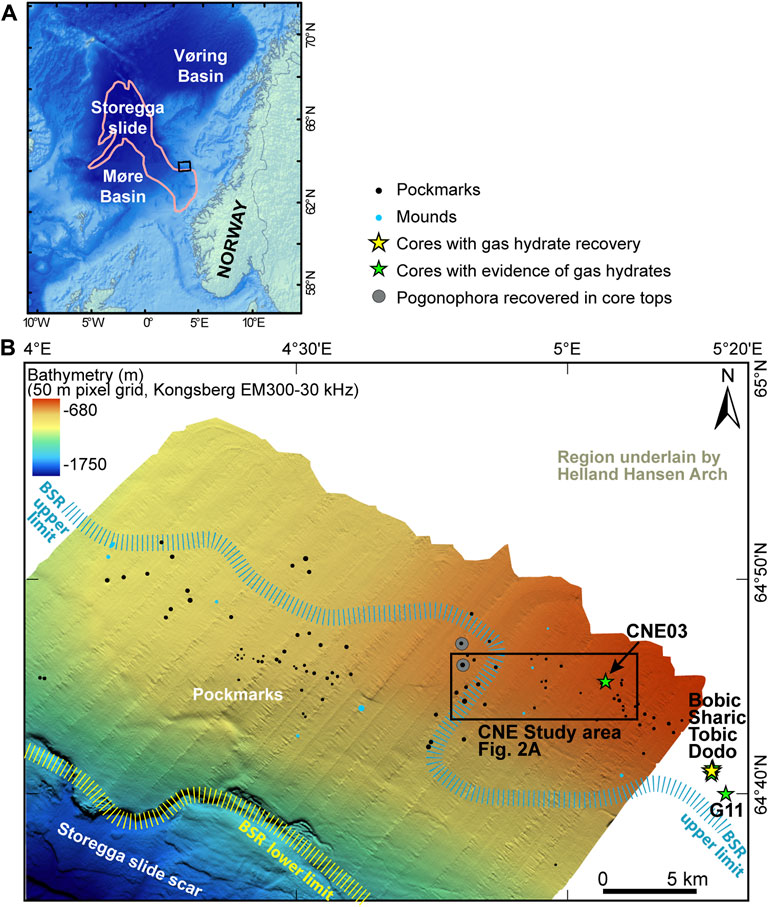
FIGURE 1. (A) General location map of the study area within the Nyegga area on the mid-Norwegian continental margin (Norwegian Sea) with contour of the Storegga Slide from Bünz and Mienert (2004). Black rectangle stands for the frame of Figure 1B. (B) Shaded regional bathymetry map of part of the Nyegga slope (Hydratech data) with areas of seabed occupied by the largest pockmarks, shown in black, and mounds, shown in blue. The pockmarks were identified from this regional multibeam bathymetry and associated chirp profiler records, with some of them previously identified from seismic reflection sections by Bünz et al. (2003). The upper and lower limits of the area of the slope underlain, at least partly, by gas-hydrate-related Bottom-Simulating Reflectors (BSRs) are indicated by blue and yellow barred lines, respectively. The yellow and green stars stand for locations of gravity cores (mainly TTR16 data) with gas hydrate recovery (Sharic pockmark) and evidence of the presence of gas hydrates in the sediment (CNE03, G11, Bobic and Tobic pockmarks), respectively (Ivanov et al., 2007; Akhmetzhanov et al., 2008; Ivanov et al., 2010; Attias et al., 2020). The green star in the study area is the CNE03 location of cores that evidenced gas hydrates (AT634G, Ivanov et al., 2010; Core CNE03; Attias et al., 2020). Pogonophora were recovered in the core tops of AT634G (CNE03), AT117G and AT118G (displayed as grey dots) from TTR16 and TTR8 cruises, respectively (Ivanov et al., 2010).
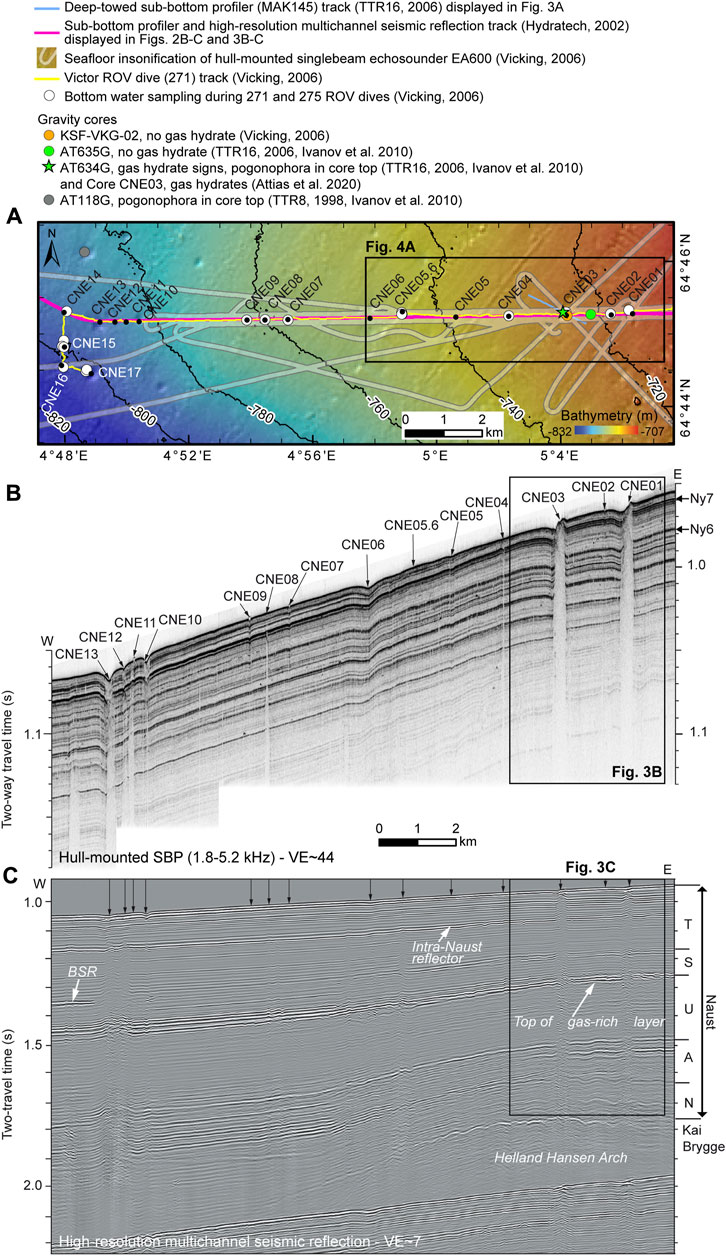
FIGURE 2. (A) Bathymetric zoom of the Nyegga study corridor displayed in Figure 1B with location of the unpublished hull-mounted sub-bottom profiler and 120-channel high-resolution reflection seismic records (Hydratech data) shown in Figures 2B,C, respectively. Seafloor imprint of the Kongsberg EA600 single-beam echosounder (Vicking data) insonification is reported. All subfigures have the same horizontal scale. Identified pockmarks and their underlying chimneys (CNE01 to CNE17) are shown along the Victor ROV track during Vicking dive 271. (B) Record from a hull-mounted 1.8–5.2 kHz sub-bottom profiler acquired along the track shown in Figure 2A. Arrows indicate the positions of pockmarks investigated with Victor ROV. Acoustic responses of the wider ‘chimneys’ and narrower ‘conduits’ beneath the pockmarks are typically zones of low amplitude and coherence, with deformation of strata in the flanks of chimneys. The interval between horizons Ny6 and Ny7, with ages of 15,800 14C ky BP and 15,000 14C ky BP (ca. 18,314 and 17,366 cal yr BP), respectively, was one of rapid sedimentation (Reiche et al., 2011). (C) Stacked and migrated seismic line from 120-channel high-resolution seismic survey along the track shown in Figure 2A. Positions of pockmarks are indicated by arrows at the seabed. The top of the layer, which from its low seismic velocity, appears to contain gas, is marked, as a local occurrence of a hydrate-related bottom-simulating reflector. Near the time axis on the right, is the seismo-stratigraphy for the Naust and Kai formations, after Rise et al. (2006) and following, in part, the interpretations of Hustoft et al. (2007) and Plaza-Faverola et al. (2012). The Intra-Naust reflector is dated at 130 ky (Solheim et al., 2005).
Evidence of fluid escape in the past has been demonstrated at several Nyegga pockmarks by observations of authigenic carbonates, chemosynthetic fauna and hydrate (Hovland et al., 2005; Mazzini et al., 2006; Ivanov et al., 2007; Paull et al., 2008; Ivanov et al., 2010; Attias et al., 2020). However, clear evidence of current seepage has only been found at the G11 pockmark (Hovland et al., 2005; Hovland and Svensen, 2006; Vanreusel et al., 2009; Decker et al., 2012; Decker and Olu, 2012), although the presence of living Siboglinidae (pogonophora) in the tops of cores indicates possible seepage at three pockmarks, CNE03 and coring sites AT117G and AT118G located l.6 and 3.6 km north of CNE14, respectively (Figures 1B, 2A) (Ivanov et al., 2010).
For the first time, multi-frequency seismics, seafloor cartography (multi-frequency bathymetry and seafloor backscatter), near-bottom in situ observations and sampling using a Remotely Operated Vehicle (ROV) and acoustic records of the water column were combined in the CNE area. Most of these data are unpublished. The geophysical data were mainly acquired during the Hydratech (Nouzé et al., 2002; Nouzé et al., 2004) and Vicking (Nouzé et al., 2007) expeditions with however a few additional data acquired during the TTR16 expedition (Akhmetzhanov et al., 2008). The near-bottom investigation was conducted during the Vicking cruise with the Ifremer Victor ROV, and included biological and geological observations and sampling of the seabed. This data is reported here with additional information on gravity coring. This paper includes results on the seismic signatures of gas and hydrate-bearing sediments, seafloor acoustic signatures of seep-related areas and reports evidence for current and past seepage activity including methane concentration measurements, fauna description and distribution and geochemical analysis of methane-derived authigenic carbonates. Finally, we discuss the formation of methane-derived authigenic carbonates and consolidated sediment outcrops and present-day versus past seepage activity. The relationship between fluid seepage activity at the seabed and the occurrence of gas hydrate at depth is presented through a conceptual model illustrating the present-day status of the methane-fluid flow system at the CNE pockmark field area.
2 Geological setting of the Nyegga area
The Nyegga area is located on the continental slope off mid-Norway (Figure 1). It forms the southern margin of the Vøring Plateau and borders the north of the Storegga Slide. It lies above the Helland-Hansen Arch, an anticline formed during Tertiary compressive deformation in the North Atlantic (Rise et al., 2006) (Figure 1B). The sedimentary stratigraphy above the Helland-Hansen Arch consists of a Miocene-Oligocene basal unit (Kai and Brygge formations), up to 2 km thick at the westward toe of the arch, overlain by an up to 1-km-thick Plio-Pleistocene sequence (Naust formation) (Figure 2C). The Plio-Pleistocene sequence shows alternations of hemipelagic mud and glacigenic deposits (e.g., Hjelstuen et al., 2010).
Hydrate-related Bottom Simulating Reflectors (BSR) commonly occur in the region with a fluid-flow system composed of free gas and gas hydrates (Mienert et al., 1998; Bünz et al., 2003; Bünz and Mienert, 2004; Westbrook et al., 2008). The Nyegga area on the continental slope off mid-Norway is an area known for its particularly dense distribution of pockmarks (Hjelstuen et al., 2010), ranging from small circular depressions with diameters <5 m (the unit-pockmarks as named by Hovland et al., 2010) to large complex structures with diameters of several hundreds of meters showing up to 10-m-high carbonate ridges inside their depressions (Hovland et al., 2005). A large number of Nyegga pockmarks are underlain by seismically defined chimney-like features, often referred to as « gas chimneys » or « pipes » (Bünz et al., 2003). These pockmarks and the underlying chimneys form complex fluid-escape systems (Hustoft et al., 2007; Paull et al., 2008; Hjelstuen et al., 2010), that may host gas hydrate in the subsurface sediment as suggested at several pockmarks and confirmed at CNE03 (Attias et al., 2020) and Sharic (Ivanov et al., 2007) from core data, seismic (Plaza-Faverola et al., 2010) and electromagnetic results (Attias et al., 2016) (Figure 1B). The presence of gas hydrate in the study area was also inferred at a shallow depth from gravity coring (AT634G) at the CNE03 site during the TTR16 expedition of the R/V (Research Vessel) Professor Logachev (Ivanov et al., 2007; Akhmetzhanov et al., 2008) (Figures 1B, 2A). The CNE03 site was also investigated with a high-resolution 3D seismic-tomography experiment showing that P-wave velocity inside the chimney was up to 300 m/s higher than in the surrounding strata within the methane-hydrate stability zone (Plaza-Faverola et al., 2010) (Figure 3C). This zone of anomalously high velocity is about 200 m wide near the seabed, and increases to about 500 m wide near its base, at a depth of 250 m below the seafloor. It is likely that the higher seismic velocity in this zone is produced by the presence of gas hydrate with a concentration of up to 14% of total volume rather than by the presence of carbonates (Plaza-Faverola et al., 2010).
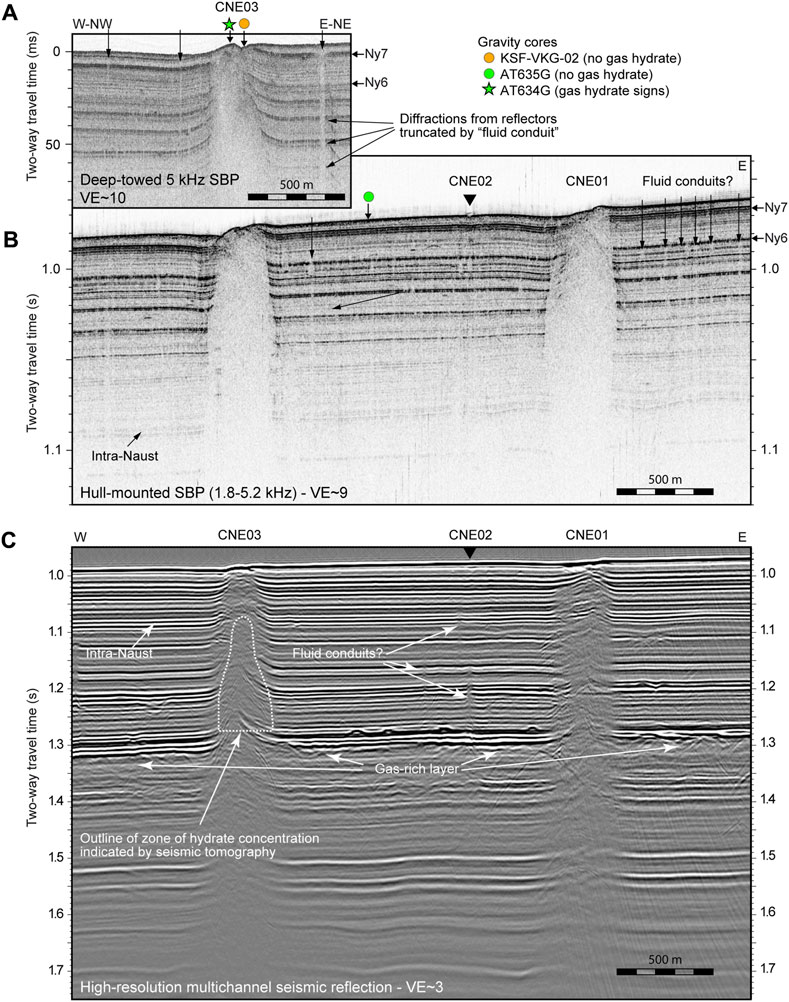
FIGURE 3. Three seismic sections (see locations in Figure 2) with the same horizontal scale across the CNE01, CNE02 and CNE03 pockmarks, with Figures 3B,C zooms of Figures 2B,C, respectively. (A) a MAK-1M deep-towed 5 kHz Sub-Bottom Profiler (SBP) line. This profile was acquired during the TTR16 expedition (Akhmetzhanov et al., 2008) and was published in Ivanov et al. (2007) and Ivanov et al. (2010), (B) a hull-mounted 1.8–5.2 kHz sub-bottom profiler line. This profile was acquired during the Hydratech expedition (Nouzé et al., 2002) and the presented section was published in Foucher et al. (2009), and (C) a 120-channel high-resolution stacked and migrated seismic line. This unpublished profile was acquired during the Hydratech expedition (Nouzé et al., 2002). Star and circles stand for the locations of gravity cores mentioned in the text (see legend in Figure 2A). Sections from the deep-towed and hull-mounted sub-bottom profiler show narrow zones of low amplitude and low coherence, marked by arrows, which are interpreted as narrow conduits conveying pore fluid to the seabed. Scattering from truncated beds at the margins of some of these zones demonstrates that solely by bodies of high acoustic impedance at their tops cause them. Large chimneys beneath CNE01 and CNE03 are represented by zones of scattering, low amplitude and low coherence in the high-frequency records (A and B), but the lower-frequency mini-GI gun records (C) show more of the upward bending of the strata towards the centers of chimneys, where the strata are locally more deformed and, in the case of CNE03, faulted (upthrown to the southeast). The outline of the body of gas hydrate identified beneath CNE03 by Plaza-Faverola et al. (2010) is shown in this high-resolution seismic section (C).
Some of the chimneys can be traced downwards, several hundreds of meters below the seabed through the entire Plio-Pleistocene sedimentary unit to the polygonal faults of the underlying Miocene-Pliocene sequence and appear to relay fluid migration from deep sources to the seafloor (Berndt et al., 2003; Gay and Berndt, 2007; Hustoft et al., 2007; Plaza-Faverola et al., 2012). It has been demonstrated from high-resolution 3D seismic data that some of the chimneys with a surface expression at the seabed have been reactivated once or twice over the past 200 ky, whereas others formed since the last glacial maximum (Plaza-Faverola et al., 2011). Reiche et al. (2011) correlate periods of fluid expulsion with periods of rapid sedimentation that occurred at 18,200 14C yr BP (ca. 21,079 cal yr BP), 17,500 14C yr BP (ca. 20,200 cal yr BP) and 16,900 14C yr BP (ca. 19,502 cal yr BP) and between 15,800 14C yr BP (ca. 18,314 cal yr BP) and 15,000 14C yr BP (ca. 17,366 cal yr BP) and they speculate that the triggering of the Storegga Slide at 7,250 14C yr BP (ca. 7,525 cal yr BP) (Bondevik et al., 1997; Haflidason et al., 2005) led to fluid expulsion through tension cracks created by this event (represented at the seabed by linear furrows). Recent studies led to revisit the multi-phase history of the Storegga Slide with the identification of an older so-called Nyegga Slide initiated 20,000 years BP at the end of the Last Glacial Maximum (LGM) (Karstens et al., 2023).
3 Materials and methods
High-resolution 2D 120-channel seismic reflection (acquired with two mini-GI guns) and hull-mounted sub-bottom profiler (1.8–5.2 kHz) surveys were conducted during the Hydratech expedition onboard the R/V Le Suroît in 2002 (Nouzé et al., 2002; Nouzé et al., 2004). Three unpublished processed lines crossing the studied Nyegga area (Figure 2A) are shown in Figure 2B, Figure 2C and Figure 3C, including stacked and migrated sections for the multichannel seismics. The high-resolution seismic data have a vertical resolution of 3.5 m and a horizontal resolution of 150 m at the surveyed water depths. The Vicking cruise conducted in 2006 mainly focused on near-seafloor investigations on a seafloor corridor (frame in Figure 1B; Figure 2A) encompassing several pockmarks and their underlying chimneys identified from this Hydratech seismic dataset.
A multibeam survey was conducted onboard the R/V Le Suroît (Hydratech, 2002) with a ship-borne echosounder operated at 30 kHz (Kongsberg EM300), providing a 50-m-pixel bathymetric grid (Nouzé et al., 2002; Nouzé et al., 2004) (Figure 1B; Figure 2A; Figure 4A). High-resolution seabed mapping surveys were carried out during the Vicking cruise (2006) with deployment of the Victor ROV (Nouzé et al., 2007). The ROV was equipped with a Reson 7,125 multibeam echosounder operated at a frequency of 400 kHz. The ROV travelled 20 m above the seafloor at 0.4–0.5 m/s speed with a total swath of 70 m and a line spacing set to 40 m (Figure 5B). Two surveys extended over seafloor areas of ∼1,300 m by 700 m at CNE01 and ∼1,000 m by 500 m at CNE03, and were primarily intended to cover the seabed above the chimneys and immediately adjacent areas (Figure 4A). Detailed seabed maps, gridded with a 0.5-m and 0.1-m-cell-size for bathymetry and seafloor backscatter, respectively, were created using CARAIBES software (©Ifremer) (Figures 5, 6). In addition, unpublished seafloor side-scan-sonar backscatter maps at CNE01, CNE02 and CNE05.6 are presented (Figures 4B,C). These data were acquired during the TTR16 expedition (2006) onboard the R/V Professor Logatchev (Akhmetzhanov et al., 2008) with the MAK-1M system towed at a speed of 1.5-2 knots and operated at a frequency of 100 kHz. With a survey altitude of 50 m, the total swath range of the side-scan sonar data reaches 700 m and the seafloor mosaics can be gridded with a 1-m cell size.
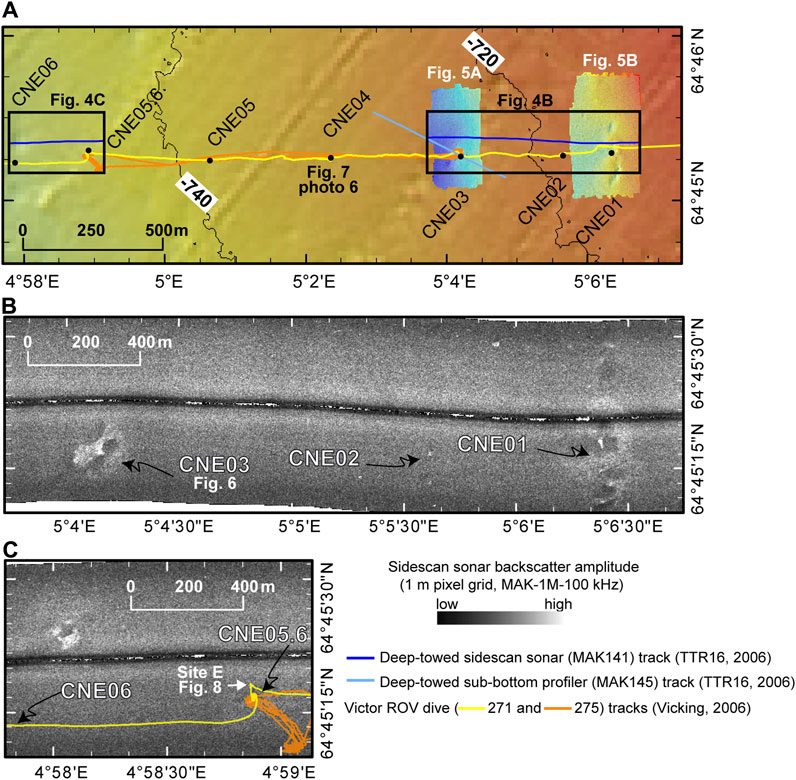
FIGURE 4. (A) Zoom on the regional bathymetry map of the Nyegga study corridor (Figure 2A) limited to the eastern part and comprising the CNE03 and CNE05.6 sites, two main geological structures investigated during the Vicking cruise with Victor ROV for high-resolution seafloor mapping (Figures 5, 6) and/or near-bottom observation and sampling (Figures 7–10). (B) and (C) Deep-towed MAK-1M side-scan sonar records displayed at the same scale along the study corridor (see location in (A)) and showing the highest backscatter amplitudes for structures CNE01, CNE03 and CNE06.
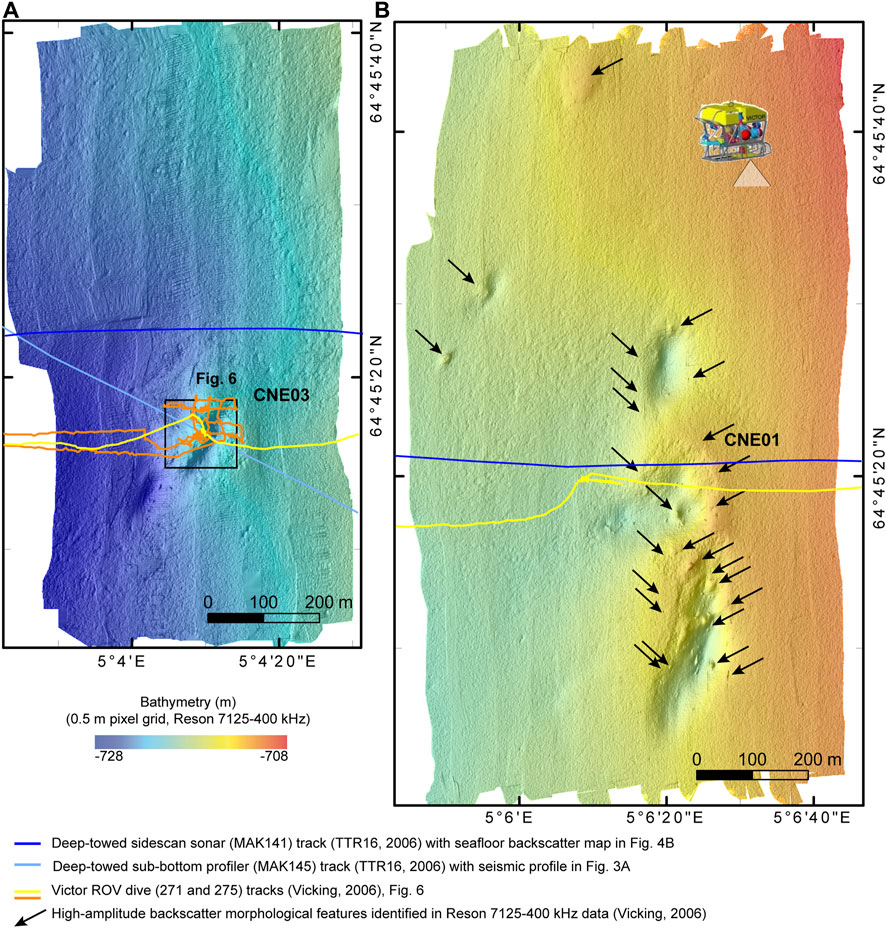
FIGURE 5. Shaded high-resolution bathymetry maps (0.5 m pixel grids) of (A) CNE03 and (B) CNE01 pockmark areas from data acquired with a Reson 7,125 multibeam echosounder operated at 400 kHz and mounted on the Victor ROV (Vicking, 2006) with tracks of the geophysical data presented in Figures 3, 4 and Victor ROV tracks of dives 271 and 275.
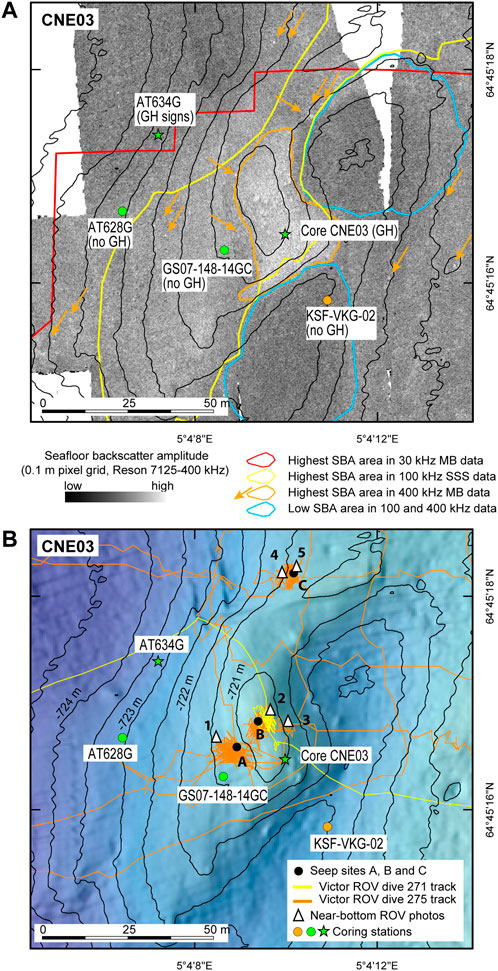
FIGURE 6. High-resolution (A) seafloor backscatter of the central ridge where seepage occurs and surroundings of CNE03 area (see location in Figure 5A). Three distinct contours of the highest Seafloor Backscatter Areas (SBA) based on ship-borne and ROV-mounted MultiBeam (MB) and Side-Scan Sonar (SSS) data are shown. Orange arrows point to small-scale seafloor features of high-amplitude backscatter in high-frequency data (400 kHz). East of the ridge, blue contours delineate two main low SBA areas identified in both 100 and 400 kHz data. (B) Shaded bathymetry map of the same area with 0.5-m-interval isobaths. These seafloor data were acquired with a Reson 7,125 multibeam echosounder operated at 400 kHz and mounted on the Victor ROV (Vicking, 2006). Seepage sites are labelled A, B and C. Locations of Victor ROV photographs (1–5) shown in Figure 7 and gravity cores (AT634G, AT628G, KSF-VKG-02, GS07-148-14GC and Core CNE03) are reported.
A water column single-beam survey was performed during the Vicking expedition using the hull-mounted echosounder of the R/V Pourquoi pas ? (Kongsberg EA600, 38 kHz, 9.6° beam width) to detect gas bubbles escaping from the seafloor (Foucher et al., 2010). At the water depth range of the Nyegga studied area (700–830 m), the footprint of the insonified seafloor is 130 m (Figure 2A).
Geological and biological observations were carried out during two dives of the Victor ROV 6000 in the study area. Dive 271 was a 21-km-long exploratory survey designed to cross pre-identified chimneys along the corridor (Figure 2A). One of the primary objectives of dive 271 was to provide an overview of the current fluid seepage activity at all crossed chimneys, prior to more extensive investigations at the most active sites during dive 275 (Figure 4A; Figure 5A; Figure 6B). In addition to video surveying (Figure 7; Figure 8; Figure 9), the Victor ROV sampled sediment by means of a 0.6-m-long push corer; bottom water with a gas-tight water multi-sampler (Figure 2A; Supplementary Table S1) (Ifremer PEP sampler mounted on the ROV, Olu-Le Roy et al., 2007); and fauna and consolidated rock samples (carbonates, Figure 10) were sampled by means of various suckers and grabs. ROV video records were processed using ADELIE software (©Ifremer), an extension tool for ArcGIS, which allows post-processing of ROV data and georeferencing annotations of faunal counts along dive tracks. Details of the faunal sampling strategy, processing and analysis can be found in Decker et al. (2012) and Decker and Olu (2012).
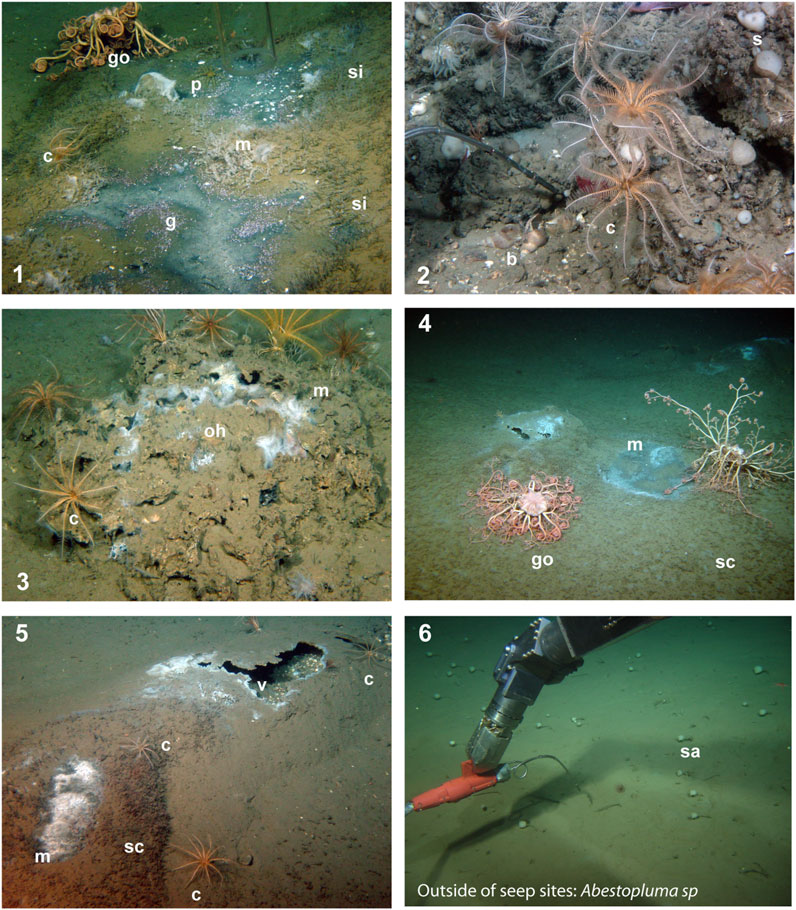
FIGURE 7. Near-bottom seafloor images taken by the Victor ROV (Vicking, 2006) during dives 271 and 275 at CNE03 site (1–5, see locations in Figure 6B) and surroundings (6, CNE4, see location in Figures 2A, 4A). The image 5 corresponds to the area where near-bottom water (275-PEP15) was sampled, following the break of the carbonate crust, with an elevated methane concentration of 9,664 nL/L (Supplementary Table S1). Symbol letters on the photographs: c: comatulids, g: Rissoidae gastropods Alvania sp., b: Buccinidae shells, go: ophiurids Gorgonocephalus sp., m: white microbial filaments, s: sponges (Porifera), sa: sponges Abestopluma sp., si: siboglinids Sclerolinum contortum -sc-(brown curly tubes) and Oligobrachia haakonmosbiensis webbi -oh- (black straight tubes), p: pycnogonids, v: Vesicomyidae bivalves.
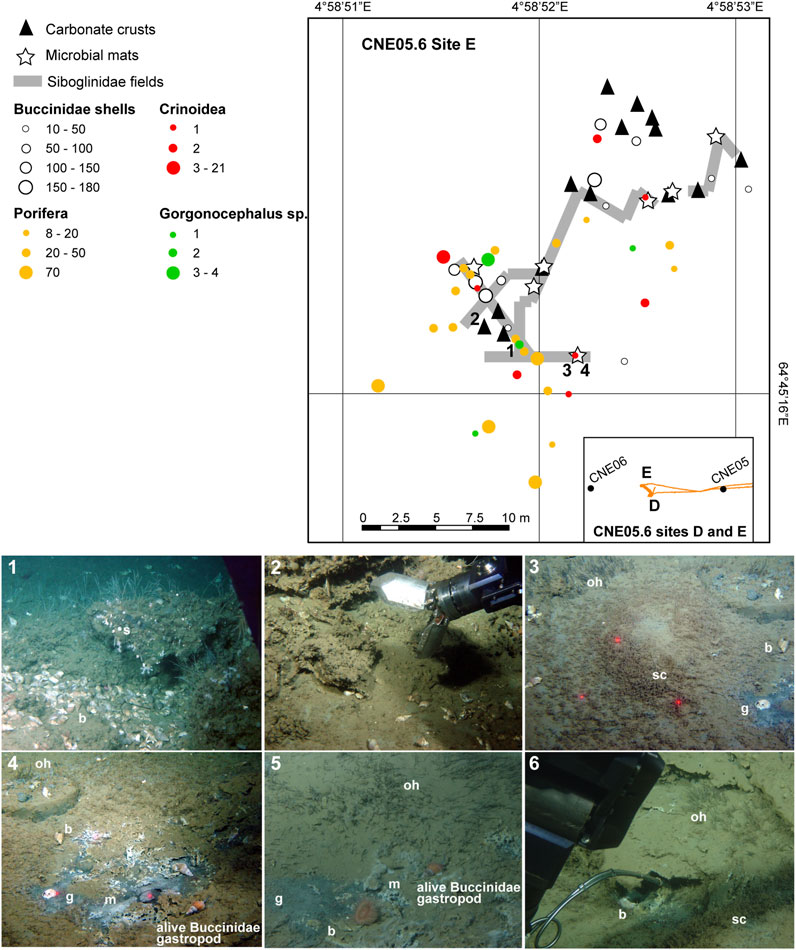
FIGURE 8. Benthic and chemosynthetic macrofauna and microbial mat distributions at CNE05.6-E site based on near-bottom observations performed during the Victor ROV dive 275 (Vicking, 2006) with corresponding images from dives 275 (1–4) and 271 (5–6). The images 5 and 6 correspond to the areas where near-bottom water (271-PEP7 and 271-PEP8, respectively) was sampled and elevated in situ methane concentrations were measured (2,130 and 853 nL/L, respectively) Supplementary Table S1. See the meaning of the letters in the caption of Figure 7.
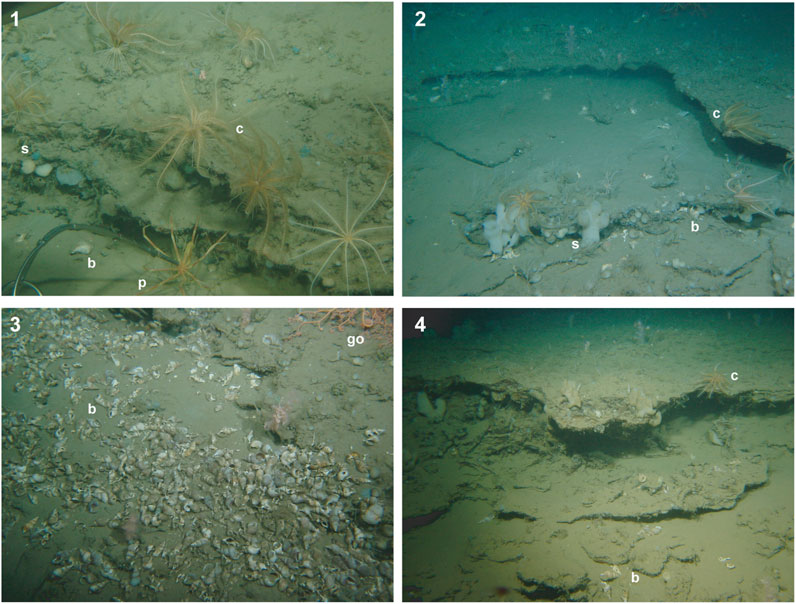
FIGURE 9. Near-bottom seafloor images (1–2 m across) of tabular outcrops of consolidated sediment observed along the study corridor (Victor ROV dives, Vicking 2006; Figure 2A), near CNE02 (photo 1), at CNE05.6 Site E (photo 2), at CNE07 (photo 3), and near CNE14 (photo 4). See the meaning of the letters in the caption of Figure 7. The outcrops comprise distinct horizontal hard layers each a few cm thick. Buccinidae shells have accumulated at the base of the outcrops (photo 3). Supplementary Table S2 for correspondence with analyzed carbonate samples.
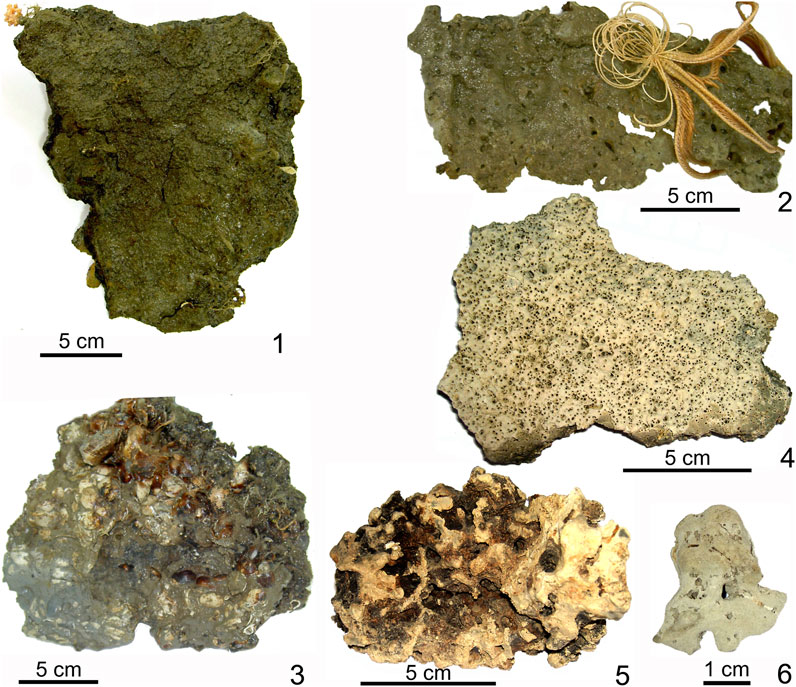
FIGURE 10. Lithofacies of some selected diagenetic crusts from the Nyegga gas chimneys collected by Victor ROV (Vicking, 2006). (1) sample 271-CC1 at CNE02. (2) sample 271-CC3 at CNE05.6 with a crinoid. (3) sample 275-CC2 and (4) sample 275-CC3 at CNE03. (5) sample 275-CC1 and (6) sample 275-CL6 at CNE05.6. Supplementary Table S2 for detailed information.
Bulk mineralogy of carbonate crusts and concretions was obtained by X-ray diffraction combined with estimations of the % weight of total carbonate content to estimate the relative proportions of major mineral components. Scanning Electron Microscope (SEM) observations were performed on selected samples to characterize the morphologies and compositions of crystals as well as the structural relationships between mineral phases (Figure 11). Oxygen and carbon isotopic compositions were measured on bulk carbonate (Figure 12) treated with 100% phosphoric acid at 25°C to obtain CO2. The isotopic compositions are expressed in the conventional δ notation defined as δ = [(Rs/Rr) – 1] x 1,000, where R = 18O/16O or 13C/12C respectively in the sample s and in the reference r. The reference for δ18O and δ13C is the V-PDB (Craig, 1957). The isotopic compositions of carbonates were measured on a dual-inlet isotopic ratio mass spectrometer (DI-IRMS Isogas-Sira 9). The analytical precision 2σ was 0.01‰ and the reproducibility was 0.1‰ for both δ18O and δ13C. Sample location, water depth and the method of collection (at the seabed or in core) are indicated in Supplementary Table S2. In addition, Accelerator Mass Spectrometry (AMS) radiocarbon dating was conducted on selected Vesicomyid shells (Figure 13) at the LMC14 laboratory (CEA Saclay). Prior to analysis, the material was cleaned by sand abrasion followed by leaching for 15’ in 0.01N nitric acid. The calibration of radiocarbon dates of these shells was based on the Calib8.1.0 tool (revision of Stuiver and Reimer, 1993) using the Marine20 calibration curve (Heaton et al., 2020). Calibrated radiocarbon ages from cited works were recalculated using the same procedure for coherence (cal yr BP with 2σ ranges). All calibrated ages of the post-LGM period are maximum possible ages, considering neither the effect of local reservoir (for foraminifers and shells, Heaton et al., 2023) nor the difference in water masses between the atmosphere-water interface and the sea bottom (for shells).
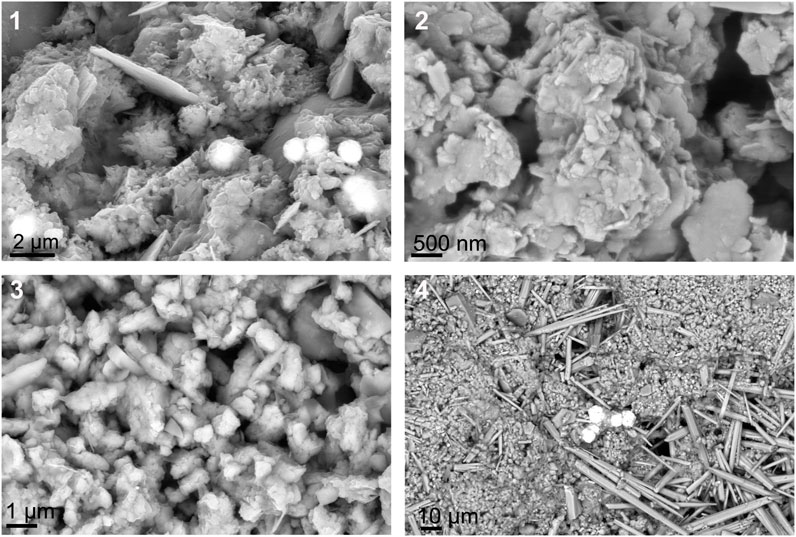
FIGURE 11. SEM photographs of selected methane-related carbonates collected by Victor ROV and recovered from gravity coring (Vicking, 2006). (1) Sample 271-CL6 (CNE05.6): aggregates of Mg-calcite crystals; framboids of pyrite are clearly distinct by their high backscatter intensity. Scale bar = 2 μm; (2) Sample 275-CC3 (CNE03): aggregates of platy euhedral crystals of Mg-calcite. Scale bar = 1 μm; (3) Sample 275-CC3 (CNE03): aggregates of very fine-grained Mg-calcite crystals. Scale bar = 500 nm; (4) Sample collected in the gravity core KSF-VKG-02–130 cm (site CNE03, see location in Figure 2A; Figure 3A; Figure 6) (Figure 13): association of Mg-calcite aggregates, acicular aragonite and framboids of pyrite. Scale bar = 10 µm. Supplementary Table S2 for detailed information.
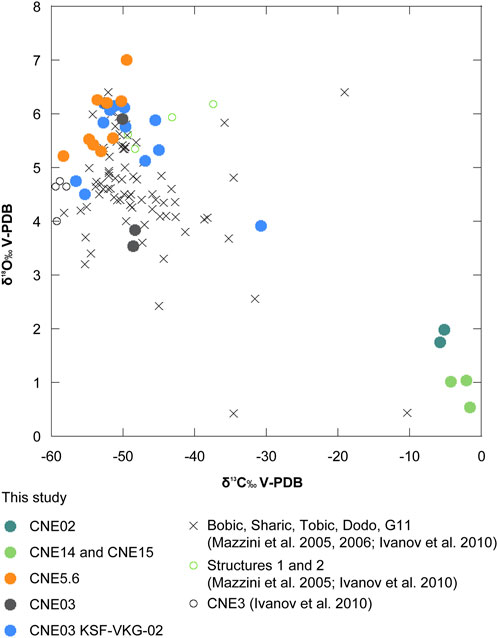
FIGURE 12. Oxygen and carbon isotopic compositions of carbonate crusts and concretions and consolidated sediment sampled at the Nyegga chimneys CNE02, CNE03, CNE05.6, CNE14 and CNE15 (see location in Figure 2A). See Supplementary Table S2 for detailed information. Published isotopic compositions of authigenic carbonate crusts are also reported for 85 samples collected at the following Nyegga pockmark sites: Bobic, Sharic, Tobic, Dodo, G11, CNE03 (see location in Figure 1B) and ‘Structures 1 and 2’ close to CNE14 (for corresponding core locations see grey dots in Figures 1B, 2A) (Mazzini et al., 2005; Mazzini et al., 2006; Ivanov et al., 2010).
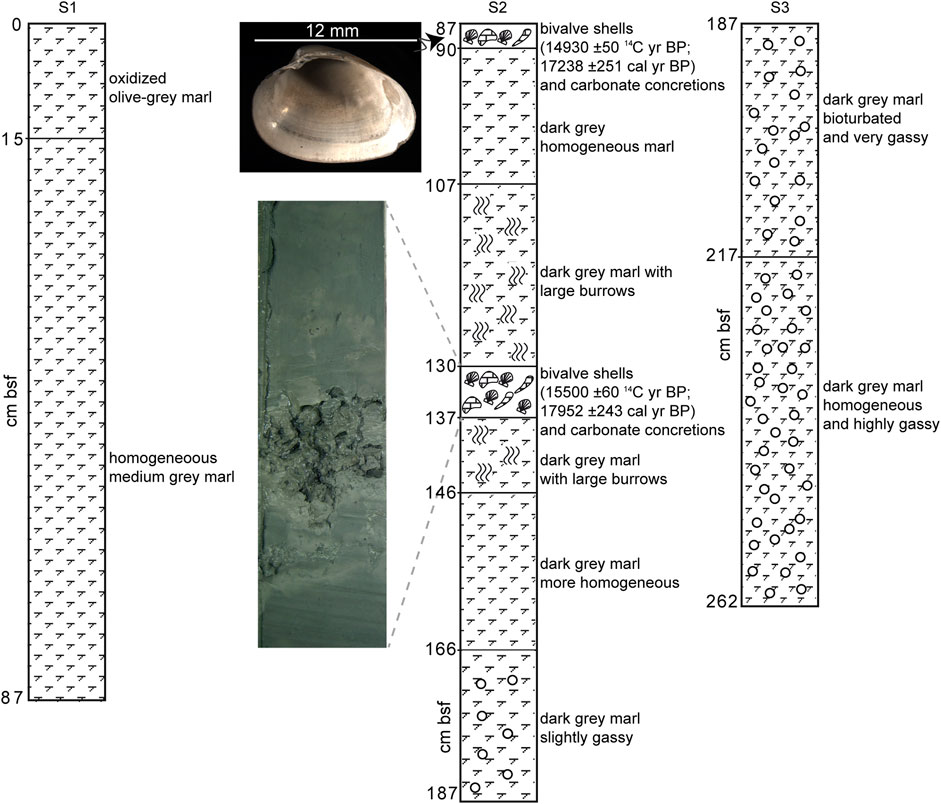
FIGURE 13. Visual lithological description of the 2.62-m-long core KSF-VKG-02 (https://doi.org/10.58006/bfbgx-87535) taken at CNE03 site (see location in Figure 2A; Figure 3A; Figure 6) which contains H2S-rich sediment. The top of the core is characterized by relatively homogeneous marl in comparison with underlying sediments (S1). The second section (S2) exhibits dark grey marl with intercalations of two beds of bivalve shells at 0.87–0.90 and 1.30–1.37 mbsf. Photographs of the 1.30–1.37-mbsf interval showing carbonate concretions and bivalves (bottom) and a shell recovered from the 0.87–0.90-mbsf interval, sampled at 0.92 mbsf and identified as Isorropodon nyeggaensis (Krylova et al., 2011) (top). From 1.87 mbsf to the bottom of the core (2.62 mbsf), sediment is increasingly disturbed by gas (S3). (S = section; mbsf = meters below seafloor).
In addition to seabed ROV investigations, a gravity core was taken while on the R/V Pourquoi pas ? at one location on CNE03 (KSF-VKG-02 coring station, N 64°45.263, E 05°4.1806, depth: 729 m, Figure 2A; Figure 3A; Figure 6). Penetration of the corer was approximately 5 m, with recovery of a 2.6-m-long sediment core. The core was split and described onboard (Figure 13). Three thermometers attached to outriggers on the lance measured sediment temperatures at 1.33, 3.12 and 4.62 m below the seafloor (Figure 14). Chemical analysis of pore water was performed every 20–30 cm along the recovered core by ionic chromatography using a Dionex ICS-2000 instrument (Figure 14). The estimated accuracy on the pore-water chemistry measurements is within ±3% of the mole fraction. Methane concentration was determined by headspace gas chromatography (Donval et al., 2008) with an accuracy of ±5%.
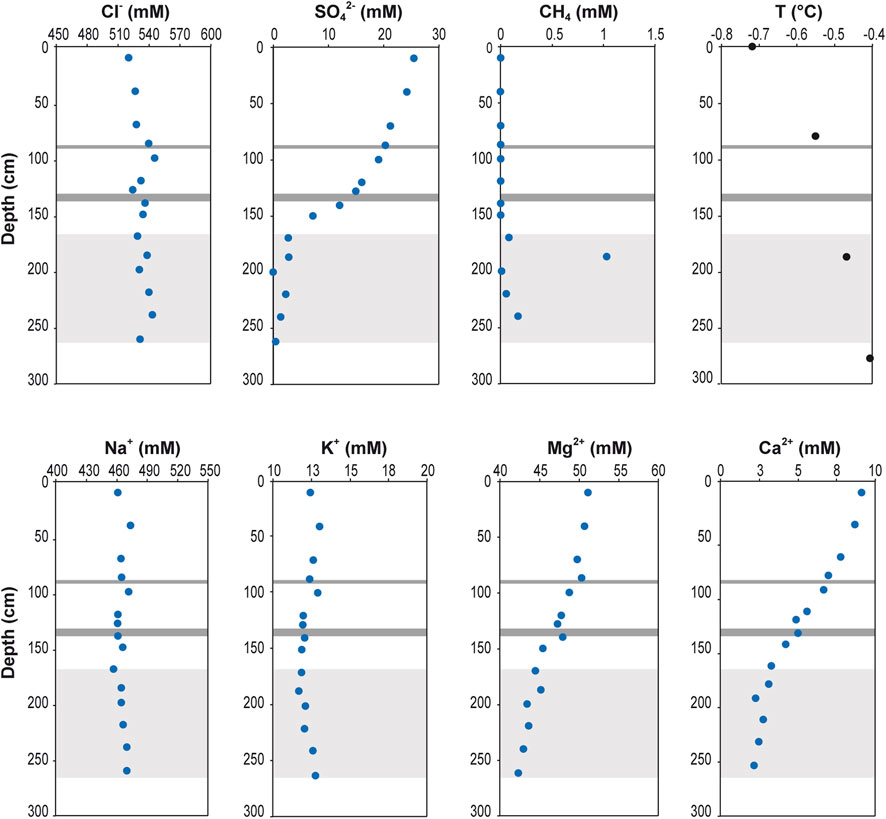
FIGURE 14. Pore-water geochemical profiles from laboratory measurements on core KSF-VKG-02 (https://doi.org/10.58006/bfbgx-87535) at CNE03 site (see location in Figure 2A; Figure 3A; Figure 6). Also shown is the temperature profile from in situ temperature data measured at 1.33, 3.12 and 4.62 mbsf. The dark grey intervals correspond to the levels containing bivalve shells and methane-derived authigenic carbonates (Figure 13). The light grey interval corresponds to gassy sediment.
4 Results
4.1 Stratigraphy, structure and evidence of free gas and gas hydrate from seismic data
Nearly all the chimneys of the investigated part of the Nyegga area (Figure 2A) exhibit upwarping of strata towards their centers, which are seismically incoherent (Figure 2B; Figure 2C; Figure 3). The cause of this upwarping is twofold. In the shallowest part of the section, including the seabed, upwarping is caused by deformation of the strata, typically above the Ny7 horizon, one of the seven seismic boundaries Ny that subdivide the Upper Naust unit (corresponding to the T unit in Figure 2C). The 5 kHz profiler section across the CNE03 pockmark (Figure 3A) shows that the eastern side of the chimney has been upfaulted. However, the displacement of this fault diminishes to zero to both the north and south of the pockmark, and it appears that the faulting was associated with the emplacement of the chimney. Deeper in the section, velocity pull-up, caused by the presence of material with high-seismic velocity (Figure 3C), inferred to be hydrates (Plaza-Faverola et al., 2010), in the centers of the chimneys, contributes to the apparent upward bending shown by seismic sections that have not been correctly depth converted. Seismic data with large offset between source and receiver show that at depths greater than 250 mbsf, the strata beneath CNE03 are not upwarped and do not show a large degree of incoherence (Plaza-Faverola et al., 2010).
It is probable that depth extent of many of the chimneys, shown by single-channel and short-offset multichannel seismic sections, is not as great as it appears: the deeper part of the seismic images of the chimneys is represented by so-called seismic transparency, which is, in fact, a seismic shadow caused by reflection and scattering of the seismic energy in the upper parts of the chimneys, and is not caused by the presence of gas-bearing sediments. With wide-offset seismic data, the rays imaging the deeper parts of the chimneys do not pass through the upper parts of the chimneys and so are not subject to the same loss of energy caused by scattering and absorption in the heterogeneous upper parts of the chimneys. However, it is clear that strata around the chimney deep beneath CNE12 and CNE13 are deformed where they lie outside the zone obscured by seismic scattering in the upper part of the chimney (e.g., at 1.7 s TWT in Figure 2C).
The strong negative polarity reflector at the top of the U unit of the Naust formation (about 1.3 s TWT at CNE01, CNE02 and CNE03, Figure 3C) locally marks the presence beneath it of a layer with seismic velocity lower than that of the layer above by about 100 m/s from the chimney center (Plaza-Faverola et al., 2010). The velocity reduction is very likely caused by the presence of a small amount of free gas. The bottom-simulating seismic reflector that follows the base of the methane-hydrate stability zone and marks the transition from sediment containing hydrate, above, to sediment containing free gas, below, is not observed in most of the study area. The BSR, which is seismically visible further downslope, only occurs in units with sufficiently high permeability to be invaded by gas and so it is discontinuous and stratigraphically controlled (e.g., Bouriak et al., 2003; Bünz et al., 2003; Westbrook et al., 2008). The limits of the BSR observed on seismic sections in this part of the Nyegga slope are shown in Figure 1B. In the westernmost part of the study area, the BSR locally occurs at 1.36 s TWT (Figure 2C).
In addition to the large chimneys with widths of a few hundred meters, there are many other smaller conduits of fluid flow, some of which lie beneath pockmarks CNE02, CNE04, CNE05, CNE07, CNE08, CNE09, CNE10 and CNE12 (Figure 2B). The deep-towed 5 kHz profiler and the hull-mounted sub-bottom profiler acoustically imaged these conduits. Examples of these narrow, near-vertical features are shown in Figures 3A, B as narrow zones of very low amplitude and low coherence. This could be caused by the acoustic shadows of shallow features with high acoustic impedance, such as deposits of carbonate, but the diffractions from the edges of reflectors that are cut by the conduits show that some, at least, penetrate to more than 50 mbsf (Figure 3A). The absence of strong reflections from the tops of many of these zones also makes it more likely that they are zones of changed properties in the sediments rather than acoustic shadows. There are a large number of these conduits, of which about half of those investigated by the ROV during the Vicking expedition show evidence of active or past fluid flow, in the form of carbonate crusts, microbial mats and localized colonies of fauna (near-bottom photos, Figures 7–9). Judging from their frequent occurrence on the seismic records, there are at least ten times as many of these smaller conduits as chimneys.
4.2 Seabed observations from sonars and dives
4.2.1 Pockmark morphology and seafloor backscatter signature
The morphology of pockmarks remains hardly detectable on regional bathymetric maps except for the largest structures (Figures 1B, 2A) but is well-displayed on the high-resolution maps that were produced for the two sites CNE01 and CNE03 from ROV-mounted multibeam echosounder data (Figures 5, 6B). At a regional scale, the bathymetry at CNE01 and CNE03 is dominated by a marked deepening of the seabed westwards (topographic gradient of ca. 10 m per 500 m). Superimposed on this gradient, the high-resolution bathymetric maps show that both CNE01 and CNE03 display in their central parts NNE-SSW trending elongated depressions fringed by small-relief ridges (Figures 5, 6B). CNE03 displays a single, central depression, whereas CNE01 has a greater spatial expression and displays a more complex depression-ridge system.
CNE01 and CNE03 are clearly identified on the high-resolution seafloor backscatter maps, both from the multibeam (Figures 5B, 6A) and side-scan MAK-1M line (Figure 4B) (Akhmetzhanov et al., 2008). Ridges are displayed as high-amplitude seafloor-backscatter features that may relate to the occurrence of more consolidated surface sediments on ridges with respect to the surrounding seafloor or the occurrence of carbonate crusts, which was demonstrated locally by dive observations (Figure 7, photos 1–3). The relief amplitude across the two pockmarks CNE01 and CNE03, from depressions to ridges, is <5 m. The highest-frequency backscatter data provide information on the subsurface, which can be easily correlated to near-bottom ROV observations, while the lowest-frequency data provide information on subsurface volume insonified by a higher penetration signal. Interestingly, the spatial extent of the high-backscatter seafloor at CNE03 increases with signal penetration (corresponding to 400, 100 and 30 kHz signal, Figure 6A). This observation could be related to a more widespread seepage-related activity in the past compared to present-day activity, which is restricted to ridge summits and its uppermost flanks. Depressions are shown as low-amplitude seafloor-backscatter features (Figures 5B, 6A) presumably related to their soft hemipelagic sediment infilling. This is consistent with the uppermost 87-cm-thick homogeneous marl layer recovered from core KSF-VKG-02 (Figure 13).
At other chimney sites of the study area, high-resolution bathymetric data were not collected, but ROV-based water depths along the track indicate the presence of pockmarks up to a few hundreds of meters wide and a few meters deep (e.g., ∼5–6 m at CNE02, CNE10 and CNE13). CNE05.6 may be similar in morphology to CNE03, with a ridge adjacent to a depression with a depth difference of ∼3 m.
4.2.2 Methane seeping sites and chemosynthetic fauna (CNE03 and CNE05.6)
Potential gas bubbles escaping from the seafloor were neither identified in the single-beam records, nor observed during ROV dives. Instead, methane seepage is inferred from near-bottom biological observations and water-sample measurements conducted during these dives. In-situ near-bottom methane enrichments ranges from 105 to 2,130 nL/L (see details in Supplementary Table S1 with cross-references to near-bottom photos of the sampling areas). The investigated Nyegga area appears to be characterized by focused fluid flow that transports dissolved methane from bottom sediments into the water column rather than through free gas escapes. No pingoes were observed at the seafloor along the ROV tracks from CNE01 to CNE17 sites as described at the Nyegga G11 site (located 14 km south-east of CNE03, Figure 1B) and suspected to be hydrate-related pingoes (Hovland and Svensen, 2006). The G11 site was surveyed during ROV dive 272. There was no evidence of gas hydrates in the subsurface. Only small meter-scale domes recovered by dense pogonophorans (Vanreusel et al., 2009) were observed with uppermost soft muddy sediments (Supplementary Figure S1). Similar pingo structures were reported at Tobic and Sharic sites (located 12 km south-east of CNE03, Figure 1B) by Ivanov et al. (2010).
CNE03. Seeps were found at three distinct sites (A, B, C) on the summit of the ridge and at the uppermost flanks at CNE03 (Figures 6, 7). Seepage site A measures a few square meters (based on the lateral extent on the seabed of the Siboglinidae fields) and displays two dark-grey spots, each approximately 0.5 m across, both located within a bush of densely distributed Siboglinidae polychaetes (Figure 7, photo 1). A push core taken from one spot recovered dark-grey reduced sediment overlain by whitish bacterial filaments. The biological habitat zonation at site A is of the type described by Decker et al. (2012) as for other pockmarks of the Nyegga area. It is characterized by an inner area of dark-grey sediment surrounded by a rim of small (a few mm in size) reddish Rissoidae gastropods (Alvania sp.), microbial filaments, Capitellidae polychaetes and outer fields of Siboglinidae polychaetes (Oligobrachia haakonmobiensis, i. e., webbi and Sclerolinum contortum) (Meunier et al., 2010). This specific zonation of chemosynthetic communities has previously been identified at the Håkon Mosby mud volcano (Gebruk et al., 2003; Jerosch et al., 2007) where it is associated with drastic changes in the macrofauna (Decker et al., 2012) and interpreted to reflect a decreasing strength of methane seepage away from the seep center (de Beer et al., 2006). Seepage site B is distinctly characterized by the occurrence of several small-sized (<1 m) carbonate build-ups (Figure 7, photos 2 and 3) scattered over the seabed. The carbonate rocks that form them are highly porous. Abundant Buccinidae gastropod shells (Buccinum sp., A. Warén, pers. com.) are tightly intermixed with the carbonate matrix and lie on the sediment at the base of the build-ups at CNE03 and also at other CNE sites (e.g., CNE07, photo 3 in Figure 9). A few Vesicomyidae bivalves (empty shells, photo 5 in Figure 7) were also sampled and were described as a new species, Isorropodon nyeggaensis (Krylova et al., 2011) recovered from core samples taken at the G11 Nyegga pockmark (see location in Figure 1B) (Ivanov et al., 2010). Small holes pierce the carbonate surface with rims of white bacterial filamentous material (Figure 7, photo 3). Seepage site C shows seeps with a quite distinct type of carbonate structure, herein named soufflé-type seeps after their puffed shape. At a soufflé-type seep, a thin carbonate crust has developed above a seep but is currently separated from the sediment underneath by 10–20 cm of seawater trapped between the sediment and the carbonate crust (Figure 7; photos 4 and 5). Several soufflé-type seeps, 2–3 m long, were observed along the ROV track at site C. Significant methane anomalies of 9,664 nL/L compared to a background value of about 26 nL/L were measured in the seawater 5 cm above the sediment inside a soufflé after the crust was broken apart (Figure 7, photo 5). Abundant Siboglinidae polychaetes protruding dark-grey sediment were observed. This methane concentration is by far the highest concentration measured during the two ROV dives (Supplementary Table S1) and is possibly due to the accumulation of dissolved methane trapped within the puffed carbonate crust.
CNE05.6. Site CNE05.6 was named after its location between pre-identified chimney sites CNE05 and CNE06 (Figures 2, 4). Two main seeping sites were discovered, located ∼200 m apart, one in a depression (E) and the other on a possible adjacent ridge (D) (Figure 8). At seepage site E (Figure 8), carbonate constructions range from thick crusts and chaotic blocks (<1 m) observed in the western part of the site (Figure 8, photos 1 and 2) to thin crust pavements (a few cm thick) mostly observed in its eastern part (Figure 8, photos 3 and 4). A small elongated mound (<10 m long, 1–2 m high) in this eastern part appears to concentrate the seepage activity identified during the ROV inspection by the presence of several spots of dark-grey sediment, up to 0.3 m across for the largest ones, with many showing whitish bacterial rims (Figure 8, photos 3 and 4). Curled brown and longer black Siboglinidae species, Sclerolinum contortum and Oligobrachia haakonmosbiensis webbi (Smirnov, 2000) respectively, colonize the mound (Meunier et al., 2010). The biological zonation at CNE05.6 (Figure 8, photo 4) is similar to that observed at CNE03 (Figure 7, photo 1). A water sample taken 10 cm above a dark-grey spot (photo 5 in Figure 8) and a second sample taken in a niche of gastropods and bacterial mats under the crust (photo 6 in Figure 8), determined significant methane anomalies of 2,130 nL/L and 853 nL/L, respectively, relative to a background value of about 26 nL/L (Supplementary Table S1). These measured values indicate current active methane seepage. Empty shells of Buccinidae gastropods were observed at several locations in CNE05.6, locally with a distribution of up to ∼50 shells/m2 (Figure 8, photo 1) and with a few living ones (photos 4 and 5 in Figure 8). Vesicomyid shells (Isorropodon nyeggaensis n. sp.) were sampled near the seeps.
4.2.3 Outcrops of consolidated sediment crusts and carbonates and benthic background fauna
Consolidated sediment outcrops were observed at locations in close proximity to pre-identified chimney sites (CNE02, 03, 07, 09, 10), but also between pre-identified chimney sites such as at CNE05.6 (site E) and at several locations in the western part of the study corridor between CNE10 and CNE17 (see location of the CNE site in Figure 2). They form large tabular platforms that extend laterally over distances of up to 20 m, rise up to 1.0 m above the seabed, and terminate at sharp edges cutting through distinct sub-horizontal layers (Figure 9). Morphologies of these outcrops make them look quite distinct from the chaotic-shaped authigenic massive carbonates observed at seeping sites of CNE03 and CNE05.6 as reported above (Figures 7, 8). Authigenic carbonates also occur as cm to tens of cm thick crusts and as cm-size concretions dispersed within the sediments.
The sedimentary matrix of recovered consolidated sediment mostly consists of silty sand and silty clay (Supplementary Table S2; Figure 10). At CNE02, CNE14 and CNE15, it is mostly cemented by iron and manganese oxides and has a very low carbonate content (3–4.5 weight %); the carbonate mineralogy consists of mixtures of calcite, dolomite and possibly siderite. Differently, the grey carbonate crusts and concretions from CNE01, CNE03 and CNE05.6 contain more than 56 weight percent of total carbonate, except for one crust cementing bivalve shells (271-CC2) with about 23 weight percent of total carbonate. Their carbonate mineralogy mostly consists of aragonite, calcite (from stoichiometry to Mg-calcite with up to 16-mol percent MgCO3) and dolomite that is more abundant in the buried concretions than in the sub-surface crusts.
The microfacies of the authigenic carbonates display various crystal habits; acicular and prismatic crystals of aragonite form palisadic cements and geodes within cavities and pores (Figure 11). Calcite may occur as very small aggregates (100–200 nm), euhedral platy crystals or fine-grained (micron sized) aggregates of subhedral crystals. Framboids of pyrite frequently occur in association with the carbonate.
The oxygen and carbon isotopic compositions of the carbonate fraction of the consolidated sediment (indurated sediment), carbonate crusts and concretions are distributed into two distinct groups (Figure 12; Supplementary Table S2). The dark-brown crusts of CNE02, CNE14 and CNE15 are characterized by slightly positive δ18O values (+0.53 to +1.98‰ V-PDB) and moderately low δ13C values (−5.72 to −1.57‰ V-PDB) of carbonate. Differently, the carbonate crusts and concretions from CNE03 and CNE05.6 exhibit highly positive δ18O values (+3.53 to +7.00‰ V-PDB) and very low δ13C values (−58.34 to −30.71‰ V-PDB).
Both seabed authigenic carbonate crusts at seepage sites and outcrops of consolidated sediment are colonized by typical background fauna, dominated by suspension feeders (e.g., alcyonarians, hydrozoans, sponges) (Figures 7–9). One demosponge (Crellomima imparidens), two calcareous sponges (Sycettusa n. sp. and Sycon abyssale) and several encrusting sponges (Hymedesmia basispinosa, H. grandis and H. truncata; A. Plotktin, pers. com.) were sampled, as well as comatulids identified as Poliometra proxila (M. Elaume, pers. com.). We observed stalked Chaldorhizidae sponges (Abestopluma furcata and Abestopluma lycopodium, A. Plotkin, pers. com.) in abundance (up to 10 ind./m2), and stalked pennatulacean (Umbellula sp.) with more than 1-m-tall stems (N. Améziane, pers. com.), along the whole ROV transect, in soft sediment and on hard ground. Very large ophiurids (Gorgonocephalus sp.), up to several tens of centimeters in size, were found on crusts as well as on sediment near the seepage sites (e.g., photos 1 and 4 in Figure 7). Nevertheless, stable isotope analyses did not reveal any nutritional link with a chemosynthesis-based production (Decker and Olu, 2012). Large pycnogonids (e.g., photos 1 in Figures 7, 9), rare asteroids and rays were also observed.
4.3 Subsurface information at surrounding seepage sites (CNE03)
Core description and dating. Core KSF-VKG-02 is located within a depression with no geophysical indication of seep activity and 40 m from the seeping sites discovered at the summit of a ridge and its uppermost flank (Figure 6). The upper 15 cm sedimentary layer consists of oxidized olive-grey marl (Figure 13). This marl layer is underlain by homogeneous medium grey marl down to 87 cm where a 3-cm-thick layer contains abundant bivalve shells of the Vesicomyidae family. The underlying sediments are dark grey marls with alternating homogeneous and intensively burrowed layers; in the 130–137 cm interval, there is another layer with abundant vesicomyids shells associated with cm-sized medium-grey carbonate concretions. Below around 170 cm, the sediment becomes increasingly gassy with a strong H2S smell indicative of active sulfate reduction. Like those sampled at the seabed in the seep areas, the vesicomyids shells found in the two layers of the core were identified as the same species of Isorropodon nyeggaensis (Krylova et al., 2011) (Figure 13). Their small size (from 8.0 to 18.2 mm) is in the range of those sampled at the other Nyegga pockmarks, namely, G11 and Tobic (Figure 1B) (12.7–18.3 mm) (Krylova et al., 2011). Radiocarbon dating by AMS of the bivalve shells gives ages of 14,930 ±50 14C yr BP and 15,500 ±60 14C yr BP (17,238± 251 and 17,952 ± 243 cal yr BP) for the two layers at 87/92 cm and 130/133.5 cm, respectively. The δ13C values of the carbonate of the bivalve shells (−1.7 and −1.9‰) indicate that there was no contribution of methane during the biomineralization process.
Pore water chemistry. The chloride profile exhibits little variation in concentration, apart from a slight deviation to higher concentration at a sub-bottom depth of about 1 m, with no curvature suggestive of fluid advection (Figure 14). The sulfate profile exhibits a concentration decrease from an average sea bottom value of about 27 mM to zero at about 2 m. Calcium and magnesium profiles display similarities to the sulfate profile. The methane and sulfate profiles suggest an Anaerobic Oxidation of Methane (AOM) zone at a sub-bottom depth of about 2 m (with a peak of methane concentration slightly exceeding 1 mM), an intermediate value between the 5 m depth measured by Paull et al. (2008) as the background value of the sulfate methane transition outside Nyegga pockmarks and a close to zero value (seabed) at seeping sites.
Thermal measurements. Three thermal probes attached to the pipe of the corer at KSF-VKG-02 measured a temperature gradient of 0.044 C/m between estimated penetration depths of 1.33 m and 4.62 m (Figure 14). The bottom seawater temperature extrapolated from this gradient is −0.608°C whereas the measured one was −0.719°C, which suggests possible bottom seawater temperature fluctuations at the coring site and an associated occurrence of thermal transients in the upper sediment that may induce uncertainty in the interpretation of the measured temperature gradient of 0.044 C/m as representative of the thermal regime at depth.
5 Discussion
5.1 Methane-derived authigenic carbonate and consolidated sediment crust formation
The crusts from chimneys CNE02, CNE03, CNE05.6, CNE14 and CNE15 (Supplementary Table S2; Figure 12) display marked differences in mineralogy and isotopic values of the carbonate fraction. There are two groups of crusts that have clearly precipitated in different environmental conditions: 1) Crusts with a mainly diagenetically formed carbonate fraction and (2) crusts with a carbonate fraction predominantly formed by foraminifers and coccoliths.
In crusts from CNE03 and CNE05.6, the carbonate fraction is mostly diagenetic with mixtures of aragonite, Mg-calcite and dolomite. For the present-day bottom water conditions at these sites (t = −0.8°C; δ18O = +0.14‰ V-SMOW; unpublished data C. Pierre), the equilibrium δ18O values of carbonates would be +3.56‰ for calcite, +4.52 for Mg-calcite, +4.96‰ for aragonite and +7.30‰ for dolomite, using the equations of Tarutani et al. (1969), Fritz and Smith (1970), Grossman and Ku (1986) and Kim and O'Neil (1997). The δ18O values of the diagenetic carbonates from Nyegga chimneys (+3.53 to +7.00‰ V-PDB) are consistent with the range of these equilibrium values, indicating that they were precipitated at conditions similar to those of present-day bottom water. The δ18O enrichment in authigenic carbonates could also be partly attributed to the seepage of 18O-rich water issued from the decomposition of massive gas hydrate accumulation at depth in the gas chimneys (Ussler and Paull, 1995). The very low δ13C values of the carbonates (down to −58‰) clearly indicate that the major source of carbon was methane issued from the venting fluids, and converted to HCO3− during microbial anaerobic oxidation; AOM coupled with sulfate reduction is evidenced by the close association of carbonate and pyrite. Similar ranges of very low δ13C values (down to −59‰) were measured by Mazzini et al. (2005), Mazzini et al. (2006) and Ivanov et al. (2010) on 85 crusts from Nyegga pockmark areas including four samples collected at CNE03 and four others collected a few kilometers from CNE14 (Ivanov et al., 2010) (Figure 12). Only two samples have higher δ13C values of −19 and −10‰. The δ13C values of methane analyzed from cores taken at Nyegga pockmarks and the dry composition of gas indicate a biogenic origin, with, for example, at CNE03 the δ13C values of methane ranging from −82‰ to −68‰ (Ivanov et al., 2010). Although thermogenic sources may be present in depth, there is no geochemical evidence so far of a thermogenic methane contribution in the subsurface of the studied Nyegga pockmarks (Ivanov et al., 2010). During AOM, the lighter 12C isotope is preferentially incorporated into the produced CO2 with a fractionation factor of 1.0088 ± 0.0013 (Whiticar and Faber, 1986; Alperin et al., 1988; Whiticar, 1999), giving an average δ13C value of −88‰ for the CO2 issued from AOM at CNE03; considering an enrichment factor of −14.86‰ between CO2 and calcite (Bottinga, 1969) at seafloor temperature (t = −0.8°C), the average δ13C value of “pure” methane-derived carbonate would be −73‰. The δ13C values measured in the diagenetic carbonates from the Nyegga chimneys (from −58‰ to −31‰) are thus much higher (by 15‰ and 42‰ respectively) than this calculated value. The relative 13C enrichment in carbonate could indicate a mixing of methane-derived bicarbonate with another 13C-rich DIC source, possibly bottom seawater (δ13C = +1.1‰; Kroopnick, 1980). Consequently, mass balance calculation (δ13C authigenic carbonate = [-73 * f] + [3.1 * (1-f)] where f corresponds to the fraction of pure methane-derived carbonate and (1-f) corresponds to the fraction of carbonate derived from seawater DIC using an enrichment factor of 2‰ between carbonate and DIC) gives an estimation between 67% and 80% for the contribution of oxidized methane to authigenic carbonate formation. This estimation appears unrealistic because the DIC concentration (∼2 mM) of seawater is less than 10% compared to the high DIC concentrations (>20 mM) produced by AOM (Paull et al., 2008). A more probable source of 13C-rich DIC could be provided by high fluxes of fluids with high alkalinities issued from the methanogenic zone (Chatterjee et al., 2011). Alternatively, the carbon isotopic shift could be explained by the reservoir effect during AOM when residual CH4 becomes progressively enriched in 13C due to microbial CH4 consumption (Whiticar, 1999); the residual fraction f of CH4 calculated using the Rayleigh distillation equation (δ – δ0 = ε ln f, where εCH4-CO2 ∼ 9) would be between 19% and 6%. These estimations are reasonable considering that large fractions of oxidized methane are trapped as authigenic carbonate precipitating within the sediment whereas the remaining methane may escape through the seafloor toward the water column. Similar high methane turnover rates (93%) were estimated in the siboglinid tubeworm habitat at Håkon Mosby mud volcano (Felden et al., 2010).
In the crusts sampled at CNE02, CNE14 and CNE15, the carbonate fraction corresponds to planktonic foraminifers and coccoliths mixed with minor amounts of diagenetic carbonates (dolomite and possibly siderite). The δ13C values ranging from −5.72 to −1.57‰ indicate that there was no contribution of carbon from methane oxidation during the formation of these crusts that may thus be considered as hard grounds probably formed when bottom waters were poorly ventilated, a situation prevailing during glacial times (Keigwin and Boyle, 2008). These carbonates, which differ significantly from authigenic carbonates associated with methane release in their mineral and isotopic signature and formation, deserve further investigation (mapping, sampling and analyses).
5.2 Present-day versus past seepage activity
Present-day seepage activity. Our observations point to present-day seepage activity through the seabed in two areas of the Nyegga study corridor (Figure 2), CNE03 (Figure 7) and CNE05.6 (Figure 8). However, we do not exclude present-day seepage activity elsewhere and particularly at the CNE01 site which presents similar acoustic sediment and seafloor signatures to CNE03 and CNE05.6. Unfortunately, the ROV was unable to operate effectively due to a positioning problem encountered at the beginning of dive 271 (Figure 2A). Consequently, most of the targeted areas at CNE01 were uninvestigated, including the southern ridge and adjacent depressions where several morphostructures resemble those of authigenic carbonates (Figure 5B).
At both CNE03 and CNE05.6 sites, several areas of reduced dark grey sediment surrounded by chemosynthetic fauna covering a few square meters, and in situ methane anomalies in the bottom seawater (up to 2,130 nL/L), attest to present-day upward advection through the seabed of pore water containing dissolved methane. Although direct measurements of the flow rates were not obtained, it was noted that biological zonation at the active sites presents similarities to seepage sites along the Norwegian margin, such as the Håkon Mosby mud volcano in the Barents Sea (Decker et al., 2012; Decker and Olu, 2012), where oxygen and sulfide fluxes were calculated based on microprofile measurements indicating pore water seepage rates of up to a few meters per year (de Beer et al., 2006). The presence of filamentous bacteria and siboglinid tubeworms, both depending on sulphide availability, suggests that this compound is produced at CNE03 and CNE05.6 in the subsurface sediments, from anaerobic methane oxidation, with a gradient from the central area of reduced sediments and microbial mats, to the external zones colonized by the siboglinids, as described for the other sites of the Norwegian margin.
Spatial heterogeneity. The pore-water chloride profile located only 40 m from the seepage sites, shows no evidence of upward advective flow (Figure 14). The methane and sulfate profiles suggest an AOM zone at a sub-bottom depth of about 2 m, an intermediate value between the 5 m depth measured by Paull et al. (2008) as the background value of the sulfate methane transition outside Nyegga pockmarks and a close to zero value (seabed) at active sites. Subseafloor fluid flow is heterogeneously distributed within such a pockmark site, which is more than 200 m wide (Figure 5A). Similarly, fluid indicators in the subsurface sediments at CNE03 vary drastically from one core to another, although they are only a few tens of meters apart (Figures 2A, 6). Maximum pore water methane concentration varies in a 50-m distance from 1 mM (this study) to 6.7 mM (Ivanov et al., 2010); these values are lower than the peak of methane measured at Tobic pockmark reaching 12.0 mM (Ivanov et al., 2010). Thus, the uppermost sediment at one location with gas hydrates and abundant living Siboglinidae (pogonophora) contrasts with some others that present no signs of present or past seep-related activity (this study; Ivanov et al., 2010; Attias et al., 2020).
Past seepage activity. The area occupied at CNE03 by the identified seeping sites is probably less than 1% of the total area explored with the ROV during the Vicking cruise. From hydrological modeling of sedimentation and compaction in the Nyegga region for the period of the past 2.6 Ma, Hustoft et al. (2009) suggest that Nyegga chimneys and pockmarks could have formed in association with a post-LGM peak of fluid expulsion caused by rapid sedimentary loading in the period. The period 15,800–15,000 14C yr BP (ca. 18,314–17,366 cal yr BP) was one of rapid glacio-marine sedimentation of about 30 m/ky (Reiche et al., 2011) and correlates with a period of fluid expulsion at CNE03 indicated by two beds of vesicomyids dated at 15,500 ±60 and 14,930 ±50 14C yr BP (ca. 17,952 and 17,238 cal yr BP), respectively (Figure 13). Similar beds of vesicomyids were also recovered at other locations at CNE03 (core GS07-148-14GC, Chen et al., 2012; Karstens et al., 2018; core CNE03; Attias et al., 2020; Figure 6). Two distinctive chemosynthetic shell beds are centered around depth intervals of 1.05–1.11 and 1.48–1.62 mbs (Chen et al., 2012). Radiocarbon dating of these shells provides evidence for two main methane seepage episodes, between 15,500 and 13,900 14C yr BP (ca. 17,952 and 15,951 cal yr BP), respectively (Chen et al., 2012). The ages of vesicomyids recovered at CNE03 are also consistent with the AMS 14C dating of planktonic foraminifers, 15,295 ±45 14C yr BP (17,692 ±278 cal yr BP), recovered just above a similar bed of vesicomyids (although initially mistakenly described as Bathymodiolus shells) and carbonate concretions found deeper in the sediments (6.95–7.05 mbsf) in a core taken at the CNE13 site at 807 m water depth and 12 km from the KSF-VKG-02. Numerical modeling of gas hydrate dynamics at the Nyegga pockmark field emphasizes the role of increased sediment accumulation as the main driver of gas hydrate dissociation with a peak at 17,800 years BP (Karstens et al., 2018). Moreover, in the Nyegga area, the occurrence of fluid expulsion towards the seafloor between 200 and 130 ky was inferred from seismic data and identification of paleo-BSRs (Plaza-Faverola et al., 2012). These fluid expulsion events and the associated paleo-chimneys could have provided weakness zones for the formation of chimneys since the last glacial maximum.
The Norwegian margin from the North Sea, the Norwegian Sea to the Barents Sea hosts numerous pockmark fields in connection with seismically identified gas chimneys. Some of them are inactive with no evidence of present-day seepage (e.g., Barents Sea, Nickel et al., 2012; giant pockmark field in the northern North Sea; Mazzini et al., 2017) while some others are still active (e.g., Loppa High in South-West Barents Sea, Chand et al., 2012; Central North Sea; Chand et al., 2017). The onset of methane seepage for the Barents Sea pockmarks is dated to 17,000 years BP based on U/Th dating of methane-derived authigenic carbonates, that coincides there with the deglaciation-induced pressure release and thinning of the hydrate stability zone (Crémière et al., 2016). The methane originates from gas hydrate dissociation triggered by pressure changes on the continental shelf due to collapse and retreat of the Scandinavian Ice Sheet (SIS) (Chand et al., 2012). Karstens and Berndt (2015) suggested the same possible triggering mechanism for high overpressure resulting in hydrofracturing at chimneys of the Southern Viking Graben (North Sea). The extent of the ice cover during the last glacial period does not include the Nyegga area (Hughes et al., 2016); SIS-related overpressure cannot be the driven force for the formation of the Nyegga chimneys.
5.3 Relationship between hydrate occurrences at depth and methane seepage through the seabed
Based on geophysical, geochemical and biological data, we propose a conceptual model for the functioning and evolution of the CNE Nyegga chimneys, through four main successive stages (A to D in Figure 15). This model is well constrained by the CNE03 dataset which is the most complete, with in particular the present-day state, illustrated by stage 2 in Figure 15B. Based on available data at CNE01-CNE17 sites, we suggest that the different investigated CNE chimneys underwent similar evolution with slight differences in their present-day state. While some chimneys present moderate to low seepage activity (e.g., CNE03, Figure 15B), others are characterized by a lower level of seepage at the seafloor (as illustrated in Figure 15C).
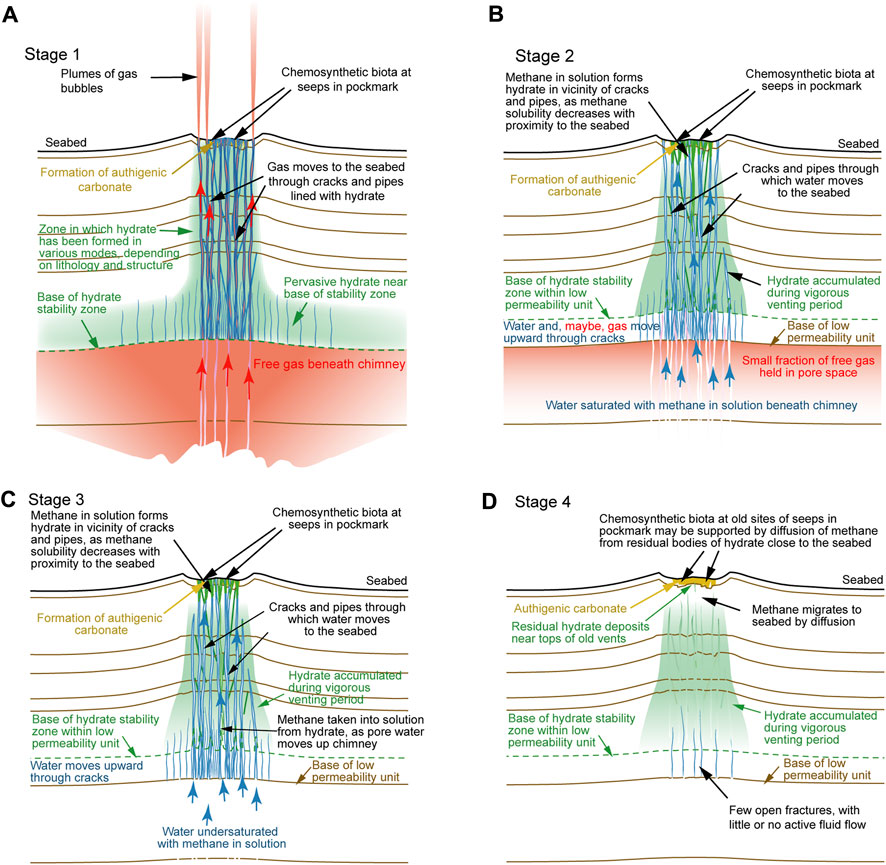
FIGURE 15. Diagrams representing four main evolutive stages of activity of methane transport through a chimney containing hydrate, adapted and supplemented from Foucher et al. (2009). Pink-red represents free gas, blue represents pore water and green represents gas hydrate. (A) Stage 1. Gas hydrate formation and free-gas venting during the post-LGM period. (B) Stage 2. Decrease in hydrate formation and moderate to low seepage activity (present-day CNE03). (C) Stage 3. Gas hydrate dissolution and low to very low level of seepage activity. (D) Stage 4. Methane diffusion and cessation of seepage.
Stage 1. Gas hydrate formation and free-gas venting during the post-LGM period. This initial stage was certainly the most active, with plumes of free gas emitted to the seabed (Figure 15A). The rate of methane flow to the chimney was at its highest and it is probable that most of the hydrate in the chimney was formed during this stage. This initial stage with gas bubbles escaping into the water column is clearly over as no emission of free gas has been observed there or elsewhere in the Nyegga region. The past seepage activity at the Nyegga studied area is evidenced by i) the presence at depth of empty bivalve shells of the Vesicomyidae family (Isorropodon nyeggaensis n. sp.) dated to 15,500 ±60 and 14,930 ±50 14C yr BP (ca. 17,952 and 17,238 cal yr BP) (Figure 13); similar beds of vesicomyids were recovered at CNE03 (Chen et al., 2012; Karstens et al., 2018; Attias et al., 2020) and CNE13 (Paull et al., 2008) with some of these shells dated, giving analogue radiocarbon ages; and ii) the presence of widespread methane-derived authigenic carbonates buried in subsurface sediments inferred from multi-frequency seafloor backscatter data; their extent increases with depth. Seismic tomography showed that there is a body of higher-than-normal seismic velocity in the chimney beneath CNE03 (Plaza-Faverola et al., 2010) (Figure 3C). The likely cause is the presence of hydrate within the sediment, primarily occupying cracks in the low-permeability sediment, with a maximum concentration of about a quarter of the rock volume. Hence, most of this hydrate could have formed when the chimney was venting free gas, earlier in its history. The possibility that some of the hydrate was formed from methane in solution in advecting pore water cannot be overlooked. However, it is more likely that invasion of the Gas Hydrate Stability Zone (GHSZ) by free gas was the primary mechanism initiating the formation of hydrate, as illustrated in Figure 15A. Indeed, this view is supported by the seismic indications of free gas beneath the chimney at present and the higher rate of formation of hydrate from free gas (Waite et al., 2009). Thus, the gas may have followed cracks opened by overpressured gas and held transiently dry by the effect of hydrate formation on the walls of the cracks in sediment of already very low intrinsic permeability. Gas may also have migrated through the developing chimney by the process proposed by Liu and Flemings (2007). Following initial invasion of the base of the chimney through fractures opened by overpressured gas, gas continues to migrate upward, progressively creating hydrate. Indeed, the increase in pore water salinity caused by the formation of hydrate (dissolved ions are not taken into the hydrate structure) means that, locally, the system can reach the limit of hydrate stability.
Stage 2. Decrease in hydrate formation and moderate to low seepage activity (present-day CNE03). When the rate of free-gas supply to the chimney greatly diminishes or ceases, the flow of methane-rich pore water throughout the chimney can be sustained if the ascending pore water remains saturated in methane by passing through the zone containing free gas (Plaza-Faverola et al., 2010). If very small amounts of free gas enter the GHSZ, they are likely to be consumed in the formation of hydrates, without any free gas reaching the seabed. The hydrate in the chimney maintains the concentration of methane in ascending pore water at saturation level, and hydrate will continue to form within the shallower parts of the chimney, because methane solubility decreases towards the seabed (Figure 15B). Stage 2 corresponds to the current situation of CNE03 site with i) the presence of gas beneath the base of the GHSZ evidenced in the vicinity of the chimney, presented here and in previous seismic studies (Plaza-Faverola et al., 2010; Plaza-Faverola et al., 2012); and ii) the absence of gas bubbles emitted into the water column (acoustic insonification in Figure 2A). This view is consistent with results from marine electromagnetic and seismic studies conducted at CNE03 (Attias et al., 2016). Strong resistivity anomalies in the shallow part are attributed to the presence of gas hydrates and authigenic carbonates. The authors conclude that above the base of the GHSZ, gas hydrates mainly occupy the pore space of sediments whereas the free gas extends laterally below the base of GHSZ. The evidence of fluid flow from the seabed at CNE03 and CNE05.6 also supports the case where the situation is dominated by the advection of methane dissolved in pore water (Supplementary Table S1). Part of this methane could arise from the dissolution of hydrates in the chimney. At CNE03, there is evidence of hydrates a few meters beneath the seabed (Ivanov et al., 2007; Ivanov et al., 2010). The relatively shallow depth of the Sulfate Methane Transition Zone (SMTZ) of 2 m in core KFS-VKG-02, compared with about 5 m depth in the areas outside pockmarks (Paull et al., 2008), could be due to heterogeneous fluid flow related to the activity of the pockmark area or a consequence of a local occurrence of shallow hydrate. The sulfate profile in core AT634G (Ivanov et al., 2010) shows some scatter between 150 and 250 cm depth. This may be because the core intercepts non-vertical migration paths of water with methane in solution, which locally expels sulfate-rich water and reacts with it to remove sulfate by AOM. Alternatively, this could reflect the presence of gas hydrates at different stratigraphic levels or repeated gas seepage events (Ivanov et al., 2010). At present, methane continues to sustain chemosynthetic communities at the seafloor, e.g., Siboglinidae polychaetes (Oligobrachia haakonmobiensis, i. e., webbi and Sclerolinum contortum) as well as microbial mats (Figure 7), and possibly the precipitation of methane-derived authigenic carbonates in the near-seabed sediment.
Stage 3. Gas hydrate dissolution and low to very low level of seepage activity. When free gas is absent from the base of the chimney, pore water entering the chimney is likely to be undersaturated in methane. A high concentration of methane in pore water near the seabed can however be maintained for a long period of time (thousands of years). Dissolution of hydrate at the base of the chimney would bring the methane in solution in pore water to saturation level, which would lead to the creation of hydrate closer to the seabed, where the solubility of methane is lower (Figure 15C). This process will maintain methane in solution near the seabed at saturation until all the hydrate has dissolved, with the concentration profile near the seabed being controlled by the rate of fluid advection competing against molecular diffusion to the seabed and processes, such as anaerobic oxidation of methane, that consume methane (Foucher et al., 2009). In the Nyegga area, depending on the migration path of ascending pore fluids relative to sedimentary units containing free gas, the situation could be represented by Stage 3 (Figure 15C) where the water migrating beneath the GHSZ is undersaturated in methane, but flow through the chimney containing hydrate brings it to saturation.
Stage 4. Methane diffusion and cessation of seepage. If fluid flow into the base of the chimney ceases, hydrate in the chimney will gradually be diminished by the diffusion of methane to the seabed (Figure 15D). Pore water surrounding hydrate will remain saturated in methane until the hydrate has dissolved. Depending on the amount of hydrate present, this could take thousands to tens of thousands of years (Foucher et al., 2009). The concentration of methane in solution near the seabed, in this case, will depend on the quantity of hydrate in the proximity of the seabed, its depth beneath the seabed when inflow at the base of the chimney ceased and on the time elapsed since. The top of hydrate within the top meter or so would recede downward quite quickly, taking a few hundred years for a layer with an average concentration of about 10% of total volume to deepen from 1 m to 2 m (Foucher et al., 2009). The concentration of methane in pore water near the seabed is rapidly reduced by the combined effects of diffusion and oxidation. Isolated pipes and veins lose hydrate more rapidly as is most likely the case of many inactive Nyegga spots.
6 Summary and conclusion
ROV dive observations identified several seeping sites at the CNE03 and at a nearby 4-km-distanced location named CNE05.6. Morphology at the seabed, imaged by high-resolution bathymetry, reveals not only depressions, corresponding to pockmarks, but also adjacent ridges whose summits and uppermost flanks are the locations of present-day seepage activity. The seafloor morphology of pockmark features located above hydrate-bearing chimneys is known to be chaotic and more complex than free-gas related pockmarks (Riboulot et al., 2016). At seeps of CNE03 and CNE05.6, there is a clear zonation of the biological chemosynthetic habitat, from an inner area of dark-grey reduced sediment, bacterial mats and Rissoidae gastropods to outer fields of Siboglinidae. This change in macrofauna at the active Nyegga seeps is interpreted to reflect a decreasing strength of fluid flow away from the seep center, similarly to other seeps of the Norwegian margin (Gebruk et al., 2003; de Beer et al., 2006; Jerosch et al., 2007; Decker et al., 2012). All the sites of high-seepage activity are restricted to a few square meters of the seabed. No free-gas bubble emissions were observed at any of the sites, but in situ methane anomalies were detected in the water column within a few tens of centimeters of the seabed with a highest concentration of 2,130 nL/L. The pattern of seepage is heterogeneous. For example, at CNE03, sulfate and chloride profiles in the pore water of core KSF-VKG-02 show that there is no upward fluid advection within 40 m of the most active seepage area. Besides the direct influence of seeps on chemosynthetic fauna, there is an indirect impact on the benthic background fauna. Methane-derived authigenic crusts and consolidated sediment layers both provide a hard substrate habitat for very rich benthic fauna, including sponges, comatulids and ophiurids.
Two beds with carbonate concretions and vesicomyids dated at 15,500 ±60 and 14,930 ±50 14C yr BP (17,952 ±243 and 17,238 ±251 cal yr BP) in the KSF-VKG-02 core taken at CNE03 most likely mark past events of intense seepage, as observed in three other cores from the CNE area (Paull et al., 2008; Chen et al., 2012; Karstens et al., 2018; Attias et al., 2020). These periods coincide with episodes of rapid sedimentation that induced fluid circulation and the formation of the Nyegga pockmark field (Hustoft et al., 2009; Reiche et al., 2011) and triggered widespread gas hydrate dissociation (Karstens et al., 2018). The recent identification of the Nyegga Slide and the triggering of its associated slope failure, 20,000 years BP (Karstens et al., 2023), rule out the view that the Nyegga pockmark field predates the giant Storegga Slide event (e.g., Hustoft et al., 2009), and emphasize the probable close spatio-temporal link between fluid seepage and sedimentary destabilization in the region. The very low δ13C values in the carbonates (down to −58‰) clearly indicate that the major source of carbon was methane issued from the venting fluids and converted to HCO3− during microbial anaerobic oxidation. Our observations are consistent with a history of seepage showing a peak of activity and perhaps the formation or reactivation of chimneys in immediate post-LGM times, as suggested by hydrological modeling (Hustoft et al., 2010) and gas hydrate dissociation simulation (Karstens et al., 2018). It is probable that during this period free gas was emitted from the seabed and also formed hydrate in the chimneys beneath the pockmarks. Our preferred model for the present-day situation is one in which there is minimal input or no input of free gas at the base of the chimney. Seepage is dominated by advection of methane in solution in pore water that enters the base of the chimney saturated in methane, because it migrates through layers that contain free gas. Even if the water entering the base of the chimney was not methane-saturated, it would become saturated with methane derived from dissolution of hydrate in the chimney, provided that the migration paths pass through the hydrate-bearing parts of the chimney.
Attention has justifiably tended to focus on large pockmarks, such as CNE03, both in this and other investigations of seepage in the Nyegga area, but total seepage through the far more numerous smaller pockmarks and other seabed features that host seeps might be of similar importance. CNE05.6 exhibits a similar level of present-day activity to CNE03, although it has far less prominent seabed relief and acoustic backscatter than CNE03 (Figure 4). Because it is offset from the seismic line, its underlying chimney is not imaged on the very-high resolution seismic section (Figure 2B), but can be seen on the high-resolution seismic section below the Intra-Naust reflector (Figure 2C). The even smaller conduits, which are imaged by the very-high resolution seismic sections, commonly terminate at features on the seabed, which although are possibly inactive at present, must have been active at some time in the post-LGM period. These smaller structures have the potential to contribute as much as or more than the present-day fluid outflow from the seabed above the chimneys. Further investigation of flow evidence is required to establish the relative importance of the two groups of seeping features.
We conclude that the Nyegga pockmark area investigated during this study (CNE01-CNE17) is an area of modest seepage activity at present, but seepage is possibly not weaker, on average, than the areas to the south-east (e.g., Sharic and G11 sites, Figure 1B) which have been previously suggested to be more active at present than the CNE area (Ivanov et al., 2010). More extensive investigations are required to establish the general distribution of seepage in these areas, and document the apparently high degree of heterogeneity of seepage at pockmarks. From the experience of ROV dives on the pockmarks investigated during this study, it is evident that intense observation and sampling is needed to characterize seepage activity, and that the results from two or three cores or restricted visual seabed inspection from a single pockmark area could give a false impression of the feature being either highly active or inactive. Near-bottom observations, at least, confirms that there is activity, but cannot quantify it. Core sampling could lead to a feature being wrongly classified as inactive. Consequently, we contend that the present level of investigation of seepage activity in the Nyegga region is far too low to be able to draw conclusions on general trends in activity across the region. We suggest that any area underlain by gas below the base of the GHSZ is likely to present some methane seepage.
Data availability statement
The datasets presented in this study can be found in online repositories. The names of the repository/repositories and accession number(s) can be found in the article/Supplementary Material.
Ethics statement
Ethical approval was not required for the study involving animals in accordance with the local legislation and institutional requirements because There was no such procedure at that time.
Author contributions
J-PF conceived this study. J-PF, GW, CP, CD, KO and SD wrote the manuscript and produced the figures. HN was the chief scientist of the Hydratech (2002) and Vicking (2006) cruises. J-PF, CP, KO, J-PD and J-LC participated in the Vicking cruise. SD conducted seafloor and water column data analysis and interpretation, compiled the data and contributed to illustration work of all figures. HN, GW and SK were in charge of seismic data processing and interpretation. CP and M-MB were involved in geochemical analyses of carbonate and sediment and subsequent interpretation. CD and KO were in charge of the biological studies and related analyses. J-PD and J-LC conducted the bottom water sample analyses for methane concentration measurements and were involved in pore-water chemical analyses. All authors contributed to the article and approved the submitted version.
Funding
The MAK-1M side-scan sonar and profiler data were acquired during Leg 3 of Training Through Research Cruise 16 (2006) of the Professor Logachev, funded by the HERMES EU Integrated Project and STATOIL (co-chiefs M. Ivanov and GK. GW). The VICKING cruise was also supported by the HERMES project, funded by the European Commission’s Framework Six Programme, under the priority Sustainable Development, Global Change and Ecosystems, EC Contract No. GOCE-CT-2005-511234.
Acknowledgments
We thank the crews and scientific party of the HYDRATECH 2002 (https://doi.org/10.17600/2020060) and VICKING 2006 cruises (https://doi.org/10.17600/6030090) that took place onboard R/V Le Suroît and Pourquoi pas ? with the Ifremer ROV Victor, respectively. We are especially grateful to Ann Andersen, Marie-Claire Fabri and Philippe Noël. We are indebted to Alexander Plotkin for Porifera determination, Anders Warèn for Gastropoda, Elena Krylova for Bivalvia, Marc Elaume for Comatulidae and Pennatulacea and Ann Andersen for Polychaeta Siboglinidae. We thank Catherine Satra and Jean-Pierre Mazé for their valuable help in producing some of the figures, Patrick Briand for laboratory photographs and Livio Ruffine for earlier discussion of the manuscript. We thank also Omar Boudouma for his helpful assistance during SEM sessions. The AMS 14C measurements were realized at the UMS 2572 LMC14 (CEA-CNRS-IRD-IRSN-MCC) of Saclay by Jean Pascal Dumoulin and Christophe Moreau that we acknowledge warmly. We thank Samuel Toucanne and Guillaume Soulet for their guidance in radiocarbon age calibration. We are also grateful to Carine Chaduteau for her participation in gas analyses. We greatly thank Alison Chalm for language corrections.
Conflict of interest
The authors declare that the research was conducted in the absence of any commercial or financial relationships that could be construed as a potential conflict of interest.
Publisher’s note
All claims expressed in this article are solely those of the authors and do not necessarily represent those of their affiliated organizations, or those of the publisher, the editors and the reviewers. Any product that may be evaluated in this article, or claim that may be made by its manufacturer, is not guaranteed or endorsed by the publisher.
Supplementary material
The Supplementary Material for this article can be found online at: https://www.frontiersin.org/articles/10.3389/feart.2023.1250619/full#supplementary-material
References
Akhmetzhanov, A. M., Kenyon, N. M., Ivanov, M., Westbrook, G. K., and Mazzini, A. (2008). Preliminary results of investigations during the TTR-16 cruise of R/V professor Logachev. UNESCO-IOC Technical Series 76.
Alperin, M., Reeburg, W., and Whiticar, M. J. (1988). Carbon and hydrogen isotope fractionation resulting from anaerobic methane oxidation. Glob. Biogeochem. Cycles 2 (3), 279–288. doi:10.1029/gb002i003p00279
Attias, E., Amalokwu, K., Watts, M., Falcon-Suarez, I. H., North, L., Hu, G. W., et al. (2020). Gas hydrate quantification at a pockmark offshore Norway from joint effective medium modelling of resistivity and seismic velocity. Mar. Petroleum Geol. 113, 104151. doi:10.1016/j.marpetgeo.2019.104151
Attias, E., Weitemeyer, K., Minshull, T. A., Best, A. I., Sinha, M., Jegen-Kulcsar, M., et al. (2016). Controlled-source electromagnetic and seismic delineation of subseafloor fluid flow structures in a gas hydrate province, offshore Norway. Geophys. J. Int. 206 (2), 1093–1110. doi:10.1093/gji/ggw188
Berndt, C., Bünz, S., and Mienert, J. (2003). Polygonal fault systems on the mid-Norwegian margin: a long-term source for fluid flow. Geol. Soc. Lond. Spec. Publ. 216 (1), 283–290. doi:10.1144/gsl.sp.2003.216.01.18
Bondevik, S., Svendsen, J. I., Johnsen, G., Mangerud, J., and Kaland, P. E. (1997). The Storegga tsunami along the Norwegian coast, its age and run up. Boreas 26 (1), 29–53. doi:10.1111/j.1502-3885.1997.tb00649.x
Borges, A. V., Champenois, W., Gypens, N., Delille, B., and Harlay, J. (2016). Massive marine methane emissions from near-shore shallow coastal areas. Sci. Rep. 6, 27908. doi:10.1038/srep27908
Bottinga, Y. (1969). Calculated fractionation factors for carbon and hydrogen isotope exchange in the system calcite-carbon dioxide-graphite-methane-hydrogen-water vapor. Geochimica Cosmochimica Acta 33 (1), 49–64. doi:10.1016/0016-7037(69)90092-1
Bouriak, S., Volkonskaia, A., and Galaktionov, V. (2003). Split' strata-bounded gas hydrate BSR below deposits of the Storegga Slide and at the southern edge of the Voring Plateau. Mar. Geol. 195 (1-4), 301–318. doi:10.1016/s0025-3227(02)00694-1
Bünz, S., and Mienert, J. (2004). Acoustic imaging of gas hydrate and free gas at the Storegga Slide. J. Geophys. Res. Solid Earth 109 (B4), B04102. doi:10.1029/2003jb002863
Bünz, S., Mienert, J., and Berndt, C. (2003). Geological controls on the Storegga gas-hydrate system of the mid-Norwegian continental margin. Earth Planet. Sci. Lett. 209 (3–4), 291–307. doi:10.1016/s0012-821x(03)00097-9
Chand, S., Crémière, A., Lepland, A., Thorsnes, T., Brunstad, H., and Stoddart, D. (2017). Long-term fluid expulsion revealed by carbonate crusts and pockmarks connected to subsurface gas anomalies and palaeo-channels in the central North Sea. Geo-Marine Lett. 37 (3), 215–227. doi:10.1007/s00367-016-0487-x
Chand, S., Thorsnes, T., Rise, L., Brunstad, H., Stoddart, D., Bøe, R., et al. (2012). Multiple episodes of fluid flow in the SW Barents Sea (Loppa High) evidenced by gas flares, pockmarks and gas hydrate accumulation. Earth Planet. Sci. Lett. 331-332, 305–314. doi:10.1016/j.epsl.2012.03.021
Chatterjee, S., Dickens, G. R., Bhatnagar, G., Chapman, W. G., Dugan, B., Snyder, G. T., et al. (2011). Pore water sulfate, alkalinity, and carbon isotope profiles in shallow sediment above marine gas hydrate systems: a numerical modeling perspective. J. Geophys. Res. Solid Earth 116 (B9), B09103. doi:10.1029/2011JB008290
Chen, Y., Bian, Y., Haflidason, H., and Matsumoto, R. (2012). Present and past methane seepage in pockmark CN 03, Nyegga, Offshore Mid-Norway. In. Proc. 7th International Conference on Gas Hydrates (ICGH 2011) (Edinburgh, Scotland, UK), 1–10.
Craig, H. (1957). Isotopic standards for carbon and oxygen and correction factors for mass-spectrometric analysis of carbon dioxide. Geochimica Cosmochimica Acta 12 (1–2), 133–149. doi:10.1016/0016-7037(57)90024-8
Crémière, A., Lepland, A., Chand, S., Sahy, D., Condon, D. J., Noble, S. R., et al. (2016). Timescales of methane seepage on the Norwegian margin following collapse of the Scandinavian Ice Sheet. Nat. Commun. 7, 11509. doi:10.1038/ncomms11509
de Beer, D., Sauter, E., Niemann, H., Kaul, N., Foucher, J.-P., Witte, U., et al. (2006). In situ fluxes and zonation of microbial activity in surface sediments of the Håkon Mosby Mud Volcano. Limnol. Oceanogr. 51 (3), 1315–1331. doi:10.4319/lo.2006.51.3.1315
Decker, C., Morineaux, M., Van Gaever, S., Caprais, J. C., Lichtschlag, A., Gauthier, O., et al. (2012). Habitat heterogeneity influences cold-seep macrofaunal communities within and among seeps along the Norwegian margin. Part 1: macrofaunal community structure. Mar. Ecol. 33 (2), 205–230. doi:10.1111/j.1439-0485.2011.00503.x
Decker, C., and Olu, K. (2012). Habitat heterogeneity influences cold-seep macrofaunal communities within and among seeps along the Norwegian margin. Part 2: contribution of chemosynthesis and nutritional patterns. Mar. Ecol. 33 (2), 231–245. doi:10.1111/j.1439-0485.2011.00486.x
Donval, J. P., Charlou, J. L., and Lucas, L. (2008). Analysis of light hydrocarbons in marine sediments by headspace technique: optimization using design of experiments. Chemom. Intelligent Laboratory Syst. 94 (2), 89–94. doi:10.1016/j.chemolab.2008.06.010
Felden, J., Wenhhöfer, F., Feseker, T., and Boetius, A. (2010). Transport and consumption of oxygen and methane in different habitats of the Håkon Mosby Mud Volcano (HMMV). Limnol. Oceanogr. 55 (6), 2366–2380. doi:10.4319/lo.2010.55.6.2366
Field, M. E., and Jennings, A. E. (1987). Seafloor gas seeps triggered by a northern California earthquake. Mar. Geol. 77 (1–2), 39–51. doi:10.1016/0025-3227(87)90082-x
Foucher, J.-P., Westbrook, G. K., Boetius, A., Ceramicola, S., Dupré, S., Mascle, J., et al. (2009). Structure and drivers of hydrocarbon seep ecosystems in the European seas: an overview from HERMES results. Oceanography 22 (1), 92–109. doi:10.5670/oceanog.2009.11
Foucher, J. P., Dupré, S., Scalabrin, C., Feseker, T., Harmegnies, F., and Nouzé, H. (2010). Changes in seabed morphology, mud temperature and free gas venting at the Håkon Mosby Mud Volcano, offshore Northern Norway, over the time period 2003-2006. Geo-Marine Lett. 30, 157–167. doi:10.1007/s00367-010-0193-z
Fritz, P., and Smith, D. G. W. (1970). The isotopic composition of secondary dolomites. Geochimica Cosmochimica Acta 34 (11), 1161–1173. doi:10.1016/0016-7037(70)90056-6
Gay, A., and Berndt, C. (2007). Cessation/reactivation of polygonal faulting and effects on fluid flow in the Vøring Basin, Norwegian Margin. J. Geol. Soc. Lond. 164, 129–141. doi:10.1144/0016-76492005-178
Gebruk, A. V., Krylova, E. M., Lein, A. Y., Vinogradov, G. M., Anderson, E., Pimenov, N. V., et al. (2003). Methane seep community of the Håkon Mosby mud volcano (the Norwegian Sea): composition and trophic aspects. Sarsia 88 (6), 394–403. doi:10.1080/00364820310003190
Grossman, E. L., and Ku, T.-L. (1986). Oxygen and carbon isotope fractionation in biogenic aragonite: temperature effects. Chem. Geol. Isot. Geosci. Sect. 59 (0), 59–74. doi:10.1016/0168-9622(86)90057-6
Haflidason, H., Lien, R., Sejrup, H. P., Forsberg, C. F., and Bryn, P. (2005). The dating and morphometry of the Storegga Slide. Mar. Petroleum Geol. 22 (1), 123–136. doi:10.1016/j.marpetgeo.2004.10.008
Heaton, T. J., Butzin, M., Bard, E., Bronk Ramsey, C., Hughen, K. A., Köhler, P., et al. (2023). Marine radiocarbon calibraiton in polar regions: a simple approximate approach using Marine20. Radiocarbon, 1–28. doi:10.1017/RDC.2023.42
Heaton, T. J., Köhler, P., Butzin, M., Bard, E., Reimer, R. W., Austin, W. E. N., et al. (2020). Marine20—the marine radiocarbon age calibration curve (0–55,000 cal BP). Radiocarbon 62 (4), 779–820. doi:10.1017/RDC.2020.68
Hjelstuen, B., Haflidason, H., Sejrup, H., and Nygård, A. (2010). Sedimentary and structural control on pockmark development—evidence from the Nyegga pockmark field, NW European margin. Geo-Marine Lett. 30 (3), 221–230. doi:10.1007/s00367-009-0172-4
Hovland, M., Heggland, R., De Vries, M. H., and Tjelta, T. I. (2010). Unit-pockmarks and their potential significance for predicting fluid flow. Mar. Petroleum Geol. 27 (6), 1190–1199. doi:10.1016/j.marpetgeo.2010.02.005
Hovland, M., Svensen, H., Forsberg, C. F., Johansen, H., Fichler, C., Fosså, J. H., et al. (2005). Complex pockmarks with carbonate-ridges off mid-Norway: products of sediment degassing. Mar. Geol. 218 (1–4), 191–206. doi:10.1016/j.margeo.2005.04.005
Hovland, M., and Svensen, H. (2006). Submarine pingoes: indicators of shallow gas hydrates in a pockmark at Nyegga, Norwegian Sea. Mar. Geol. 228 (1), 15–23. doi:10.1016/j.margeo.2005.12.005
Hughes, A. L. C., Gyllencreutz, R., Lohne, Ø. S., Mangerud, J., and Svendsen, J. I. (2016). The last Eurasian ice sheets – a chronological database and time-slice reconstruction, DATED-1. Boreas 45 (1), 1–45. doi:10.1111/bor.12142
Hustoft, S., Bünz, S., and Mienert, J. (2010). Three-dimensional seismic analysis of the morphology and spatial distribution of chimneys beneath the Nyegga pockmark field, offshore mid-Norway. Basin Res. 22 (4), 465–480. doi:10.1111/j.1365-2117.2010.00486.x
Hustoft, S., Dugan, B., and Mienert, J. (2009). Effects of rapid sedimentation on developing the Nyegga pockmark field: constraints from hydrological modeling and 3-D seismic data, offshore mid-Norway. Geochem. Geophys. Geosystems 10. doi:10.1029/2009gc002409
Hustoft, S., Mienert, J., Bünz, S., and Nouzé, H. (2007). High-resolution 3D-seismic data indicate focussed fluid migration pathways above polygonal fault systems of the mid-Norwegian margin. Mar. Geol. 245 (1–4), 89–106. doi:10.1016/j.margeo.2007.07.004
Ivanov, M. K., Blinova, V., Kozlova, E., Westbrook, G. K., Mazzini, A., Minshull, T. A., et al. (2007). First sampling of gas hydrate from the Vøring Plateau. Eos, Trans. Am. Geophys. Union 88 (19), 209–212. doi:10.1029/2007EO190001
Ivanov, M., Mazzini, A., Blinova, V., Kozlova, E., Laberg, J.-S., Matveeva, T., et al. (2010). Seep mounds on the southern Vøring Plateau (offshore Norway). Mar. Petroleum Geol. 27 (6), 1235–1261. doi:10.1016/j.marpetgeo.2009.11.009
Jerosch, K., Schlüter, M., Foucher, J.-P., Allais, A.-G., Klages, M., and Edy, C. (2007). Spatial distribution of mud flows, chemoautotrophic communities, and biogeochemical habitats at Håkon Mosby Mud Volcano. Mar. Geol. 243 (1-4), 1–17. doi:10.1016/j.margeo.2007.03.010
Judd, A. G., and Hovland, M. (2007). Seabed fluid flow. The impact on geology, biology and the marine environment. Cambridge: Cambridge University Press.
Karstens, J., and Berndt, C. (2015). Seismic chimneys in the Southern Viking Graben – implications for palaeo fluid migration and overpressure evolution. Earth Planet. Sci. Lett. 412 (0), 88–100. doi:10.1016/j.epsl.2014.12.017
Karstens, J., Haflidason, H., Becker, L. W. M., Berndt, C., Rüpke, L., Planke, S., et al. (2018). Glacigenic sedimentation pulses triggered post-glacial gas hydrate dissociation. Nat. Commun. 9 (1), 635. doi:10.1038/s41467-018-03043-z
Karstens, J., Haflidason, H., Berndt, C., and Crutchley, G. J. (2023). Revised Storegga Slide reconstruction reveals two major submarine landslides 12,000 years apart. Commun. Earth Environ. 4 (1), 55. doi:10.1038/s43247-023-00710-y
Keigwin, L. D., and Boyle, E. A. (2008). Did North Atlantic overturning halt 17,000 years ago? Paleoceanography 23 (1), PA1101. doi:10.1029/2007pa001500
Kim, S.-T., and O'Neil, J. R. (1997). Equilibrium and nonequilibrium oxygen isotope effects in synthetic carbonates. Geochimica Cosmochimica Acta 61 (16), 3461–3475. doi:10.1016/S0016-7037(97)00169-5
King, L. H., and MacLean, B. (1970). Pockmarks on the scotian shelf. Geol. Soc. Am. Bull. 81 (10), 3141–3148. doi:10.1130/0016-7606(1970)81[3141:POTSS]2.0.CO;2
Kroopnick, P. (1980). The distribution of 13C in the atlantic ocean. Earth Planet. Sci. Lett. 49 (2), 469–484. doi:10.1016/0012-821X(80)90088-6
Krylova, E. M., Gebruk, A. V., Portnova, D. A., Todt, C., and Haflidason, H. (2011). New species of the genus Isorropodon (Bivalvia: vesicomyidae: pliocardiinae) from cold methane seeps at Nyegga (Norwegian sea, voring plateau, storrega slide). J. Mar. Biol. Assoc. U. K. 91 (5), 1135–1144. doi:10.1017/s002531541100004x
Liu, X., and Flemings, P. B. (2007). Dynamic multiphase flow model of hydrate formation in marine sediments. J. Geophys. Res. Solid Earth 112 (B3), B03101. doi:10.1029/2005jb004227
Mazzini, A., Aloisi, G., Akhmanov, G. G., Parnell, J., Cronin, B. T., and Murphy, P. (2005). Integrated petrographic and geochemical record of hydrocarbon seepage on the Vøring Plateau. J. Geol. Soc. 162 (5), 815–827. doi:10.1144/0016-764904-133
Mazzini, A., Svensen, H. H., Forsberg, C. F., Linge, H., Lauritzen, S.-E., Haflidason, H., et al. (2017). A climatic trigger for the giant Troll pockmark field in the northern North Sea. Earth Planet. Sci. Lett. 464, 24–34. doi:10.1016/j.epsl.2017.02.014
Mazzini, A., Svensen, H., Hovland, M., and Planke, S. (2006). Comparison and implications from strikingly different authigenic carbonates in a Nyegga complex pockmark, G11, Norwegian Sea. Mar. Geol. 231 (1–4), 89–102. doi:10.1016/j.margeo.2006.05.012
Meunier, C., Andersen, A. C., Bruneaux, M., Le Guen, D., Terrier, P., Leize-Wagner, E., et al. (2010). Structural characterization of hemoglobins from Monilifera and Frenulata tubeworms (Siboglinids): first discovery of giant hexagonal-bilayer hemoglobin in the former “Pogonophora” group. Comp. Biochem. Physiology Part A Mol. Integr. Physiology 155 (1), 41–48. doi:10.1016/j.cbpa.2009.09.010
Mienert, J., Posewang, J., and Baumann, M. (1998). Gas hydrates along the northeastern Atlantic margin: possible hydrate-bound margin instabilities and possible release of methane. Geol. Soc. Lond. Special Publ. 137, 275–291. doi:10.1144/gsl.Sp.1998.137.01.22
Nickel, J. C., di Primio, R., Mangelsdorf, K., Stoddart, D., and Kallmeyer, J. (2012). Characterization of microbial activity in pockmark fields of the SW-Barents Sea. Mar. Geol. 332-334, 152–162. doi:10.1016/j.margeo.2012.02.002
Nouzé, H., Contrucci, I., Foucher, J.-P., Marsset, B., Thomas, Y., Thereau, E., et al. (2004). Premiers résultats d'une étude géophysique sur le flanc nord des glissements de Storegga (Norvège). Comptes Rendus Geosci. 336 (13), 1181–1189. doi:10.1016/j.crte.2004.06.005
Nouzé, H., Contrucci, I., Foucher, J.-P., Thomas, T., Marsset, B., Normand, A., et al. (2002). Cruise report HYDRATECH 2002. High resolution 2D et 3D seismic survey in the Storegga area. Available at: https://w3.ifremer.fr/archimer/doc/00433/54446/55810.pdf. 75.
Nouzé, H., and Fabri, M.-C.l'équipe scientifique embarquée (2007). Vicking cruise report. Cold seeps on the Norwegian margin. Associated Ecosystem. R/V Pourquoi Pas ? May 19th-June 18th, 2006. Alesund-Alesund. Available at: https://w3.ifremer.fr/archimer/doc/00433/54465/55840.pdf. 191.
Olu-Le Roy, K., Caprais, J. C., Fifis, A., Fabri, M. C., Galéron, J., Budzinsky, H., et al. (2007). Cold-seep assemblages on a giant pockmark off West Africa: spatial patterns and environmental control. Mar. Ecol. 28 (1), 115–130. doi:10.1111/j.1439-0485.2006.00145.x
Paull, C. K., Ussler, W., Holbrook, W. S., Hill, T. M., Keaten, R., Mienert, J., et al. (2008). Origin of pockmarks and chimney structures on the flanks of the Storegga Slide, offshore Norway. Geo-Marine Lett. 28 (1), 43–51. doi:10.1007/s00367-007-0088-9
Plaza-Faverola, A., Bünz, S., and Mienert, J. (2011). Repeated fluid expulsion through sub-seabed chimneys offshore Norway in response to glacial cycles. Earth Planet. Sci. Lett. 305 (3–4), 297–308. doi:10.1016/j.epsl.2011.03.001
Plaza-Faverola, A., Bünz, S., and Mienert, J. (2012). The free gas zone beneath gas hydrate bearing sediments and its link to fluid flow: 3-D seismic imaging offshore mid-Norway. Mar. Geol. 291–294 (0), 211–226. doi:10.1016/j.margeo.2011.07.002
Plaza-Faverola, A., Westbrook, G. K., Ker, S., Exley, R. J. K., Gailler, A., Minshull, T. A., et al. (2010). Evidence from three-dimensional seismic tomography for a substantial accumulation of gas hydrate in a fluid-escape chimney in the Nyegga pockmark field, offshore Norway. J. Geophys. Res. 115 (B8), B08104. doi:10.1029/2009jb007078
Reiche, S., Hjelstuen, B. O., and Haflidason, H. (2011). High-resolution seismic stratigraphy, sedimentary processes and the origin of seabed cracks and pockmarks at Nyegga, mid-Norwegian margin. Mar. Geol. 284 (1-4), 28–39. doi:10.1016/j.margeo.2011.03.006
Riboulot, V., Sultan, N., Imbert, P., and Ker, S. (2016). Initiation of gas-hydrate pockmark in deep-water Nigeria: geo-mechanical analysis and modelling. Earth Planet. Sci. Lett. 434, 252–263. doi:10.1016/j.epsl.2015.11.047
Rise, L., Ottesen, D., Longva, O., Solheim, A., Andersen, E. S., and Ayers, S. (2006). The Sklinnadjupet slide and its relation to the Elsterian glaciation on the mid-Norwegian margin. Mar. Petroleum Geol. 23 (5), 569–583. doi:10.1016/j.marpetgeo.2006.05.005
Sibuet, M., and Olu, K. (1998). Biogeography, biodiversity and fluid dependence of deep-sea cold-seep communities at active and passive margins. Deep Sea Res. Part II Top. Stud. Oceanogr. 45 (1-3), 517–567. doi:10.1016/S0967-0645(97)00074-X
Smirnov, R. V. (2000). Two new species of Pogonophora from the arctic mud volcano off northwestern Norway. Sarsia 85 (2), 141–150. doi:10.1080/00364827.2000.10414563
Solheim, A., Berg, K., Forsberg, C. F., and Bryn, P. (2005). The Storegga Slide complex: repetitive large scale sliding with similar cause and development. Mar. Petroleum Geol. 22 (1–2), 97–107. doi:10.1016/j.marpetgeo.2004.10.013
Stuiver, M., and Reimer, P. J. (1993). Extended 14C data base and revised CALIB 3.0 14C age calibration program. Radiocarbon 35 (1), 215–230. doi:10.1017/S0033822200013904
Tarutani, T., Clayton, R. N., and Mayeda, T. K. (1969). The effect of polymorphism and magnesium substitution on oxygen isotope fractionation between calcium carbonate and water. Geochimica Cosmochimica Acta 33 (8), 987–996. doi:10.1016/0016-7037(69)90108-2
Ussler, W., and Paull, C. K. (1995). Effects of ion exclusion and isotopic fractionation on pore water geochemistry during gas hydrate formation and decomposition. Geo-Marine Lett. 15 (1), 37–44. doi:10.1007/BF01204496
Vanreusel, A., Andersen, A. C., Boetius, A., Connelly, D., Cunha, M. R., Decker, C., et al. (2009). Biodiversity of cold seep ecosystems along the European Margins. Oceanography 22 (1), 110–127. doi:10.5670/oceanog.2009.12
Vogt, P. R., Crane, K., Sundvor, E., Hjelstuen, B. O., Gardner, J., Bowles, F., et al. (1999a). Ground-truthing 11- to 12-kHz side-scan sonar imagery in the Norwegian–Greenland Sea: part II: probable diapirs on the Bear Island fan slide valley margins and the Voring Plateau. Geo-Marine Lett. 19, 111–130. doi:10.1007/s003670050099
Vogt, P. R., Gardner, J., Crane, K., Sundvor, E., Bowles, F., and Cherkashev, G. (1999c). Ground-truthing 11- to 12-kHz side-scan sonar imagery in the Norwegia–Greenland Sea: part I: pockmarks on the Vestnesa Ridge and Storegga slide margin. Geo-Marine Lett. 19 (1), 97–110. doi:10.1007/s003670050098
Vogt, P. R., Gardner, J., and Crane, K. (1999b). The Norwegian–Barents–Svalbard (NBS) continental margin: introducing a natural laboratory of mass wasting, hydrates, and ascent of sediment, pore water, and methane. Geo-Marine Lett. 19 (1), 2–21. doi:10.1007/s003670050088
Waite, W. F., Santamarina, J. C., Cortes, D. D., Dugan, B., Espinoza, D. N., Germaine, J., et al. (2009). Physical properties of hydrate-bearing sediments. Rev. Geophys. 47 (4). doi:10.1029/2008RG000279
Westbrook, G. K., Chand, S., Rossi, G., Long, C., Bünz, S., Camerlenghi, A., et al. (2008). Estimation of gas hydrate concentration from multi-component seismic data at sites on the continental margins of NW Svalbard and the Storegga region of Norway. Mar. Petroleum Geol. 25 (8), 744–758. doi:10.1016/j.marpetgeo.2008.02.003
Whiticar, M. J. (1999). Carbon and hydrogen isotope systematics of bacterial formation and oxidation of methane. Chem. Geol. 161 (1–3), 291–314. doi:10.1016/S0009-2541(99)00092-3
Keywords: Norwegian margin, gas chimneys, pockmarks, seeps, authigenic carbonates, chemosynthesis-based communities, gas hydrate, dissolved methane
Citation: Dupré S, Foucher J-P, Pierre C, Decker C, Westbrook G, Ker S, Olu K, Donval J-P, Charlou J-L, Blanc-Valleron M-M and Nouzé H (2023) Methane-flow system within the Nyegga pockmark field, offshore mid-Norway. Front. Earth Sci. 11:1250619. doi: 10.3389/feart.2023.1250619
Received: 30 June 2023; Accepted: 06 October 2023;
Published: 18 October 2023.
Edited by:
Marzia Rovere, Institute of Marine Sciences, ItalyReviewed by:
Giuliana Panieri, UiT The Arctic University of Norway, NorwayKlaus Wallmann, GEOMAR Helmholtz Center for Ocean Research Kiel, Germany
Copyright © 2023 Dupré, Foucher, Pierre, Decker, Westbrook, Ker, Olu, Donval, Charlou, Blanc-Valleron and Nouzé. This is an open-access article distributed under the terms of the Creative Commons Attribution License (CC BY). The use, distribution or reproduction in other forums is permitted, provided the original author(s) and the copyright owner(s) are credited and that the original publication in this journal is cited, in accordance with accepted academic practice. No use, distribution or reproduction is permitted which does not comply with these terms.
*Correspondence: Stéphanie Dupré, c3RlcGhhbmllLmR1cHJlQGlmcmVtZXIuZnI=