 Bo Xiang1,2
 Xiao Xu1,2*
 Xiaofei Tong1,2Jiajie Wu1,2Chunsen Li1,2Jiahao Yu1,2Xucong Luo1,2
 Xiaoyu Guo1,2
- 1School of Earth Sciences and Engineering, Sun Yat-sen University, Zhuhai, China
- 2Southern Marine Science and Engineering Guangdong Laboratory (Zhuhai), Zhuhai, China
Although the Himalayan-Tibetan orogen is a result of compressional tectonics, the orogen also hosts active rifts accommodating east-west extension orthogonal to the north-south India-Asia convergence. In this study we address the question of how the north-trending rifts were formed by conducting high-resolution seismic imaging survey across southeastern Tibet where the Cona rift is exposed. Our work shows that the crustal structures of this youngest rift in southern Tibet was constructed by multiple-scale structures that are decoupled with depth and long rift trend. We suggest this deformation style to have resulted from eastward extrusion of the middle and upper crust with increasing speeds to the north towards the Yarlunbg-Zangpo suture. The differential eastward extrusion in turn may have contributed to the formation and evolution of the eastern Himalayan syntaxis.
1 Introduction
Active north-trending rifts in southern Tibet and the northern Himalaya across the Yarlung-Zangpo suture (YZS) zone between India and Asia have been known since the pioneer work of (Molnar and Tapponnier, 1978; Yin and Harrison, 2000) (Figure 1). However, whether the initiation of the rifts was a result of 1) gravitational collapse (Molnar and Tapponnier, 1978) when the Tibetan plateau reached its maximum gravity-supported elevation (Harrison et al., 1995), 2) large-scale strike-slip faulting due to lateral extrusion of northern Tibet (Armijo et al., 1989), 3) convective removal of the Tibetan mantle lithosphere (England and Houseman, 1989), 4) plate-boundary-enforced continental-scale east-west extension (Yin, 2000), or 5) gravitational spreading of the Tibetan lithosphere assisted by lateral asthenospheric flow (Yin and Taylor, 2011) has been debated. Studies aiming at differentiating the above competing hypotheses helped clarified the possible dynamic causes, timing, and potential processes during the rift formation and evolution (Lee and Whitehouse, 2007; Mitsuishi et al., 2012; Tian et al., 2015). Despite these efforts, little progress has been made for diagnostic tests of the above models due to the lack of high-resolution imaging of the lithospheric structures across the Tibetan rifts. In this study, we address this issue by presenting newly acquired short-period seismological data to better document the rift structures relevant to differentiating the competing models.
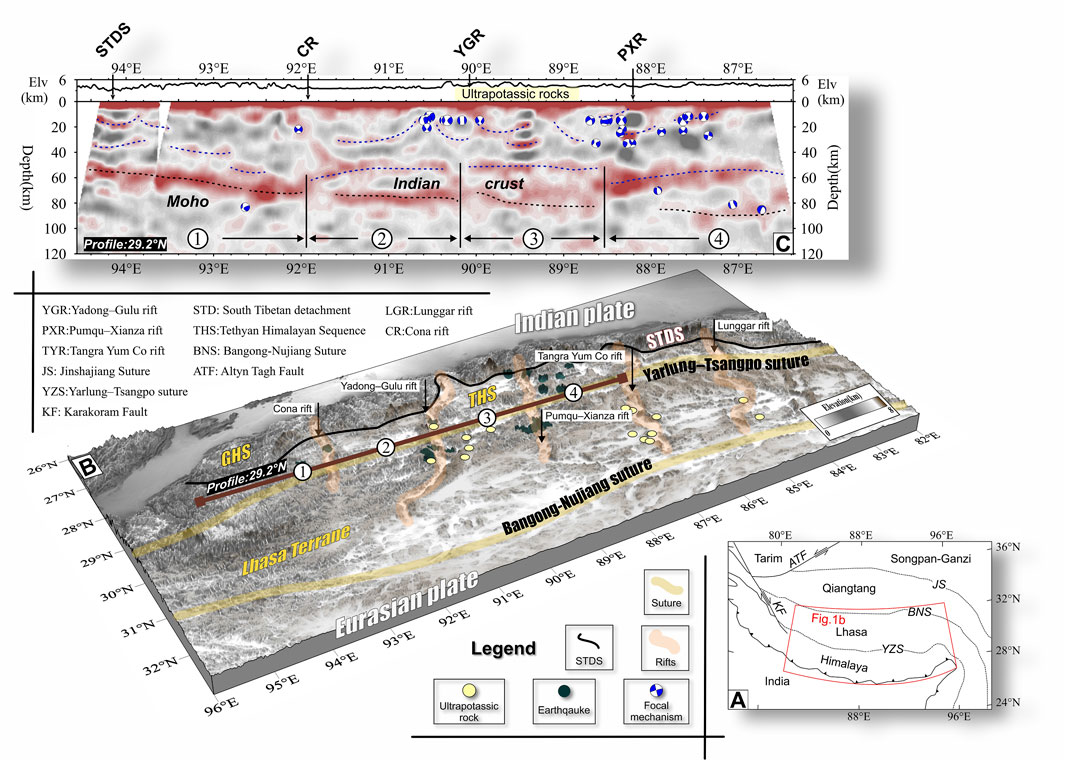
FIGURE 1. (A) Simplified tectonic map of Tibet; the red box shows the location of (B). (B) Tectonic and Topographic map of southern Tibet. The yellow circles denote the locations of ultrapotassic volcanic fields in the Lhasa terrane (Bian et al., 2020). Dark green circles mark the earthquake hypocenters determined by the Global Centroid-Moment-Tensor (CMT) project (Chen et al., 1996). (C) The receiver function image of Shi et al. (2020) that shows the main structures within the crust along latitude 29.2 °N. See (B) for the profile location. Red and gray colors represent positive and negative increases in seismic velocities with depth, respectively. The locations of focal mechanisms are shown in (B) (Chen et al., 1996). Yellow rectangle is the distribution of ultrapotassic rocks.
2 Geological and geophysical background
East-west extension in southern Tibet may have been initiated between the middle and late Miocene (Harrison et al., 1995; Taylor et al., 2003; Styron et al., 2013). According to the distribution and focal mechanisms of local earthquakes (Figures 1B, C), the middle crust was an aseismic zone and the normal faults were generally associated with north-trending rifts (Shi et al., 2020). The earthquakes in lower crust were triggered by the strong interactions between the crust and mantle (Molnar and Chen, 1983; Pang et al., 2018; Shi et al., 2020).
Cenozoic ultrapotassic volcanic rocks and leucogranites are widely developed in the Lhasa Terrane and Tethyan Himalayan Sequence (THS) (Williams, 2004; Chung et al., 2005); their ages range from the late Oligocene to the Miocene (Williams et al., 2001; Chung et al., 2003; Hou et al., 2004). The origin of the ultrapotassic volcanic rocks may constrain the evolution of continent-continent collision zones (Turner et al., 1996; Tapponnier et al., 2001). Geochemical analyses suggest that the ultrapotassic melt was derived from the interaction between the Indian lithospheric mantle and upwelling asthenosphere (Xu et al., 2017; Liu et al., 2020b). The asthenospheric upwelling was generally observed as a factor strongly related to mantle-lithosphere delamination (Zhao et al., 2009) and tearing (Hou et al., 2006).
The Himalayan leucogranites are mainly exposed within the Tethyan Himalayan sequence in north and the Greater Himalayan Crystalline Complex (GHC) in south (Mark Harrison et al., 1997; Guo and Wilson, 2012; Liu et al., 2016; Wu et al., 2020). The emplacement age of leucogranites was from 44 to 7 Ma, and most leucogranites were emplaced during the Neo-Himalayan period (25-14 Ma) in both belts (Wu et al., 2020). The Eo-Himalayan stage (46–25 Ma) had a few leucogranite emplacements in the northern belt (Vance and Harris, 1999; Carosi et al., 2016). Wu et al. (2020) proposed a Post-Himalayan stage (<14 Ma), leucogranites of this stage were sparse and were mainly discovered along N–S-trending rifts (Liu et al., 2014). The in situ partial melting of the subducted GHC at depth or the fractional crystallization that occurred with the exhumation of this system are used to explain the series of characteristics of the leucogranites (Wu et al., 2015; Zhang et al., 2017). Overall, these studies showed that the evolution of the Himalayas was significantly associated with the exhumation of GHC (Webb et al., 2011a; Carosi et al., 2016).
The South Tibetan Detachment System (STDS) is a low-angle normal fault system parallel to the entire Himalayan orogenic belt (Burchfiel and Royden, 1985). The STDS separated the Tethyan Himalayan Sequence from the underlying the GHC in the north-central Himalaya (Carosi et al., 1998), but merges to the south with the Main Central Thrust (MCT) in the western Himalaya and the southernmost Nepal Himalaya (Webb et al., 2007; Webb et al., 2011a; Webb, 2011b). The initiation age of the STDS as a normal fault is estimated between 35 Ma and 23 Ma (Liu et al., 2017; Webb et al., 2017). The cessation time of the STDS is mainly determined by the north-trending rifts (Edwards and Harrison, 1997; Xu et al., 2013). Motion along the STDS has been related to the exhumation of the GHC (Yin, 2006).
Evidence from several geophysical studies suggests that the subducted Indian lithospheric slab was torn into pieces with different angles (Chen et al., 2015; Li and Song, 2018; Wu et al., 2019). The lateral variation of the subducted slab may cause the asthenospheric upwelling, it appears to be positively related to the partial melting of the heated Indian lithospheric mantle and lower crust (Li and Song, 2018). What we know about the partial eclogitization of Indian lower crust was largely based upon gravity anomalies and seismic data (Kind et al., 2002; Schulte-Pelkum et al., 2005; Nabelek et al., 2009; Wittlinger et al., 2009; Hacker et al., 2015; Shi et al., 2015). The anatexis of granulite and eclogite took place at ∼50 km depth (800°C–850°C) (O'Brien, 2018; Wu et al., 2020) during which magmatic melts were transported upwards through the crust. The low velocity and resistivity layer, interpreted as a partially molten zone in the middle and lower crust of the Himalaya, was identified by tomographic and magnetotelluric images (Nelson et al., 1996; Unsworth et al., 2005; Guo et al., 2009; Hazarika et al., 2014; Xu et al., 2017; Chen et al., 2018; Subedi et al., 2018). Numerical simulations support the suggestion that the underlying low-viscosity layer in the Himalaya may have assisted GHC exhumation via erosion-induced lower-crustal extrusion (Beaumont et al., 2001). The receiver function (RF) illustrated the anisotropic shear zone at shallow depths by exhumation of GHC (Schulte-Pelkum et al., 2005). Shi et al. (2020) found that the Indian lower crust was gradually thinning towards the east (Figure 1C), and the rifts and Moho offset occur in pairs.
The Cona rift is located in southeast Tibet that cuts across the Tethyan Himalayan Sequence (Figure 1B). The formation mechanism of the Cona rift is controversial (Bian et al., 2020; Shi et al., 2020). This study area (Figure 2A) is located in the southeast of the THS. Two gneiss domes are exposed on the east side of the Cona rift, Yardoi and Cuonadong domes. The study area is dominated by north-dipping thrust faults, from north to south, the Lhunze thrust fault, Rongbu-Gudui Fault, Lhozhag thrust and Main central fault (MCT) (Dong et al., 2020). The deformation age of these tectonic units is mainly in the Oligocene and Miocene (Bian et al., 2020; Fu et al., 2020).
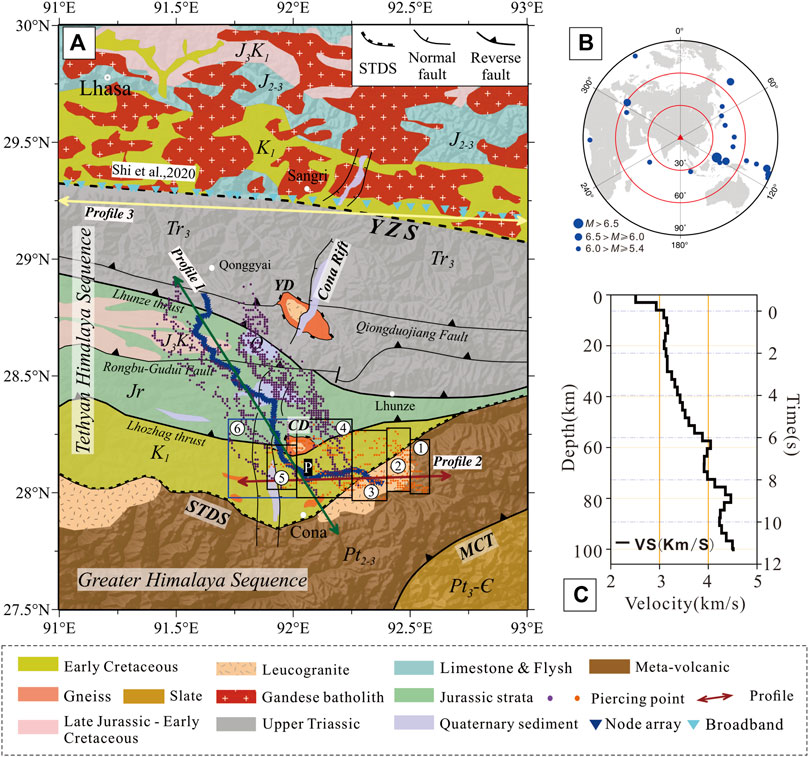
FIGURE 2. (A) Location of the seismic array is shown on a simplified geological map (Dong et al., 2020). The stations are divided into two segments (Profiles 1 and 2). The receiver function (RF) stations are located northwest of point “P” along profile 1 and east of point “P” along profile 2. Distribution of piercing points at a depth of 70 km is shown: the purple piercing points are related to the RFs used in profile 1 and the orange dots are in profile 2. Profile 3 shows the RFs of Shi et al. (2020). The labeled boxes show the range of piercing points. (B) Distribution of teleseismic events used in this study. (C) The 1-D S-wave velocity model used for CCP stacking.
To date, geophysical and petrological studies have accumulated a wealth of information about the Cenozoic evolution of the Himalaya. However, the current resolution of the available seismic data is insufficient to conform or reject the competing models for the Tibetan rift formation. In this study, we provide the highest-resolution images of the crustal structures across the Cona rift.
3 Data and methods
A receiver function (RF) is a time series containing the P-to-S converted waves and multiples formed by velocity discontinuities (Langston, 1979; Zhu and Kanamori, 2000b). It can reveal the fine structures of the crust (Liu et al., 2017). Since the common conversion point (CCP) stacking (Zhu, 2000a) was proposed, as one of the receiver function migration imaging methods, it has been widely used in the study of velocity discontinuities in the crust and upper mantle (Zhang et al., 2014).
The short-period, dense-nodal array has a higher lateral resolution of the RF image at the crustal scale compared to the broadband-station array (Liu et al., 2017). Due to the high integration of node instruments, high-density deployment becomes possible (Lin et al., 2013). These new instruments can be used to study the geological bodies at different scales.
The teleseismic waveforms used in this study were recorded by 148 5-Hz nodal geophones (Fairfield Zland 3C) with a spacing of 1 km and an observation period of ∼40 days (end of the year 2019). The survey line is roughly in the northwest-southeast direction (Figure 2A), crossing the main part of the Cona rift. A total of 24 teleseismic events with magnitudes ≥5.4 were observed for subsequent P-wave RF analysis. The distribution range of epicenter distance is 30°–90°, and most of the earthquakes occurred in the southeast of our study area (Figure 2B). Finally, the 1,604 high-quality RFs were calculated for imaging the crustal structures (Please see the Supplementary Material for the details of the data processing). In general, care was taken to avoid higher Gaussian filter values, because they make it more difficult to separate noises from signals (Leahy et al., 2012). Dense nodal array is closely spaced and can track continuous arrival times through multiple geophones (Ward et al., 2018). To enhance the imaged crustal structures, we stacked the RFs by using spatial (Ward et al., 2018) and CCP stacking (Xu et al., 2018) methods. The CCP stacking process involves two main steps. Initially, every amplitude on the receiver function subsequent to the direct P-wave is presumed to originate from a solitary P-to-S conversion occurring along the ray path. This amplitude is then projected to the conversion point utilizing a reference velocity model. Subsequently, the volume of the crust is partitioned into bins of specified dimensions, and all amplitudes within a given bin are averaged to generate a structural image. The 1-D S-wave velocity model used for CCP stacking from Xin et al. (2019) (Figure 2C). Our CCP image of crustal structure used bins 3-km long and 1-km thick.
4 Results
Our survey line intersects obliquely the regional tectonic trends (Figure 2A). In order to separate east-trending compressional structures from north-trending extensional structures along the rifting zone, our imaging results were projected onto two separate profiles (Figure 2A), respectively. This helped reveal the relationship between structures responsible for GHC exhumation and structures associated with north-trending rifting.
The continuity of the crustal structures (grey thin dash lines in Figure 3) increases with depth in profile 1. The deformation of the middle and upper crust was strong, and the structure of the lower crust is more continuous (Figures 3A, C). The Moho discontinuity is traceable north of the Cona rift, the projected Indian crust dips to the north, and the crustal thickness increases from ∼70 km to ∼80 km (Figures 3A, C). The lower crust is overlain by a set of wide and gentle fold-thrust structures, and the upper crust displays a series of north-dipping thrusts associated closely with fault-bend folds (Figure 3C). There are two scales of folds above and below a 20-km deep interface (Figure 3C), which can be traced to the STDS (thick red dash line in Figures 4A, B). The undeformed lower crust was decoupled from the overlying fold-thrust structures (dark blue zone in Figures 4A, C), there was a decollement (thin pink dash line in Figures 4A, C) between them. Based on previous studies (Nelson et al., 1996; Shi et al., 2015), this interface is interpreted as the Main Himalayan Thrust (MHT). Extensively developed thrusts indicate that the seismically imaged area has been strongly affected by north-south shortening. A possible normal fault was interpreted in the Cona rift zone, but few obvious normal faults can be established in this study. The short-wavelength folds beneath the STDS show the characteristics of low viscosity. The low-velocity zones were highlighted in Figures 3A, C, and the leucogranites were widely exposed in this area. Hence, the low-velocity zones were possible channels for exhumation of high-grade metamorphic rocks. A continuous interface appears in the northern part of Profile 1 at a depth of 70 km (Figure 3C), which might be the partial eclogitization of Indian lower crust by comparing previous study (Shi et al., 2015) in the same location.
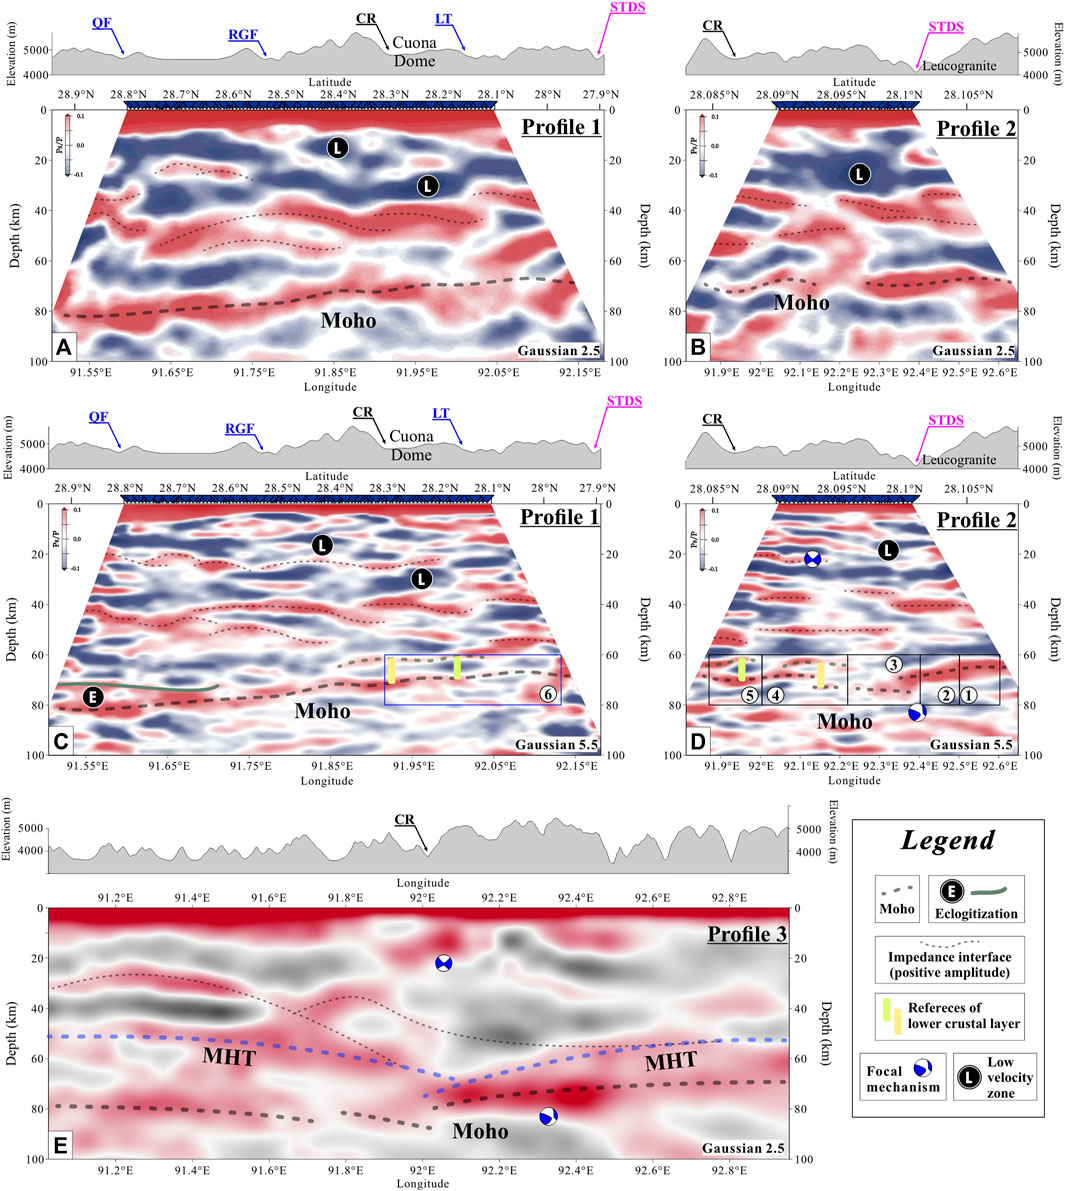
FIGURE 3. CCP-stacked, depth-migrated P-wave radial receiver functions along the two profiles for all stacked events. The topography and faults were plotted at the top of each section. (A–D) are profiles 1 and 2 (see Figure 2 for locations) with the Gaussian coefficient of 2.5 and 5.5. The possible low-velocity zones were identified by the negative velocity polarity. Refer to Figure 2 for the distribution of seismic rays used for imaging in the labeled boxes. (E) The stacked image of profile 3 (see Figure 2 for location).
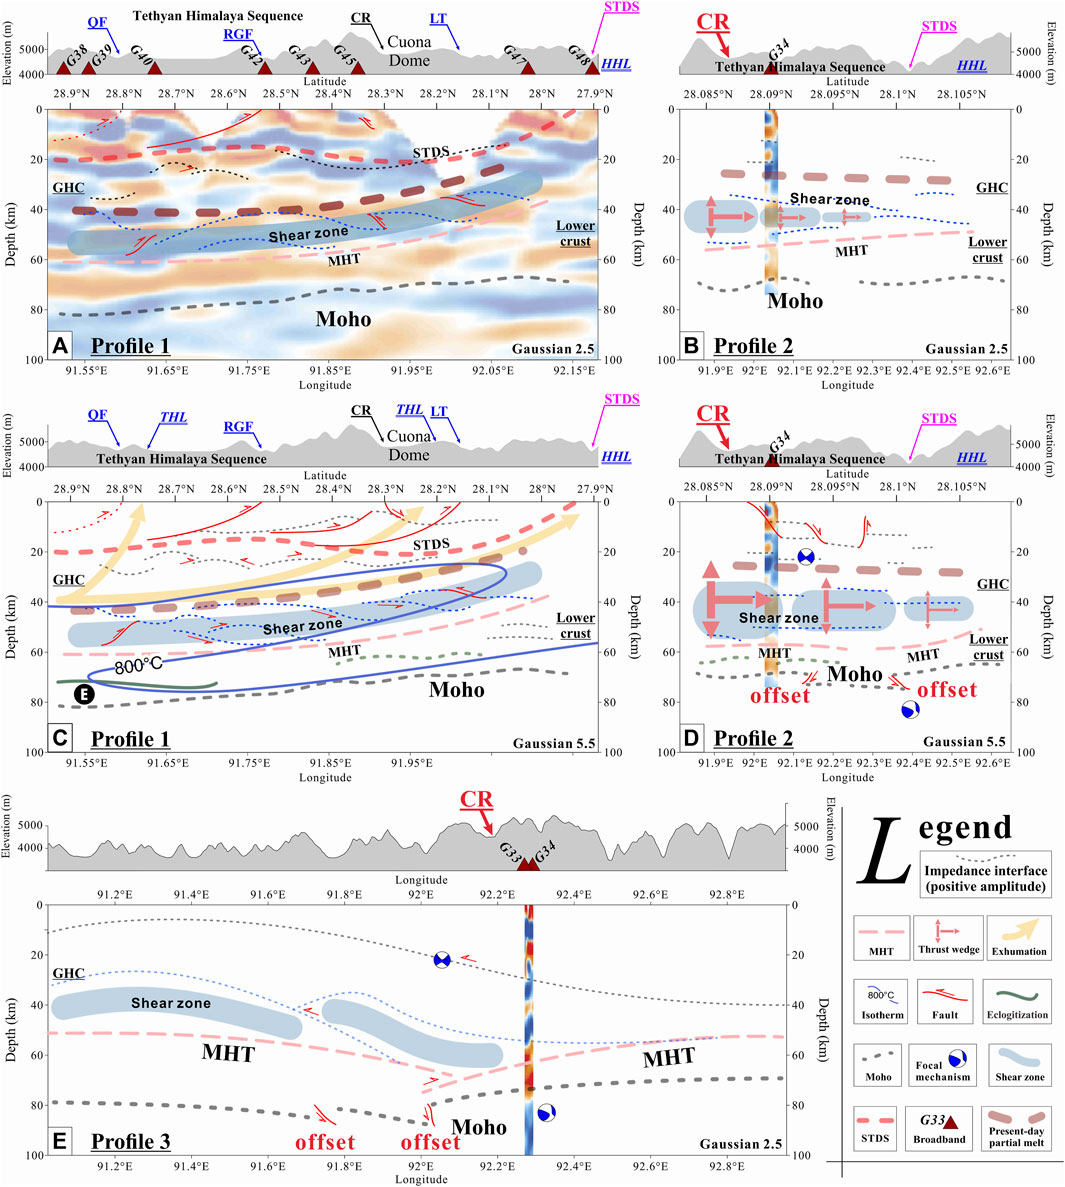
FIGURE 4. (A–D) are the structural interpretations of profiles 1 and 2 with the Gaussian coefficient of 2.5 and 5.5. (E) The structural interpretation of profile 3. For comparison, the CCP stacks (Shi et al., 2015) at the approximate locations are projected on (A, B), (D, E). The isotherms in (C) refer to Chen et al. (2018).
The Cona rift is north-trending normal faults, Profile 2 had been imaged to get a better view of its deep structures (Figures 3B, D). The result of low Gaussian coefficient (2.5) is relatively simple, and the structures located in the middle crust are overall east-dipping (Figure 3B). The structures shown in high Gaussian coefficient (5.5) were a series of short flat layers (Figure 3D). Almost all strata remain horizontal, without any dip to the east or west (Figure 3D). However, there were a large number of offsets in these strata. The strata show a gradual stepping towards the east. This is also consistent with the overall eastward dipping structure shown by the low Gaussian coefficient result.
Since the Moho was rather heterogeneous in the southern section of the survey line, we conducted partition analysis for different locations of the survey line (the boxes marked with numbers, and please see Figure 2 for locations). There was a data intersection between the south section of Profile 1 and the west side of Profile 2 (boxes marked 4, 5 and 6 in Figure 2A). There is a very strong positive amplitude at a depth of 60–80 km at the southern end of Profile 1 (Figure 3C), the west side of Profile 2 did not have the similar amplitude. There were also several strong positive amplitudes on the west side of Profile 2 (dash lines in boxes marked 4 and 5 in Figure 3D). By comparing the interface thickness (green and yellow bars in Figures 3C, D) and the continuity of Moho in profile 1, we can confirm that the western side of profile 2 has the Moho feature at about 70 km depth (Figure 3D), it helped us identify the Moho at the southern end of Profile 1. There is a robust Moho feature on the east side of Profile 2 (boxes marked 1, 2 and 3 in Figure 3D).
The comparison between Profile 2 (Figure 3D) and Profile 3 (Figure 3E) shows that the crust has the following characteristics in the east-west direction. The depth of Moho is deeper in the west than in the east, and there are offsets in the middle. Taking the offset as the reference point, the surface position of the Cona Rift in the northern section is migrated eastward. The lower crust is unevenly thick on both sides of the offset, and thicker on the western side. The images of the low Gaussian coefficient (Figures 3B, E) indicate that the upper and middle crust is tilted to the east.
5 Discussion
By comparing our results with the finding of Shi et al. (2015), the crustal thickness on the west side in our result is thicker than that on the east side (Figure 4E). A large number of regularly arranged folds located above the MHT (Figures 4A, C) are interpreted as shear zones (Schulte-Pelkum et al., 2005; Shi et al., 2015). The fold trend shows the exhumation and shortening of the upper and middle crust in the north-south direction.
There is a distinct wedge in the upper and middle crust to the west (Figure 4B), the wedge is actually due to an increase in the number of strata to the west (light blue area and light pink area Supplementary Figure S10B). The horizontal stratum had also been imaged in profile 1 (light pink area in Supplementary Figure S10A), the ray coverage area (blue box marked 6 in Figure 2A) was similar to profile 2 (black boxes marked 4 and 5 in Figure 2A). The extra stratum on the west side was likely to be the exhumation of the GHC. The uplift of upper crustal (above the STDS) folds was produced by crustal shortening, the normal faults indicate the relative movements of extrusion (Figure 4D). But the upper crustal folds are gentler in the east-west direction, and the middle (GHC) and lower curst is flat with offsets in the east direction (Figures 4B, D). Comparing the depth and thickness of the middle crustal structures, the fold-thrust structures thicken the middle crust and the offsets of the Moho are in response to the lateral inhomogeneity of the middle crustal thickening.
The GHC generally has experienced multiple phases of partial melting expressed by the emplacement of leucogranites (Rubatto et al., 2012; Sorcar et al., 2014). The partial melting weakens the mid-to-lower crust (Jamieson et al., 2006), favoring flow and exhumation under the combined action of plateau-induced pressure gradients and the density difference between molten and un-molten rocks (Beaumont et al., 2004). Our results (Figures 4C, D) shows that the subducted Indian crust can reach the depth over 60km, the P-T condition at this depth made the eclogitization and partial melting of lower and middle crust happen (Schulte-Pelkum et al., 2005; Chen et al., 2018; Wang et al., 2018; Shi et al., 2020; Wu et al., 2020). The partial melting of granulite- and eclogite-facies metamorphism initiated under the P-T conditions of 1.2 GPa and 800°C–850°C, respectively (Figure 4C) (Zhang et al., 2017; Wu et al., 2020). The partial melting of subducted GHC due to heating from below triggered the exhumation of high-grade metamorphosed rocks (Wu et al., 2020). The MHT was the interface between the exhumation and the underthrusting Indian lower crust.
The exhumation process may have been partitioned (Figure 4C): the lower GHC section was by tectonic wedging (Webb et al., 2011a) while the upper GHC section was by channel-flow tunnel (Beaumont et al., 2004; Webb et al., 2011a). The leucogranites were the products of partial melting of subducted the GHC and subsequent highly fractionated magma (Grujic et al., 1996; Guo and Wilson, 2012; Wu et al., 2015). Although we are unable to identify rock lithology by our seismic imaging techniques, the inferred partial melting in the models of Beaumont et al. (2004) could be represented by the presence of low velocity zones (Hetényi et al., 2011; Yang et al., 2012; Shi et al., 2015). The likely low velocity zone may be located by the polarity converter (negative-over-positive) in the upper crust and the upper part of the middle crust (Figures 3A–D). The migration of the melting magmas went through a long distance (Figures 4A, C), it helps researchers to explain the different stages and locations of exposed leucogranites, and also the formation of the leucogranites through a high degree of fractionation along the STDS (Wu et al., 2020).
A significant finding of this study is that the deformation of the Indian crust is lateral variation (Figures 4B, D). The crustal thickening was caused by the crustal shortening and the exhumation of the GHC, but the time of exhumation can be different. The time was controlled by the dipping angles of the Indian subducting continental lithosphere; higher angle made the GHC reach the high P-T condition earlier. The Indian continental lithosphere began to subduct under the pulling of the subducting Neo-Tethys Oceanic lithosphere (Zhang et al., 2012). The age of the subducted Neo-Tethys oceanic slab breakoff is relatively consistent, which is 45–30 Ma (Chung et al., 2005). The subducting Indian continental lithosphere without the slab pull continues to subduct beneath the Eurasian plate due to inertia (Chung et al., 2005). Evidence from the Southern Tibet Rift System distribution, magmatic rock composition, or geophysical observations all show that the subducting Indian continental lithospheric slab is torn in a north-south direction (Hou et al., 2004; Yin and Taylor, 2011; Liu et al., 2020b). The change in dip of the subducting slab may have controlled the stress state in the overlying plate (Doglioni et al., 2007). Lateral variation in the angle of the subducted slab may have caused slab tearing (Figures 5B, C). Different from the previous slab tearing model (Yin, 2000), the slab window (Figure 5C) formed by the slab tearing allows the hot asthenosphere material to erode and destroy the upper lithosphere, which promotes the development of the north-trending rifts. Slab tear started at 25 Ma (Mahéo et al., 2002), and it was torn into at least four parts (Li and Song, 2018). The inhomogeneity of subducting slab and mantle, lateral slab breakoff, and subduction duration are the reasons why the slab was torn (Murphy et al., 1997; Li and Song, 2018). Furthermore, the subduction angle of the subducting Indian continental lithosphere increases from west to east (Liu et al., 2020a). The regional seismic tomography shows the geometry of the subducting Indian continental lithosphere (Li et al., 2008). Based on the distribution and age of the surface outcrops of ultramafic magmatism (Chung et al., 2005) and the locations of the slab tears, we infer that the slab tears occur sequentially from west to east. Variation in the regional vertical stress was caused by changes in the angle of subduction of the Indian lithospheric mantle (Yin, 2006). The contact between the overlying Indian crust and the upwelling high temperature mantle promoted the partial melting of the GHC(Webb et al., 2017).
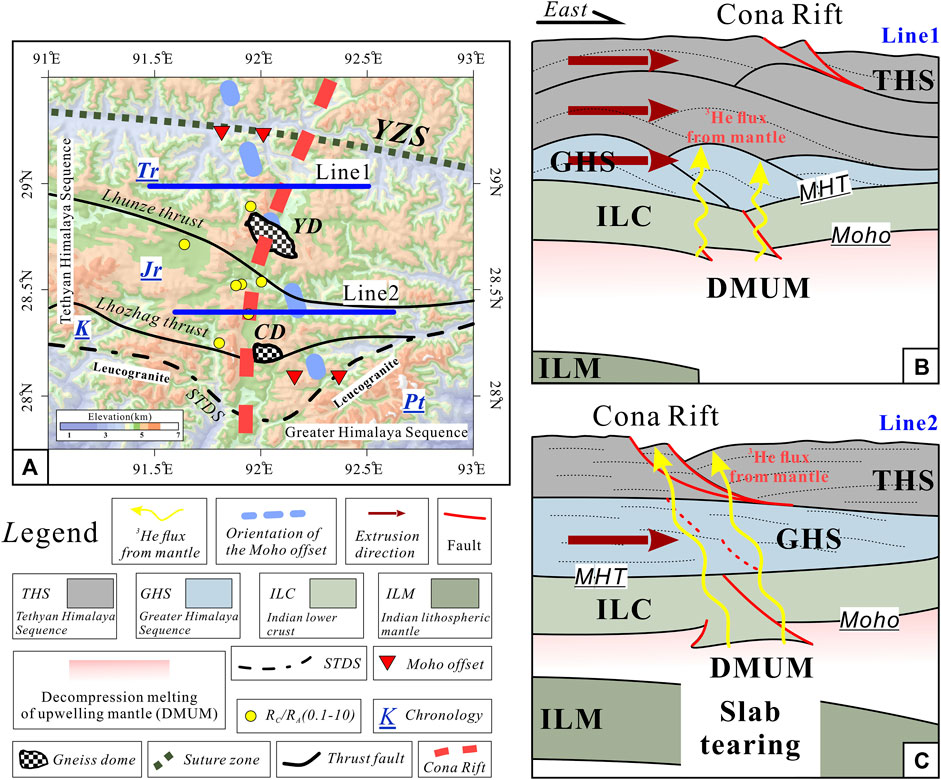
FIGURE 5. Schematic cross-sections of the Cona rift in the eastern THS. (A) The location of the profiles in (B, C), the red dashed line refers to the Cona rift on the surface, the blue dashed line refers to the Moho offset. The yellow dots represent the 3He/4He isotope data (RC/RA) (Klemperer et al., 2022). (B) The crustal shortening and exhumation of GHC led to the lateral variation of crustal thickening. The middle and upper crust extruded eastward, and the Cona rift migrated eastward with it. (C) The slab tearing allowed the hot asthenosphere material to upwell and melt. The eastward escape of the exhumation of the GHC reshaped the crustal structure in the rift region.
Helium isotope data from hot springs in southern Tibet have been used to infer the location of the mantle suture between India and Asia (Klemperer et al., 2022) (Figure 5A). Surface-collected helium isotopes sourced from the mantle must have been transported through the crust via complex conduit networks that may have been strongly controlled by the north-trending rifts due to the spatial correlation of the springs and rifts. In the southern part of the Cona rift, the crustal structure of the rift is relatively simple, with the structures traceable continuously from the Moho to the surface. It shows an east-dipping structure that may provide a conduit for helium isotope to rise to the surface (Figure 5B). In the northern segment, the structure of the rift at mid-crustal depth is replaced by a series of east-dipping structures, and the location of the rift at the surface is farther east than the Moho offset (Figure 5C). This relationship may imply that the rift structures did not form a conduit network for helium isotopes to rise from the mantle to the surface. From south to north, the Cona rift changes its trend from north to northeast direction (Figure 5A). This may indicate that the upper and middle crust in the eastern Tethyan Himalaya may have been extruded eastward with an increasing eastward velocity towards the Yarlung-Zangpo suture zone.
6 Conclusion
A high-resolution receiver-function study in southeastern Tibet reveals geological structures at different scales across a north-trending rift zone (i.e., the Cona rift). The intensity of the crustal deformation decreases with increasing depth, which may have been resulted from the formation of upper and lower decollements as presented by the STDS and MHT, respectively. The unusually thick crustal thickness was contributed to crustal shortening and exhumation of the GHC. The GHC exhumation is the tectonic wedging accompanied by channel tunneling model. The distribution of exposed leucogranites were traceable to the migration of the partial melts. Stress changed due to slab tearing; the exhumation was not synchronized from west to east. At the present, it is possible that extensional structures along the Cona rift are decoupled with depth and rift strike. The eastward extrusion of the middle and upper crust may have different velocities, and this difference may contribute to the evolution of eastern Himalayan syntaxis.
Data availability statement
The raw data supporting the conclusions of this article will be made available by the authors, without undue reservation.
Author contributions
BX, XX, XT, and XG planned the field observation scheme. BX, XX, XT, JW, CL, XL, and JY carried out the field work and collected the waveforms. BX, XX, XT, JW and XG analyzed the data and wrote the manuscript. All authors contributed to the article and approved the submitted version.
Funding
Lithospheric Structures of the Eastern Himalayas as Revealed by Receiver Function Analysis has received funding from the National Natural Science Foundation of China (Grant No 41874102, 42325402, 42274120, 41974097).
Acknowledgments
The authors appreciate the editors and reviewers for their valuable comments and suggestions which greatly helped us to improve the present manuscript. We would like to thank professor An Yin for his help with the English expression.
Conflict of interest
The authors declare that the research was conducted in the absence of any commercial or financial relationships that could be construed as a potential conflict of interest.
Publisher’s note
All claims expressed in this article are solely those of the authors and do not necessarily represent those of their affiliated organizations, or those of the publisher, the editors and the reviewers. Any product that may be evaluated in this article, or claim that may be made by its manufacturer, is not guaranteed or endorsed by the publisher.
Supplementary material
The Supplementary Material for this article can be found online at: https://www.frontiersin.org/articles/10.3389/feart.2023.1252670/full#supplementary-material
References
Armijo, R., Tapponnier, P., and Han, T. (1989). Late Cenozoic right-lateral strike-slip faulting in southern Tibet. J. Geophys. Res. Solid Earth 94, 2787–2838. doi:10.1029/JB094iB03p02787
Beaumont, C., Jamieson, R. A., Nguyen, M. H., and Lee, B. (2001). Himalayan tectonics explained by extrusion of a low-viscosity crustal channel coupled to focused surface denudation. Nature 414, 738–742. doi:10.1038/414738a
Beaumont, C., Jamieson, R. A., Nguyen, M. H., and Medvedev, S. (2004). Crustal channel flows: 1. Numerical models with applications to the tectonics of the himalayan-Tibetan orogen. J. Geophys. Res. Solid Earth 109. doi:10.1029/2003jb002809
Bian, S., Gong, J., Zuza, A. V., Yang, R., Tian, Y., Ji, J., et al. (2020). Late Pliocene onset of the Cona rift, eastern Himalaya, confirms eastward propagation of extension in Himalayan-Tibetan orogen. Earth Planet. Sci. Lett. 544, 116383. doi:10.1016/j.epsl.2020.116383
Burchfiel, B. C., and Royden, L. H. (1985). North-south extension within the convergent Himalayan region. Geology 13, 679–682. doi:10.1130/0091-7613(1985)13<679:NEWTCH>2.0.CO;2
Carosi, R., Lombardo, B., Molli, G., Musumeci, G., and Pertusati, P. (1998). The South Tibetan detachment system in the Rongbuk valley, Everest region. Deformation features and geological implications. J. Asian Earth Sci. 16, 299–311. doi:10.1016/S0743-9547(98)00014-2
Carosi, R., Montomoli, C., Iaccarino, S., Massonne, H. J., Rubatto, D., Langone, A., et al. (2016). Middle to late eocene exhumation of the greater himalayan sequence in the central Himalayas: progressive accretion from the Indian plate. Geol. Soc. Am. Bull. 128, 1571–1592. doi:10.1130/B31471.1
Chen, J., Gaillard, F., Villaros, A., Yang, X., Laumonier, M., Jolivet, L., et al. (2018). Melting conditions in the modern Tibetan crust since the Miocene. Nat. Commun. 9, 3515. doi:10.1038/s41467-018-05934-7
Chen, W.-P., Kao, H. J. W., and Geology, R. (1996). Seismotectonics of Asia. Some recent Prog. 1, 37–62.
Chen, Y., Li, W., Yuan, X., Badal, J. H., and Teng, J. W. (2015). Tearing of the Indian lithospheric slab beneath southern Tibet revealed by SKS-wave splitting measurements. Earth Planet. Sci. Lett. 413, 13–24. doi:10.1016/j.epsl.2014.12.041
Chung, S.-L., Chu, M.-F., Zhang, Y., Xie, Y., Lo, C.-H., Lee, T.-Y., et al. (2005). Tibetan tectonic evolution inferred from spatial and temporal variations in post-collisional magmatism. Earth-Science Rev. 68, 173–196. doi:10.1016/j.earscirev.2004.05.001
Chung, S.-L., Liu, D., Ji, J., Chu, M.-F., Lee, H.-Y., Wen, D.-J., et al. (2003). Adakites from continental collision zones: melting of thickened lower crust beneath southern Tibet. Geology 31, 1021. doi:10.1130/g19796.1
Doglioni, C., Carminati, E., Cuffaro, M., and Scrocca, D. (2007). Subduction kinematics and dynamic constraints. Earth-Science Rev. 83, 125–175. doi:10.1016/j.earscirev.2007.04.001
Dong, X., Li, W., Lu, Z., Huang, X., and Gao, R. (2020). Seismic reflection imaging of crustal deformation within the eastern Yarlung-Zangbo suture zone. Tectonophysics 780, 228395. doi:10.1016/j.tecto.2020.228395
Edwards, M., and Harrison, T. (1997). When did the roof collapse? Late Miocene north-south extension in the high Himalaya revealed by Th-Pb monazite dating of the khula kangri granite. Geology 25, 543–546. doi:10.1130/0091-7613(1997)025<0543:WDTRCL>2.3.CO;2
England, P., and Houseman, G. (1989). Extension during continental convergence, with application to the Tibetan Plateau. J. Geophys. Res. 94, 17561. doi:10.1029/JB094iB12p17561
Fu, J., Li, G., Wang, G., Zhang, L., Liang, W., Zhang, X., et al. (2020). Structural analysis of sheath folds and geochronology in the Cuonadong Dome, southern Tibet, China: new constraints on the timing of the South Tibetan detachment system and its relationship to North Himalayan Gneiss Domes. Terra nova. 32, 300–323. doi:10.1111/ter.12462
Grujic, D., Casey, M., Davidson, C., Hollister, L. S., Kündig, R., Pavlis, T., et al. (1996). Ductile extrusion of the higher himalayan crystalline in Bhutan: evidence from quartz microfabrics. Tectonophysics 260, 21–43. doi:10.1016/0040-1951(96)00074-1
Guo, Z., Gao, X., Yao, H., Li, J., and Wang, W. (2009). Midcrustal low-velocity layer beneath the central Himalaya and southern Tibet revealed by ambient noise array tomography. Geochem. Geophys. Geosystems 10. doi:10.1029/2009gc002458
Guo, Z., and Wilson, M. (2012). The Himalayan leucogranites: constraints on the nature of their crustal source region and geodynamic setting. Gondwana Res. 22, 360–376. doi:10.1016/j.gr.2011.07.027
Hacker, B. R., Kelemen, P. B., and Behn, M. D. (2015). Continental lower crust. Annu. Rev. Earth Planet. Sci. 43, 167–205. doi:10.1146/annurev-earth-050212-124117
Harrison, T. M., Copeland, P., Kidd, W., and Lovera, O. M. (1995). Activation of the Nyainqentanghla shear zone: implications for uplift of the southern Tibetan Plateau. Tectonics 14, 658–676. doi:10.1029/95TC00608
Hazarika, D., Sen, K., and Kumar, N. (2014). Characterizing the intracrustal low velocity zone beneath northwest India–Asia collision zone. Geophys. J. Int. 199, 1338–1353. doi:10.1093/gji/ggu328
Hetényi, G., Vergne, J., Bollinger, L., and Cattin, R. (2011). Discontinuous low-velocity zones in southern Tibet question the viability of the channel flow model. Geol. Soc. Lond. Spec. Publ. 353, 99–108. doi:10.1144/SP353.6
Hou, Z. Q., Gao, Y. F., Qu, X. M., Rui, Z. Y., and Mo, X. X. (2004). Origin of adakitic intrusives generated during mid-Miocene east–west extension in southern Tibet. Earth Planet. Sci. Lett. 220, 139–155. doi:10.1016/s0012-821x(04)00007-x
Hou, Z. Q., Zhao, Z. D. D., Gao, Y. F., Yang, Z. M., and Jiang, W. (2006). Tearing and dischronal subduction of the Indian continental slab: evidence from cenozoic Gangdese volcano-magmatic rocks in south Tibet. Acta Petrol Sin. 22, 761–774. doi:10.1016/j.sedgeo.2005.11.021
Jamieson, R. A., Beaumont, C., Nguyen, M., and Grujic, D. (2006). Provenance of the greater himalayan sequence and associated rocks: predictions of channel flow models. Geol. Soc. Lond. Spec. Publ. 268, 165–182. doi:10.1144/GSL.SP.2006.268.01.07
Kind, R., Yuan, X., Saul, J., Nelson, D., Sobolev, S. V., Mechie, J., et al. (2002). Seismic images of crust and upper mantle beneath Tibet: evidence for Eurasian plate subduction. Science 298, 1219–1221. doi:10.1126/science.1078115
Klemperer, S. L., Zhao, P., Whyte, C. J., Darrah, T. H., Crossey, L. J., Karlstrom, K. E., et al. (2022). Limited underthrusting of India below Tibet: (3)He/(4)He analysis of thermal springs locates the mantle suture in continental collision. Proc. Natl. Acad. Sci. U. S. A. 119, e2113877119. doi:10.1073/pnas.2113877119
Langston, C. A. (1979). Structure under Mount Rainier, Washington, inferred from teleseismic body waves. J. Geophys. Res. 84, 4749. doi:10.1029/JB084iB09p04749
Leahy, G. M., Saltzer, R. L., and Schmedes, J. (2012). Imaging the shallow crust with teleseismic receiver functions. Geophys. J. Int. 191, 627–636. doi:10.1111/j.1365-246X.2012.05615.x
Lee, J., and Whitehouse, M. J. (2007). Onset of mid-crustal extensional flow in southern Tibet: evidence from U/Pb zircon ages. Geology 35, 45–48. doi:10.1130/G22842A.1
Li, C., van der Hilst, R. D., Meltzer, A. S., and Engdahl, E. R. (2008). Subduction of the Indian lithosphere beneath the Tibetan plateau and Burma. Earth Planet. Sci. Lett. 274, 157–168. doi:10.1016/j.epsl.2008.07.016
Li, J., and Song, X. (2018). Tearing of Indian mantle lithosphere from high-resolution seismic images and its implications for lithosphere coupling in southern Tibet. Proc. Natl. Acad. Sci. U. S. A. 115, 8296–8300. doi:10.1073/pnas.1717258115
Lin, F.-C., Li, D., Clayton, R. W., and Hollis, D. (2013). High-resolution 3D shallow crustal structure in Long Beach, California: application of ambient noise tomography on a dense seismic array. Geophysics 78, Q45–Q56. doi:10.1190/geo2012-0453.1
Liu, Z.-C., Wu, F.-Y., Ding, L., Liu, X.-C., Wang, J.-G., and Ji, W.-Q. (2016). Highly fractionated late eocene (∼35 Ma) leucogranite in the xiaru dome, tethyan Himalaya, south Tibet. Lithos 240-243, 337–354. doi:10.1016/j.lithos.2015.11.026
Liu, Z.-C., Wu, F.-Y., Ji, W.-Q., Wang, J.-G., and Liu, C.-Z. (2014). Petrogenesis of the Ramba leucogranite in the Tethyan Himalaya and constraints on the channel flow model. Lithos 208-209, 118–136. doi:10.1016/j.lithos.2014.08.022
Liu, Z.-C., Wu, F.-Y., Qiu, Z.-L., Wang, J.-G., Liu, X.-C., Ji, W.-Q., et al. (2017a). Leucogranite geochronological constraints on the termination of the South Tibetan Detachment in eastern Himalaya. Tectonophysics 721, 106–122. doi:10.1016/j.tecto.2017.08.019
Liu, Z., Tian, X., Gao, R., Wang, G., Wu, Z., Zhou, B., et al. (2017b). New images of the crustal structure beneath eastern Tibet from a high-density seismic array. Earth Planet. Sci. Lett. 480, 33–41. doi:10.1016/j.epsl.2017.09.048
Liu, Z., Tian, X., Yuan, X., Liang, X., Chen, Y., Zhu, G., et al. (2020a). Complex structure of upper mantle beneath the Yadong-Gulu rift in Tibet revealed by S-to-P converted waves. Earth Planet. Sci. Lett. 531, 115954. doi:10.1016/j.epsl.2019.115954
Liu, Z., Wang, J. G., Liu, X. C., Liu, Y., and Lai, Q. Z. (2020b). Middle Miocene ultrapotassic magmatism in the Himalaya: A response to mantle unrooting process beneath the orogen. Terra nova. 33, 240–251. doi:10.1111/ter.12507
Mahéo, G., Guillot, S., Blichert-Toft, J., Rolland, Y., and Pêcher, A. (2002). A slab breakoff model for the Neogene thermal evolution of South Karakorum and South Tibet. Earth Planet. Sci. Lett. 195, 45–58. doi:10.1016/S0012-821X(01)00578-7
Mark Harrison, T., Lovera, O. M., and Grove, M. (1997). New insights into the origin of two contrasting Himalayan granite belts. Geology 25, 899–902. doi:10.1130/0091-7613(1997)025<0899:NIITOO>2.3.CO;2
Mitsuishi, M., Wallis, S. R., Aoya, M., Lee, J., and Wang, Y. (2012). E–W extension at 19 Ma in the Kung Co area, S. Tibet: evidence for contemporaneous E–W and N–S extension in the Himalayan orogen. Earth Planet. Sci. Lett. 325-326, 10–20. doi:10.1016/j.epsl.2011.11.013
Molnar, P., and Chen, W.-P. (1983). Focal depths and fault plane solutions of earthquakes under the Tibetan Plateau. J. Geophys. Res. 88, 1180. doi:10.1029/JB088iB02p01180
Molnar, P., and Tapponnier, P. (1978). Active tectonics of Tibet. J. Geophys. Res. 83, 5361. doi:10.1029/JB083iB11p05361
Murphy, M., Yin, A., Harrison, T., Durr, S., Ryerson, F., Kidd, W., et al. (1997). Did the Indo-Asian collision alone create the Tibetan plateau? Geology 25, 719–722. doi:10.1130/0091-7613(1997)025<0719:DTIACA>2.3.CO;2
Nabelek, J., Hetenyi, G., Vergne, J., Sapkota, S., Kafle, B., Jiang, M., et al. (2009). Underplating in the Himalaya-Tibet collision zone revealed by the Hi-CLIMB experiment. Science 325, 1371–1374. doi:10.1126/science.1167719
Nelson, K. D., Zhao, W., Brown, L., Kuo, J., Che, J., Liu, X., et al. (1996). Partially molten middle crust beneath southern Tibet: synthesis of project INDEPTH results. science 274, 1684–1688. doi:10.1126/science.274.5293.1684
O'Brien, P. J. (2018). Eclogites and other high-pressure rocks in the Himalaya: A review. Geol. Soc. Lond. Spec. Publ. 483, 183–213. doi:10.1144/sp483.13
Pang, Y. J., Zhang, H., Gerya, T. V., Liao, J., Cheng, H. H., and Shi, Y. L. (2018). The mechanism and dynamics of N-S rifting in southern Tibet: insight from 3-D thermomechanical modeling. J. Geophys Res-Sol Ea. 123, 859–877. doi:10.1002/2017jb014011
Rubatto, D., Chakraborty, S., and Dasgupta, S. (2012). Timescales of crustal melting in the Higher Himalayan Crystallines (Sikkim, Eastern Himalaya) inferred from trace element-constrained monazite and zircon chronology. Contributions Mineralogy Petrology 165, 349–372. doi:10.1007/s00410-012-0812-y
Schulte-Pelkum, V., Monsalve, G., Sheehan, A., Pandey, M. R., Sapkota, S., Bilham, R., et al. (2005). Imaging the Indian subcontinent beneath the Himalaya. Nature 435, 1222–1225. doi:10.1038/nature03678
Shi, D., Klemperer, S. L., Shi, J., Wu, Z., and Zhao, W. (2020). Localized foundering of Indian lower crust in the India-Tibet collision zone. Proc. Natl. Acad. Sci. U. S. A. 117, 24742–24747. doi:10.1073/pnas.2000015117
Shi, D., Wu, Z., Klemperer, S. L., Zhao, W., Xue, G., and Su, H. (2015). Receiver function imaging of crustal suture, steep subduction, and mantle wedge in the eastern India–Tibet continental collision zone. Earth Planet. Sci. Lett. 414, 6–15. doi:10.1016/j.epsl.2014.12.055
Sorcar, N., Hoppe, U., Dasgupta, S., and Chakraborty, S. (2014). High-temperature cooling histories of migmatites from the high himalayan crystallines in Sikkim, India: rapid cooling unrelated to exhumation? Contributions Mineralogy Petrology 167, 957. doi:10.1007/s00410-013-0957-3
Styron, R. H., Taylor, M. H., Sundell, K. E., Stockli, D. F., Oalmann, J. A. G., Möller, A., et al. (2013). Miocene initiation and acceleration of extension in the South Lunggar rift, western Tibet: evolution of an active detachment system from structural mapping and (U-Th)/He thermochronology. Tectonics. doi:10.1002/tect.20053
Subedi, S., Hetényi, G., Vergne, J., Bollinger, L., Lyon-Caen, H., Farra, V., et al. (2018). Imaging the Moho and the main himalayan thrust in western Nepal with receiver functions. Geophys. Res. Lett. 45. doi:10.1029/2018gl080911
Tapponnier, P., Zhiqin, X., Roger, F., Meyer, B., Arnaud, N., Wittlinger, G., et al. (2001). Oblique stepwise rise and growth of the Tibet plateau. Science 294, 1671–1677. doi:10.1126/science.105978
Taylor, M., Yin, A., Ryerson, F. J., Kapp, P., and Ding, L. (2003). Conjugate strike-slip faulting along the Bangong-Nujiang suture zone accommodates coeval east-west extension and north-south shortening in the interior of the Tibetan Plateau. Tectonics 22. doi:10.1029/2002tc001361
Tian, X. B., Chen, Y., Tseng, T. L., Klemperer, S. L., Thybo, H., Liu, Z., et al. (2015). Weakly coupled lithospheric extension in southern Tibet. Earth Planet. Sci. Lett. 430, 171–177. doi:10.1016/j.epsl.2015.08.025
Turner, S., Arnaud, N., Liu, J., Rogers, N., Hawkesworth, C., Harris, N., et al. (1996). Post-collision, shoshonitic volcanism on the Tibetan plateau: implications for convective thinning of the lithosphere and the source of ocean island basalts. J. Petrology 37, 45–71. doi:10.1093/petrology/37.1.45
Unsworth, M. J., Jones, A. G., Wei, W., Marquis, G., Gokarn, S. G., Spratt, J. E., et al. (2005). Crustal rheology of the Himalaya and Southern Tibet inferred from magnetotelluric data. Nature 438, 78–81. doi:10.1038/nature04154
Vance, D., and Harris, N. (1999). Timing of prograde metamorphism in the zanskar Himalaya. Geology 27, 395–398. doi:10.1130/0091-7613(1999)027<0395:Topmit>2.3.Co;2
Wang, J.-M., Wu, F.-Y., Rubatto, D., Liu, K., Zhang, J.-J., and Liu, X.-C. (2018). Early Miocene rapid exhumation in southern Tibet: insights from P–T–t–D–magmatism path of Yardoi dome. Lithos 304-307, 38–56. doi:10.1016/j.lithos.2018.02.003
Ward, K. M., Lin, F., and Schmandt, B. (2018). High-resolution receiver function imaging across the cascadia subduction zone using a dense nodal array. Geophys. Res. Lett. 45 (12), 218–212. doi:10.1029/2018gl079903
Webb, A. A. (2011b). Cenozoic tectonic history of the Himachal Himalaya (northwestern India) and its constraints on the formation mechanism of the Himalayan orogen. Geosphere 7, 1013. doi:10.1130/ges00627.1
Webb, A. A. G., Guo, H., Clift, P. D., Husson, L., Müller, T., Costantino, D., et al. (2017). The Himalaya in 3D: slab dynamics controlled mountain building and monsoon intensification. Lithosphere, L636.1. doi:10.1130/l636.1
Webb, A. A. G., Schmitt, A. K., He, D., and Weigand, E. L. (2011a). Structural and geochronological evidence for the leading edge of the Greater Himalayan Crystalline complex in the central Nepal Himalaya. Earth Planet. Sci. Lett. 304, 483–495. doi:10.1016/j.epsl.2011.02.024
Webb, A. A. G., Yin, A., Harrison, T. M., Célérier, J., and Burgess, W. P. (2007). The leading edge of the Greater Himalayan Crystalline complex revealed in the NW Indian Himalaya: implications for the evolution of the Himalayan orogen. Geology 35, 955. doi:10.1130/g23931a.1
Williams, H. M. (2004). Nature of the source regions for post-collisional, potassic magmatism in southern and northern Tibet from geochemical variations and inverse trace element modelling. J. Petrology 45, 555–607. doi:10.1093/petrology/egg094
Williams, H., Turner, S., Kelley, S., and Harris, N.,(2001). Age and composition of dikes in Southern Tibet: new constraints on the timing of east-west extension and its relationship to postcollisional volcanism. Geology. 29, 339–342. doi:10.1130/0091-7613(2001)029<0339:Aacodi>2.0.Co;2
Wittlinger, G., Farra, V., Hetényi, G., Vergne, J., and Nábělek, J. (2009). Seismic velocities in southern Tibet lower crust: A receiver function approach for eclogite detection. Geophys. J. Int. 177, 1037–1049. doi:10.1111/j.1365-246X.2008.04084.x
Wu, C., Tian, X., Xu, T., Liang, X., Chen, Y., Taylor, M., et al. (2019). Deformation of crust and upper mantle in central Tibet caused by the northward subduction and slab tearing of the Indian lithosphere: new evidence based on shear wave splitting measurements. Earth Planet. Sci. Lett. 514, 75–83. doi:10.1016/j.epsl.2019.02.037
Wu, F.-Y., Liu, X.-C., Liu, Z.-C., Wang, R.-C., Xie, L., Wang, J.-M., et al. (2020). Highly fractionated Himalayan leucogranites and associated rare-metal mineralization. Lithos 352-353, 105319–105353. doi:10.1016/j.lithos.2019.105319
Wu, F., Liu, Z., Liu, X., and Ji, W. (2015). Himalayan leucogranite: petrogenesis and implications to orogenesis and plateau uplift. Acta Petrol Sin. 31, 1–36. doi:10.1016/j.jseaes.2014.10.014
Xu, B., Griffin, W. L., Xiong, Q., Hou, Z. Q., O'Reilly, S. Y., Guo, Z., et al. (2017a). Ultrapotassic rocks and xenoliths from South Tibet: contrasting styles of interaction between lithospheric mantle and asthenosphere during continental collision. Geology 45, 51–54. doi:10.1130/G38466.1
Xu, M., Huang, H., Huang, Z., Wang, P., Wang, L., Xu, M., et al. (2018). Insight into the subducted Indian slab and origin of the Tengchong volcano in SE Tibet from receiver function analysis. Earth Planet. Sci. Lett. 482, 567–579. doi:10.1016/j.epsl.2017.11.048
Xu, Q., Zhao, J., Yuan, X., Liu, H., and Pei, S. (2017b). Detailed configuration of the underthrusting Indian lithosphere beneath western Tibet revealed by receiver function images. J. Geophys. Res. Solid Earth 122, 8257–8269. doi:10.1002/2017jb014490
Xu, Z., Wang, Q., Pêcher, A., Liang, F., Qi, X., Cai, Z., et al. (2013). Orogen-parallel ductile extension and extrusion of the Greater Himalaya in the late Oligocene and Miocene. Tectonics 32, 191–215. doi:10.1002/tect.20021
Yang, Y., Ritzwoller, M. H., Zheng, Y., Shen, W., Levshin, A. L., and Xie, Z. (2012). A synoptic view of the distribution and connectivity of the mid-crustal low velocity zone beneath Tibet. J. Geophys. Res. Solid Earth 117. doi:10.1029/2011jb008810
Yin, A. (2006). Cenozoic tectonic evolution of the Himalayan orogen as constrained by along-strike variation of structural geometry, exhumation history, and foreland sedimentation. Earth-Science Rev. 76, 1–131. doi:10.1016/j.earscirev.2005.05.004
Yin, A., and Harrison, T. M. (2000). Geologic evolution of the Himalayan-Tibetan orogen. Annu. Rev. Earth Planet. Sci. 28, 211–280. doi:10.1146/annurev.earth.28.1.211
Yin, A. (2000). Mode of Cenozoic east-west extension in Tibet suggesting a common origin of rifts in Asia during the Indo-Asian collision. J. Geophys. Res. Solid Earth 105, 21745–21759. doi:10.1029/2000jb900168
Yin, A., and Taylor, M. H. (2011). Mechanics of V-shaped conjugate strike-slip faults and the corresponding continuum mode of continental deformation. Geol. Soc. Am. Bull. 123, 1798–1821. doi:10.1130/B30159.1
Zhang, K. J., Zhang, Y. X., Tang, X. C., and Xia, B. (2012). Late Mesozoic tectonic evolution and growth of the Tibetan plateau prior to the Indo-Asian collision. Earth-Science Rev. 114, 236–249. doi:10.1016/j.earscirev.2012.06.001
Zhang, R., Wu, Q., Sun, L., He, J., and Gao, Z. (2014). Crustal and lithospheric structure of Northeast China from S-wave receiver functions. Earth Planet. Sci. Lett. 401, 196–205. doi:10.1016/j.epsl.2014.06.017
Zhang, Z., Xiang, H., Dong, X., Li, W., Ding, H., Gou, Z., et al. (2017). Oligocene HP metamorphism and anatexis of the higher himalayan crystalline sequence in yadong region, east-central Himalaya. Gondwana Res. 41, 173–187. doi:10.1016/j.gr.2015.03.002
Zhao, Z. D., Mo, X. X., Dilek, Y., Niu, Y. L., DePaolo, D. J., Robinson, P., et al. (2009). Geochemical and Sr-Nd-Pb-O isotopic compositions of the post-collisional ultrapotassic magmatism in SW Tibet: petrogenesis and implications for India intra-continental subduction beneath southern Tibet. Lithos 113, 190–212. doi:10.1016/j.lithos.2009.02.004
Zhu, L. (2000a). Crustal structure across the San Andreas Fault, southern California from teleseismic converted waves. Earth Planet. Sci. Lett. 179, 183–190. doi:10.1016/S0012-821x(00)00101-1
Keywords: north-trending rifts, receiver function, Cona rift, dense seismic array, Moho offset
Citation: Xiang B, Xu X, Tong X, Wu J, Li C, Yu J, Luo X and Guo X (2023) Lithospheric structures of the eastern Himalayas as revealed by receiver function analysis. Front. Earth Sci. 11:1252670. doi: 10.3389/feart.2023.1252670
Received: 04 July 2023; Accepted: 21 August 2023;
Published: 30 August 2023.
Edited by:
Tao Xu, Chinese Academy of Sciences (CAS), ChinaReviewed by:
Wenhui Li, Chinese Academy of Geological Sciences (CAGS), ChinaZhen Guo, Southern University of Science and Technology, China
Copyright © 2023 Xiang, Xu, Tong, Wu, Li, Yu, Luo and Guo. This is an open-access article distributed under the terms of the Creative Commons Attribution License (CC BY). The use, distribution or reproduction in other forums is permitted, provided the original author(s) and the copyright owner(s) are credited and that the original publication in this journal is cited, in accordance with accepted academic practice. No use, distribution or reproduction is permitted which does not comply with these terms.
*Correspondence: Xiao Xu, eHV4aWFvOEBtYWlsLnN5c3UuZWR1LmNu