 Kamal Abdelrahman
 Abdullah M. Al-Amri1,2
- 1Department of Geology and Geophysics, College of Science, King Saud University, Riyadh, Saudi Arabia
- 2Seismic Studies Center, College of Science, King Saud University, Riyadh, Saudi Arabia
Many people are killed by landslides due to earthquakes or severe rain, and structures and facilities built on or near slopes sustain significant damage. Such landslides on naturally occurring slopes can be large enough to utterly destroy towns or communities. Based on remote sensing and microtremor data, the area around Al Taif has been evaluated for its susceptibility to landslides. Digital elevation model (DEM), slope angle, and slope aspect thematic layers were used to depict remote sensing data. The landslide susceptibility was extracted from remote sensing thematic data. The elevations of the Al Taif area, which range from 832 to 2,594 m amsl, were identified based on the DEM. Al Taif’s slope angles range from 0° to 67.3° degrees. Nearly flat (0° to 4.75°), moderate (4.75° to 11.1°), steep (11.2° to 29.1°), and very steep slope (≤29.1°) are the different classifications for the slope. Additionally, measurements of the microtremor have been taken at 42 locations throughout the region. The horizontal-to-vertical spectral ratio (HVSR) approach was used to process and analyze microtremor data in order to determine the resonance frequency and H/V amplification factor. The findings show that, while the amplification factor varies from 1.17 to 9.28, the dominant frequency values fall between 0.3 and 12.75 Hz. To determine the frequency, amplitude, and azimuthal site response, 11 sites were eventually chosen. Furthermore, the direction of the site response in the sliding areas was parallel to the landslide directional response, indicating that the site response direction tracked the landslide direction. Practical approval of the study’s findings has been given at a number of locations by field measurements at some of the Taif urban area’s most recent landslide occurrence areas. These findings show that the integration between remote sensing and microtremor measurements is a useful tool for pinpointing landslide-prone areas, which helps to lessen the danger to people’s lives and property. This susceptibility zonation applied to the Al Taif area has produced a good match between the distribution of the reported landslides and the zones of high susceptibility. To define the general trend and geographic distribution of potentially unstable slopes and landslide potential zones, this study’s findings must be used as a guide.
1 Introduction
The most dangerous natural instability processes, including landslides, cause significant socioeconomic losses and property destruction each year throughout the world (Heersink, 2005; Petley, 2012; Froude and Petley, 2018; Haque et al., 2019). One of the main sources of damage to buildings and infrastructure, as well as injuries and fatalities in mountainous and hilly areas, are shallow landslides and debris flows, which are typically brought on by brief but intense rainstorms. Unlike debris flows, shallow landslides often include tiny quantities. However, due to their extensive spatial distribution over territories, quick development, and high velocity of dissemination, both can cause a great deal of harm (Hungr et al., 2014; Roccati et al., 2021). Accordingly, landslide susceptibility assessment and mapping are crucial tools in landslide risk management, assisting authorities, practitioners, and decision-makers in developing risk mitigation strategies that are more appropriate and sustainable, including the implementation of monitoring and warning systems (Dai et al., 2002; Cascini et al., 2005; Corominas et al., 2014).
Landslides have been studied using a variety of techniques to define their geometry and gather data on their stability conditions and state of activity (Petley, 2012; Al-Otaibi, 2019; Kahal et al., 2021). These techniques can typically be divided into two groups: intrusive techniques, such as boreholes, soil samples, and laboratory testing, and non-intrusive techniques, such as geophysical techniques. The latter’s use for subsurface characterization, localizing sliding surfaces, assessing the formation and evolution of cracks, comprehending water dynamics, and potential reactivation by rains has expanded rapidly (Pazzi et al., 2019). In order to define landslide ground models and afterward perform slope stability evaluation, the data from geophysical surveys are used as input (Whiteley et al., 2019).
Slope instabilities (landslides or rock falls) can be caused by a wide range of occurrences, including heavy rain, quick snowmelt, human-caused activities, and seismic events (Cruden and Varnes, 1996). Due to their enormous potential for destruction, these phenomena-especially those brought on by earthquakes-affect many parts of the world and are quite noteworthy. The losses resulting from earthquake damage are currently difficult to estimate. Traditional techniques rely on their estimates of the cost of such damage on the repair and restoration of buildings, without accounting for economic losses resulting from the loss of economic activity and human lives (Cardone et al., 2019). Therefore, seismic hazards in inhabited areas need to minimize the consequences and phenomena linked to strong ground vibrations. This is done so that the inherent seismic hazard may be calculated by looking at historical events as well as the geological and geotechnical conditions of regions that are likely to suffer a seismic event (Abdel-Rahman et al., 2010; Fat-Helbary et al., 2012; Harutoonian, 2015; Abdelrahman et al., 2017; Abdelrahman et al., 2021a; Abdelrahman et al., 2021b; Alamri et al., 2020; Almadani et al., 2020). Co-seismic landslides, which are aftershocks of earthquakes, are essential for pinpointing prior seismic occurrences and enhancing seismic hazard forecasts (Jibson, 1996). These landslides offer significant real-time geological evidence that enables researchers to recreate a region’s seismic catalog and better comprehend previous seismic activity (Rodrguez-Peces et al., 2011). The accuracy of seismic hazard predictions can be improved by increasing the dataset available for seismic analysis, which in turn helps to increase community resilience against seismic occurrences in the future.
Landslides are extremely damaging natural disasters that have a negative impact on social and economic development, as well as the safety of human life and property (Hungr et al., 2014; Wang et al., 2020). According to Gokceoglu et al. (2005) and Fang et al. (2023), landslides make up about 9% of all-natural disasters that occur worldwide, and China is one of the nations that is most seriously and extensively affected by landslide catastrophes. Landslides typically occur in mountainous and hilly areas. According to Hong et al. (2016) and Lacroix et al. (2020), landslide susceptibility mapping (LSM) is a technique for quantitatively predicting the spatial distribution of landslide susceptibility in a region by combining regional topography, geological structures, hydro-meteorology, and other characteristics. Statistical models, such as entropy, have been mostly used in earlier studies on LSM (Lee et al., 2014; Guo et al., 2019; Sun et al., 2021; Sun et al., 2023).
It is crucial to assess and identify landslide-prone locations using various landslide susceptibility mapping techniques for proper and strategic land use planning. As it demonstrates the level of susceptibility of a region to the occurrence of landslides, creating a map of a specific area’s landslide susceptibility is a useful tool in managing landslide hazards. The assumption that future landslides would occur under the same circumstances as in the past allows for the generation of landslide susceptibility maps (Pham et al., 2015). Understanding the circumstances and mechanisms that govern landslides in the research area is necessary for interpreting their likely future occurrence. By integrating these conditioning elements and past landslides in a GIS context, the essential characteristics to measure and evaluate landslide susceptibility include past landslides and other conditioning factors, such as slope morphology, hydrogeology, and geology of the area. Several researchers have employed GIS-based landslip susceptibility mapping techniques, which may be divided into qualitative and quantitative ones (Yalcin et al., 2011; Felicisimo et al., 2012; Peng et al., 2014; Wang and Li, 2017). Geomorphological analysis and inventory techniques are examples of qualitative methodologies. These rely more on expert opinion and are more individualized than quantitative approaches. In order to build and execute mathematical models, expertise is still required (Aleotti and Chowdhury, 1999; Kanungo et al., 2009). Quantitative methods such as deterministic analysis, probabilistic approaches, and statistical procedures heavily rely on these models because they have considerably less human bias.
Landslides and their dynamics can be mapped using HVSR, which is both economical and logistically effective (D'Amico et al., 2019). It offers details on the geomorphological, engineering, and geological aspects' resonance behaviors. It has been used widely in the assessment of landslide hazards and vulnerability to various triggering variables, such as earthquakes and rainfalls (Hussain et al., 2019). But as is the situation with a clayey landslide, rainfall-induced saturation lowers impedance contrast by causing changes in the rheology of the overlying unconsolidated material. The investigation of the seasonal dynamics of rainfall-triggered landslides using HVSR is based on this (Imposa et al., 2017; Bertello et al., 2018). Other environmental studies that have used HVSR include monitoring of fluvial systems (Anthony et al., 2018), estimation of changes in ice thickness (Martino, 2016; D'Amico et al., 2019; Picotti et al., 2017) and its dynamics (Köhler et al., 2015). As shown in numerous research (Burjánek et al., 2010; Del Gaudio and Wasowski, 2011; Panzera et al., 2012; Galea et al., 2014; Iannucci et al., 2017; Imposa et al., 2017; Iannucci et al., 2018), HVSR can indicate the directional influence for landslide-affected areas. Additionally, HVSR has been used for a number of purposes, such as site effect response and microzonation, seismic vulnerability assessment, and soil-structure response (Fnais et al., 2010; Fnais et al., 2015a; Fnais et al., 2015b; Alyousef et al., 2015a; Alyousef et al., 2015b; Almadani et al., 2015; Alharbi et al., 2015; Al-Malki et al., 2015; Aldahri et al., 2018.
Al Taif area lies in the southwest of Saudi Arabia and is surrounded by arid terrain and high mountains with steep slopes (Figure 1). In Saudi Arabia, Makkah City is located around 80 km to southeast of Al Taif City. The study area is bounded by longitudes 40° 00′ and 40° 30′E and latitudes 21° 00′ to 21° 30′ N. The city’s recent growth has been determined by this mountainous area. Low-land zones are where urban infrastructure and communities are extended. The native rock is used to construct traditional dwellings. Taif receives rain from the higher edges along the terrain’s slopes. These slopes will be more exposed if they are close to the main roadways. Permanent people who reside along the City’s natural slopes live in areas with a high population density. The Al-Sharai’a earthquake on 8 October 1992, the non-tectonic seismic shock on 12 September 2005, and most recently the earthquake on 28 November 2019, have had a huge impact on Makkah. These earthquakes had a dangerous impact and were felt throughout the majority of the region (Abdelrahman et al., 2019a; Abdelrahman et al., 2019b). Additionally, the city’s proximity to possibly active tectonic structures will make it more susceptible to the landslide phenomenon because it will operate as a more vulnerable place. The disastrous impacts of landslides are readily acknowledged and intensively investigated by several authors worldwide (Mora and Vahrson, 1994; Aleotti and Chowdhury, 1999; Mora-Castro et al., 2012; Somos-Valenzuela et al., 2018; Al-Saud, 2015; Youssef et al., 2015a; Youssef et al., 2015b; Shanmugam and Wang, 2015; Berov et al., 2016; Saputra et al., 2016; Keskinsezer and Ersin, 2019). Gaudio and Wasowski (2007), Rezaei et al. (2018), and Zul Bahrum and Sugianto (2018) have all given their approval for microtremor measurements at some locations around the world.
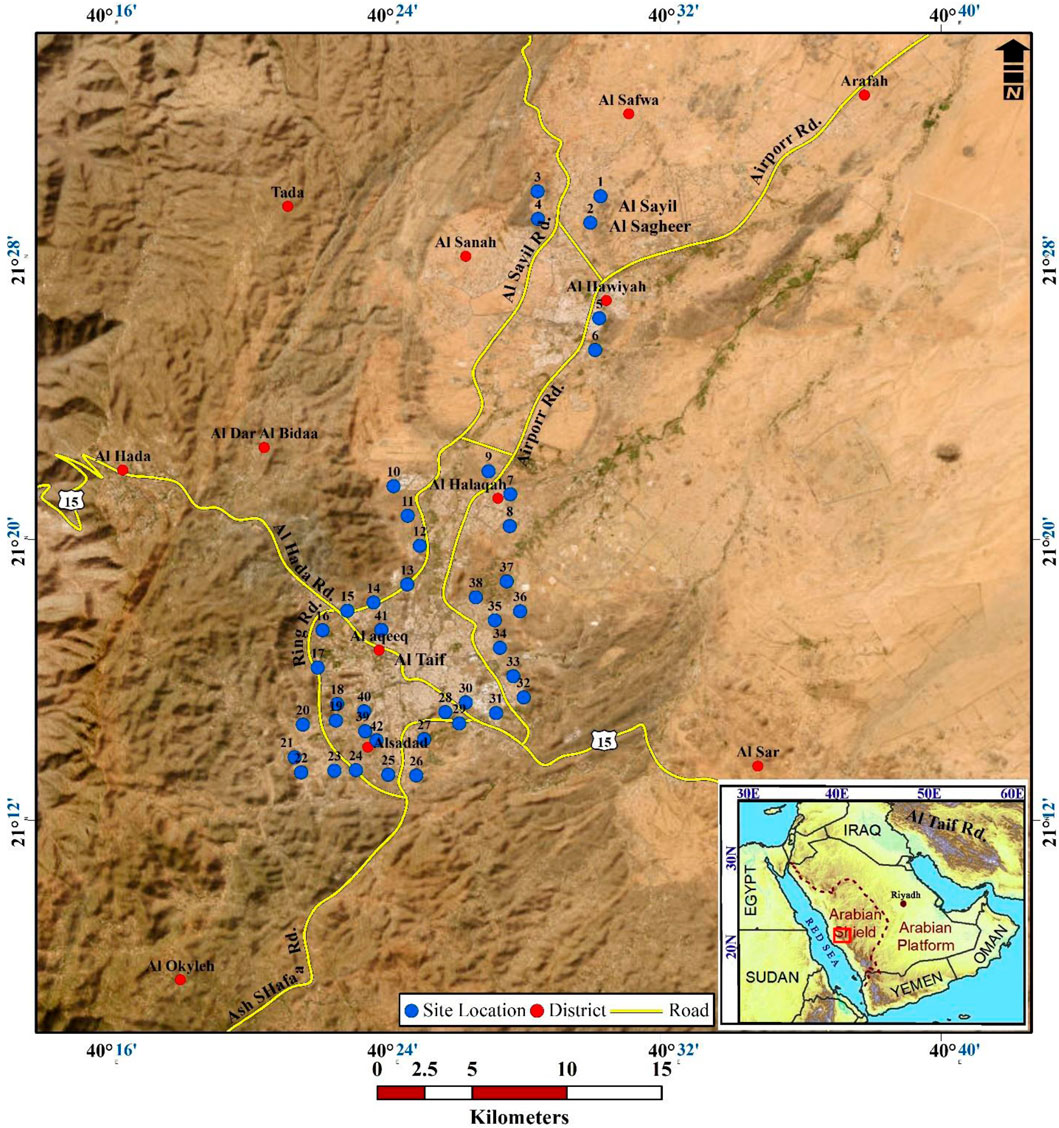
FIGURE 1. Location map of Al Taif area including Microtremor measuring sites.
For the city of Al Taif, where soft soil, even with little thickness, will expedite landslide occurrences and cause significant harm to the populace, soil response effects, such as resonance frequency and amplification characteristics, are crucial. Al Taif can effectively transmit the earthquake’s ground shaking because of its proximity to the Red Sea earthquake source zone. The susceptibility of landslides will be increased by soft sediments and weathered, broken blocks. Therefore, assessing Al Taif’s landslide susceptibility is essential given the area’s growing population, buildings, and impressive economic activity. The study area has never been investigated before, especially in terms of the environmental risks associated with landslides, which makes this study novel. Additionally, integration between two of the most recent techniques for mitigation of landslide hazards, namely, the two remote sensing techniques with the ambient seismic noise measurements, microtremors, in the area. With the help of this innovative technique, we hope to pinpoint Al Taif region’s landslide-prone areas so that they can be avoided in future plans of developmental projects in the area and its surrounding with the best land-use and urban planning.
2 Materials and methods
The data used in this study will be integrated through a GIS-based approach and the methodology carried out through this study as in Figure 2.
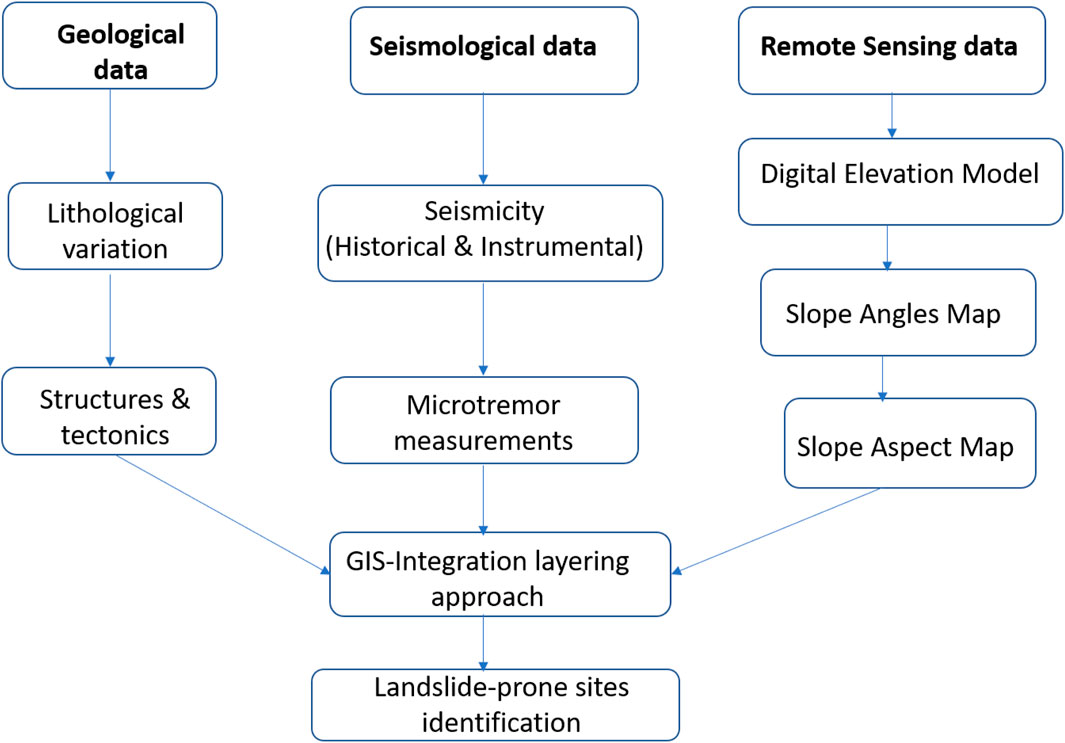
FIGURE 2. The flowchart methodology carried out through the current study.
2.1 Geological setting of Al Taif area
The Proterozoic Arabian Shield is where the inquiry region is located geologically. The earliest radiometrically dated rocks in the study area are syn-tectonic granites and granodiorites with many inclusions and xenoliths (Johnson, 1982). These mostly come from the granitization of volcanic and schist rocks. These rocks' age determinations point to a plutonic phase that was contemporaneous with or somewhat earlier than the African Kibaran Orogeny. Andesites, diabases, and amphibolite schists of an even older provenance are separated from these rocks by an unconformity and frequently encroach upon them. The latter amphibolite schists are found in sections of Taft, the northeastern zones around Wadi Hawrah, and the southeast side of Wadi Fatimah (Johnson, 1982). The so-called Wadi Fatimah Formation, which is comprised of smaller outcrops of newer Upper Proterozoic layered rocks, is also present in the Wadi Fatimah. Unmetamorphosed granites intrude into these series as stocks, elliptical plugs, and ring dykes. The Hijaz and Najd orogeneses, each with more than one phase of folding and igneous activity, have had an impact on the basement series. The Hijaz orogeny, which is the oldest of the two, is more extensive and intense in terms of age and space. According to Alwash and Zakir. (1992), the orogeny was characterized by east-west compression, with the severely folded, faulted, and locally overthrust beds emerging in meridian or north-northeast oriented bands and lineaments.
The younger period of mountain-building and canonization is associated with the Najd orogeny. A sequence of left-lateral faults that are northwest-trending best illustrates the effects of the younger and shallower motions. The Arabian plate (Brown, 1972), a relatively small lithospheric plate whose limits indicate several types of plate boundaries according to the terminology of plate tectonics, became significant for the geological evolution after a period of rather stable geology (Barazangi, 1981). The Red Sea rift system is relevant to the study area. The many basalt plateaus, including Harrat Rahat, with the widest extension on the Saudi Arabian subcontinent, came into being as a result of the spreading along this line throughout Tertiary to Quaternary, even in historic times. Numerous seismic events that were recorded in recent years provide evidence of the recent displacement in the Red Sea Graben (Moore and Al-Rehaili, 1989).
The escarpment west of the city of Al Taif is the most noticeable geomorphologic feature of the investigation area. Within the Hijaz mountains, it is a key geomorphological stage that is influenced by tectonic forces. As a result, although those around Taif are 2000 m or higher, the mountain peaks of the coastal ridges near Jeddah and Makkah have an average elevation of 300–500 m. The Al Taif region is mountainous and is divided by some rivers that go west. Precambrian metasediments and intrusive igneous rocks from the Arabian Shield were present in the study area, and these rocks were buried by quaternary sediments (Figure 3). Asir, Al-Hijaz, Madyan, Afif, and Ar-Rayan are the five terranes that make up the Arabian Shield. Bir-Omq, Yanbu, Nabitah, and Al-Amar are the four suture zones that divide them (Al-Shanti, 1993; Bishta et al., 2015). The study location is situated in Asir Terrane’s northwest region. Diorite, Granodiorite, and Monzogranite make up the majority of the plutonic rocks in the examined region. Joints and small faults are the most prevalent geological structural characteristics in the study area (Sharaf, 2010).
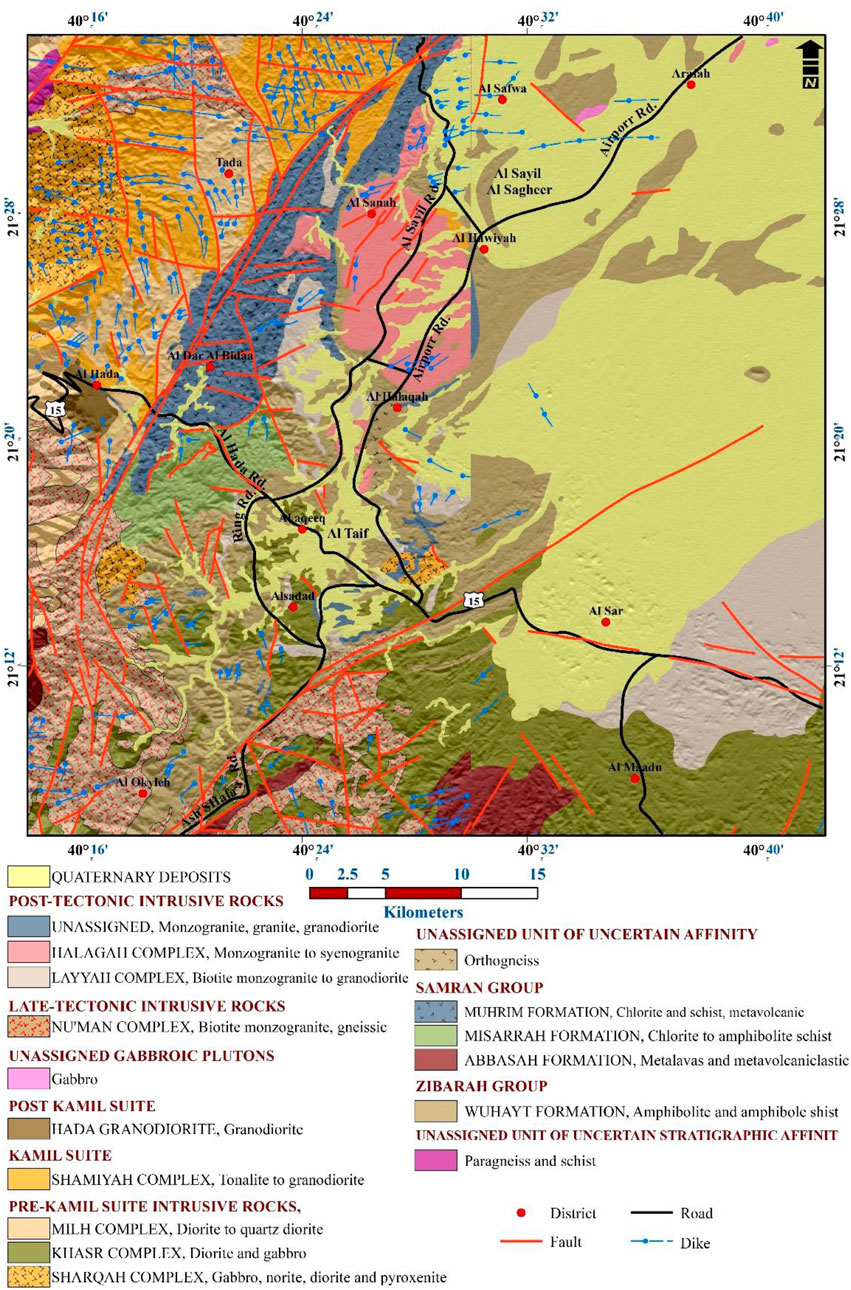
FIGURE 3. Geological setting of Al Taif area (modified after Al-Shanti, 1993; Bishta et al., 2015).
A stunning characteristic in the nearby Wadi Fatimah is the horst-graben and step-faulting nature of Red Sea Rift fracturing (Al Shanti, 1966; Nebert et al., 1974). Along these faults, strike-slip and oblique movements also happened. In the Shumaysi region, a thorough inventory of regional and local faults by Al Shanti. (1966) revealed that horst-graben structures with an NW-NNW trend and a range of steepness from mild to extreme predominate. These, according to Al-Shanti (1966), are separated from NNW trending Red Sea Rift fractures by N 15°E − N 40°E moving faults. However, a few distinctive gabbroic dykes in the region that cut through all other mafic and felsic dykes are tentatively thought to be connected to late volcanism. Some E-W cracks seem to have occurred simultaneously. They might be cross Joints associated with the longitudinal N-S set. Hot springs are found along N-S cracks at A1 Lith, south of the catchment region (Loupoukhine and Stieltjes, 1974).
Andesite dykes were reported by Al Subai. (1984) along N-S and E-W trending fractures. Rift volcanism is typical of Andesites. Therefore, these dykes might be a part of a Precambrian swarm. The lack of analysis leaves opens the possibility that the dykes are from Tertiary basalt volcanism. In the Al Hara region, Abo Saada. (1982); reported in Al Saifi et al., (1983) assessed 2400 Joints and found that they were ENE/dip SE; NW/SW and NE; EW/gentle to subhorizontal; and NS/vertical. In the Taif area, granites exhibited a prevalence of NS and EW orientations, according to Andreasson et al. (1977) who conducted a comprehensive fracture survey over a 1 km2 area.
2.2 Seismicity and seismotectonic setting of Al Taif area
According to Merghelani and Gallanthine. (1981), Al Taif area lies close to the seismically active tectonic environment of the Red Sea (Figure 4). There have been earthquakes near Al Taif that were both historical and useful. According to Ambraseys et al. (2005), there were numerous earthquakes in 873, 1121, 1269, 1408, and 1426 AD. An incident that occurred on 28 September 1993 (12/4/1413H), which occurred 30 km northeast of the Holy Mosque in the Al-Sharai’a district, proved Makkah Al-Mukarramah’s earthquake sensitivity. A series of minor earthquakes are reported by the Saudi Geological Survey’s seismic network after the 3.6 magnitude shock. On 3 October 1993, an earthquake swarm with a magnitude of 4.1 ML occurred at Al-Sharai’a (Al Furaih et al., 1994; Wolfs, 1994). On 18 June 1994, an earthquake with a magnitude of 3.6 was recorded nearby in the Al Utaibiyya District on 8/8/1426H. The shallowness and predictability of this earthquake are indicated by its limited geographic possibility.
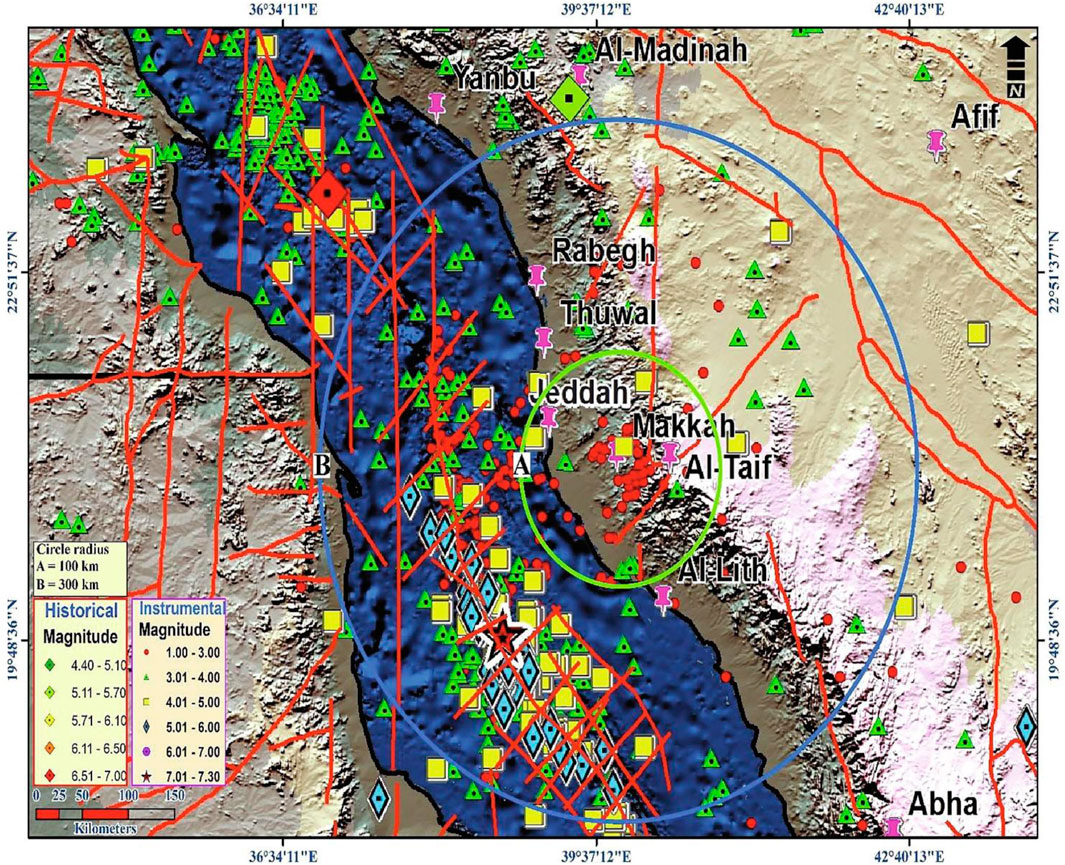
FIGURE 4. Seismicity around Al Taif area (after Fnais et al., 2015b).
The seismicity and seismotectonic context of the Jeddah-Makkah region are discussed by Fnais et al. (2015a). They compiled historical and scientifically verified information about earthquakes that occurred in the Jeddah-Makkah region from a variety of sources and organized it into a single earthquake catalog. In the Makkah region, five seismotectonic source zones were found (Figure 3). Three zones-the northwest, western, and southwest of Jeddah-are along the Red Sea axial trend, while the Thuwal-Rebigh and Jeddah-Makkah zones are located inland. Wherever the zone incorporates tectonic trends, it may be said that the Jeddah-Makkah source zone is the most vulnerable source of the investigated region. The first one is Wadi Fatima, which is 50 km long and 10 km wide and represents the primary fault-bounded graben. The main graben’s NE-SW faulting trend, which is divided by a number of faults from the Red Sea’s primary tectonics in the NW-SE, is preexisting (Al-Garni, 2009). The location is part of a conjugate set of tertiary ruptures, according to the NNE fractures. To the south of Jeddah, the Wadi Fatima route extends ENE-WSW. Due to active faults, it abruptly turns northward (Azzedine et al., 1998). The Ad-Damm active fault, a significant fault trend located in the Jeddah-Makkah region, is the secondary trend.
2.3 Remote sensing data
2.3.1 Digital elevation model
The elevation data that are geographically referenced are the most critical and crucial data used in morphometric investigations. Topographic maps or their digital equivalents are the most commonly used data sets as a result. In a basic sense (DEMs) are topographic analogs and are useful for researching spatially distributed events and processes on the earth’s surface. DEMs provide a 3D picture of the earth’s surface topography at a local and smaller scale. Similar to the present landslide inventory, the geographical evaluation of the landslide danger necessitates rigorous mapping of the regulating components. One of the most well-known and frequently used methods for obtaining the characteristics of landslides is the use of remote sensing techniques with multi-spectral, spatial, and radiometric solutions. The final, highest-resolution DEM of Earth was created by the Shuttle Radar Topography Mission (SRTM). In order to obtain advanced topographic information with a 1 arc-sec precision, it used double radar aerials to acquire interferometric radar data (Farr et al., 2007). The primary dataset used to create topographic derivative maps is the high resolution (DEMs). Higher-resolution data may make it easier to discover future landslides and provide more information on existing landslides.
A Digital Elevation Model (DEM) is crucial to the current study’s ability to anticipate a model of landslide susceptibility and to determine the elevation, slope aspect, and slope angle thematic layers. The nonlinear regression graph created by the DEM model created by Gao and Los (1995) depicts the correlation between elevations and landslides. To assess the likelihood of landslides, an elevation map was created based on the Gao and Lo model using map algebra in ArcMap 10.2. The elevations of the Al Taif area, which range from 832 to 2,594 m AMSL, were identified based on the DEM (Figure 5).
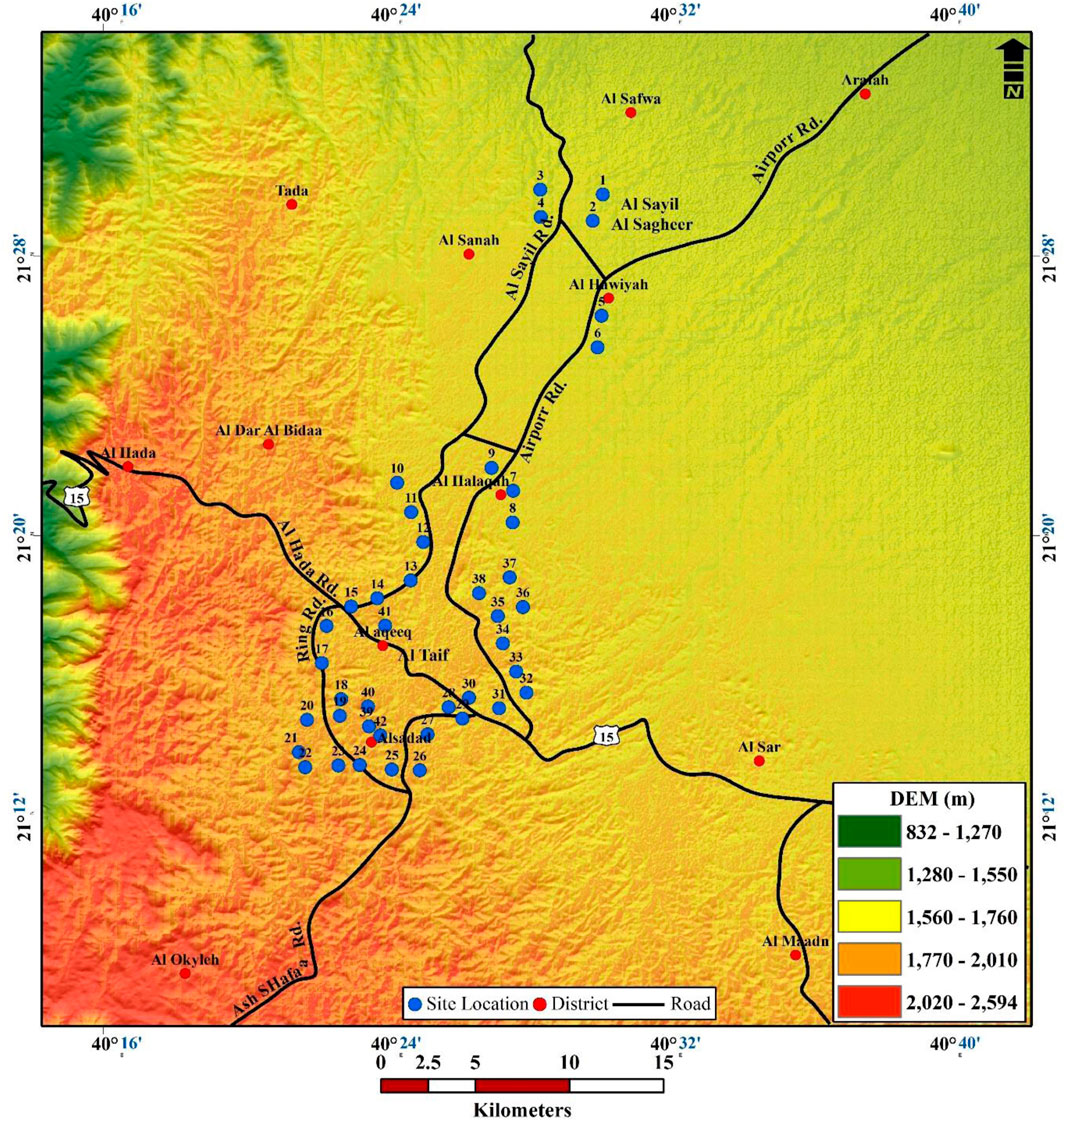
FIGURE 5. Digital elevation model (DEM) for the mapped area.
2.3.2 Slope angles map
A land region that forms the vertical landscape at a specific angle is called a slope. Slope units make up the geomorphology landscape. The slope is commonly represented in degrees, stands with the horizontal line, and can be thought of as the vertical inclination between the top of the hill and the bottom of the valley. Slope gradient is one of the key parameters for slope stability, but slope angle is also important when assessing landslide stability. Because they have lower shear stresses than steep slopes (Dai et al., 2002), gentle slopes are less likely to slide, whereas steep slopes have larger shear stresses. Many writers (Çevikevik and Topal, 2003; Lee et al., 2014; Yalcin et al., 2011; Pourghasemi et al., 2013a; Pourghasemi et al., 2013b; Regmi et al., 2014) use the slope angle factor for landslide susceptibility mapping. According to Varnes (1984), the rising the slope gradient, the more gravity-induced shear pressure there is in colluvial soils, which leads to the development of landslides (2012) Mora-Castro et al. Therefore, the slope’s angle is a key element that causes landslides and needs to be mapped (Anbalagan, 1992). According to Varnes. (1984), the slope is the key determining element in the development of landslides. According to Mora-Castro et al. (2012), as the gravity-induced shear pressure in colluvial soils increases, so does the slope gradient. The kind of rock in the mapped area and its control over the makeup of superficial deposits have a direct impact on the slope angle. Relief impacts were noted by the alternating compacted layers of sedimentary rocks. The initial extraction of elevation is the slope gradient, which was therefore also retrieved from the (DEM) at a 30-m resolution.
In this study, the slope gradient ranges from 0o to 67.3o, and the slope angle map for Al Taif area has been determined (Figure 6). Nearly flat (0o to 4.75o), moderate (4.75o to 11.1o), steep (11.2o to 29.1o), and very steep slope (≤29.1o) are the different classifications for the slope.
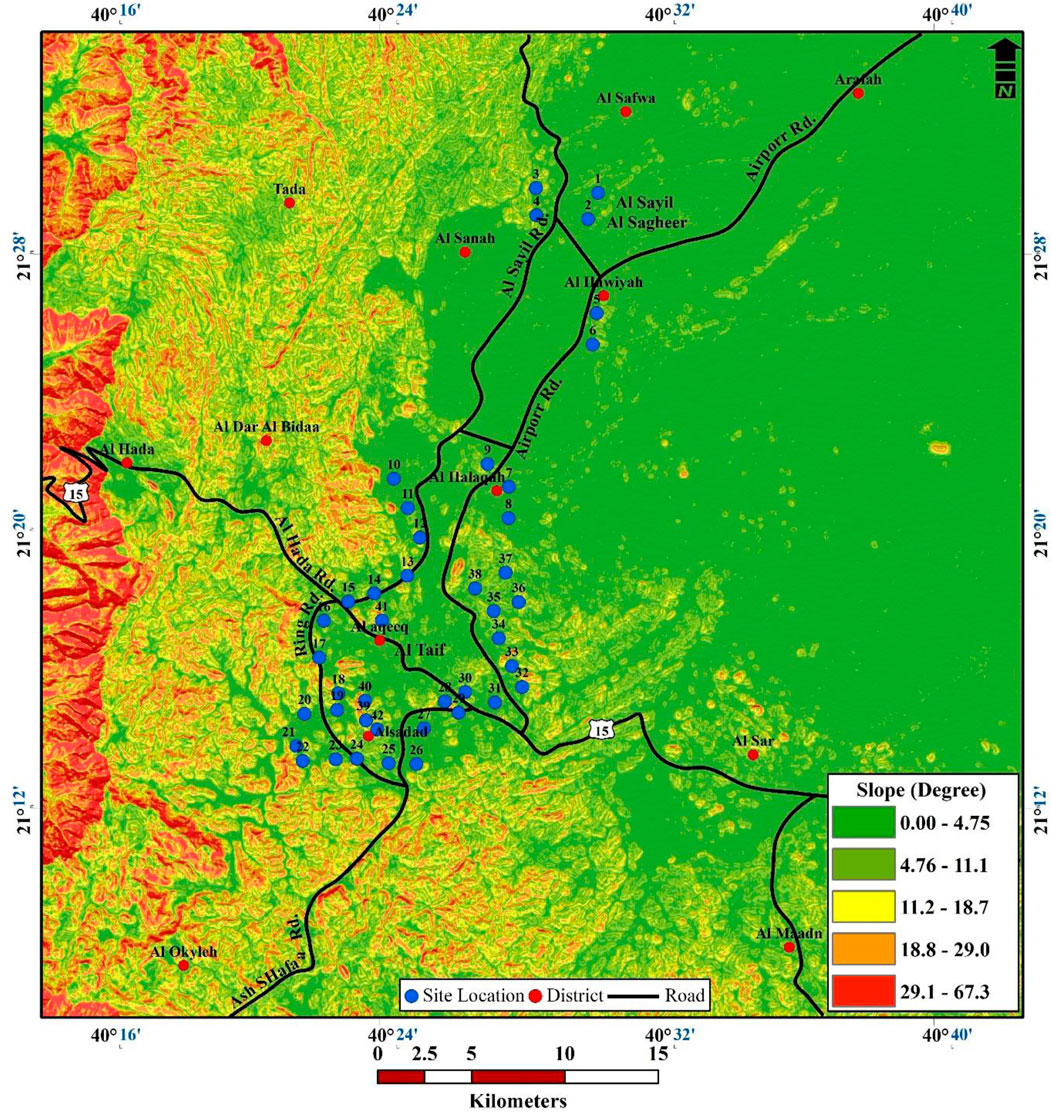
FIGURE 6. The slope angle distribution within the area of study.
2.3.3 Slope aspect map
Another feature that was retrieved from the DEM with a 10-m spatial resolution was the slope aspect, which describes the horizontal direction of mountain slope faces. The slope aspect was considered a contributing element in landslides in several research (Saha et al., 2005; Lee et al., 2014; Yalcin et al., 2011). According to Deng et al. (2007), aspect is the direction of the steepest descending line and is expressed in degrees. It is commonly calculated clockwise from the north. The slope-facing direction is referred to as the aspect. It establishes the slope direction of the area’s sharpest downslope on any surface. It could be seen as the slope orientation or the compass’s facing-hill orientation. Every unit in rasters has its aspect measured (Wilson and Gallant, 2000; Deng et al., 2007). The predicted direction is clockwise, going from zero (directly north) to 360 (further, directly north, making a full circle). In an aspect of data collection, each cell’s value represents the direction that confronts the slope of the cell (Wilson and Gallant, 2000; Deng et al., 2007). Figure 7 shows the aspect map that was created using the zone’s gridded DEM. The morphologic and meteorological characteristics of the site are influenced by this layer. The most frequent landslides are found on slopes that face north (N), northwest (NW), and northeast (NE), according to the field survey and literature research. As a result, the aspect slope was divided into five categories: very high (N and NE), high (NW and SW), moderate (S and SE), low (W and E), and very low (flat surface) in accordance with the directions prone to landslides.
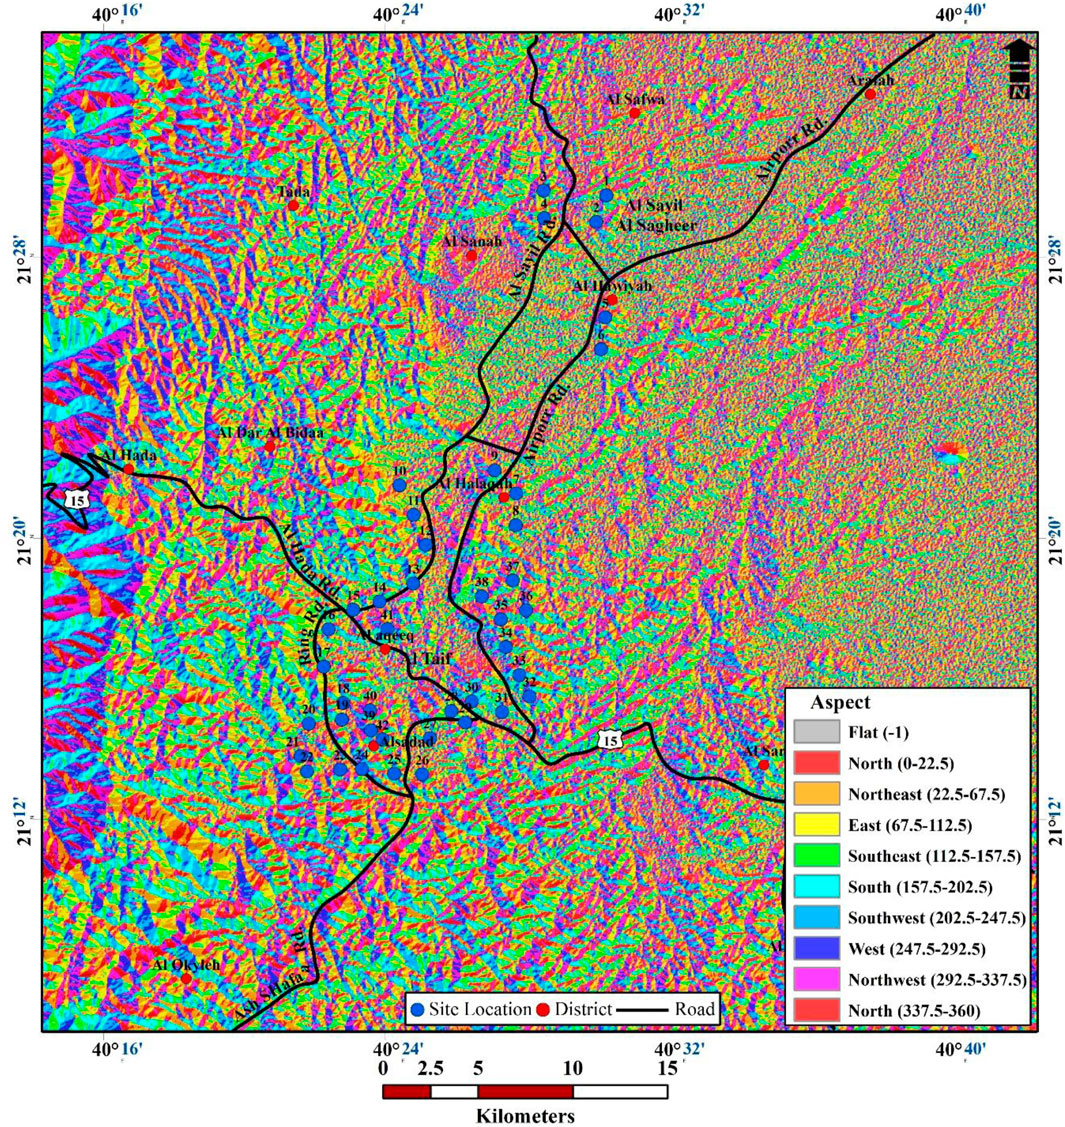
FIGURE 7. Extracted slope aspect map from gridded DEM of the area.
2.3.4 HVSR approach
Nogoshi and Igarashi. (1970) claim that in order to accurately estimate the soil resonance frequency, which is here predicated on the fundamentally Rayleigh-wave character of microtremors, a few minutes of seismic background noise must be recorded. For a single station, the researchers calculate the spectral ratio of the horizontal and vertical components of the microtremor measurement. The generated curves identify a frequency that is thought to fit remarkably with the place under study’s S-wave resonance frequency. Later, Nakamura. (1989) improved this method, arguing that due to the main body wave character of the noise, this HVSR is a trustworthy evaluation of the site transfer function for S-waves with regard to bedrock. Numerous studies conducted in recent years have demonstrated that the H/V ratio of a microtremor is much more stable than the raw noise spectrum and that it displays a distinct peak that is closely correlated with the fundamental resonance frequency when there is a large impedance difference between the surface and deep materials (Field and Jacob, 1993; Duval et al., 1994; Duval et al., 1995). We examine recent studies that have looked into this technique (Bard, 1994; Kudo, 1995; Bard, 1998; Duval et al., 2001).
3 Microtremor data collection
Forty-two locations were used to measure the microtremors throughout the study area (Figure 1). The SESAME team’s recommendations were followed when setting up the data collection experimental parameters (SESAME, 2004). Using the STA/LTA anti-trigger algorithm, microtremors were measured for at least 1 hour at each site to ensure long records free from transient conflicts (such as moving vehicles and wind gusts). Data were monitored using a sample rate of 100 sps and filtered using a 0.2–20 Hz bandpass filter. The seismometers were calibrated before recording, installed in good coupling with the surficial soil, orientated horizontally (N–S and E–W), and leveled vertically. The quality and precision of the findings attained with this method depend on the processing sequence. Records in this study were processed using Geopsy software (Wathelet et al., 2006). The accuracy of the microtremor measurements has been confirmed using SESAME team reliability standards. Additionally, the azimuthal rotation of the horizontal-to-vertical spectral ratio with intervals of 10° azimuth was used to determine the direction of the site response.
4 Results and discussion
4.1 The slope map
One of the most important factors in landslide occurrences is slopes. Shear resistance in unconsolidated materials (rocks and soils) reduces as the slope angle rises. In this work, slope angles are used as a measure of slope stability and are spatially represented in (Figure 5) using numerical estimates from the mapped area’s Digital Elevation Model (DEM). In the plotted area, rock types have a direct impact on slope angle through their control over the makeup of superficial deposits. Moreover, layered sedimentary rocks of other resistivity indicated the relief effects.
Results of slope values analysis are introduced on the distribution map of slope clusters. Therefore, the resulting categorized slope map establishes slope categories based on the occurrence frequency of various slope angles. Generally speaking, the likelihood of a landslide occurring increases with slope steepness. On the other hand, landslides typically occur seldom on slopes that are far less steep. The frequency distribution pattern based on the slope categories of the intended area shows a striking similarity. To clearly show the slope distribution pattern in the area under study, slope values are divided into five categories on the slope distribution map: flat or nearly flat areas with very low slope angles, areas with low slope values, areas with moderate slope values, steep areas with a high slope angle, and steeper areas of greater than 29.1° slope angle. This classification is used to highlight the locations of sharp changes in slope values, which correspond to the positions of active tectonic structures. The slope spatial distribution in the surveyed area (Figure 5) demonstrates that slope angles between 18.8° and 67.3° have the highest landslide susceptibility.
4.2 Predominant frequency and H/V amplitude estimation
Following the procedures outlined above, microtremor data were analyzed, and their H/V spectral ratios were determined (Figure 8). The spectral ratios of the H/V data were used to estimate the dominant frequency and H/V amplitude. Table 1 displays the resonance frequency and H/V amplitude values for various stations, where f0 and A0 stand for the observed predominant frequency and H/V amplitude, respectively, for each station. At 42 sites, the H/V spectral ratios were evaluated using the SESAME criteria in the processing order. The SESAME recommendations do not explain these factors in detail (SESAME, 2004).
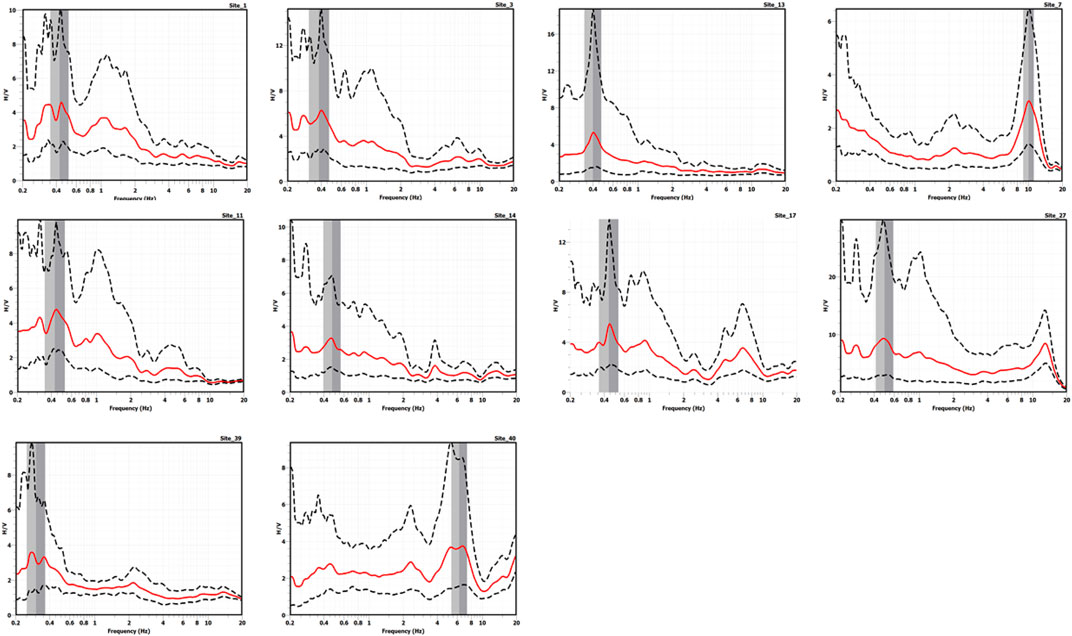
FIGURE 8. Examples of H/V spectral ratio at ambient noise measurement stations.
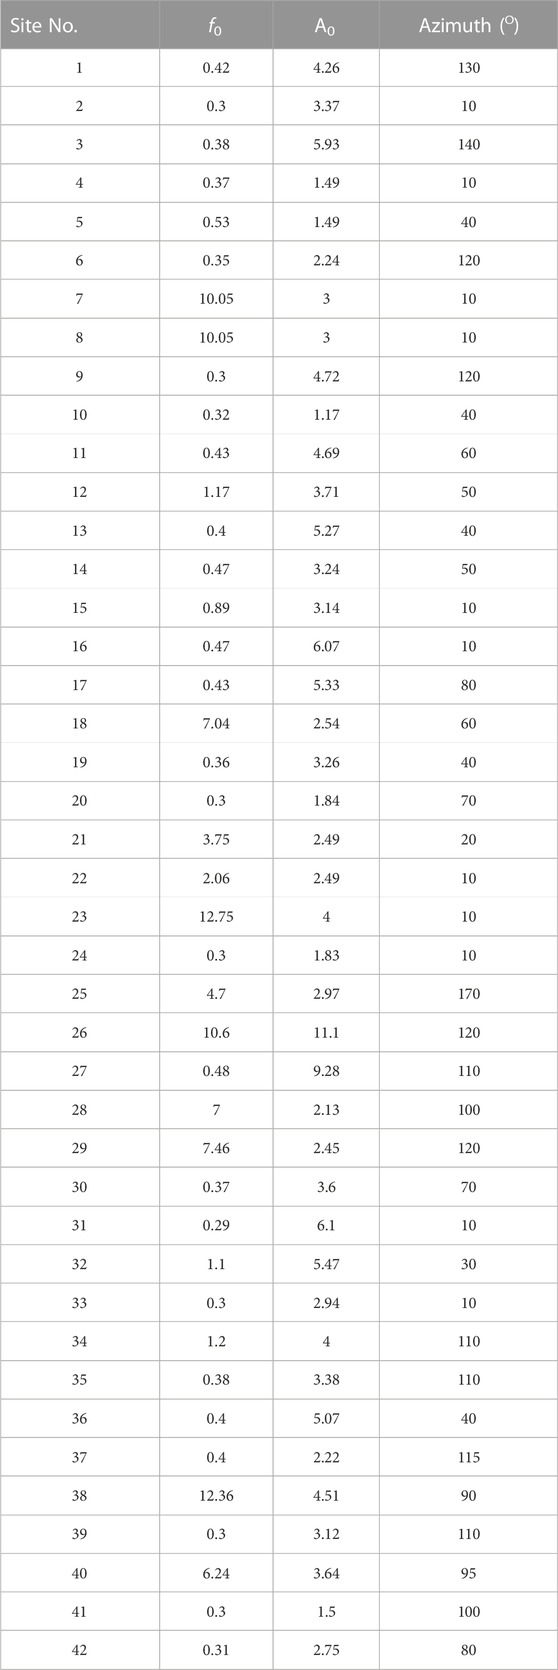
TABLE 1. Direction of site response at microtremor measurement sites.
These findings were confirmed by examining the state of the ground. So, at these locations, the accuracy of the results was approved. The maximum and minimum prevalent frequencies for the Al Taif area were found to be 0.3 and 12.75°Hz, respectively. Measurements were repeated at these locations to validate this conclusion. The amplitudes at the greatest and minimum were 1.17 and 9.28, respectively. The high fundamental frequency readings point to a shallow contact with a seismic impedance contrast. A zonation map was used to illustrate the results of the microtremor measurement for further analysis. The maps were created with ArcGIS software. Measurements of the ambient noise were used to interpolate the results. The zone map for predominant frequency is shown in Figure 9. The zonation map for H/V amplitude is shown in Figure 10.

FIGURE 9. Fundamental frequency zonation map.
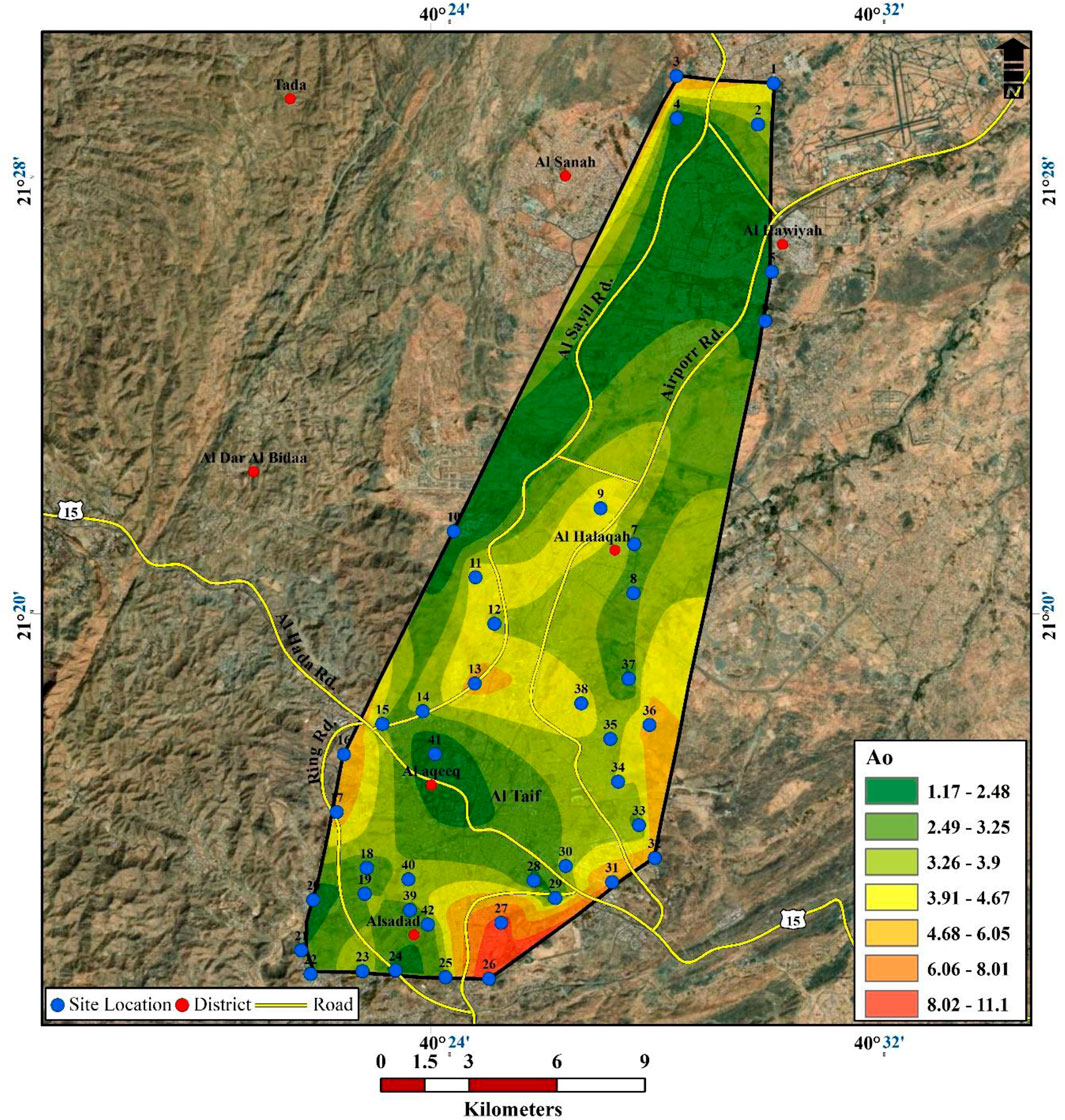
FIGURE 10. The H/V amplitude zonation map.
4.3 Prediction of the site response’s direction
As previously stated, the rotation of the H/V spectral ratio at azimuth intervals of 10° has been used to determine the response direction. Utilizing the three variables of frequency, amplitude, and azimuth, the site response direction was assessed. The H/V spectral rotation ratio at several stations is shown in Figure 11. This statistic demonstrates that 34 stations exhibit directivity. It has been observed that for certain stations, the H/V amplification develops in a particular direction, reflecting the influence of the integration between the localized site response, as well as geometrical and geologic constraints. The directivity is also noticeable at stations near the landslide areas. These theories are consistent with those offered by Panzera et al. (2011), Del Gaudio and Wasowski. (2011), and Pilz et al. (2014). Table 1 displays the direction of the site response for 42 stations.
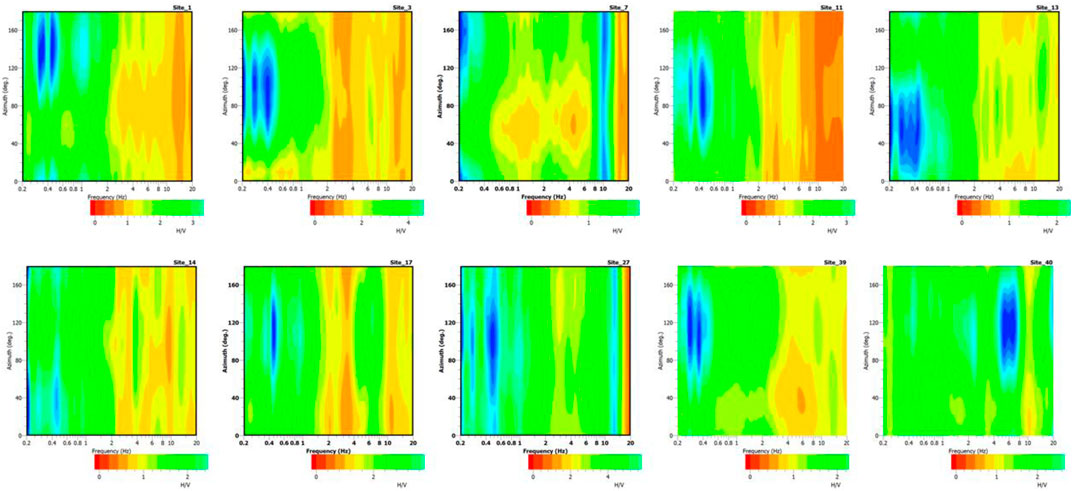
FIGURE 11. Examples of H/V spectral ratio rotation at microtremor measurement stations.
At a few Taif landslide areas, numerous field tests and measurements were made. In order to properly interpret the results, great effort was required to identify all slide pathways and historic landslides through the field survey. In order to demonstrate that the stations demonstrating directivity were on landslide locations, Figure 12 provides examples from this field survey. The results of a more thorough investigation show that stations with directivity tracked the landslide direction. In the sliding areas, it is observed that the maximal slope corresponds to the landslide direction. The findings of Burjanek et al. (2010), Panzera et al. (2011), Del Gaudio et al. (2014), and Pilz et al. (2014) all agreed with these findings.
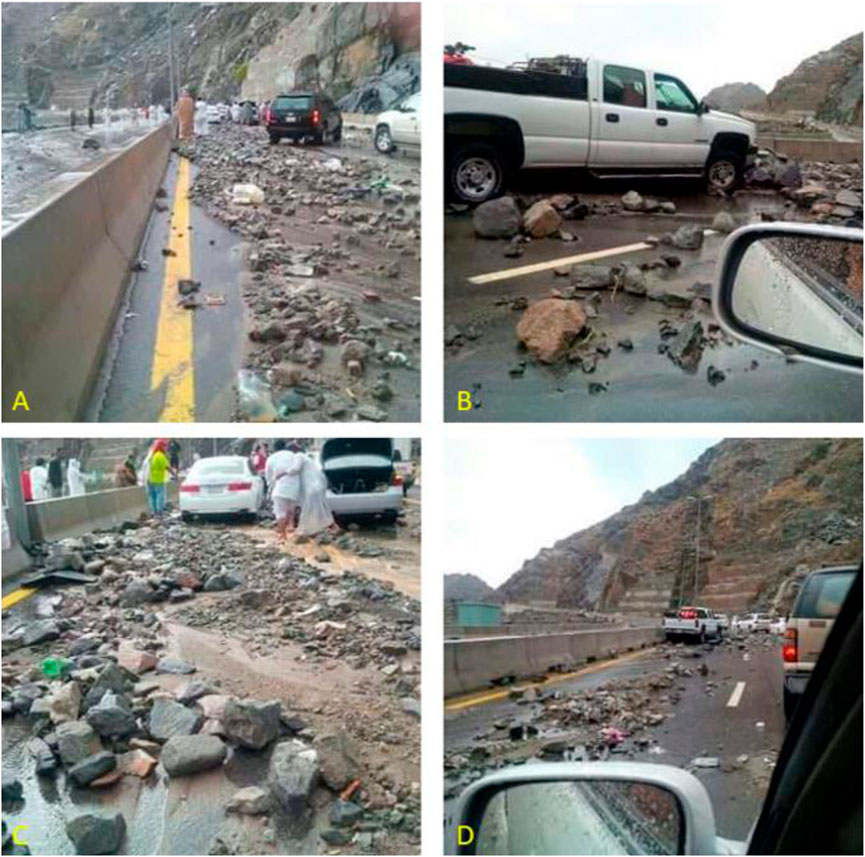
FIGURE 12. Landslide field verification sites. These labels (A–D) show field examples of landslide hazard sites that occurred in Al Taif area.
5 Conclusion
Land use planning, hazard management, and decision-making about regions vulnerable to landslides are all aided by the spatial prediction of landslides. These maps were created using a variety of techniques in different parts of the world. Areas that are likely to experience a landslide can be predicted based on physical criteria such as bedrock, previous landslide history, slope steepness, and hydrology. Clarifying the significance of early consideration of landslides in planning studies and introducing a method that could be used at all planning phases were the two main goals. All of the aforementioned information aids decision-makers and planners in gaining a practical understanding of ideas and terminology in addition to the crucial factors relating to landslides and landslide hazard mapping.
In this study, 42 sites had microtremor tests done to determine Taif’s susceptibility to landslides. The Nakamura technique was used to process the data in order to determine the dominant frequency and H/V amplitude. Following that, these factors were mapped through Al Taif research area. The rotation of the H/V spectral ratios at azimuth intervals of 10° was used to verify the phenomena of directional site response. The accuracy of the microtremor data was then assessed using a field survey to confirm the directivity results. These findings showed that the greatest and least prominent frequencies in Al Taif were, respectively, 0.3 and 12.75 Hz. The H/V amplitudes were 9.28 at the maximum and 1.17 at the lowest. The high fundamental frequency readings point to a shallow contact with a seismic impedance contrast. At stations near the landslide, there was a clear sense of directionality. The site reaction directions were parallel to the primary direction of the landslide, according to a thorough examination of microtremor stations. These findings show that the microtremor measurements offer a thorough method for assessing landslides. It expedites landslide analyses and lowers the initial expenses of numerical computations.
Data availability statement
The original contributions presented in the study are included in the article/Supplementary material, further inquiries can be directed to the corresponding author.
Author contributions
KA: Conceptualization, Data curation, Formal Analysis, Funding acquisition, Investigation, Methodology, Project administration, Resources, Software, Supervision, Validation, Visualization, Writing–original draft, Writing–review and editing. AA-A: Conceptualization, Investigation, Writing–review and editing, Methodology. KA-K: Conceptualization, Funding acquisition, Project administration, Resources, Supervision, Validation, Writing–review and editing. NA-O: Conceptualization, Data curation, Formal Analysis, Investigation, Software, Validation, Writing–review and editing.
Funding
The authors declare that no financial support was received for the research, authorship, and/or publication of this article. The authors extend their appreciation to the Deputyship for Research & Innovation, Ministry of Education in Saudi Arabia for funding this research work through the project no (IFKSUOR3–406-2).
Acknowledgments
Deep thanks are extended to the reviewers for their beneficial review and valuable comments.
Conflict of interest
The authors declare that the research was conducted in the absence of any commercial or financial relationships that could be construed as a potential conflict of interest.
Publisher’s note
All claims expressed in this article are solely those of the authors and do not necessarily represent those of their affiliated organizations, or those of the publisher, the editors and the reviewers. Any product that may be evaluated in this article, or claim that may be made by its manufacturer, is not guaranteed or endorsed by the publisher.
References
Abdel-Rahman, K., Abdel-Aal, A. Kh., El-Hady, Sh., Mohamed, A. A., and Abdel-Moniem, E. (2010). Fundamental site frequency estimation at new Domiat City, Egypt. Arabian J. Geosciences 5, 653–661. doi:10.1007/s12517-010-0222-2
Abdelrahman, K., Abdelfattah, A. K., and Al-Otaibi, N. (2021b). Assessment of land subsidence as an environmental threat facing Dammam City, eastern Saudi Arabia based on soil geotechnical parameters using downhole seismic approach. J. King Saud Univ. – Sci. 33, 101233. doi:10.1016/j.jksus.2020.101233
Abdelrahman, K., Al-Amri, A. M., Fnais, M. S., Qaysi, S., Abdelfattah, A. K., and Al-Otaibi, N. (2021a). Site effect and microzonation of the Jizan coastal area, southwestern Saudi Arabia, for earthquake hazard assessment based on the geotechnical borehole data. Arabian J. Geosciences 14, 688. doi:10.1007/s12517-021-07049-8
Abdelrahman, K., Al-Amri, A., Al-Otaibi, N., Fnais, M., and Abdelmonem, E. (2019a). Ground motion acceleration and response spectra of Al-Mashair area, Makkah Al-Mukarramah, Saudi Arabia. Arabian J. Geosciences 12 (11), 346. doi:10.1007/s12517-019-4526-6
Abdelrahman, K., Al-Amri, A. M., Al-Otaibi, N. A., Fnais, M., and Abdelmonem, E. (2019b). “Seismic hazard assessment of al Mashair area, Makkah Al-Mukarramah (Saudi Arabia),” in On significant applications of geophysical methods (Springer), 227–230.
Abdelrahman, K., Fnais, M., Abdelmonem, E., Magram, K., and Bin saadoon, A. (2017). Seismic vulnerability assessment in the new urban area of Diriyah Governorate, Riyadh, Saudi Arabia. Arab. J. Geosci. 10, 434. doi:10.1007/s12517-017-3222-7
Al-Furaih, A. A., Al-Aswad, A. A., and Kebeasy, R. M. (1994). New aspects on estimated risk around the Makkah region. 2nd Ann. Meet. Saudi. Soc. Earth Sci. 19, 25–27.
Al-Garni, M. (2009). Geophysical investigations for groundwater in a complex subsurface terrain, wadi Fatima, ksa: A case history. Jordan J. Civ. Eng. 3 (2), 118–136.
Al-Malki, M., Fnais, M., Al-Amri, A., and Abdelrahman, K. (2015). Estimation of fundamental frequency in dammam city, eastern Saudi Arabia. Arab. J. Geosci. 8, 2283–2298. doi:10.1007/s12517-014-1337-7
Al-Otaibi, A. O. S. (2019). Regional landslide zonation for environmental risk assessment of mashaar mina, Makkah region. M. SC. Thesis. Department of Geology and geophysics, college of science, king Saud university, 178.
Al-Saifi, M. M. (1983). Preliminary geotechnical investigations Wadi Na'man underground site. M. Sc. Thesis. IAG, KAU.
Al-Saud, M. (2015). Seismic characteristics and kinematic models of Makkah and central red sea regions. Arabian J. Geosciences 1 (1), 49–61. doi:10.1007/s12517-008-0004-2
Al-Shanti, A. (1993). The geology of the Arabian shield. Jeddah: Center of Scientific Publishing, King Abdulaziz University.
Al-Shanti, A. M. S. (1966). Oolitic iron ore deposits in Wadi Fatima between Jeddah and Makkah, Saudi Arabia. DGMR Bulletin.
Al-Subai, K. A. M. G. (1984). Engineering geology of stream water drainage tunnel No. IA/26. M. Sc. Thesis. Holy City of Makkah: IAG, KAU.
Alamri, A. M., Bankher, A., Abdelrahman, K., El-Hadidy, M., and Zahran, H. (2020). Soil site characterization of Rabigh city, western Saudi Arabia coastal plain, using HVSR and HVSR inversion techniques. Arabian J. Geosciences 13, 29. doi:10.1007/s12517-019-5027-3
Aldahri, M., El-Hadidy, M., Zahran, H., and Abdelrahman, K. (2018). Seismic microzonation of Ubhur district, Jeddah, Saudi Arabia, using H/V spectral ratio. Arabian J. Geosciences 11, 113. doi:10.1007/s12517-018-3415-8
Aleotti, P., and Chowdhury, R. (1999). Landslide hazard assessment: summary review and new perspectives. Bull. Eng. Geol. Environ. 58 (1), 21–44. doi:10.1007/s100640050066
Alharbi, M., Fnais, M., Al-Amri, A., Abdelrahman, K., Andreae, M. O., and Al-Dabbagh, M. (2015). Site response assessment at the city of Al Khobar, eastern Saudi Arabia, from microtremor and borehole data. Arab. J. Geosci. 8, 10015–10030. doi:10.1007/s12517-015-1890-8
Almadani, S., Abdelrahman, K., and bin Mansour, F. I. (2020). Site response assessment and ground conditions at king Saud university campus, Riyadh city, Saudi Arabia. Arabian J. Geosciences 13, 357. doi:10.1007/s12517-020-05378-8
Almadani, S., Abdelrahman, K., Ibrahim, E., Al-Bassam, A., and Al-Shmrani, A. (2015). Site response assessment of an urban extension site using microtremor measurements, Ahud Rufeidah, Abha District, Southwest Saudi Arabia. Arab. J. Geosci. 8, 2347–2357. doi:10.1007/s12517-014-1380-4
Alwash, M. A., and Zakir, F. A. R. (1992). Tectonic analysis of the Jeddah Taif area on the basis of LANDSAT satellite data. J. Afr. Earth Sci. (and the Middle East) 15 (2), 293–301. doi:10.1016/0899-5362(92)90076-O
Alyousef, K., Al-Amri, A., Fnais, M., Abdelrahman, K., and Loni, O. (2015a). Site effect evaluation for Yanbu City urban expansion zones, western Saudi Arabia, using microtremor analysis. Arab J. Geosci 8, 1717–1729. doi:10.1007/s12517-014-1310-5
Alyousef, K., Aldamegh, K., Abdelrahman, K., Loni, O., Saud, R., Al-Amri, A., et al. (2015b). Evaluation of site response characteristics of King Abdulaziz City for Science and Technology, Saudi Arabia using microtremors and geotechnical data. Arab J. Geosci 8, 5181–5188. doi:10.1007/s12517-014-1542-4
Ambraseys, N. N., Melville, C. P., and Adams, R. D. (2005). The seismicity of Egypt, Arabia and the Red Sea: A historical review. Cambridge University Press.
Anbalagan, R. (1992). Landslide hazard evaluation and zonation mapping in mountainous terrain. Engineering geology 32 (4), 269–277. doi:10.1016/0013-7952(92)90053-2
Andreasson, P. G., Bashawri, M., Al Hajeri, F., Ai-Jadan, K., Ai-Kolak, Z., Mawad, M., et al. (1977). Geology of the central Taif region, kingdom of Saudi Arabia. IAG Bulletin No 2.
Anthony, R. E., Aster, R. C., Ryan, S., Rathburn, S., and Baker, M. G. (2018). Measuring mountain river discharge using seismographs emplaced within the hyporheic zone. J. Geophys. Res. Earth Surf. 123, 210–228. doi:10.1002/2017jf004295
Azzedine, B., Ritz, J., and Philip, H. (1998). Drainage diversions as evidence of propagating active faults: example of the el asnam and thenia faults, Algeria. Terra Nova 10, 236–244. doi:10.1046/j.1365-3121.1998.00197.x
Barazangi, M. (1981). Evaluation of seismic risk along the western part of the Arabian plate. Faculty of Earth Sciences, KAU, Bull. No. 4, 77–87.
Bard, P. Y. (1994). Effects of surface geology on ground motion: recent results and remaining issues. Proc. 10th Europ. Conf. Earthq. Eng. 1, 305–323.
Bard, P. Y. (1998). “Microtremor measurement: A tool for site effect estimation?,” in The effects of surface geology on seismic motion. Editors K. Inkura, K. Kudo, H. Okada, and T. Sasatani (Rotterdam: Balkema), 1251–1279.
Berov, B., Ivanov, P., Dobrev, N., and Krastanov, M. (2016). “Addition to the method of mora & vahrson for landslide susceptibility along the Bulgarian black seacoast,” in Landslides and engineered slopes. Experience, theory and practice: Proceedings of the 12th international symposium on landslides (Napoli, Italy: CRC Press), 397.
Bertello, L., Berti, M., Castellaro, S., and Squarzoni, G. (2018). Dynamics of an active earthflow inferred from surface wave monitoring. J. Geophys. Res. Earth 123, 1811–1834. doi:10.1029/2017jf004233
Bishta, A. Z., Sonbul, A. R., and Qudsi, I. Z. (2015). Utilizing the image processing techniques in mapping the geology of Al Taif area, central western Arabian Shield, Saudi Arabia. Arab J Geosci 8, 4161–4175. doi:10.1007/s12517-014-1484-x
Brown, G. F. (1972). Tectonic map of the arabian peninsula. Map AP-2, DGMR, kingdom of Saudi arabia. Jeddah: Ministry of Petroleum and Mineral Resources.
Burjánek, J., Gassner-Stamm, G., Poggi, V., Moore, J. R., and Fäh, D. (2010). Ambient vibration analysis of an unstable mountain slope. Geophys. J. Int. 180, 820–828. doi:10.1111/j.1365-246x.2009.04451.x
Cardone, D., Flora, A., Picione, M. L., and Martoccia, A. (2019). Estimating direct and indirect losses due to earthquake damage in residential RC buildings. Elsevier, 126. doi:10.1016/j.soildyn.2019.105801
Cascini, L., Bonnard, C., Corominas, J., Jibson, R., and Montero-Olarte, J. (2005). “Landslide hazard and risk zoning for urban planning and development,” in Landslide risk management (London, UK: Taylor & Francis), 199–235.
Corominas, J., Van Westen, C., and Frattini, P. (2014). Recommendations for the quantitative analysis of landslide risk. Bull. Eng. Geol. Environ. 73, 209–263.
Çevik, E., and Topal, T. (2003). GIS-based landslide susceptibility mapping for a problematic segment of the natural gas pipeline, Hendek (Turkey). Environ. Geol. 44, 949–962. doi:10.1007/s00254-003-0838-6
Dai, F. C., Lee, C. F., and Ngai, Y. Y. (2002). Landslide risk assessment and management: an overview. Eng Geol 64, 65–87. doi:10.1016/s0013-7952(01)00093-x
D’Amico, S., Francesco, P., Salvatore, M., Roberto, I., Antonella, P., Giuseppe, L., et al. (2019). “Ambient noise techniques to study near-surface in particular geological conditions: A brief review,” in Innovation in near-surface Geophysics (Amsterdam, The Netherlands: Elsevier), 419–460.
Del Gaudio, V., Muscillo, S., and Wasowski, J. (2014). What we can learn about slope response to earthquakes from ambient noise analysis: an overview. Engineering Geology 182, 182–200. doi:10.1016/j.enggeo.2014.05.010
Del Gaudio, V., and Wasowski, J. (2011). Advances and problems in understanding the seismic response of potentially unstable slopes. Eng. Geol. 122, 73–83. doi:10.1016/j.enggeo.2010.09.007
Deng, Y., Wilson, J. P., and Bauer, B. (2007). Dem resolution dependencies of terrain attributes across a landscape. International Journal of Geographical Information Science 21 (2), 187–213. doi:10.1080/13658810600894364
Duval, A. M., Bard, P. Y., Méneroud, J. P., and Vidal, S. (1995). “Mapping site effect with microtremors,” in Proc. 5th Int.Conf. on seismic zonation (Nice, France: Spinger), 1522–1529.
Duval, A. M., Mèneroud, J. P., Vidal, S., and Bard, P. Y. (1994). Usefulness of microtremor measurements for site effect studies. Proc. 10th Europ. Conf. Earthq. Eng. 1, 521–527.
Duval, A. M., Vidal, S., Meneroud, J. P., Singer, A., DeSantis, F., Ramos, C., et al. (2001). Caracas, Venezuela, site effect determination with microtremors. Pure Appl. Geophys. 158, 2513–2523. doi:10.1007/pl00001183
Fang, K., Tang, H. M., Li, C. D., Su, X. X., An, P. J., and Sun, S. X. (2023). Centrifuge modelling of landslides and landslide hazard mitigation: A review. Geosci. Front. 14, 101493. doi:10.1016/j.gsf.2022.101493
Farr, T. G., Rosen, P. A., Caro, E., Crippen, R., Duren, R., Hensley, S., et al. (2007). The shuttle radar topography mission. Reviews of Geophysics 45 (2), 183. doi:10.1029/2005rg000183
Fat-Helbary, R., Abdelrahman, K., Fnais, M. S., and Abdelmoneim, E. (2012). Seismic hazard and site response assessment on the proposed site of Aswan cement plant, Egypt. International Journal of Earth Sciences and Engineering 5 (4), 644–651.
Felicisimo, Á. M., Cuartero, A., Remondo, J., and Quirós, E. (2012). Mapping landslide susceptibility with logistic regression, multiple adaptive regression splines, classification and regression trees, and maximum entropy methods: A comparative study. Landslides 10, 175–189. doi:10.1007/s10346-012-0320-1
Field, E., and Jacob, K. (1993). The theoretical response of sedimentary layers to ambient seismic noise. Geophys. Res. Lett. 20, 2925–2928. doi:10.1029/93gl03054
Fnais, M., Al-Amri, A., Abdelrahman, K., Al-Yousef, K., Loni, O., and Abdel Moneim, E. (2015a). Assessment of soil-structure resonance in southern Riyadh city, Saudi Arabia. Arab J. Geosci 8, 1017–1027. doi:10.1007/s12517-013-1247-0
Fnais, M., Al-Amri, A., Abdelrahman, K., Abdelmonem, E., and El-Hady, S. (2015b). Seismicity and seismotectonics of jeddah-makkah region, west-Central Saudi Arabia. Journal of Earth Science 26 (5), 746–754. doi:10.1007/s12583-015-0587-y
Fnais, M. S., Abdel-Rahman, K., and Al-Amri, A. M. (2010). Microtremor measurements in Yanbu city of western Saudi Arabia: A tool for seismic microzonation. Journal of King Saud University- Science 22, 97–110. doi:10.1016/j.jksus.2010.02.006
Froude, M. J., and Petley, D. N. (2018). Global fatal landslide occurrence from 2004 to 2016. Nat. Hazards Earth Syst. Sci. 18, 2161–2181. doi:10.5194/nhess-18-2161-2018
Galea, P., D’Amico, S., and Farrugia, D. (2014). Dynamic characteristics of an active coastal spreading area using ambient noise measurements—anchor bay, Malta. Malta. Geophys. J. Int. 199, 1166–1175. doi:10.1093/gji/ggu318
Gao, J., and Los, C. (1995). Micro-scale modelling of terrain susceptibility to landsliding from a dem: A gis approach. Geocarto Int. 10 (4), 15–30. doi:10.1080/101060/49509354509
Gaudio, V. D., and Wasowski, J. (2007). Directivity of slope dynamic response to seismic shaking. Journal Geophysical Research Letters 34, 2007.
Gokceoglu, C., Sonmez, H., Nefeslioglu, H. A., Duman, T. Y., and Can, T. (2005). The 17 March 2005 Kuzulu landslide (Sivas, Turkey) and landslide-susceptibility map of its near vicinity. Eng. Geol. 81, 65–83. doi:10.1016/j.enggeo.2005.07.011
Guo, Z., Yin, K., Huang, F., Fu, S., and Zhang, W. (2019). Landslide susceptibility evaluation based on landslide classification and weighted frequency ratio model. Chin. J. Rock Mech. Eng. 38, 14.
Haque, U., da Silva, P. F., Devoli, G., Pilz, J., Zhao, B., Khaloua, A., et al. (2019). The human cost of global warming: deadly landslides and their triggers (1995–2014). Sci. Total. 682, 673–684. doi:10.1016/j.scitotenv.2019.03.415
Harutoonian, P. (2015). Geotechnical characterisation of compacted ground by passive ambient vibration techniques. Sydney, Australia: School of Computing, Engineering and Mathematics University of Western Sydney.
Heersink, P. (2005). World Atlas of natural hazards. Cartographica 40, 133–134. doi:10.3138/3888-1106-w155-43w7
Hong, H., Pourghasemi, H. R., and Pourtaghi, Z. S. (2016). Landslide susceptibility assessment in lianhua county (China): A comparison between a random forest data mining technique and bivariate and multivariate statistical models. Geomorphology 259, 105–118. doi:10.1016/j.geomorph.2016.02.012
Hungr, O., Leroueil, S., and Picarelli, L. (2014). The Varnes classification of landslide types, an update. Landslides 1, 167–194. doi:10.1007/s10346-013-0436-y
Hussain, Y., Martinez-Carvajal, H., Condori, C., Uagoda, R., Cárdenas-Soto, M., Cavalcante, A. L. B., et al. (2019). Ambient seismic noise: A continuous source for the dynamic monitoring of landslides. Terrae Didat 15, 103–107.
Iannucci, R., Martino, S., Martorelli, F., Falconi, L., and Verrubbi, V. (2017). “Susceptibility to sea cliff failures at cala rossa bay in favignana island (Italy),” in Workshop on world landslide forum. Editors M. Mikoš, N. Casagli, and Y. Yin (Cham, Switzerland: Springer), 537–546.
Iannucci, R., Martino, S., Paciello, A., D’Amico, S., and Galea, P. (2018). Engineering geological zonation of a complex landslide system through seismic ambient noise measurements at the Selmun Promontory (Malta). Geophys. J. Int. 213, 1146–1161. doi:10.1093/gji/ggy025
Imposa, S., Grassi, S., Fazio, F., Rannisi, G., and Cino, P. (2017). Geophysical surveys to study a landslide body (north-eastern Sicily). Nat. Hazards 86, 327–343. doi:10.1007/s11069-016-2544-1
Jibson, R. W. (1996). Use of landslides for paleoseismic analysis. Engineering Geology 43, 291–323. doi:10.1016/S0013-7952(96)00039-7
Johnson, P. R. (1982). A preliminary lithostratigraphic compilation of the arabian Shield. Saudi Arabian Deputy Ministry for Mineral Resources 13, 108.
Kahal, A. Y., Abdelrahman, K., Hussain, J., and Yahya, M. M. (2021). Landslide hazard assessment of the neom promising city, northwestern Saudi Arabia: an integrated approach. Journal of King Saud University – Science 33, 101279. doi:10.1016/j.jksus.2020.101279
Kanungo, D., Arora, M., Sarkar, S., and Gupta, R. (2009). Landslide susceptibility zonation (LSZ) mapping-a review. J South Asia Disaster Stud 2, 81–105.
Keskinsezer, A., and Ersin, D. (2019). Investigating of soil features and landslide risk in Western-Atakent (İstanbul) using resistivity, MASW, Microtremor, and boreholes methods. Open Geosci 11, 1112–1128. doi:10.1515/geo-2019-0086
Köhler, A., Nuth, C., Schweitzer, J., Weidle, C., and Gibbons, S. J. (2015). Regional passive seismic monitoring reveals dynamic glacier activity on Spitsbergen, Svalbard. Polar Res 34, 26178. doi:10.3402/polar.v34.26178
Kudo, K. (1995). “Practical estimates of site response, state of the art report,” in Proc. 5th int. Conf. On seismic zonation (Nice, France: Spinger), 1878–1907.
Lacroix, P., Handwerger, A. L., and Bievre, G. (2020). Life and death of slow-moving landslides. Nat. Rev. Earth Environ. 1, 404–419. doi:10.1038/s43017-020-0072-8
Lee, S., Won, J.-S., Jeon, S., Park, I., and Lee, M. J. (2014). Spatial landslide hazard prediction using rainfall probability and a logistic regression model. Math. Geosci. 47, 565–589. doi:10.1007/s11004-014-9560-z
Loupoukhine, M., and Stieltjes, L. (1974). Geothermal reconnaissance in the kingdom of Saudi Arabia. Geothermics.
Martino, S. (2016). “Earthquake-induced reactivation of landslides: recent advances and future perspectives,” in Earthquakes and their impact on society. Editor S. D’Amico (Cham, Switzerland: Springer).
Merghelani, H. M., and Gallanthine, S. K. (1981). Microearthquakes in the tihamat-asir region of Saudi Arabia. Bull. Seism. Soc. Am. 70 (6), 2291–2293. doi:10.1785/bssa0700062291
Moore, T., and Al-Rehaili, M. (1989). Geologic map of the Makkah quadrangle, sheet 21d. Kingdom of Saudi Arabia: Saudi Arabian Directorate General of Mineral Resources Geoscience Map GM-107C.
Mora, C. S., and Vahrson, W. G. (1994). Macrozonation methodology for landslide hazard determination. Bulletin of the Association of Engineering Geologists 31 (1), 49–58. doi:10.2113/gseegeosci.xxxi.1.49
Mora-Castro, S., Saborio, J., Aste´, J., Prepetit, C., Joseph, V., and Matera, M. (2012). “Slope instability hazard in Haiti: emergency assessment for a safe reconstruction,” in Landslides and engineered slopes: Protecting society through improved understanding (London: Taylor & Francis Group), 153–172.
Nakamura, Y. (1989). A method for dynamic characteristics estimations of subsurface using microtremors on the ground surface. Quart. Rep. Railway Tech. Res. Inst. (RTRI) 30, 25–33.
Nebert, K., Al Shaibi, A. A., Awlia, M., Bounny, I., Nawab, Z. A., Sharief, O. H., et al. (1974). Geology of the area north wadi Fatimah, kingdom of Saudi Arabia. IAG, KAU, Bull I.
Nogoshi, M., and Igarashi, T. (1970). On the propagation characteristics of microtremor. J. Seism. Soc. Jpn. 23, 264–280. doi:10.4294/zisin1948.23.4_264
Panzera, F., D’Amico, S., Lotteri, A., Galea, P., and Lombardo, G. (2012). Seismic site response of unstable steep slope using noise measurements: the case study of xemxija bay area, Malta. Malta. Nat. Hazards Earth Syst. Sci. 12, 3421–3431. doi:10.5194/nhess-12-3421-2012
Panzera, F., Lombardo, G., and Rigano, R. (2011). Evidence of topographic effects through the analysis of ambient noise measurements. Seismological Research Letters 82, 413–419. doi:10.1785/gssrl.82.3.413
Pazzi, V., Morelli, S., and Fanti, R. (2019). A review of the advantages and limitations of geophysical investigations in landslide studies. Int. J. Geophys. 2019, 1–27. doi:10.1155/2019/2983087
Peng, L., Niu, R., Huang, B., Wu, X., Zhao, Y., and Ye, R. (2014). Landslide susceptibility mapping based on rough set theory and support vector machines: A case of the three gorges area, China. Geomorphology 204, 287–301. doi:10.1016/j.geomorph.2013.08.013
Petley, D. (2012). Global patterns of loss of life from landslides. Geology 40, 927–930. doi:10.1130/g33217.1
Pham, B. T., Tien Bui, D., Prakash, I., and Dholakia, M. (2015). Landslide susceptibility assessment at a part of Uttarakhand Himalaya, India using GIS–based statistical approach frequency ratio method. Int J Eng Res Technol 4, 338–344.
Picotti, S., Francese, R., Giorgi, M., Pettenati, F., and Carcione, J. M. (2017). Estimation of glacier thicknesses and basal properties using the horizontal-to-vertical component spectral ratio (HVSR) technique from passive seismic data. J. Glaciol. 63, 229–248. doi:10.1017/jog.2016.135
Pilz, M., Parolai, S., Bindi, D., Saponaro, A., and Abdybachaev, U. (2014). Combining seismic noise techniques for landslide characterization. Pure and Applied Geophysics 171, 1729–1745. doi:10.1007/s00024-013-0733-3
Pourghasemi, H. R., Moradi, H. R., and Fatemi Aghda, S. M. (2013a). Landslide susceptibility mapping by binary logistic regression, analytical hierarchy process, and statistical index models and assessment of their performances. Nat. Hazards 69, 749–779. doi:10.1007/s11069-013-0728-5
Pourghasemi, H. R., Pradhan, B., Gokceoglu, C., Mohammadi, M., and Moradi, H. R. (2013b). Application of weights-of-evidence and certainty factor models and their comparison in landslide susceptibility mapping at Haraz watershed, Iran. Arab. J. Geosci. 6, 2351–2365. doi:10.1007/s12517-012-0532-7
Regmi, A., Devkota, K., Yoshida, K., Pradhan, B., Pourghasemi, H., Kumamoto, T., et al. (2014). Application of frequency ratio, statistical index, and weights-of-evidence models and their comparison in landslide susceptibility mapping in Central Nepal Himalaya. Arab. J. Geosci. 7, 725–742. doi:10.1007/s12517-012-0807-z
Rezaei, S., Issa, Sh., and Hamed, R. (2018). Evaluation of landslides using ambient noise measurements (case study: nargeschal landslide). International Journal of Geotechnical Engineering 14, 409–419. doi:10.1080/19386362.2018.1431354
Roccati, A., Paliaga, G., Luino, F., Faccini, F., and Turconi, L. (2021). GIS-based landslide susceptibility mapping for land use planning and risk assessment. Land 10, 162. doi:10.3390/land10020162
Rodríguez-Peces, M. J., García-Mayordomo, J., Azañón, J. M., Insua Arévalo, J. M., and Jiménez Pintor, J. (2011). Constraining pre-instrumental earthquake parameters from slope stability back-analysis: palaeoseismic reconstruction of the güevéjar landslide during the 1st november 1755 Lisbon and 25th december 1884 arenas del rey earthquakes. Quaternary International 242, 76–89. doi:10.1016/j.quaint.2010.11.027
Saha, A., Gupta, R., Sarkar, I., Arora, M., and Csaplovics, E. (2005). An approach for GIS-based statistical landslide susceptibility zonation with a case study in the Himalayas. Landslides 2, 61–69. doi:10.1007/s10346-004-0039-8
Saputra, A., Gomez, C., Hadmoko, D. S., and Sartohadi, J. (2016). Coseismic landslide susceptibility assessment using geographic information system. Geoenvironmental Disasters 3 (1), 27. doi:10.1186/s40677-016-0059-4
SESAME (2004). Guidelines for the implementation of the H/V spectral ratio technique on ambient vibrations. Measurements, processing and interpretation. SESAME European research project WP12—d23.12. Available online: http://sesame-fp5.obs.ujf-grenoble.fr/Papers/HV_User_Guidelines.pdf.
Shanmugam, G., and Wang, Y. (2015). The landslide problem. Journal of Palaeogeography 4 (2), 109–166. doi:10.3724/sp.j.1261.2015.00071
Sharaf, M. A. (2010). Geological and geophysical exploration of the groundwater aquifers of as suqah area, Makkah district, western arabian Shield, Saudi Arabia. Arab. J. Geosci 4, 993–1004. doi:10.1007/s12517-010-0187-1
Somos-Valenzuela, M. A., Oyarzún-Ulloa, J., Fustos, I., Garrido-Urzua, N., and Chen, N. (2018). The mudflow disaster at villa santa lucía in Chilean patagonia: Understandings and insights derived from numerical simulation and post-event field surveys. Nat. hazards earth Syst. Sci. 20, 2319–2333. doi:10.5194/nhess-20-2319-2020
Sun, D., Chen, D., Zhang, J., Mi, C., Gu, Q., and Wen, H. (2023). Landslide susceptibility mapping based on interpretable machine learning from the perspective of geomorphological differentiation. Land 12, 1018. doi:10.3390/land12051018
Sun, D., Shi, S., Wen, H., Xu, J., Zhou, X., and Wu, J. (2021). A hybrid optimization method of factor screening predicated on GeoDetector and Random Forest for Landslide Susceptibility Mapping. Geomorphology 379, 107623. doi:10.1016/j.geomorph.2021.107623
Varnes, D. (1984). Landslide hazard zonation: A review of principles and practice. Commission on landslides of the IAEG. Natural hazards 3, 61p.
Wang, Q., and Li, W. (2017). A GIS-based comparative evaluation of analytical hierarchy process and frequency ratio models for landslide susceptibility mapping. Phys Geogr 38 (4), 318–337. doi:10.1080/02723646.2017.1294522
Wang, Y., Feng, L., Li, S., Ren, F., and Du, Q. (2020). A hybrid model considering spatial heterogeneity for landslide susceptibility mapping in Zhejiang Province, China. Catena 188, 104425. doi:10.1016/j.catena.2019.104425
Wathelet, M., Chatelain, J.-L., Cornou, C., Giulio, G. D., Guillier, B., Ohrnberger, M., et al. (2006). Geopsy: A user-friendly open-source tool set for ambient vibration processing. Seismol. Res. Lett. 91, 1878–1889. doi:10.1785/0220190360
Whiteley, J. S., Chambers, J. E., Uhlemann, S., Wilkinson, P. B., and Kendall, J. M. (2019). Geophysical monitoring of moisture-induced landslides: A review. Rev. Geophys. 57, 106–145. doi:10.1029/2018rg000603
Wilson, J. P., and Gallant, J. C. (2000). Digital terrain analysis. Terrain analysis principles and applications 6 (12), 1–27.
Yalcin, A., Reis, S., Aydinoglu, A. C., and Yomralioglu, T. (2011). A GIS-based comparative study of frequency ratio, analytical hierarchy process, bivariate statistics and logistics regression methods for landslide susceptibility mapping in Trabzon, NE Turkey. CATENA 85 (3), 274–287. doi:10.1016/j.catena.2011.01.014
Youssef, A., Pradhan, B., Al-Kathery, M., Bathrellos, G., and Skilodimou, H. (2015a). Assessment of rockfall hazard at Al-Noor mountain, Makkah city (Saudi Arabia) using spatio-temporal remote sensing data and field investigation. Journal of African Earth Sciences 101, 309–321. doi:10.1016/j.jafrearsci.2014.09.021
Youssef, A., Pradhan, B., Pourghasemi, H., and Abdullahi, S. (2015b). Landslide susceptibility assessment at wadi Jawrah basin, Jizan region, Saudi Arabia using two bivariate models in GIS. Geosciences Journal 19 (3), 449–469. doi:10.1007/s12303-014-0065-z
Keywords: remote sensing, microtremors, directional resonance, landslide susceptibility, Al Taif, Saudi Arabia
Citation: Abdelrahman K, Al-Amri AM, Al-Kahtany K and Al-Otaibi N (2023) Landslide susceptibility mapping of Al Taif urban area, Saudi Arabia, using remote sensing data and microtremor measurements: integrated approach. Front. Earth Sci. 11:1270061. doi: 10.3389/feart.2023.1270061
Received: 31 July 2023; Accepted: 21 August 2023;
Published: 08 September 2023.
Edited by:
Ahmed M. Eldosouky, Suez University, EgyptReviewed by:
Abdellatif Younis, National Research Institute of Astronomy and Geophysics, EgyptAli Hafez, National Research Institute of Astronomy and Geophysics, Egypt
Copyright © 2023 Abdelrahman, Al-Amri, Al-Kahtany and Al-Otaibi. This is an open-access article distributed under the terms of the Creative Commons Attribution License (CC BY). The use, distribution or reproduction in other forums is permitted, provided the original author(s) and the copyright owner(s) are credited and that the original publication in this journal is cited, in accordance with accepted academic practice. No use, distribution or reproduction is permitted which does not comply with these terms.
*Correspondence: Kamal Abdelrahman, a2hhc3NhbmVpbkBrc3UuZWR1LnNh