 Martina Pedicini1
 Fabio Luca Bonali1,2*
 Noemi Corti1
 Federico Aligi Pasquaré Mariotto3
 Kyriaki Drymoni1
 Alessandro Tibaldi1,2
- 1Department of Earth and Environmental Sciences, University of Milan-Bicocca, Milan, Italy
- 2CRUST-Interuniversity Center for 3D Seismotectonics with Territorial Applications, Chieti Scalo, Italy
- 3Department of Human and Innovation Sciences, Insubria University, Varese, Italy
We analysed all the Holocene structures defining the Fremrinamar Fissure Swarm (FFS), in the Northern Volcanic Zone of Iceland, through the interpretation of aerial photos, orthomosaics and Digital Surface Models (DSMs), and field surveys. We measured the strike, dip, length and kinematics of 761 normal faults and reconstructed the slip profile of 76 main faults (length >2 km), with the purpose of evaluating the overall direction of along-axis rift propagation. We also measured the strike of 146 eruptive fissures and 1,128 extension fractures. A total of 421 faults dip towards the east and 340 dip towards the west, mainly striking N0°-10°E. Maximum fault length is 14.2 km, and W-dipping faults are longer than E-dipping faults. The majority of eruptive fissures strike N10°-20°E, and are concentrated in the southern part of the FFS, around the Fremrinamar central volcano. Extension fractures mainly strike N0°-10°E, with a maximum length of 2,508 m. We evaluated the variation of strike, fracture density and spacing along the FFS, and observed a change of its trend from NNE-SSW in the central-southern part, to NNW-SSE in the northern part. We interpret this evidence as the effect of the intersection with the Grimsey Lineament. The tapering of fault slip profiles indicates a main northward propagation of the rift, and thus of the deformation, interpreted as the effect of lateral propagation of dykes from the magma chamber below the central volcano towards the north. Such interpretation is also supported by the distribution of normal faults, vertical offset and dilation values, and also by the rift width, which tend to decrease towards the north.
1 Introduction
Divergent plate margins are zones of tectonic and volcanotectonic deformation, where different processes (such as plate spreading, dyke intrusions, inflation-deflation of the magma chambers) concur to delineate the final architecture of the rift and its propagation. Far-field stresses generated by plate motions accumulate over decades and are suddenly released by faulting, fissuring, and dyking (Heki et al., 1993; Jonsson et al., 1997; Cattin et al., 2005; Wright et al., 2006).
The architecture of rift zones belonging to slow-spreading ridges (≤2 cm/yr) has mostly been studied by means of oceanographic data, reaching a detail compatible with the resolution of the instruments, that is in the range 10–200 m (e.g., Lavier et al., 2000; Magnúsdóttir et al., 2015). The process of along-axis propagation of oceanic ridges has been studied by numerical modelling (Pollard and Aydin, 1984; Mittelstaedt et al., 2008), kinematic modelling (Schouten et al., 1987), analogue modelling (Tentler, 2003; Tentler and Acocella, 2010), field structural analyses (Gudmundsson, 2007), sea-surface free-air gravimetric studies (Morgan and Sandwell, 1994) and seismological analyses (Floyd et al., 2002). Along continental rifts, such as the East African Rift, fault propagation has been analysed through slip profiles (Manighetti et al., 1997; Manighetti et al., 2001).
Formation of normal faults and extension fractures can precede the emplacement of dykes, generating unclamping on pre-existing faults that favours shallow magma upwelling, as observed in the Natron Rift (Tanzania) (Calais et al., 2008). Normal faulting might also occur without triggering magmatic intrusion, as in the cases of the Ethiopian Rift and the Afar depression, where remote tectonic stresses induced fissuring and subsequently normal faulting (Manighetti et al., 1997; Gupta and Scholz, 2000; Acocella et al., 2003). Alternatively, dyking may occur first, transmitting tensile and shear stress to the host rock and inducing both surface faulting and fissuring (Gudmundsson et al., 2008; Hollingsworth et al., 2012; Hjartardóttir and Einarsson, 2015; Al Shehri and Gudmundsson, 2018; Tibaldi et al., 2022; Drymoni et al., 2023). A possible complication arises from the fact that dyking can also remobilise pre-existing faults, as observed during the 2014–2015 event at Bardarbunga volcano in Iceland (Hjartardóttir et al., 2016a; Ruch et al., 2016; Müller et al., 2017).
At slow-spreading plate boundaries, it has been demonstrated that rift development, over a short-time interval of hundreds of years, can even occur by repeated dyking that produces most of the shallow deformation (Acocella and Trippanera, 2016). All these cases contribute to the heated debate surrounding the processes that determine rift architecture and the mechanisms that preferentially guide the formation and propagation of faults and fissures.
Recent findings by Tibaldi et al. (2019), Tibaldi et al. (2020a) contributed, as described below, to a better understanding of how magma interacts with shallow brittle structures and how rift zones propagate. These authors studied the propagation direction of 33 Holocene faults in the Theistareykir Fissure Swarm, one of the fracture zones that characterise the onshore Icelandic segment of the Atlantic Ridge, known as Northern Volcanic Zone (Figure 1). Here, the cumulative fault slip distribution showed two opposite directions of fault/rift propagation: northwards, in the area located north of Theistareykir central volcano, and southwards, in the area south of the volcano. Extension fractures tend to replace faults at greater distances from the volcano. These data, together with the observations of vents and dykes aligned with the fissure swarm structures, led Tibaldi et al. (2019) to assume that faults and fissures propagated following repeated dyke intrusions from the magma chamber below the Theistareykir volcano, and outward along the plate margin. This assumption is also supported by the study of Hjartardóttir et al. (2016a), who focused on the 2014–2015 dyking event at Bardarbunga volcano that resulted in new graben and fractures formation. These conclusions corroborate the idea that at slow-spreading ridges normal faults and extension fractures may be the effect of stress induced by magma intrusions. However, these areas represent only a fraction of the rift of northern Iceland and more investigations are necessary to verify the extent of this process. In the present paper, we show the results of a very detailed analysis of all the structures that compose the Fremrinamar Fissure Swarm, a poorly studied rift zone located east of the Krafla and Theistareykir fissure swarms, in the Northern Volcanic Zone (Figure 1). We focused our attention on structures showing post-LGM activity on the order of 10–14 kyr (Sæmundsson et al., 2012; Sigurgeirsson et al., 2015), as we reconstructed rift architecture and deformation processes at Holocene structures. Similarly, other works focused on the study of Holocene faults in Iceland, such as Iezzi et al. (2020). In the southern portion of the Fremrinamar Fissure Swarm is located the homonymous Holocene central volcano (Figure 1B). This framework is similar for the Theistareykir Fissure Swarm, enabling to verify the results obtained by Tibaldi et al. (2019), Tibaldi et al. (2020a). The observed setting is also similar to other rifts in Iceland and Africa, and might make it possible either to obtain a generalisation of this hypothesis or allow its future validation elsewhere. Our results also contribute to defining the general architecture of the rift system of the Northern Volcanic Zone, as previous works (Hjartardóttir et al., 2016b) analysed the fractures without differentiating either the fault dip or the fault offset, and consequently their hierarchy. In the Northern Volcanic Zone, only the Theistareykir Fissure Swarm has been studied in detail so far, with the description and classification of all the structures, and the collection of fault offsets and dips (Pasquaré Mariotto et al., 2015; Tibaldi et al., 2016; Tibaldi et al., 2020b; Bonali et al., 2018; Bonali et al., 2019a; Bonali et al., 2019b). Our work represents a step towards a better understanding of how rifts develop under the effect of regional stresses and dyke injections.
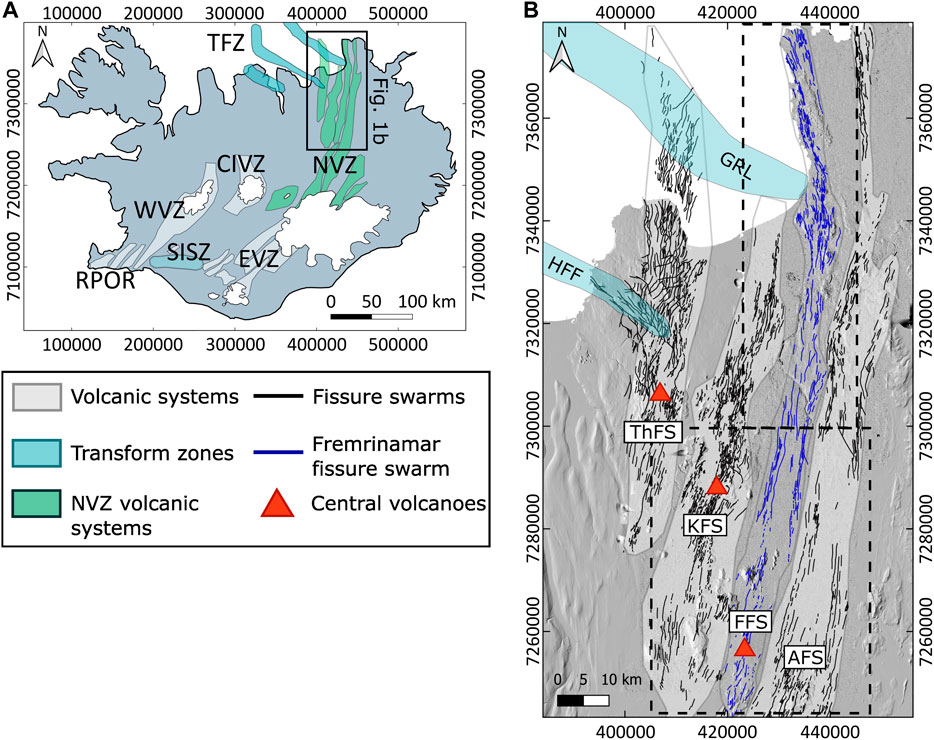
FIGURE 1. (A) Main volcanic rift zones and volcanic systems of Iceland (modified after Einarsson and Sæmundsson, 1987; Hjartardóttir et al., 2016b). CIVZ, Central Iceland Volcanic Zone; EVZ, Eastern Volcanic Zone; NVZ, Northern Volcanic Zone; RPOR, Reykjanes Peninsula Oblique Rift; SISZ, South Iceland Seismic Zone; TFZ, Tjornes Fracture Zone; WVZ, Western Volcanic Zone. The black rectangle shows the location of Figure 1B; (B) Detail of the northernmost sector of the NVZ. Transform zones; fissure swarms and central volcanoes are reported. AFS, Askja Fissure Swarm; FFS, Fremrinamar Fissure Swarm; GRL, Grímsey Lineament; HFF, Húsavík-Flatey Fault; KFS, Krafla Fissure Swarm; ThFS, Theistareykir Fissure Swarm. Historical photos-derived DSMs are used as a background for the FFS, whereas the ArcticDEM (https://www.pgc.umn.edu/data/arcticdem/) is used for the other fissure swarms of the NVZ. Black dotted areas identify the locations covered by photogrammetry-derived orthomosaics and DSMs. Spatial reference: WGS 84 - UTM zone 28 N.
2 Geological background
Iceland is located along the Mid-Atlantic Ridge and above a mantle plume, which provides a constant flux of magma that has led to the extensive lava production that created the island (Einarsson, 1991). Here, the plate boundary is made of a number of volcanic rift zones (Figure 1A), and transform zones (e.g., Einarsson, 2008). The former are composed of a series of volcanic systems, characterised by a central volcano and fissure swarms (Einarsson, 1991; Einarsson, 2008). Their dynamics are influenced both by the relative motion between the North American and Eurasian plates, and by fluid upwelling from the mantle plume (Gudmundsson, 2000).
The Northern Volcanic Zone is a 200-km-long volcanic rift zone, representing the northernmost part of the emerging Mid-Atlantic plate boundary. It extends from the centre of the Icelandic hotspot, underneath the northwestern part of Vatnajökull glacier, to the Tjörnes Fracture Zone, further up north (Figure 1A) (Sæmundsson, 1974; Hjartardóttir et al., 2016b; Drouin et al., 2017). The latter is a shear zone made of three seismically active N120°E-striking segments: from north to south, the Grímsey Lineament, the Húsavík-Flatey Fault and the Dalvík Lineament (Figure 1A) (Einarsson, 1991; Einarsson, 2008; Stefansson et al., 2008; Magnúsdóttir and Brandsdóttir, 2011). The current Northern Volcanic Zone is considered to have been active for 8–8.5 Myr (Garcia et al., 2003) and is made of seven N-S-striking volcanic systems, namely, the Theistareykir, Krafla, Fremrinamar, Askja, Kverkfjöll, Bardarbunga, and Tungnafellsjokull (Figure 1B) (Gudmundsson, 2000; Hjartardóttir et al., 2012; Pasquaré Mariotto et al., 2015; Hjartardóttir et al., 2016b; Sigmundsson et al., 2020). Each of these volcanic systems is named after the main shield volcano in the area, and consists of 5–20 km-wide and 60–100 km-long fissure swarms (Sæmundsson, 1974). Lava shields are usually located within these fissure swarms, but can also be situated at their margins (such as in the Fremrinamar Fissure Swarm) (Andrew and Gudmundsson, 2007). Fissure swarms in the Northern Volcanic Zone typically extend from their central volcanoes for distances as short as 30 km (Tungnafellsjökull) and as long as 125 km (Fremrinamar) (Hjartardóttir et al., 2016a). Rifting activity within the volcanic systems is episodic (Einarsson, 2008), with a recurrence time of about 100–150 years (Björnsson, 1985), and is generally bounded to one system at a time, as suggested by historical events (Gudmundsson and Bäckström, 1991).
The Fremrinamar Fissure Swarm is the third swarm of the Northern Volcanic Zone (from west to east) (Figure 1B). As in the case of the Theistareykir, it is characterised by a central volcano with no evidence of calderas (Gudmundsson and Bäckström, 1991), suggesting that the magma chamber is not shallow (Björsson, 1985). It extends for 125 km from its homonymous central volcano (Hjartardóttir et al., 2016b), where strong geothermal activity is localised (Tentler and Mazzoli, 2005). Magmatic products of the Fremrinamar Fissure Swarm cover a time span of 180 kyr, and consist of interglacial lavas, hyaloclastite piles from the last glaciation, and post-glacial lava flows (Tentler and Temperley, 2007). The Fremrinamar Fissure Swarm is mainly covered by large lava fields, with local rhyolitic extrusions (Tentler and Mazzoli, 2005) and two lava shields in the central volcano area (Einarsson, 2008). Fissure eruptions are common within the central portion of the Fremrinamar Fissure Swarm and are responsible for the partial filling of nearby grabens (Tentler and Mazzoli, 2005). As for the other fissure swarms of the Northern Volcanic Zone, eruptive fissures are mainly located near the central volcano, rarely exceeding distances of 2–3 km (Hjartardóttir et al., 2016b). The three main eruptive fissures of this area can be inferred by the presence of aligned craters and were active from prehistoric to historic times (8,000–2,500 yrBP) (Tentler and Mazzoli, 2005). From south to north, the Fremrinamar Fissure Swarm is characterised by a number of grabens, such as the Sveinar Graben (Figures 2C, D), which is located in its central area, near one of the main eruptive fissures of the system (Tentler and Mazzoli, 2005). A previous study by Hjartardóttir et al. (2016b) on fracture density, highlighted that Fremrinamar Fissure Swarm structures increase in the area of intersection with the Grímsey Lineament (Figure 1B).
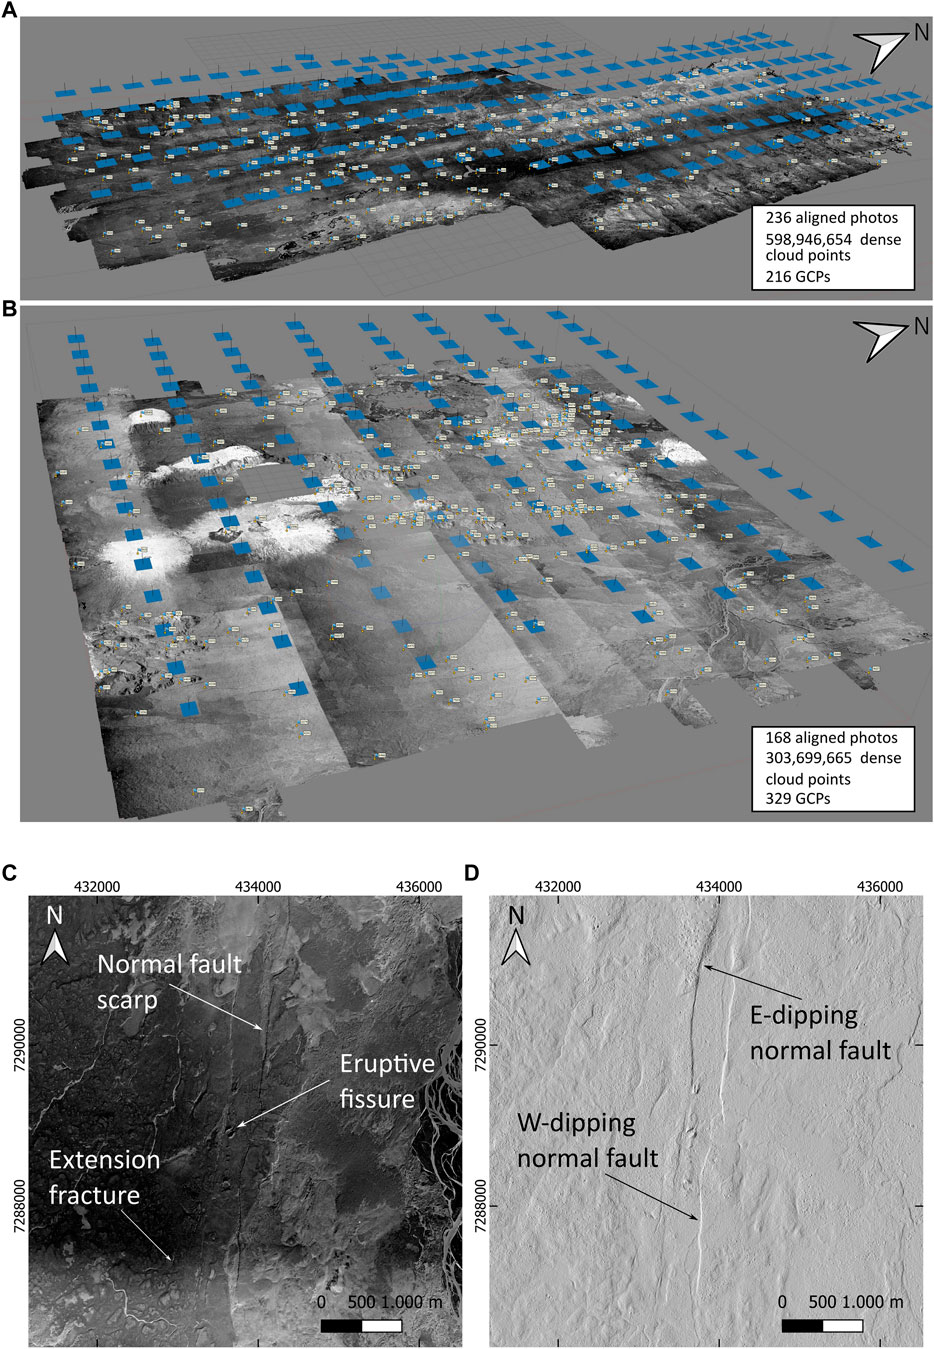
FIGURE 2. (A,B) Examples of dense point clouds, where aligned photos and Ground Control Points (GCPs) are showed; (C) detail of the orthomosaic used to identify the structures of the Fremrinamar Fissure Swarm; (D) particular of the Sveinar Graben, whose border faults are highlighted by applying a shaded view to the ≃2 m/pixel DSM obtained from photogrammetry processing.
3 Materials and methods
3.1 Mapping of the Fremrinamar Fissure Swarm structures
In this work, we identified all the structures that characterise the Fremrinamar Fissure Swarm through the analysis of original photogrammetry-derived orthomosaics and DSMs, created from different sets of historical aerial photos, reaching a pixel size of 0.53–0.65 and 2.14–2.59 m/pix, respectively (Figures 2C, D), as well as by field surveys. The consistency of DSMs derived from aerial photos has been already confirmed by Gomez et al. (2015), Ishiguro et al. (2016), and Grottoli et al. (2020).
A total of 404 aerial photographs were acquired from the National Land Survey of Iceland (https://www.lmi.is/). Images covering an interval of 8 years (1983, 1990, and 1991) were captured using a camera with a focal length of 151.78 mm, at a constant flight altitude of 5,486 m a.s.l., and with an overlap of 60% along the flight path (https://www.lmi.is/is). Images were processed with Agisoft Metashape v.1.7.1 (https://www.agisoft.com/), a Structure from Motion (SfM) software that allows to obtain spatial data from digital images. The SfM technique is based on the recognition of similar features from different images, acquired with a high degree of overlap (Westoby et al., 2012; Schonberger and Frahm, 2016; Bonali et al., 2019a), generally 60%–80%. Photo alignment was performed with medium accuracy settings, while the re-elaboration of the dense point clouds was performed with medium quality and mild depth filtering (further details are in Agisoft (2023)). These attributes were chosen, after different attempts, to reach the best compromise between good-quality results and relatively short-processing times. Due to the extent of the study area (130 × 8–9 km), we created two different point clouds with different sets of photos, taken in different years. To georeference the point clouds, 545 total recognisable features, or Ground Control Points (GCPs), of known coordinates were selected within the point clouds. X,Y,Z data are from the ISV50 database, from the National Land Survey of Iceland (https://www.lmi.is/is/landupplysingar/gagnagrunnar/is-50v). We obtained two orthomosaics, with resolutions of 0.53 and 0.65 m/pixel, and two DSMs, with resolutions of 2.14 and 2.59 m/pixel, both referenced to the UTM28N-WGS84 datum. The resulting resolutions are comparable with the one of existing DSMs, such as the ArcticDEM (https://www.pgc.umn.edu/data/arcticdem/) which is derived from high-resolution satellite images, reaching a resolution of 2 m/pix, within the study area. The perspective of being able to merge the analysis of DSMs and the associated orthomosaics, led us to select them as the best tool to evaluate and classify the features that compose the Fremrinamar Fissure Swarm.
The Fremrinamar Fissure Swarm was then mapped at a 1:50,000 scale in a GIS environment (QGis v. 3.28.4), to achieve a better characterisation if compared to the current state of the art, which is a depiction at a scale of 1:250,000 up to 1:100,000 (Sæmundsson, 1977; Sæmundsson et al., 2012; Sigurgeirsson et al., 2015). The scale of the analysis was also selected following equation 13.1 from Gudmundsson (2011), which points out that when the ratio between half the strike dimension of a fracture segment and half the distance between the midpoints of collinear segments gets closer to the value 1, the segments act as a single fracture (for more details, see Sneddon and Lowengrub, 1969; Gray, 1992). This approach has been applied on key areas, where structures were identified and mapped. We observed that a classification at a scale of 1:50,000 gives similar results as the one performed with the above-mentioned criterion.
Structures composing the Fremrinamar Fissure Swarm were classified into eruptive fissures, dry fissures (here referred to as extension fractures), and normal faults. The latter were recognised through the identification of better-lit or shaded slopes on orthomosaics and shaded DSMs, also classifying them into E− and W-dipping scarps (Figures 2C, D). Eruptive fissures were identified by their proximity to volcanic deposits or through the morphometric analysis of eruptive centres (for details on the method see Tibaldi, 1995; Tibaldi and Bonali, 2017).
3.2 Data collection and analysis
We proceeded with a quantitative analysis of our dataset, determining length and azimuth values for each structure, as well as the X and Y coordinates of the structures’ mean points. The previous parameters were related through the realisation of scatterplots to evaluate their variation along the entire Fremrinamar Fissure Swarm. A total of 761 normal faults were identified and characterised, also measuring their vertical offsets (Figure 3A), through the implementation of topographic profiles on photogrammetry-derived DSMs. Here, the vertical offset is given by the difference in elevation between the tangent to the top and the bottom of each scarp (e.g., Hjartardóttir and Einarsson, 2021). Fracture density and spacing were evaluated through 263 N106°E-striking transects, spaced 500 m from each other, both considering the entire dataset and one subgroup at a time (eruptive fissures, extension fractures, and normal faults). For normal faults with a length >2 km, slip profiles (or displacement-length profiles) were collected to evaluate the overall along-axis rift propagation of the Fremrinamar Fissure Swarm (details of the method in Manighetti et al. (2001); Tibaldi et al. (2020a)). These profiles are representative of the fault offset variation compared to its length. Similar analyses, performed worldwide, show that although slip profiles have great variability in their shape, they often display similar first-order asymmetrical geometry, as shown by Manighetti et al. (2001).
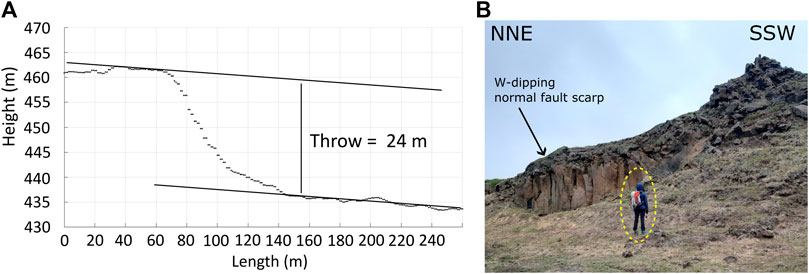
FIGURE 3. (A) Scarp profile measured from one of the resulting DSMs. (B) Example of a W-dipping normal fault of the Sveinar Graben, whose vertical offset values were validated in the field. Person for scale.
Measuring points were placed at a distance of 200 m from each other, along the normal fault scarps, and offset values were collected through the obtained DSMs. Slip profiles were then classified in five classes, based on a quality parameter that evaluates the consistency and linearity of a fault scarp, along its strike dimension, and the affected substrate (PRE- or POST-LGM). Results were analysed without considering fault scarps that are too eroded and thus do not allow to clearly infer a propagation direction, regardless of whether they cut through PRE- or POST-LGM units (class E). Afterwards, faults showing local erosion of their scarp, and affecting PRE- and POST-LGM units, were excluded (classes C and D, respectively) and the analysis focused only on the normal faults that do not show any interruption or clear local erosion of their scarps, both in PRE- and POST-LGM units (classes A and B, respectively).
Field surveys were then performed to: i) validate the classification of structures based on remote sensing analysis; ii) validate fracture length and azimuth, especially focusing on specific locations; iii) integrate the dataset with structures under the resolution level of our DSMs. In the field, additional scarps with a continuous vertical offset ≥1.0 m were identified (Figure 3B).
4 Results
4.1 Fracture geometry and distribution
The analysis of the Fremrinamar Fissure Swarm at a scale of 1: 50,000 allowed us to identify 2,035 structures (Figures 4A–C), classified in 146 eruptive fissures (7.2%), 1,128 extension fractures (55.4%), and 761 normal faults (37.4%) of which 421 dip towards the east and 340 towards the west. The overall group of structures strike N-S to NNE-SSW predominantly, with a peak between N0°E and N10°E, associated with minor peaks striking NNW-SSE (Figures 4D, 5A). The average strike value is N6.8°E with a standard deviation (SD) of 15.7°. Structure length ranges from 7.7 to 14,200 m, with a mean value of 437.2 m and a SD of 799.5 m (Figure 6A). Eruptive fissures show a general NNE-SSW strike, with a major peak between N10°E and N20°E. The average strike value is N14.4°E with a SD of 13.9° (Figures 4E, 5B). They reach a maximum length of 2,485.2 m, with a mean value of 286.2 m and a SD of 298 m (Figure 6B). Extension fractures display a broad N-S to NNE-SSW strike, with a major N0E° to N10°E peak, and minor NNW-SSE peaks. The mean strike value is N7.4°E, with a SD of 16.3° (Figures 4F, 5C). Extension fractures show a maximum length of 2,508 m, with an average value of 165.5 m and a SD of 178.3 m (Figure 6C). Normal faults broadly show a N-S strike, with a major peak between N0°E to N10°E, and minor NNW-SSE to NNE-SSW peaks (Figures 4G, 5D). Both E-dipping and W-dipping normal faults show the same general trend and major peaks (Figures 4H, I). Normal faults exhibit a mean strike of N4.5°E and a SD of 14.5°. E-dipping normal faults display an average strike value of N4.2°E and a SD of 13.6°. W-dipping normal faults, however, show greater variability, with an average strike of N4.9°E and a SD of 15.6°. Normal faults generally display higher length values, if compared to the other structures of the fissure swarm. The highest value, 14,200 m, is reached by a W-dipping normal fault. The average length value for the entire normal fault set is 869 m, with a SD of 1,160 m (Figure 6D). E− and W-dipping normal faults display mean length values of 800 and 954 m, and a SD of 989 and 1,338 m, respectively (Figures 6E, F).
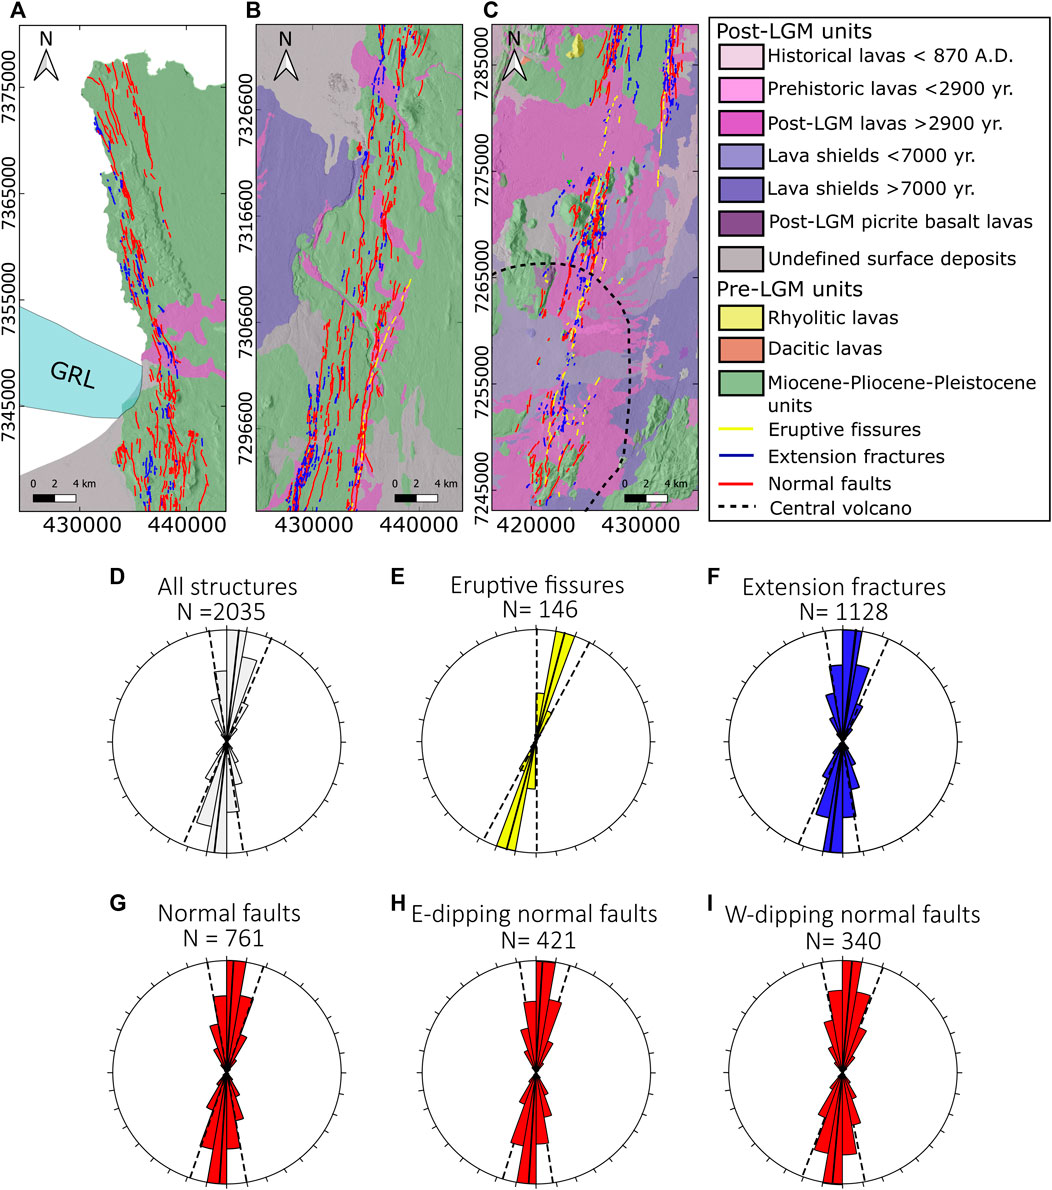
FIGURE 4. (A–C) Map of the entire Fremrinamar fissure swarm, whose structures are classified and defined through different colours. Historical photos-derived DSMs are used as a background for the Fremrinamar Fissure Swarm, whereas the ArcticDEM is used for the other fissure swarms of the NVZ. The light blue area represents the Grimsey Lineament. Geological units were modified from Sæmundsson et al. (2012) and Sigurgeirsson et al. (2015). Rose diagrams of the entire dataset (D), eruptive fissures (E), extension fractures (F), normal faults (G), E-dipping normal faults (H), and W-dipping normal faults (I) are reported. Black solid lines define the average strike values, whereas black dashed lines identify the standard deviation.
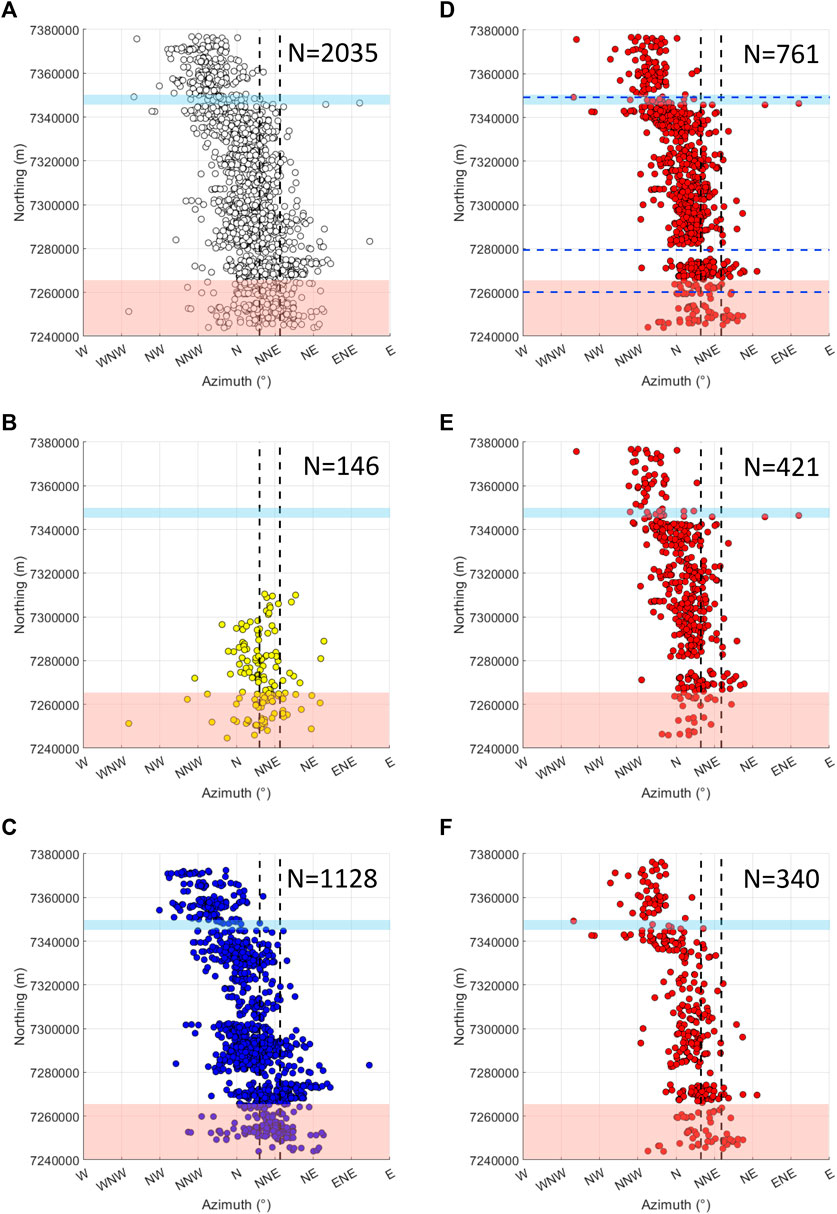
FIGURE 5. Relation between strike values and the Y coordinate (here referred to as “Northing”) for the entire dataset of structures (A), eruptive fissures (B), extension fractures (C), normal faults (D), E-dipping normal faults (E), and W-dipping normal faults (F). Blue dashed lines (in D), identify the areas covered by more recent lava flows. Black dashed lines identify the perpendicular to the main spreading directions of the NVZ (a review of these directions is given in Corti et al. (2021)). The red and the light blue areas identify the Fremrinamar central volcano and the Grimsey Lineament, respectively.
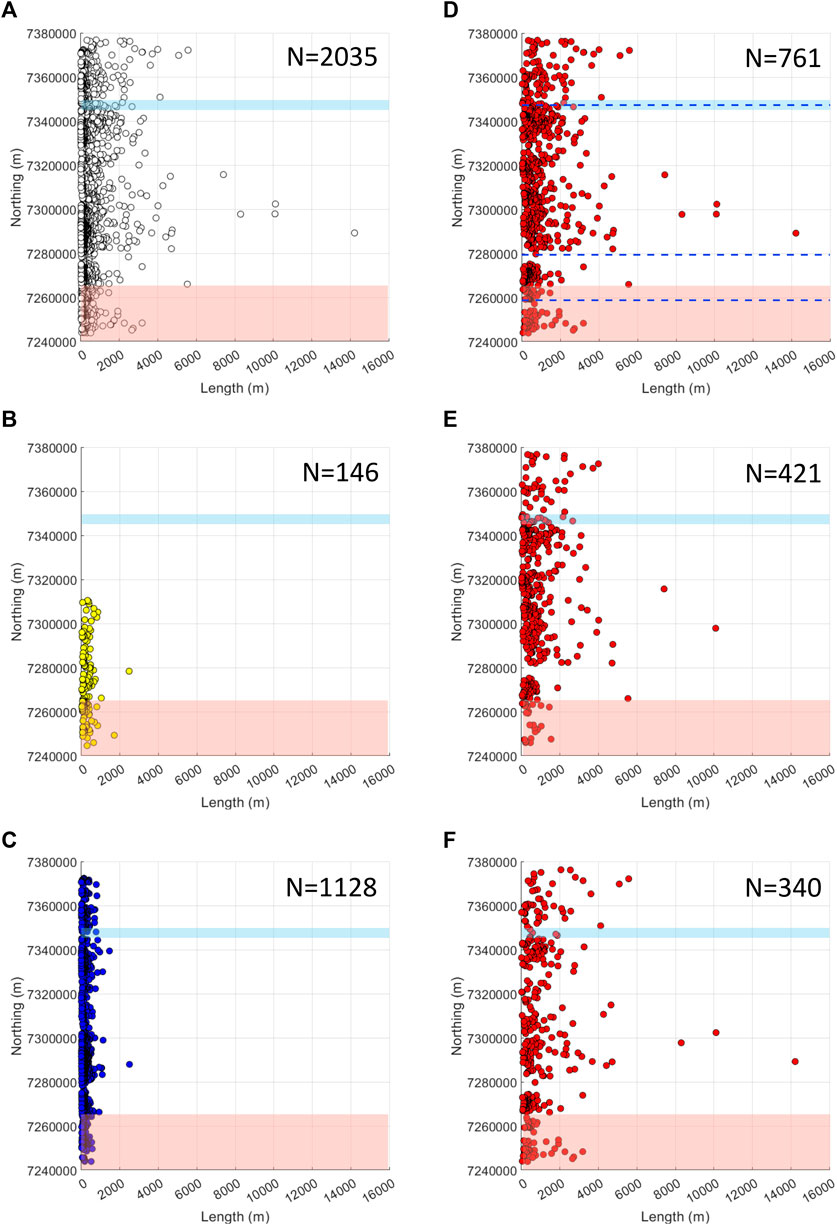
FIGURE 6. Relation between length values and the Y coordinate (here referred to as “Northing”) for the entire dataset of structures (A), eruptive fissures (B), extension fractures (C), normal faults (D), E-dipping normal faults (E), and W-dipping normal faults (F). Blue dashed lines (in D), identify the areas covered by more recent lava flows. The red and the light blue areas identify the Fremrinamar central volcano and the Grimsey Lineament, respectively.
Both strike and length values were related to the UTM X-Y coordinates (UTM zone 28N - WGS84) to evaluate the spatial variation of our dataset. Specifically, the Fremrinamar Fissure Swarm covers an area of 130 × 8–9 km (Figures 4A–C). Normal faults seem to have the highest spatial distribution, covering the entire fissure swarm from south to north. It is possible to notice three gaps in their spatial covering, near the Y coordinates 7,260,000, 7,280,000, and 7,350,000 (Figures 5D, 6D). This could be due to the presence of the more recent Ketildyngja, Búrfell and Sveinar lava flows (4.0, 3.2, and 11 ka, respectively) (Sæmundsson et al., 2012) covering the area and concealing these structures. Extension fractures show a more limited spatial distribution than normal faults (Figures 5C, 6C), while eruptive fissures are mainly located in the southern area of the system, where the central volcano is located (Figures 5B, 6B). It is possible to observe that the fissure swarm shows the highest variability in strike values in its southern portion. Moreover, strike values show a clear anticlockwise rotation starting from the Y coordinate 7,340,000, from a prevailing N-S to NNE-SSW strike in the southern area to predominant NNW-SSE values in the northern one (Figure 5A). This rotation is clearly displayed by the entire dataset, and becomes indisputable when analysing extension fractures (Figure 5C).
Structure length distribution is not constant along the entire system but shows its highest values in the central portion of the fissure swarm (Figure 6A). This is particularly clear for the normal faults subgroup (Figures 6D–F).
The spatial relation between our dataset and the X coordinate (UTM zone 28N - WGS84) was evaluated but did not provide any innovative results (for details see the Supplementary Materials).
For the entire dataset, the longest structures display a N-S strike, specifically between N0°E and N10°E (Figure 7A). The greatest lengths are reached by normal faults (Figures 7D–F), while eruptive fissures and extension fractures, although showing the same strike distribution, hardly exceed 2000 m in length (Figures 7B, C).
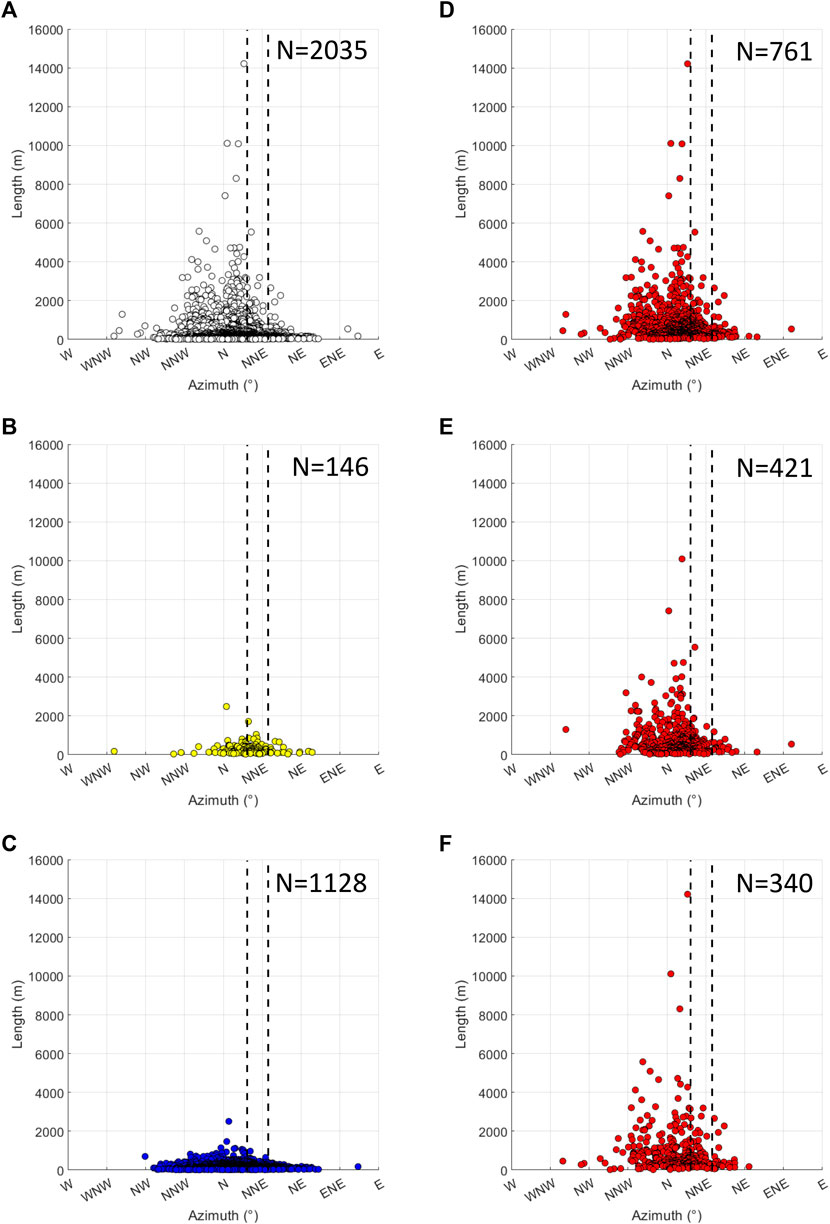
FIGURE 7. Relation between strike and length values for the entire dataset of structures (A), eruptive fissures (B), extension fractures (C), normal faults (D), E-dipping normal faults (E), and W-dipping normal faults (F). Black dashed lines identify the perpendicular to the main spreading direction of the NVZ (a review of these directions is provided in Corti et al. (2021)).
4.2 Fracture density and spacing
The analysis of fracture density was performed through 263 transects, with a spacing of 500 m and striking N106°E (Figures 8A–C), hence parallel to the regional direction of plate spreading in the Northern Volcanic Zone (Hjartardóttir et al., 2012). For each transect, we recorded the number of intersecting structures (i.e., fracture density), first considering the entire dataset (Figure 8D), and then distinguishing between eruptive fissures (Figure 9A), extension fractures (Figure 10A), and normal faults (Figure 11A), also considering their dip direction (Figures 11E, G). For the entire dataset we also recorded the rift width, evaluating the distance between the westernmost and the easternmost structures along each transect (Figure 8E), and the average spacing (Figure 8F). Also, we reported the distance between the westernmost and easternmost structures only considering similar features (referred to as “width” in the graphs) and their average spacing through the ratio width/N. of a single type of feature (Figures 9B, C, 10B, C, 11B, C, F, H). Along each transect we also considered the dilation (Figure 11D) starting from the extrapolation of fault heave, considering a fault dip of 75° (which corresponds to the mean dip observed for Pleistocene to Holocene normal faults within lava successions in Iceland) (Forslund and Gudmundsson, 1991).
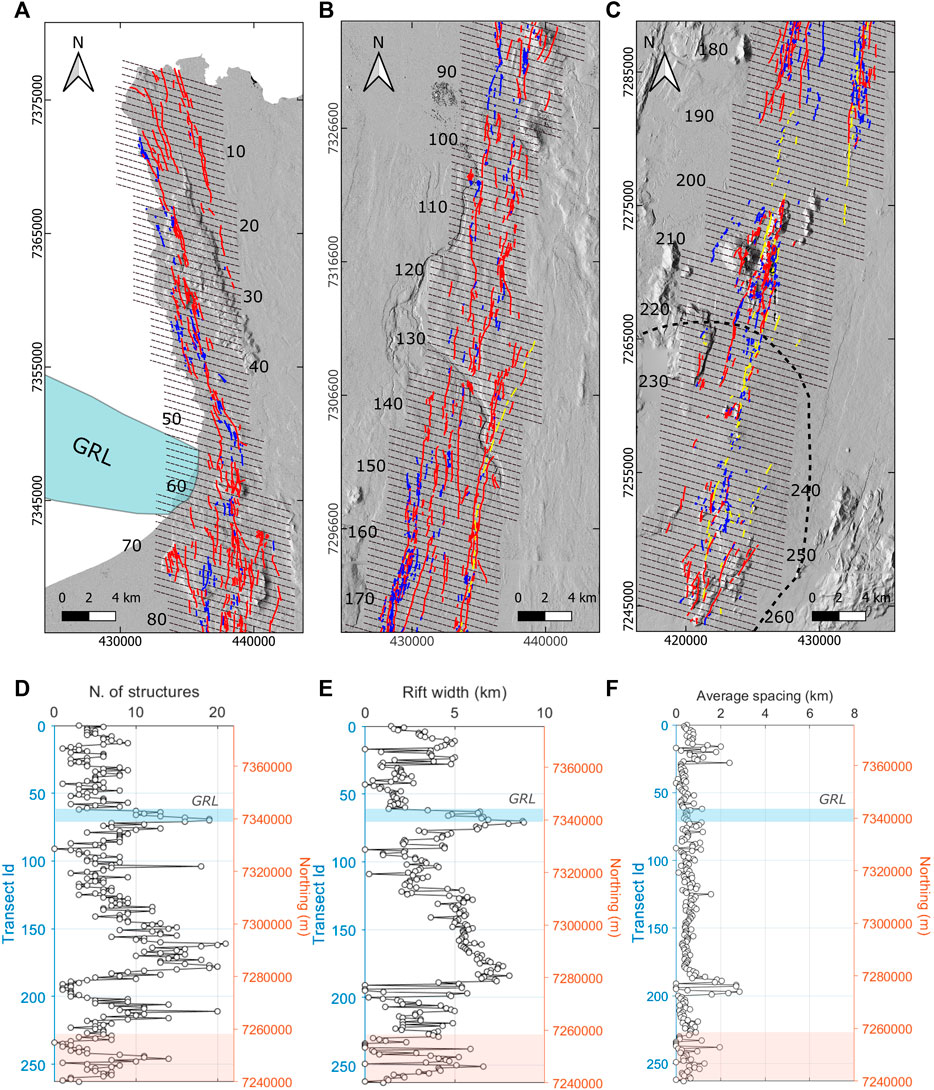
FIGURE 8. (A–C) Structural map of the entire Fremrinamar Fissure Swarm and its central volcano (black thick dashed line) with historical photos-derived DSMs as background. The black fine lines represent the N106°E transects defined to evaluate (D) the total number of structures, (E) the rift width, and (F) the average spacing of structures along the rift. The red and the light blue areas represent the Fremrinamar central volcano and the Grimsey Lineament, respectively.
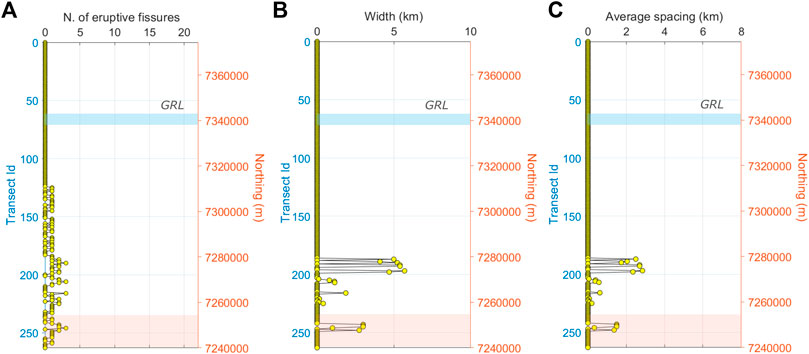
FIGURE 9. Graphs displaying (A) the total number of eruptive fissures, (B) the width of the area covered by eruptive fissures, and (C) the average spacing of eruptive fissures along each transect. The red and the light blue areas represent the Fremrinamar central volcano and the Grimsey Lineament, respectively.
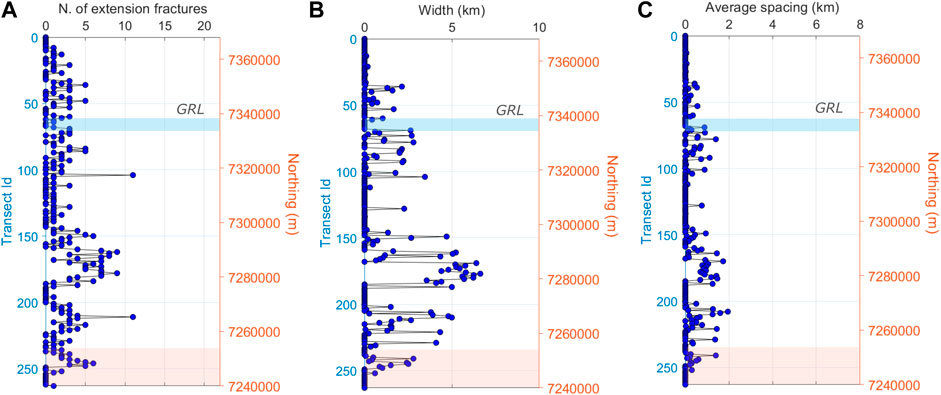
FIGURE 10. Graphs displaying (A) the total number of extension fractures, (B) the width of the area covered by extension fractures, and (C) the average spacing of extension fractures along each transect. The red and the light blue areas represent the Fremrinamar central volcano and the Grimsey Lineament, respectively.
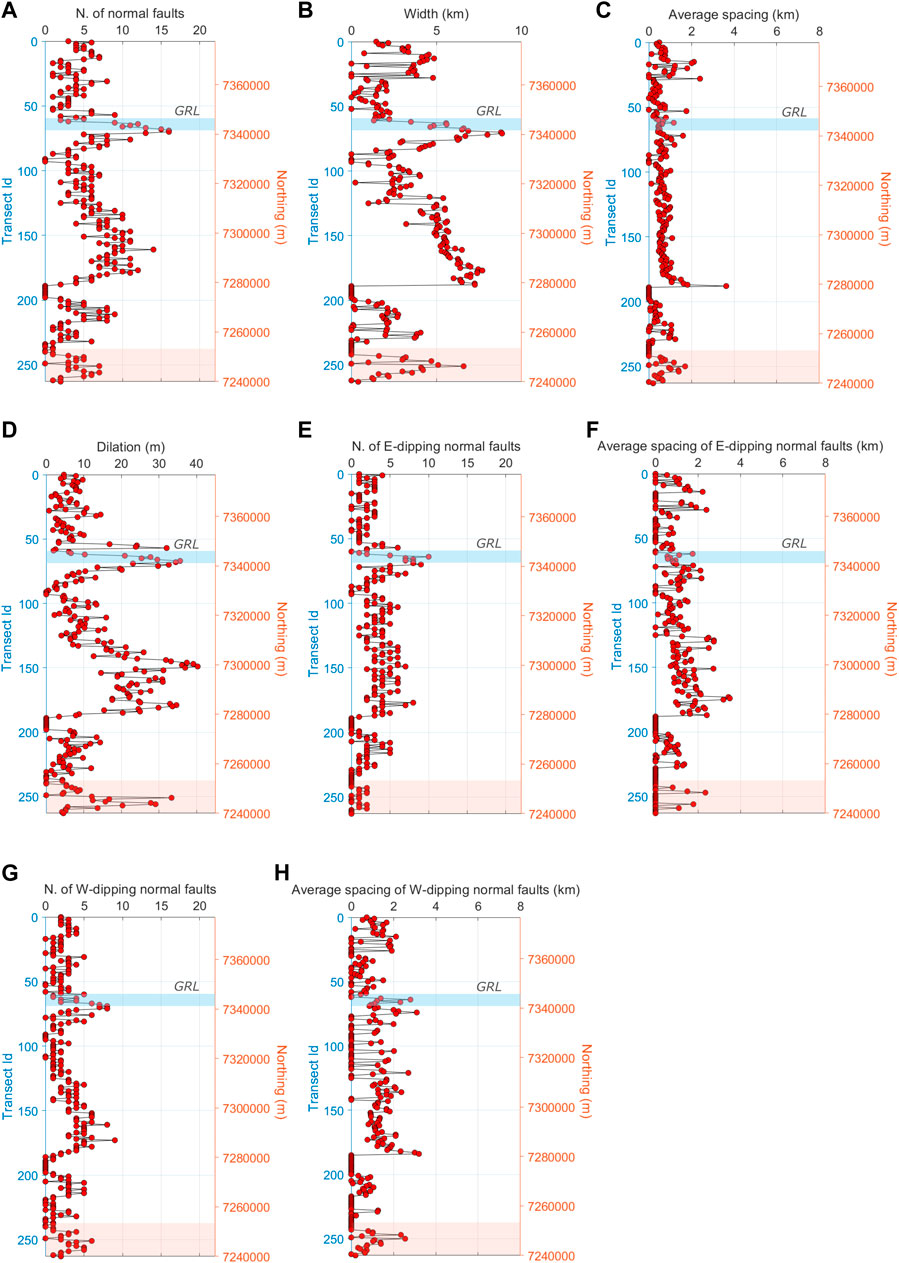
FIGURE 11. Graphs displaying (A) the total number of normal faults, (B) the width of the area covered by normal faults, (C) the average spacing of normal faults along each transect, and (D) the dilation along each transect only considering normal faults. The total number of faults was also evaluated for (E) E-dipping normal faults and (G) W-dipping ones. The average spacing was also considered for (F) E− and (H) W-dipping normal faults. The red and the light blue areas represent the Fremrinamar central volcano and the Grimsey Lineament, respectively.
For the entire dataset of structures, the highest density (21) is reached along transect 161 (Figure 8D). Fracture density is not consistent along the entire rift. Starting from the northernmost portion of the fissure swarm, it is possible to identify a gradual increase in structure density up to transect 69 (near the intersection with the Grímsey Lineament), where the first peak is located (19 structures). This is followed by an area of decreasing density of fractures up to transect 91, where there is a gradual increase in the number of structures all the way up to the previously mentioned maximum peak, at transect 161. In the southern portion of the rift, the fracture pattern is mostly irregular, with two areas characterised by a paucity of structures, between transects 188 and 205, and near the central volcano. These areas are marked by the presence of more recent lava flows, concealing older structures (as already mentioned in paragraph 4.1). Rift width varies from 0 to 8.8 km, with the highest value reached at transect 71 and a tendency to decrease northward (Figure 8E). The southern and northern parts of the fissure swarm are generally characterised by the lowest width values, with a mean value of ≃3 km. An irregular trend in rift width characterises the southern portion. The average spacing of the fissure swarm reaches its maximum value (≃3 km) at transect 197 (Figure 8F). The highest values are widely located in the central portion of the rift, while deformation becomes more localised elsewhere. The average spacing in the northern and southern areas is rather steady with two peak areas, near transects 28 and 240.
The number of eruptive fissures equals zero up to transect 125 (Figure 9A), where it is possible to observe a gentle increase in their number towards the south, as a maximum peak of 3 eruptive fissures is reached at transects 190, 206, 216, and 246. The width of the fractured area equals zero up to transect 187 (Figure 9B), with a gradual increase up to transect 197, where it reaches its maximum (5.7 km). In the southern portion of the rift, the width of the fractured area is uneven and generally confined within the range of 1–3 km. The average spacing of eruptive fissures equals zero in the northern part of the rift and reaches a peak of 2.85 km at transect 197 (Figure 9C). Values are generally higher in the central portion of the rift, including values within the range of 2–3 km, than in the southern portion, where values are within the range of 1–2 km.
The northernmost portion of the Fremrinamar Fissure Swarm is characterised by the absence of extension fractures for the first 4 km. Up to transect 48 it is possible to observe a gentle increase in their number, followed by a subsequent decrease. Fracture density is mainly concentrated in the central and southern portions of the rift (Figure 10A). Two main peaks of 11 extension fractures are reached at transects 204 and 211. Rift width presents a clear, gradual increase in its values up to transect 177, where it reaches the peak of 6.63 km (Figure 10B); this is followed by a decrease in its southernmost portion, becoming null from transect 253. Average spacing values show a similar configuration, with the highest values located in the central and southern portions of the rift (Figure 10C). Values range from 0 to 1.4 km in the northern area, and from 0 to 1.7 km in the central one, while in the southern area the spacing ranges from 0 up to the maximum, 1.95 km, at transect 208.
Normal faults cover the entire fissure swarm from north to south, but they are mainly located in the northern and central portions of the fissure swarms (Figure 11A). The main peak of 16 normal faults is reached at transects 69 and 70 (within the intersection with the Grímsey Lineament), while it is possible to identify a slightly smaller peak (14 faults) at transect 161. The number of normal faults equals zero between transects 189 and 198 and clearly decreases near the central volcano. This could be due to the presence of younger lava flows covering the area (as already noticed in Figures 5D, 6D). E-and-W-dipping normal faults show a similar pattern, with the highest structure density located in the northern and central areas of the rift, and a subsequent decrease near the central volcano (Figures 11E, G). The main peak of E-dipping normal faults is located at transect 64, with a total of 10 scarps, and a second one (8 scarps) at transect 177 (Figure 11E). W-dipping normal faults reach a major peak of 9 scarps at transect 173, and show a minor one (8 scarps) between transects 71 and 69 (Figure 11G).
The area covered by normal fault scarps (“width” in the graphs) is quite heterogeneous along the fissure swarm (Figure 11B). From transect 0 to 28, values range from 0 to 4.86 km, while they show a decrease up to transect 62. Successively, the rift is characterised by higher width values, reaching a peak of 8.86 km at transect 71 (Figure 11B). From this point and up to transect 125 there is a slight decrease in width values, followed by an increment up to the second peak (7.46 km) at transect 176. The width of the faulted area is less evolved in the southern part of the rift and shows two main areas where values are equal to zero (possibly linked to the presence of recent lava flows, as explained before). The average spacing of normal faults is moderately consistent along the rift (Figure 11C), although it is possible to notice slightly higher spacing in its northernmost area. However, the maximum value of 3.63 km is however reached at transect 188. In the southern part of the fissure swarm, spacing values show a small increase up to the area near the central volcano, followed by a decrease up to the southernmost section. The average spacing of E− and W-dipping normal faults displays an analogous arrangement, with the higher values located in the northern part of the rift, and a slight increase of spacing values towards transects 187 and 184 respectively (Figures 11F, H). The southern area is characterised by a lack of faults, followed by a modest increase as far as the central volcano, accompanied by a decrease towards the southernmost sections.
The analysis of the dilation highlights that this value clearly decreases from the southern sector of the Fremrinamar Fissure Swarm toward the northern area (Figure 11D); this becomes more evident if the southernmost portion of the fissure swarm, where more recent lava flows cover the structure, is omitted. This distribution, suggesting a higher deformation in the southern Fremrinamar Fissure Swarm, could be an indicator of the direction towards which the deformation is developing. Dilation values also display a strong local increase in the area where the Fremrinamar Fissure Swarm intersects the GRL.
Regarding the relationship between eruptive fissures and normal faults, we noticed that most fissures are located within the first 600 m from a normal fault scarp (Figure 12A) and very few eruptive fissures are located at their tip or along normal faults (yellow column in Figure 12A). Considering eruptive fissures that are located within a graben, we observed that they are usually shifted towards one of the border faults, and only in few cases they are situated at the centre of the graben (Figure 12B).
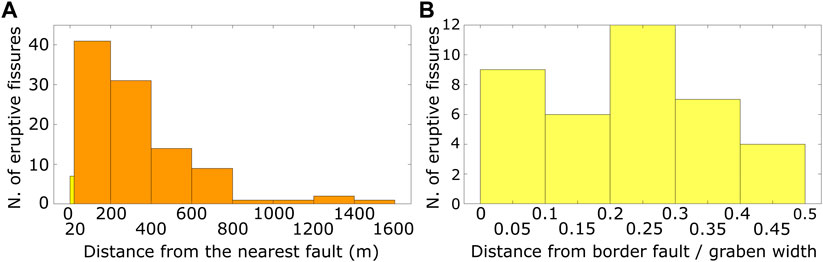
FIGURE 12. Graph showing (A) the distribution of distances between eruptive fissures and normal faults; the thin yellow column, in the left-hand side of the graph, highlights the eruptive fissures located along or at the tip of normal faults, and (B) the position of eruptive fissures within the graben they are located in.
4.3 Slip profiles and extension values
Our dataset includes 76 normal faults (with a total length > 2 km), among which 3 (≃4%) show a symmetrical profile (Figure 13A and Supplementary Figure S3), 58 (76.3%) an asymmetrical one (Figures 13C, D), and 15 (19.7%) were not classified (class E) due to extensive erosion of the scarps or offsets beneath the resolution limit of our DSM (Figure 13B and Supplementary Figure S4). The analysis of slip profiles (of classes from A to D) allowed us to classify the direction towards which the deformation is developing for the asymmetrical ones, revealing 31 (40.8%) profiles propagating towards the north (Figure 13C and Supplementary Figure S5), and 27 (35.5%) profiles defined by a southward propagation (Figure 13D and Supplementary Figure S6). In Figure 14 we show the faults of the Fremrinamar Fissure Swarm with colours corresponding to the four types of slip profiles. It is possible to observe a slight predominance of north-tapering slip profiles, within the Fremrinamar Fissure Swarm, considering scarps belonging to classes from A to D.
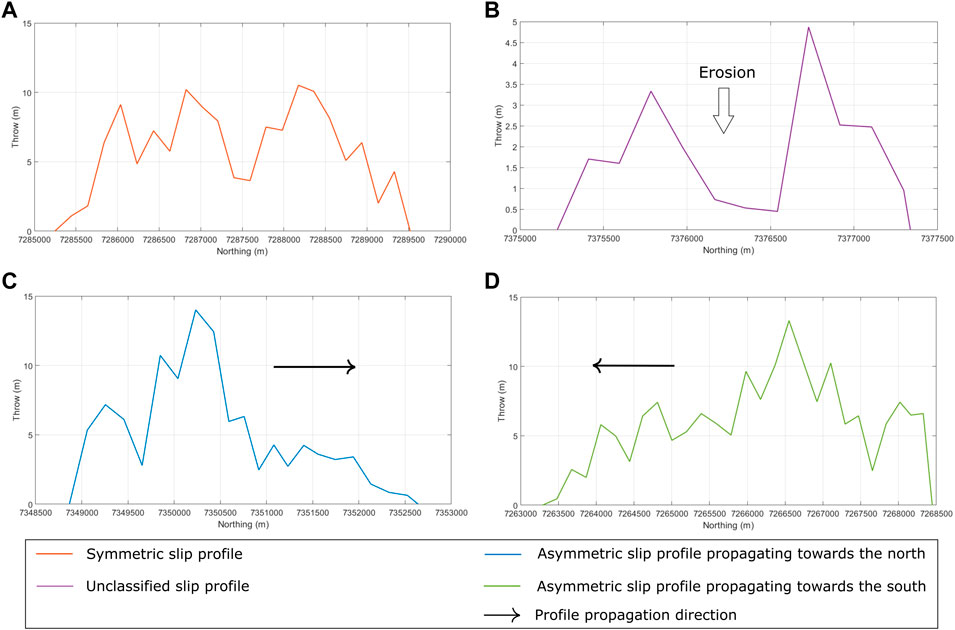
FIGURE 13. Examples of (A) a symmetric slip profile, (B) an unclassified slip profile (class E), and asymmetrical slip profiles showing a propagation direction towards (C) the north and (D) the south.
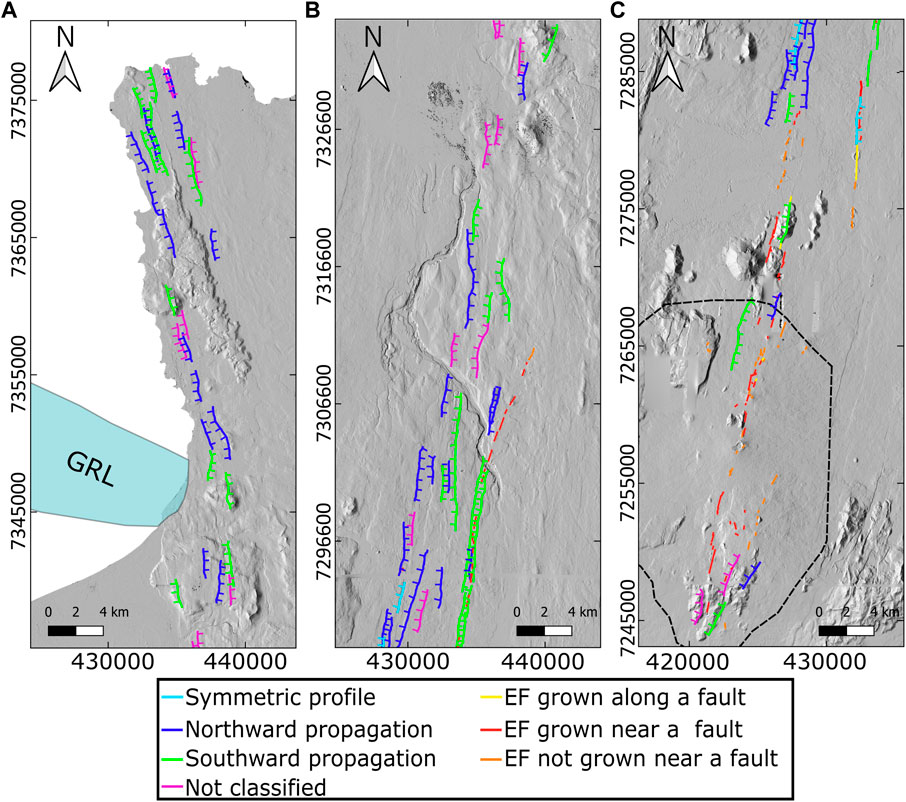
FIGURE 14. Main normal faults (of classes from A to D), with length >2 km, located in the northern (A), central (B) and southern (C) segments of the Fremrinamar Fissure Swarm, distinguished based on the slip profiles. Ticks on the downthrown side of normal faults. Eruptive fissures are represented with different colours based on their location away from the nearest fault. Historical photos-derived DSMs are used as a background for the Fremrinamar Fissure Swarm. The black dashed line identifies the Fremrinamar central volcano. The light blue area represents the Grimsey Lineament.
The difference becomes more evident considering only normal fault scarps belonging to classes A and B, which are the most reliable, where we obtained 14 profiles tapering towards the north, with a cumulative length of 55.5 km, and 10 profiles tapering towards the south, with a cumulative length of 32.3 km.
For the entire set of normal faults, we collected maximum throw values (as reported in section 3.2). Generally, the highest throw values are located in the southern and central portion of the Fremrinamar Fissure Swarm (Figure 15). It is possible to observe a slight increase in throw values for normal faults located within the intersection with the Grímsey Lineament, and a clear decrease in these values north of it.
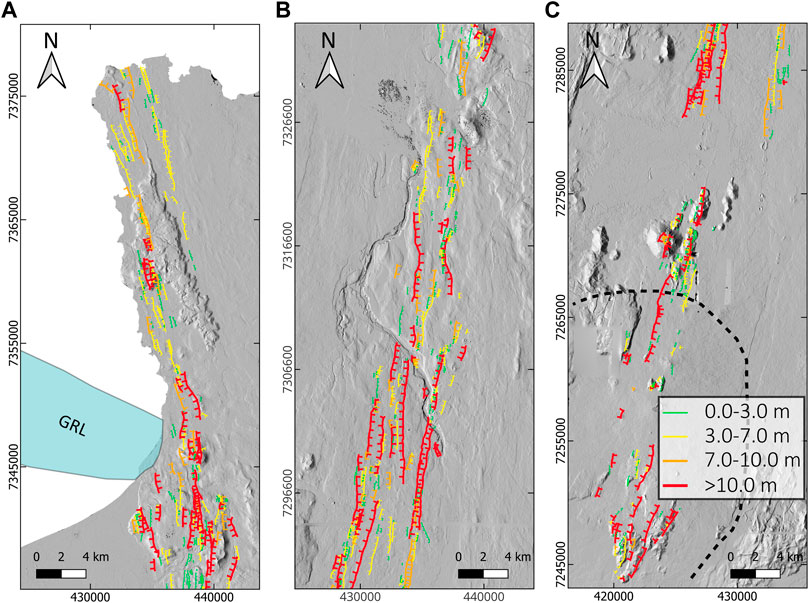
FIGURE 15. (A-C) Entire set of normal faults of the Fremrinamar Fissure Swarm, distinguished and classified according to different ranges of maximum vertical throw. Ticks on the downthrown side of normal faults. The black dashed line identifies the Fremrinamar central volcano. The light blue area represents the Grimsey Lineament.
5 Discussion
5.1 Rift architecture and extension
The general architecture of the Fremrinamar Fissure Swarm is characterised by the change of the overall trend from N-S/NNE-SSW in the central-southern part to NNW-SSE in the northern part (Figure 5). Considering that the azimuth of the regional tectonic spreading for the Northern Volcanic Zone is around N104-106°E, according to geomagnetic data (as far back in time as 2.6 Ma) (DeMets et al., 1994; DeMets et al., 2010; Hjartardóttir et al., 2012), the overall azimuth of the Fremrinamar Fissure Swarm structures is mostly orthogonal to the regional least principal stress (σ3), but only in the southern and central part. This is consistent also if we consider other spreading vector values based on GPS data from the last 25 years (Metzger et al., 2011; Metzger et al., 2013; Drouin et al., 2017; Sigmundsson et al., 2020). This change of the overall fracture trend, occurs in correspondence of the intersection with the Grímsey Lineament (Figure 4A). This area of intersection is commonly reported in previous papers (e.g., Einarsson, 1991; Hjartardóttir et al., 2016b). The Grímsey Lineament is composed of a series of 5–20 km wide NNW-trending offshore grabens, with dominant normal faulting along NNW- to N-S-striking planes and subordinate strike-slip faulting (Rögnvaldsson et al., 1998; Lund and Townend, 2007). We would like to underscore that our field observations did not suggest any clear strike-slip movements in the Grímsey Lineament-Fremrinamar Fissure Swarm overlapping area, nor did we recognise any strike-slip offset landforms on the high-resolution mosaics. Since the entire northern part of the Fremrinamar Fissure Swarm shows an anticlockwise rotation of the whole set of fractures, it seems that the Fremrinamar Fissure Swarm here rotates around a “pivot” point assuming an orientation parallel to the grabens of the Grímsey Lineament. Such observations support the hypothesis explained in the model of Gudmundsson (2007), where the Grímsey Lineament is related to the propagation of the Fremrinamar Fissure Swarm to the north, towards the Kolbeinsey Ridge. The stress field generated by their interaction results in the northernmost part of the Fremrinamar Fissure Swarm bending towards the Kolbeinsey Ridge, as shown by our data (Figure 5). The en-échelon system of grabens and horsts which constitutes the currently active Grímsey Lineament (Gudmundsson, 1993) forms a part of the bent and overlapping extension of the Fremrinamar Fissure Swarm. Additionally, Rögnvaldsson et al. (1998) showed that most earthquakes associated with the Grímsey Lineament occur on N-striking left-lateral strike-slip faults, and that no through-going WNW-striking faults parallel to the Grímsey Lineament are present. With regard to this, we would like to point out that the rift zones belonging to the Northern Volcanic Zone are arranged with an overall left-stepping geometry, consistent with the interaction with the Kolbeinsey Ridge.
This overall observation results in an anticlockwise rotation of maximum horizontal stress (σhmax) and minimum horizontal stress (σhmin) near the ends of the rift zones of the Northern Volcanic Zone, which could be recognised at the level of surface structures. Differently from Pasquaré Mariotto et al. (2015), who studied the intersection between the Húsavík-Flatey Fault and the Theistareykir Fissure Swarm, in our case it was not possible to define the local orientation of σ3 due to a lack of opening vectors along the extension fractures. However, we can assume the orientation of the structures as representative for the local σhmax (Gudmundsson et al., 1993). This interpretation can be made at least for the post-LGM, since normal faults in the north are not eroded by glaciers, as we observed during the field survey. A rotation of the σhmax and σhmin north of the Grímsey Lineament can be extended as far back as 1 Ma, according to the model proposed by Gudmundsson (2007).
We also noticed that the longest structures are not perpendicular to the plate spreading direction (Figure 7), either north or south of the intersection with the Grímsey Lineament. The possible change in direction north of it has been already explained above and can follow the scheme from Gudmundsson (2007). South of it, in the case of direct control of plate tectonics, we could expect that the structures would become longer, and thus more developed, as they gradually assume a strike perpendicular to the regional far-field tectonic extensional stress. The regional spreading values of N106°E (Hjartardóttir et al., 2012) and N112°E (Drouin et al., 2017) for the whole Northern Volcanic Zone, increase to N109°E and N115°E for the northern part of the Northern Volcanic Zone (Metzger et al., 2011; Metzger et al., 2013). Our data indicate that extensional deformation occurs mostly along N90°-100°E values, thus suggesting a slight anti-clockwise rotation of the spreading direction along the Fremrinamar Fissure Swarm. This behaviour was already observed by Corti et al. (2021), who found an overall average spreading direction of N99.5°E along the nearby Krafla Fissure Swarm. To explain it, Corti et al. (2021) suggested two hypotheses, which might be complementary: i) the development of the structures has been influenced by the propagation of magma from the magma chamber below the central volcano; ii) the regional stress field has a local slight reorientation in the southern part of the rift, where σ3 attains a more E-W trend. We would like to highlight the fact that the spreading directions collected at the Fremrinamar Fissure Swarm and Krafla Fissure Swarm are based on geological data that cover the Holocene time span. Therefore, also the time range difference might explain the more marked rotation of spreading compared to GPS data, which are related only to the last 25 years.
Finally, we found that normal faults along the Fremrinamar Fissure Swarm have an asymmetric development, with the west-dipping faults being longer, having a wider range of strike, and being slightly less abundant than the east-dipping faults (Supplementary Table S1). This suggested that the west-dipping faults are more capable of accommodating the extensional deformation and are more mature. With regard to the latter point, Drouin et al. (2017) suggest that, based on GPS data, the axial zone of the Northern Volcanic Zone corresponds to the Krafla Fissure Swarm, as indicated also by the data from Sigmundsson et al. (2020). This implies that the Fremrinamar Fissure Swarm could represent the eastern part of the Mid-Atlantic ridge, where a predominance of west-dipping faults is expected. Differently, the Theistareykir Fissure Swarm is located to the west of the Krafla Fissure Swarm, and shows a series of well-developed east-dipping normal faults (Tibaldi et al., 2020a). This overall scheme is in agreement with the architecture that is expected for slow spreading oceanic ridges, where normal faults predominantly face the axial zone, as highlighted for the Reykjanes Ridge (Searle and Laughton, 1981). Additionally, we observed that longer west-dipping faults are located south of the intersection between the Fremrinamar Fissure Swarm and the Grímsey Lineament, and decrease north of it, together with the rift width. This decrease is noticed especially if we consider faults longer than 2 km (Supplementary Table S2). This can be interpreted as due to a greater extension south of the intersection, where most strain is expected, considering available GPS data (Metzger et al., 2011; Drouin et al., 2017; Sigmundsson et al., 2020).
It is interesting to compare the above observations with similar settings in the conterminous rift zones. In the Theistareykir Fissure Swarm, although the overall trend of rift structures follows the regional stress field (Bonali et al., 2019b), an important change in the direction of structures has been observed along the intersection between the Húsavík-Flatey Fault and Theistareykir Fissure Swarm by Pasquaré Mariotto et al. (2015) and Tibaldi et al. (2016). Particularly, these authors observed local reorientation of the fractures with the presence of en-echelon, NNW-SSE-striking normal faults and tension fractures, as well as the transition of some faults into tension fractures north of the prolongation of the Húsavík-Flatey Fault, and the decrease in the cumulated offset of all the faults north of the Húsavík-Flatey Fault prolongation. They also recognised an example of a laterally offset post-LGM lava flow along a WNW-ESE-striking right-lateral strike-slip fault. In fact, the Húsavík-Flatey Fault is composed of a swarm of WNW-ESE-striking right-lateral strike-slip faults, which locally assume transtensional kinematics (Sæmundsson, 1974; Gudmundsson, 1993; Gudmundsson, 2007; Tibaldi et al., 2016). Thus, differently from the intersection Grímsey Lineament - Fremrinamar Fissure Swarm, at the Húsavík-Flatey Fault-Theistareykir Fissure Swarm intersection, a well-defined buffer zone of interaction is visible, as shown also by analogue experiments (Bonali et al., 2018).
5.2 Rift propagation
Most of the asymmetric fault slip profiles of the Fremrinamar Fissure Swarm, especially those belonging to classes A and B, show a tendency to taper northward (Figure 14). This can be interpreted considering that single faults develop in the direction towards which their slip profile tapers out (Manighetti et al., 2001), indicating a tendency of the faults to propagate towards the north. This is confirmed both by the number of faults and their total length. This configuration is consistent with a general northward propagation of the Theistareykir Fissure Swarm (Tibaldi et al., 2019; Tibaldi et al., 2020a) and the Krafla Fissure Swarm (Corti et al., 2021). Sæmundsson (1974) suggested, so far, the hypothesis of a general overall northward propagation of the entire Northern Volcanic Zone. This setup is also corroborated by a series of other clues: i) the total number of normal faults decreases from the central portion of the rift towards the north, as also observed in the Theistareykir Fissure Swarm by Tibaldi et al. (2020b) and within the Krafla Fissure Swarm by Corti et al. (2021); ii) fault offsets are higher in the southern and central parts of the fissure swarm and are less developed in its northern part, as noticed by Tibaldi et al. (2016) in the Theistareykir Fissure Swarm; iii) dilation values show a clear decrease towards the north, as observed by Tibaldi et al. (2020b) and Corti et al. (2021) in the Theistareykir Fissure Swarm and Krafla Fissure Swarm respectively; iv) rift width tends to decrease northward, in agreement with the propagation model proposed by Karson (2017) in which a propagating rift can be represented as a wedge-shape area where the spreading decreases towards its apex (i.e., in the direction toward which the rift is developing).
At the Theistareykir Fissure Swarm, Tibaldi et al. (2019), Tibaldi et al. (2020a) documented in great detail that the majority of normal faults propagated outward from a central volcano, and that this might relate to the outward propagation of dykes from the magma chamber. At the Theistareykir Fissure Swarm, the central volcano is located in the middle part of the rift, and thus the faults propagated northward, north of the volcano, and in the opposite direction, south of the volcano. This double outward propagation of faults has been observed also around the Ado’Ale volcano in the Ethiopian Rift (Dumont et al., 2017). With regard to the relationship between lateral dyke propagation and surface deformation, there is a general lack of data in the literature especially in terms of fault tapering. However, we would like to remark two case studies that proposed important observations about this topic. Tibaldi et al. (2020c) studied an example of surface deformation induced by dyking, during the Krafla Fires (1975–1984). Here, the authors recognised a narrow graben that formed due to a N-propagating dyke, characterised by faults that are clearly visible to the south and fade into an extensional fractures field to the north, suggesting a tapering of the graben faults towards the north. During the Bardarbunga rifting episode in 2014, the formation of a graben was documented (e.g., Ruch et al., 2016). Values of subsidence along the graben decreased from the southern and central part of it (4.5–6 m) to the northern part (1–2 m) where the main eruptive site is located (Hjartardóttir et al., 2016a; Müller et al., 2017), consistently with the propagation of the dyke from the SW to the NE (Sigmundsson et al., 2015).
At the Fremrinamar Fissure Swarm, the central volcano is located in the southernmost part of the rift (Figure 14), therefore the northward propagation of dykes from the magma chamber can explain the propagation of the faults in the same direction, along the whole rift. This could also explain the concentration of the eruptive fissures in the southern segment of the rift, around the central volcano, where shallow dykes, propagating laterally outward from the magma chamber, intercepted the surface (Figure 9).
Another observation that supports the role of magma in dictating the rift structures, is given by the increase of the rift width north of the Fremrinamar central volcano, between transects 70 and 180 (Figure 8E). This widening of the rift may correspond to a tendency of dykes to deepen outward from the central volcano, as observed by Hollingsworth et al. (2013), who suggested a general tendency to rift widening moving away from the Krafla central volcano due to deepening of the dyke tip (Hollingsworth et al., 2013). Dyke-induced grabens, in fact, become wider with the deepening of the dyke tip, as observed by analogue experiments and numerical modelling (Pollard et al., 1983; Rubin, 1992; Trippanera et al., 2015b; Al Shehri and Gudmundsson, 2018; Drymoni et al., 2023).
Although these interpretations fit with the overall distribution of the different types of structures along the Fremrinamar Fissure Swarm and with the dominant direction of fault slip profile tapering, we must take into account that a relevant number of faults shows a southward slip profile tapering. This observation does not fit with all the other results, and might be considered an uncertainty linked to the slip profile method and to the complexity of fault development in volcano-tectonic rifts, where both magmatic and tectonic stresses can contribute to creating fissure swarms. The complexity derives also from the fact that the slip profile geometry at dyke-induced faults depends on the shallow magma flow direction, which can be from horizontal to vertical and cannot be constrained if dykes do not crop out. Fault slip is also a function of the lithology of the offset rocks (e.g., lava vs. hyaloclastite piles) (Trippanera et al., 2019; Tibaldi et al., 2020c) and of the depth/distance of the intrusion compared to dyke thickness (Trippanera et al., 2015a). Furthermore, possible fault rejuvenation during successive dyking events can occur (Gudmundsson and Bäckström, 1991). Nevertheless, we suggest that at least some of the faults with slip profiles displaying southward propagation, might be the result of single episodes of southward dyke propagation from other magmatic sources (e.g., Thorarinsson, 1959). In our study area, we highlight the presence of the Sveinar graben, which clearly shows a southward tapering profile of the graben faults (Figure 14B). Such graben was studied by Tentler and Mazzoli (2005), who dated faulting after the deglaciation, starting from data of Thorarinsson (1959). Its formation is suggested to be prior to 6–8 ka (Thorarinsson, 1959), when an eruption started at the Randarholar eruptive fissure (Y coordinate 7,306,090) and propagated towards SSW (Thorarinsson, 1959), until it met the already existing graben and followed its direction southward. Bäckström and Gudmundsson (1989) suggested that the displacement along graben faults continued after the eruption. In view of the above, such graben could represent an example of southward fault propagation guided by an episodic southward propagating dyke from other sources in the Northern Volcanic Zone.
5.3 Eruptive fissure distribution and orientation
With regard to the 146 eruptive fissures identified in the present work, which represent about 7% of the overall dataset of structures, it was noticed that their direction is mostly NNE-SSW, and that they are all located south of the Grímsey Lineament intersection (Figure 9). Their strike are more compatible with the directions of plate spreading based on geomagnetic data (DeMets et al., 1994; DeMets et al., 2010; Hjartardóttir et al., 2012), than those based on GPS (Metzger et al., 2011; Metzger et al., 2013; Drouin et al., 2017; Sigmundsson et al., 2020). Since eruptive fissures can be used as indicators of the stress field (Tibaldi and Bonali, 2017), these structures suggest a post-LGM orientation of the intermediate principal stress (σ2) and the least principal stress (σ3) of N10°-20°E and N100°-110°E, respectively, at least for the southern and central part of the Fremrinamar Fissure Swarm. We refer to post-LGM time, since all of them were identified by the morphometry of well-preserved scoria cones or vent alignments (e.g., Tibaldi, 1995; Tibaldi and Bonali, 2017), related to post-LGM units (Sæmundsson et al., 2012). Such an indicator is mostly comparable with the geometry of extension fractures, which represents the post-LGM deformation field. The latter mainly strike N to NNE in the southern part of the rift, whereas they strike more NNW to the north (Figure 5C).
Regarding their distribution along the rift, compared to latitude, eruptive fissures totally disappear in correspondence of transect 125 (Figure 9A), about 44.8 km north of the central volcano, south of the Grímsey Lineament. This is quite common in rifts belonging to the Northern Volcanic Zone and has been observed both at the Theistareykir Fissure Swarm and the Krafla Fissure Swarm. With regard to the latter, a deepening of the dykes, propagating to the north and outward from the magma chamber (Hollingsworth et al., 2013) for as far as 70–80 km from the central volcano, has been observed during the Krafla Fires (1975–1984) (Einarsson and Brandsdottir, 1980). Observations at the Theistareykir Fissure Swarm show eruption vents as far as about 5 km from the central volcano (Tibaldi et al., 2019), and there is no data related to lateral dyke propagation in historical time.
From another perspective, very few (less than 1%) eruptive fissures from the present study were recognised to be along the prolongation of normal faults or to be emplaced onto them (Figure 14). Such observation suggests that very few dykes can be captured, during their lateral or vertical propagation, by previous normal faults in this context, as suggested by previous authors (e.g., Johnson, 1961; Currie and Ferguson, 1970; Gudmundsson, 1983; Delaney and Gartner, 1997). Surely, in our case study, a very good example is represented by the 1875 (Thorarinsson, 1959; Gudmundsson and Bäckström, 1991) eruption, as explained above. Additionally, in Iceland, Gudmundsson (1983) conducted a study in the eroded rift zones in the eastern part of the country, showing that only about 10.5% of dykes occupy normal faults, but rather they create new tensile fractures to continue their propagation. Our observations suggest that the majority of the dykes in the Fremrinamar Fissure Swarm can follow the regional stress field but not necessarily pre-existing structures and dyke-induced graben faults; as a consequence of this, most dykes create new fractures and follow those as main magma paths. This is also consistent with what was observed during rifting episodes in Iceland (e.g., Ruch et al., 2016) and by analogue experiments, from single dyke-induced graben to rift scale (Pollard et al., 1983; Trippanera et al., 2015a; Trippanera et al., 2015b).
6 Conclusion
We produced a structural map of the entire Fremrinamar Fissure Swarm, at a scale of 1:50,000, identifying 146 eruptive fissures, 1,128 extension fractures and 761 normal faults. The analysis of our dataset allowed us to come up with the following observations.
- The Fremrinamar Fissure Swarm is characterised by an anticlockwise rotation of its overall trend, from N-S/NNE-SSW, in the central-southern parts, to NNW-SSE, in its northern part. Such geometry is associated with the northward propagation of the Fremrinamar Fissure Swarm toward the Kolbeinsey Ridge, which led to the formation of the Grímsey Lineament and the NNW-bending of the Fremrinamar Fissure Swarm in this region;
- W-dipping normal faults are generally longer and characterised by a wider range of strikes than the E-dipping ones. This data is coherent with an axial zone of the Northern Volcanic Zone coinciding with the Krafla Fissure Swarm, where the Fremrinamar Fissure Swarm identifies part of the eastern flank of the emerging oceanic ridge;
- The analysis of fault-slip profiles denotes a general tendency of the Fremrinamar Fissure Swarm to propagate northward, highlighting the crucial role of magma in governing the rift structure through the lateral propagation of dykes, from the magma chamber (located in the south) towards the north. This hypothesis is supported also by the decreasing number of eruptive fissures north of the central volcano, due to the deepening of dyke intrusions north of it. Eruptive fissures disappear at around 45 km from the central volcano, south of the Grímsey Lineament. The structures, and thus the dykes, propagated further north, but intrusions became too deep at distances >45 km;
- The hypothesis of a general northward propagation of the Fremrinamar Fissure Swarm is also supported by other clues, such as the decreasing of i) the number of normal faults, ii) fault offsets, iii) dilation values, and iv) rift width towards the northern portion of the rift. The presence of faults displaying a southward slip profile might be, in part, the result of single episodes of southward-dyke-propagation from other magmatic sources, as observed for the Sveinar graben;
- Only 1% of the analysed eruptive fissures are developed along or at the tip of normal faults, highlighting the tendency of dykes not to follow pre-existing faults in the Fremrinamar Fissure Swarm.
Data availability statement
The original contributions presented in the study are included in the article/Supplementary Material, further inquiries can be directed to the corresponding author.
Author contributions
MP: Investigation, Writing–original draft, Visualization. FB: Investigation, Writing–original draft, Supervision. NC: Investigation, Writing–review and editing. FP: Writing–review and editing. KD: Writing–review and editing. AT: Supervision, Writing–review and editing.
Funding
Funds for this research are from: 2023-ATE-0381, 2021-ATE-0329 and 2020-ATE-0471. This work was also supported by the Doctoral School of Chemical, Geological and Environmental Sciences (Milano Bicocca).
Acknowledgments
We thank the editor James Muirhead, Francesco Iezzi and an anonymous reviewer for comments which improved this manuscript. The work was carried out under the framework of the CRUST - Interuniversity Centre for 3D Seismotectonics with Territorial Applications, and under the aegis of the International Lithosphere Program, Task Force II. This manuscript is also an outcome of the Virtual Reality Lab for Earth Sciences - GeoVires (https://geovires.unimib.it/), University of Milano Bicocca. Agisoft Metashape is acknowledged for photogrammetry processing.
Conflict of interest
The authors declare that the research was conducted in the absence of any commercial or financial relationships that could be construed as a potential conflict of interest.
The author(s) declared that they were an editorial board member of Frontiers, at the time of submission. This had no impact on the peer review process and the final decision.
Publisher’s note
All claims expressed in this article are solely those of the authors and do not necessarily represent those of their affiliated organizations, or those of the publisher, the editors and the reviewers. Any product that may be evaluated in this article, or claim that may be made by its manufacturer, is not guaranteed or endorsed by the publisher.
Supplementary material
The Supplementary Material for this article can be found online at: https://www.frontiersin.org/articles/10.3389/feart.2023.1271721/full#supplementary-material
References
Acocella, V., Korme, T., and Salvini, F. (2003). Formation of normal faults along the axial zone of the Ethiopian Rift. J. Struct. Geol. 25, 503–513. doi:10.1016/s0191-8141(02)00047-0
Acocella, V., and Trippanera, D. (2016). How diking affects the tectonomagmatic evolution of slow spreading plate boundaries: overview and model. Geosphere 12 (3), 867–883. doi:10.1130/ges01271.1
Agisoft, L. (2023). Agisoft Metashape user manual: professional edition. Version 2.0. https://www.agisoft.com/pdf/metashape-pro_2_0_en.pdf.
Al Shehri, A., and Gudmundsson, A. (2018). Modelling of surface stresses and fracturing during dyke emplacement: application to the 2009 episode at Harrat Lunayyir, Saudi Arabia. J. Volcanol. Geotherm. Res. 356, 278–303. doi:10.1016/j.jvolgeores.2018.03.011
Andrew, R. E. B., and Gudmundsson, A. (2007). Distribution, structure, and formation of Holocene lava shields in Iceland. J. Volcanol. Geotherm. Res. 16, 137–154. doi:10.1016/j.jvolgeores.2007.08.011
Bäckström, K., and Gudmundsson, A. (1989). The grabens of sveinar and Sveinagja, NE Iceland. Reykjavik, Iceland: Nordic Volcanological Institute, University of Iceland.
Björnsson, A. (1985). Dynamics of crustal rifting in NE Iceland. J. Geophys. Res. Solid Earth 90 (B12), 10151–10162. doi:10.1029/jb090ib12p10151
Bonali, F. L., Tibaldi, A., Marchese, F., Fallati, L., Russo, E., Corselli, C., et al. (2019a). UAV-based surveying in volcano-tectonics: an example from the Iceland rift. J. Struct. Geol. 121, 46–64. doi:10.1016/j.jsg.2019.02.004
Bonali, F. L., Tibaldi, A., Pasquaré Mariotto, F., and Russo, E. (2018). Interplay between inherited rift faults and strike-slip structures: insights from analogue models and field data from Iceland. Glob. Planet. Change 171, 88–109. doi:10.1016/j.gloplacha.2018.03.009
Bonali, F. L., Tibaldi, A., Pasquaré Mariotto, F., Saviano, D., Meloni, A., and Sajovitz, P. (2019b). Geometry, oblique kinematics and extensional strain variation along a diverging plate boundary: the example of the northern Theistareykir Fissure Swarm, NE Iceland. Tectonophysics 756, 57–72. doi:10.1016/j.tecto.2019.02.018
Calais, E., d'Oreye, N., Albaric, J., Deschamps, A., Delvaux, D., Déverchere, J., et al. (2008). Strain accommodation by slow slip and dyking in a youthful continental rift, East Africa. Nature 456, 783–787. doi:10.1038/nature07478
Cattin, R., Doubre, C., De Chabalier, J. B., King, G., Vigny, C., Avouac, J. P., et al. (2005). Numerical modelling of Quaternary deformation and post-rifting displacement in the Asal-Ghoubbet rift (Djibouti, Africa). Earth Planet Sci. Lett. 239, 352–367. doi:10.1016/j.epsl.2005.07.028
Corti, N., Bonali, F. L., Pasquaré Mariotto, F., Tibaldi, A., Russo, E., Hjartardóttir, Á. R., et al. (2021). Fracture kinematics and Holocene stress field at the Krafla rift, northern Iceland. Geosciences 11 (2), 101. doi:10.3390/geosciences11020101
Currie, K. L., and Ferguson, J. (1970). The mechanism of intrusion of lamprophyre dikes indicated by “offsetting” of dikes. Tectonophysics 9 (6), 525–535.
Delaney, P. T., and Gartner, A. E. (1997). Physical processes of shallow mafic dike emplacement near the San Rafael Swell, Utah. Geol. Soc. Am. Bull. 109, 1177–1192. doi:10.1130/0016-7606(1997)109<1177:pposmd>2.3.co;2
DeMets, C., Gordon, R. G., and Argus, D. F. (2010). Geologically current plate motions. Geophys. J. Int. 181 (1), 1–80. doi:10.1111/j.1365-246x.2009.04491.x
DeMets, C., Gordon, R. G., Argus, D. F., and Stein, S. (1994). Effect of recent revisions to the geomagnetic reversal time scale on estimates of current plate motions. Geophys. Res. Lett. 21 (20), 2191–2194. doi:10.1029/94gl02118
Drouin, V., Sigmundsson, F., Ófeigsson, B. G., Hreinsdóttir, S., Sturkell, E., and Einarsson, P. (2017). Deformation in the Northern Volcanic Zone of Iceland 2008–2014: an interplay of tectonic, magmatic, and glacial isostatic deformation. J. Geophys. Res. Solid Earth 122, 3158–3178. doi:10.1002/2016jb013206
Drymoni, K., Russo, E., Tibaldi, A., Corti, N., Bonali, F. L., and Pasquaré Mariotto, F. (2023). Dyke-induced graben formation in a heterogeneous succession on Mt. Etna: insights from field observations and FEM numerical models. J. Volcanol. Geotherm. Res. 433, 107712. doi:10.1016/j.jvolgeores.2022.107712
Dumont, S., Klinger, Y., Socquet, A., Doubre, C., and Jacques, E. (2017). Magma influence on propagation of normal faults: evidence from cumulative slip profiles along Dabbahu-Manda-Hararo rift segment (Afar, Ethiopia). J. Struct. Geol. 95, 48–59. doi:10.1016/j.jsg.2016.12.008
Einarsson, P. (1991). Earthquakes and present-day tectonism in Iceland. Tectonophysics 189, 261–279. doi:10.1016/0040-1951(91)90501-i
Einarsson, P. (2008). Plate boundaries, rifts and transforms in Iceland. Jökull 58, 35–58. doi:10.33799/jokull2008.58.035
Einarsson, P., and Brandsdottir, B. (1980). Seismological evidence for lateral magma intrusion during the July 1978 deflation of the Krafla volcano in NE-Iceland. J. Geophys. 47 (1), 160–165. doi:10.2172/890964
Einarsson, P., and Sæmundsson, K. (1987). “Earthquake epicenters 1982-1985 and volcanic systems in Iceland (map),” in ´I hlutarins eðli, festschrift for þorbjorn Sigurgeirsson. Menningarsjoður, reykjavík. Editor þ.I Sigfússon.
Floyd, J. S., Tolstoy, M., Mutter, J. C., and Scholz, C. H. (2002). Seismotectonics of mid-ocean ridge propagation in Hess Deep. Science 298 (5599), 1765–1768. doi:10.1126/science.1077950
Forslund, T., and Gudmundsson, A. (1991). Crustal spreading due to dikes and faults in southwest Iceland. J. Struct. Geol. 13 (4), 443–457. doi:10.1016/0191-8141(91)90017-d
Garcia, S., Arnaud, N. O., Angelier, J., Bergerat, F., and Homberg, C. (2003). Rift jump process in Northern Iceland since 10 Ma from 40Ar/39Ar geochronology. Earth Planet. Sci. Lett. 214 (3-4), 529–544. doi:10.1016/s0012-821x(03)00400-x
Gomez, C., Hayakawa, Y., and Obanawa, H. (2015). A study of Japanese landscapes using structure from motion derived DSMs and DEMs based on historical aerial photographs: new opportunities for vegetation monitoring and diachronic geomorphology. Geomorphology 242, 11–20. doi:10.1016/j.geomorph.2015.02.021
Gray, T. G. (1992). Handbook of crack opening data: a compendium of equations, graphs, computer software and references for opening profiles of cracks in loaded components and structures. Elsevier.
Grottoli, E., Biausque, M., Rogers, D., Jackson, D. W., and Cooper, J. A. G. (2020). Structure-from-motion-derived digital surface models from historical aerial photographs: a new 3D application for coastal dune monitoring. Remote Sens. 13 (1), 95. doi:10.3390/rs13010095
Gudmundsson, A. (1983). Form and dimensions of dykes in eastern Iceland. Tectonophysics 95, 295–307. doi:10.1016/0040-1951(83)90074-4
Gudmundsson, A. (1993). On the structure and formation of fracture zones. Terra nova. 5 (3), 215–224. doi:10.1111/j.1365-3121.1993.tb00252.x
Gudmundsson, A. (2000). Dynamics of volcanic systems in Iceland: example of tectonism and volcanism at juxtaposed hot spot and mid-ocean ridge systems. Ann. Rev. Earth Planet. Sci. 28, 107–140. doi:10.1146/annurev.earth.28.1.107
Gudmundsson, A. (2007). Infrastructure and evolution of ocean-ridge discontinuities in Iceland. J. Geodyn. 43 (1), 6–29. doi:10.1016/j.jog.2006.09.002
Gudmundsson, A., and Bäckström, K. (1991). Structure and development of the Sveinagja graben, northeast Iceland. Tectonophysics 200 (1–3), 111–125. doi:10.1016/0040-1951(91)90009-h
Gudmundsson, A., Brynjolfsson, S., and T Jonsson, M. (1993). Structural analysis of a transform fault-rift zone junction in north Iceland. Tectonophysics 220, 205–221. doi:10.1016/0040-1951(93)90232-9
Gudmundsson, A., Friese, N., Galindo, I., and Philipp, S. L. (2008). Dike-induced reverse faulting in a graben. Geology 36, 123–126. doi:10.1130/g24185a.1
Gupta, A., and Scholz, C. H. (2000). Brittle strain regime transition in the Afar depression: implications for fault growth and seafloor spreading. Geology 28, 1087–1090. doi:10.1130/0091-7613(2000)028<1087:bsrtit>2.3.co;2
Heki, K., Foulger, G., Julian, B., and Jahn, C. H. (1993). Plate dynamics near divergent boundaries: geophysical implications of postrifting crustal deformation in NE Iceland. J. Volcanol. Geoth. Res. 98 (14), 14279–14297. doi:10.1029/93jb00781
Hjartardóttir, Á. R., and Einarsson, P. (2015). The interaction of fissure swarms and monogenetic lava shields in the rift zones of Iceland. J. Volcanol. Geoth. Res. 299, 91–102. doi:10.1016/j.jvolgeores.2015.04.001
Hjartardóttir, Á. R., and Einarsson, P. (2021). Tectonic position, structure, and Holocene activity of the Hofsjökull volcanic system, central Iceland. J. Volcanol. Geotherm. Res. 417, 107277. doi:10.1016/j.jvolgeores.2021.107277
Hjartardóttir, Á. R., Einarsson, P., Bramham, E., and Wright, T. J. (2012). The Krafla fissure swarm, Iceland, and its formation by rifting events. Bull. Volcanol. 74, 2139–2153. doi:10.1007/s00445-012-0659-0
Hjartardóttir, Á. R., Einarsson, P., Gudmundsson, M. T., and Högnadóttir, T. (2016a). Fracture movements and graben subsidence during the 2014 Bárðarbunga dike intrusion in Iceland. J. Volcanol. Geotherm. Res. 310, 242–252. doi:10.1016/j.jvolgeores.2015.12.002
Hjartardóttir, Á. R., Einarsson, P., Magnusdóttir, S., Bjornsdóttir, P., and Brandsdóttir, B. (2016b). “Fracture systems of the northern volcanic rift zone, Iceland: an onshore part of the Mid-Atlantic plate boundary,” in Magmatic rifting and active volcanism. Editors T. J. Wright, A. Ayele, D. J. Ferguson, T. Kidane, and C. Vye-Brown (Geological Society, London, Special Publications), 420 (1), 297–314.
Hollingsworth, J., Leprince, S., Ayoub, F., and Avouac, J. P. (2012). Deformation during the 1975–1984 Krafla rifting crisis, NE Iceland, measured from historical optical imagery. J. Geophys. Res. Solid Earth 117, 3707–3727. doi:10.1029/2012jb009140
Hollingsworth, J., Leprince, S., Ayoub, F., and Avouac, J. P. (2013). New constraints on dike injection and fault slip during the 1975–1984 Krafla rift crisis, NE Iceland. J. Geophys. Res. Solid Earth 118 (7), 3707–3727. doi:10.1002/jgrb.50223
Iezzi, F., Roberts, G., and Walker, J. F. (2020). Throw-rate variations within linkage zones during the growth of normal faults: case studies from the Western Volcanic Zone, Iceland. J. Struct. Geol. 133, 103976. doi:10.1016/j.jsg.2020.103976
Ishiguro, S., Yamano, H., and Oguma, H. (2016). Evaluation of DSMs generated from multi-temporal aerial photographs using emerging structure from motion–multi-view stereo technology. Geomorphology 268, 64–71. doi:10.1016/j.geomorph.2016.05.029
Johnson, R. B. (1961). Patterns and origin of radial dike swarms associated with West Spanish peak and Dike Mountain, South-Central Colorado. Geol. Soc. Am. Bull. 72, 579–590. doi:10.1130/0016-7606(1961)72[579:paoord]2.0.co;2
Jonsson, S., Einarsson, P., and Sigmundsson, F. (1997). Extension across a divergent plate boundary, the eastern Volcanic Rift Zone, south Iceland, 1967–1994, observed with GPS and electronic distance measurements. J. Geophys. Res. 102, 11913–11929. doi:10.1029/96jb03893
Karson, J. A. (1997). The Iceland plate boundary zone: propagating rifts, migrating transforms, and rift-parallel strike-slip faults. Geochem. Geophys. Geosystems 18 (11), 4043–4054.
Lavier, L. L., Buck, W. R., and Poliakov, A. N. (2000). Factors controlling normal fault offset in an ideal brittle layer. J. Geophys. Res. 105, 23431–23442. doi:10.1029/2000jb900108
Lund, B., and Townend, J. (2007). Calculating horizontal stress orientations with full or partial knowledge of the tectonic stress tensor. Geophys. J. Int. 170 (3), 1328–1335. doi:10.1111/j.1365-246x.2007.03468.x
Magnúsdóttir, S., and Brandsdóttir, B. (2011). Tectonics of the Þeistareykir fissure swarm. Jökull 61, 65–79. doi:10.33799/jokull2011.61.065
Magnúsdóttir, S., Brandsdóttir, B., Driscoll, N., and Detrick, R. (2015). Postglacial tectonic activity within the Skjálfandadjúp Basin, Tjörnes Fracture Zone, offshore Northern Iceland, based on high resolution seismic stratigraphy. Mar. Geol. 367, 159–170. doi:10.1016/j.margeo.2015.06.004
Manighetti, I., King, G. C. P., Gaudemer, Y., Scholz, C. H., and Doubre, C. (2001). Slip accumulation and lateral propagation of active normal faults in Afar. J. Geophys. Res. Solid Earth 106 (B7), 13667–13696. doi:10.1029/2000jb900471
Manighetti, I., Tapponnier, P., Courtillot, V., Gruszow, S., and Gillot, P.-Y. (1997). Propagation of rifting along the Arabia–Somalia plate boundary: the gulfs of Aden and Tadjoura. J. Geophys. Res. 102, 2681–2710. doi:10.1029/96jb01185
Metzger, S., Jónsson, S., Danielsen, G., Hreinsdóttir, S., Jouanne, F., Giardini, D., et al. (2013). Present kinematics of the Tjörnes fracture zone, north Iceland, from campaign and continuous GPS measurements. Geophys. J. Int. 192, 441–455. doi:10.1093/gji/ggs032
Metzger, S., Jónsson, S., and Geirsson, H. (2011). Locking depth and slip-rate of the Húsavík Flatey fault, North Iceland, derived from continuous GPS data 2006-2010. Geophys. J. Int. 187, 564–576. doi:10.1111/j.1365-246x.2011.05176.x
Mittelstaedt, E., Ito, G., and Behn, M. D. (2008). Mid-ocean ridge jumps associated with hotspot magmatism. Earth Planet. Sci. Lett. 266 (3-4), 256–270. doi:10.1016/j.epsl.2007.10.055
Morgan, J. P., and Sandwell, D. T. (1994). Systematics of ridge propagation south of 30 S. Earth Planet. Sci. Lett. 121 (1-2), 245–258. doi:10.1016/0012-821x(94)90043-4
Müller, D., Walter, T. R., Schöpa, A., Witt, T., Steinke, B., Gudmundsson, M. T., et al. (2017). High-resolution digital elevation modeling from TLS and UAV campaign reveals structural complexity at the 2014/2015 Holuhraun eruption site, Iceland. Front. Earth Sci. 5, 59. doi:10.3389/feart.2017.00059
Pasquaré Mariotto, F., Bonali, F. L., Tibaldi, A., Rust, D., Oppizzi, P., and Cavallo, A. (2015). Holocene displacement field at an emerged oceanic transform-ridge junction: the Husavik-Flatey Fault – gudfinnugja Fault system, North Iceland. J. Struct. Geol. 75, 118–134. doi:10.1016/j.jsg.2015.03.011
Pollard, D. D., and Aydin, A. (1984). Propagation and linkage of oceanic ridge segments. J. Geophys. Res. Solid Earth 89 (B12), 10017–10028. doi:10.1029/jb089ib12p10017
Pollard, D. D., Delaney, P. T., Duffield, W. A., Endo, E. T., and Okamura, A. T. (1983). Surface deformation in volcanic rift zones. Tectonophysics 94, 541–584. doi:10.1016/0040-1951(83)90034-3
Rögnvaldsson, S. T., Gudmundsson, Á., and Slunga, R. (1998). Seismotectonic analysis of the Tjörnes Fracture Zone, an active transform fault in north Iceland. J. Geophys. Res. Solid Earth 103 (B12), 30117–30129. doi:10.1029/98jb02789
Rubin, A. M. (1992). Dike-induced faulting and graben subsidence in volcanic rift zones. J. Geophys. Res. Solid Earth 97 (B2), 1839–1858. doi:10.1029/91jb02170
Ruch, J., Wang, T., Xu, W., Hensch, M., and Jónsson, S. (2016). Oblique rift opening revealed by reoccurring magma injection in central Iceland. Nat. Commun. 7, 12352. doi:10.1038/ncomms12352
Sæmundsson, K. (1974). Evolution of the axial rifting zone on northern Iceland and the Tjörnes fracture zone. Geol. Soc. Am. Bull. 85, 495–504. doi:10.1130/0016-7606(1974)85<495:EOTARZ>2.0.CO;2
Sæmundsson, K. (1977). Geological map of Iceland Sheet 7, north east Iceland. Iceland Geodetic Survey and the Museum of Natural History. Natturfræðistofnun Islands : Landmælingum Islands. Reykjavik, Iceland.
Sæmundsson, K., Hjartarson, Á., Kaldal, I., Sigurgeirsson, M. Á., Kristinsson, S. G., and Víkingsson, S. (2012). Geological map of the northern volcanic zone, Iceland. Northern part. 1:100,000. Reykjavík: Iceland GeoSurvey and Landsvirkjun.
Schonberger, J. L., and Frahm, J. M. (2016). “Structure-from-motion revisited,” in Proceedings of the IEEE conference on computer vision and pattern recognition, 4104–4113.
Schouten, H., Dick, H. J., and Klitgord, K. D. (1987). Migration of mid-ocean-ridge volcanic segments. Nature 326 (6116), 835–839. doi:10.1038/326835a0
Searle, R. C., and Laughton, A. S. (1981). Fine-scale sonar study of tectonics and volcanism on the Reykjanes Ridge. Oceanol. Acta, Spec. issue.
Sigmundsson, F., Einarsson, P., Hjartardóttir, Á. R., Drouin, V., Jónsdóttir, K., Arnadottir, T., et al. (2020). Geodynamics of Iceland and the signatures of plate spreading. J. Volcanol. Geotherm. Res. 391, 106436. doi:10.1016/j.jvolgeores.2018.08.014
Sigmundsson, F., Hooper, A., Hreinsdóttir, S., Vogfjörd, K. S., Ófeigsson, B. G., Heimisson, E. R., et al. (2015). Segmented lateral dyke growth in a rifting event at Bárðarbunga volcanic system, Iceland. Nature 517 (7533), 191–195. doi:10.1038/nature14111
Sigurgeirsson, M. Á., Hjartarson, Á., Kaldal, I., Sæmundsson, K., Kristinsson, S. G., and Víkingsson, S. (2015). Geological map of the northern volcanic zone, Iceland. Southern part. 1:100,000. Reykjavík: Iceland GeoSurvey.
Sneddon, I. N., and Lowengrub, M. (1969). Crack problems in the classical theory of elasticity. New York: Wiley.
Stefansson, R., Gudmundsson, G. B., and Halldorsson, P. (2008). Tjörnes fracture zone. New and old seismic evidences for the link between the North Iceland rift zone and the Mid-Atlantic ridge. Tectonophysics 447 (1-4), 117–126. doi:10.1016/j.tecto.2006.09.019
Tentler, T. (2003). Analogue modeling of tension fracture pattern in relation to mid-ocean ridge propagation. Geophys. Res. Lett. 30 (6). doi:10.1029/2002gl015741
Tentler, T., and Acocella, V. (2010). How does the initial configuration of oceanic ridge segments affect their interaction? Insights from analogue models. J. Geophys. Res. Solid Earth 115 (B1). doi:10.1029/2008jb006269
Tentler, T., and Mazzoli, S. (2005). Architecture of normal faults in the rift zone of central north Iceland. J. Struct. Geol. 27 (9), 1721–1739. doi:10.1016/j.jsg.2005.05.018
Tentler, T., and Temperley, S. (2007). Magmatic fissures and their systems in Iceland: a tectonomagmatic model. Tectonics 26 (5). doi:10.1029/2006tc002037
Thorarinsson, S. (1959). Some geological problems involved in the hydroelectric development of the Jo¨kulsa a Fjo¨llum, Iceland. Report to the State Electricity Authority. Reykjavik.
Tibaldi, A. (1995). Morphology of pyroclastic cones and tectonics. J. Geophys. Res. Solid Earth 100 (B12), 24521–24535. doi:10.1029/95jb02250
Tibaldi, A., and Bonali, F. L. (2017). Intra-arc and back-arc volcano-tectonics: magma pathways at Holocene Alaska-Aleutian volcanoes. Earth-Science Rev. 167, 1–26. doi:10.1016/j.earscirev.2017.02.004
Tibaldi, A., Bonali, F. L., Corti, N., Russo, E., Drymoni, K., De Beni, E., et al. (2022). Surface deformation during the 1928 fissure eruption of Mt. Etna (Italy): insights from field data and FEM numerical modelling. Tectonophysics 837, 229468. doi:10.1016/j.tecto.2022.229468
Tibaldi, A., Bonali, F. L., Einarsson, P., Hjartardóttir, Á. R., and Pasquaré Mariotto, F. (2016). Partitioning of Holocene kinematics and interaction between the Theistareykir fissure swarm and the husavik-flatey fault, north Iceland. J. Struct. Geol. 83, 134–155. doi:10.1016/j.jsg.2016.01.003
Tibaldi, A., Bonali, F. L., Pasquaré Mariotto, F., Corti, N., Russo, E., Einarsson, P., et al. (2020b). Rifting kinematics produced by magmatic and tectonic stresses in the north volcanic zone of Iceland. Front. Earth Sci. 8, 174. doi:10.3389/feart.2020.00174
Tibaldi, A., Bonali, F. L., Pasquaré Mariotto, F., Russo, E., and Tenti, L. R. (2019). The development of divergent margins: insights from the North volcanic zone, Iceland. Earth Planet. Sci. Lett. 509, 1–8. doi:10.1016/j.epsl.2018.12.019
Tibaldi, A., Bonali, F. L., Russo, E., and Fallati, L. (2020c). Surface deformation and strike-slip faulting controlled by dyking and host rock lithology: a compendium from the Krafla Rift, Iceland. Icel. J. Volcanol. Geoth. Res. 395, 106835. doi:10.1016/j.jvolgeores.2020.106835
Tibaldi, A., Corti, N., Bonali, F. L., Pasquaré Mariotto, F., and Russo, E. (2020a). Along-rift propagation of Pleistocene-Holocene faults from a central volcano. J. Struct. Geol. 141, 104201. doi:10.1016/j.jsg.2020.104201
Trippanera, D., Acocella, V., Ruch, J., and Abebe, B. (2015b). Fault and graben growth along active magmatic divergent plate boundaries in Iceland and Ethiopia. Tectonics 34 (11), 2318–2348. doi:10.1002/2015tc003991
Trippanera, D., Ruch, J., Acocella, V., and Rivalta, E. (2015a). Experiments of dike-induced deformation: insights on the long-term evolution of divergent plate boundaries. J. Geophys. Res. Solid Earth 120 (10), 6913–6942. doi:10.1002/2014jb011850
Trippanera, D., Ruch, J., Passone, L., and Jonsson, S. (2019). Structural mapping of dike induced faulting in Harrat Lunayyir (Saudi Arabia) by using high resolution drone imagery. Front. Earth Sci. 7, 168. doi:10.3389/feart.2019.00168
Westoby, M. J., Brasington, J., Glasser, N. F., Hambrey, M. J., and Reynolds, J. M. (2012). ‘Structure-from-Motion’photogrammetry: a low-cost, effective tool for geoscience applications. Geomorphology 179, 300–314. doi:10.1016/j.geomorph.2012.08.021
Keywords: Holocene normal faults, Fremrinamar rift, Iceland, fault propagation, extension fractures, dykes
Citation: Pedicini M, Bonali FL, Corti N, Pasquaré Mariotto FA, Drymoni K and Tibaldi A (2023) A step forward to understanding the development of volcanotectonic rifts: the structure of the Fremrinamar Fissure Swarm (Iceland). Front. Earth Sci. 11:1271721. doi: 10.3389/feart.2023.1271721
Received: 02 August 2023; Accepted: 13 November 2023;
Published: 30 November 2023.
Edited by:
James D. Muirhead, The University of Auckland, New ZealandReviewed by:
Karoly Nemeth, Institute of Earth Physics and Space Science (EPSS), HungaryFrancesco Iezzi, University of Naples Federico II, Italy
Copyright © 2023 Pedicini, Bonali, Corti, Pasquaré Mariotto, Drymoni and Tibaldi. This is an open-access article distributed under the terms of the Creative Commons Attribution License (CC BY). The use, distribution or reproduction in other forums is permitted, provided the original author(s) and the copyright owner(s) are credited and that the original publication in this journal is cited, in accordance with accepted academic practice. No use, distribution or reproduction is permitted which does not comply with these terms.
*Correspondence: Fabio Luca Bonali, ZmFiaW8uYm9uYWxpQHVuaW1pYi5pdA==