Abstract
Fired archaeological objects have been widely studied in palaeomagnetic research. However, the uneven heating during the firing process can affected the type, grain size and magnetic domain characteristics of the magnetic carrier, which in turn can led to notable discrepancies in the paleomagnetic information that they captured. In this study, we conducted a detailed rock magnetic study on two Chinese archaeological (one grey and one red) to reveal the properties of magnetic minerals subjected to different firing temperatures. Our results show that single domain (SD) magnetite with strong magnetostatic interactions is the dominant magnetic carrier in grey bricks, while SD magnetite with weak magnetostatic interactions is the dominant magnetic carrier in the red bricks. And stepwise heating results show that the firing temperature of the grey brick and the outer layers of red brick (R-1, R-3) is above 700°C, while the inner layer (R-2) of red brick shows a thermal transformation process at ∼ 350°C. This uneven heating may cause the spatial discrepancies in magnetic parameters such as the mass-normalized magnetic susceptibility (χ) and natural remanent magnetization (NRM) in red brick. Nevertheless, the direction of the geomagnetic field can be accurately obtained even if the brick is not heated evenly. However, more work is needed to explore the paleointensity behavior at different firing temperatures.
1 Introduction
A large amount of archaeological geomagnetic data has been reported in recent decades, and has contributed significantly to the recovery of the secular variation of the geomagnetic field over the last 10,000 years (e.g., Ben-Yosef et al., 2009; Cai et al., 2017; 2020; Mahgoub et al., 2019). Fired archeological objects, such as pottery, baked brick, burnt clay, and slags, can acquire thermoremanent magnetization (TRM) during the firing process, and have been widely used in paleomagnetism studies (Brown et al., 2015). However, these archaeological geomagnetic samples were mostly taken from kilns and hearths, and might have experienced uneven heating due to the fact that the heating temperatures of the various parts of the kiln and hearths can vary significantly. For example, Wei et al. (1980) found that the kiln floor and the outer layer of the kiln wall (1–4 cm thick) at the Jiangzhai site in China were subjected to higher heat, usually above 800°C, while the burnt soil in the inner layer have been exposed to a temperature of 400°C. The main magnetic carriers in archaeomagnetic materials are transformed from other minerals during the firing process. Therefore, the uneven heating due to firing temperature differences may have affected the type, grain size, and magnetic domain characteristics of the magnetic carrier, ultimately affecting the paleomagnetic information. There is limited research on the thermal properties of fired archaeological objects and their magnetic properties, which hinders our understanding of archaeological geomagnetism.
Among the various fired archaeological objects, baked bricks are more susceptible to uneven heating due to their thickness. In ancient China, the use of baked bricks dates back to the Yangshao culture, and they were widely produced and utilized during the Warring States Period and Qin-Han Dynasties (Yang et al., 2014). And, specialized kilns were developed for firing these bricks during the Han Dynasty, indicating the advanced state of firing technology at that time. Therefore, conducting rock magnetic analysis on Han dynasty bricks can provide insight into the effect of firing temperature on the magnetic characteristics of archaeological geomagnetic materials. Towards this end, we conducted a detailed rock magnetic study on two ancient Chinese bricks dating back to the Han Dynasty.
2 Materials and methods
Fragments from two bricks, one red and one grey, were collected from brick tombs at the Sundayuan archaeological site in Shandong Province, China (Figure 1). The red brick can be traced back to the Western Han Dynasty, while the grey brick belongs to the Eastern Han Dynasty. Their lengths are 9.1 cm and 12.0 cm, respectively, and their thicknesses are between 6.4 and 6.6 cm. When observed under a microscope, the red brick exhibits a loose texture with more visible pores, while the grey brick appears denser.
FIGURE 1

Location of the SDY site (A) and photos of two bricks (B, C).
A diamond wire cutter was used to cut approximately 3 mm from each side of the bricks to expose the inner surface and eliminate the influence of the soil contaminants after burial. The remaining bricks were cut into three layers at approximately 2 cm intervals along the cut surface, and were then cut into 2×2×2 cm cubic samples (Figure 2) such that a total of 60 cubic samples were obtained. These cubic samples were numbered and marked with their location information. In addition, the remaining part of each layer was ground into powder for magnetic analysis, and a total of 6 powder samples (3 layers per brick) were obtained.
FIGURE 2

Schematic diagram illustrating the position and ID of samples from the (A) grey brick and the (B) red brick.
The mass-normalized magnetic susceptibility (χ) and natural remanent magnetization (NRM) of all cubic samples were measured using the Kappabridge-MFK2 at a frequency of 976 Hz and the Spinner Magnetometer (JR-6A, AGICO Co. Ltd.), respectively. Stepwise alternating field (AF) demagnetization was conducted on even numbered cubic samples using the LDA5 AF demagnetizer, and was carried out at 5 mT steps for the 0–100 mT interval, and at 10 mT steps from 100 to 150 mT. Stepwise thermal demagnetization was conducted on odd numbered cubic samples using an ASC TD-48 thermal demagnetizer in 50°C steps from 50°C to 700°C. Remanent demagnetization and direction were measured on JR-6A after each demagnetization step. Anhysteretic remanent magnetization (ARM), isothermal remanent magnetization (IRM), hard isothermal remanent magnetization (HIRM), S-ratio were obtained from the following procedures after AF demagnetization. ARM was imparted in a 100 mT alternating field with a superimposed 50 μT direct bias field using the LDA5 AF demagnetizer and pluse magnetizer (PAM1). A saturation IRM was imparted in a 1 T applied field, termed SIRM, then samples were demagnetized with backfields of −300 mT, and the corresponding remanence were measured and termed IRM-300mT. HIRM is defined as 0.5 × (SIRM + IRM-300mT) and the S-ratio is defined as -IRM-300mT/SIRM. The ratios of ARM/SIRM and HIRM/SIRM are calculated. The former is commonly used as a grain-size indicator for magnetic minerals. The latter is similar to S-ratio and commonly used to estimate the relative abundance variations of ferrimagnetic and antiferromagnetic minerals. The temperature-dependent of magnetic susceptibility (χ-T) of powdered samples was investigated using the secondary heating method and the stepwise heating method, respectively. In the secondary heating method, the heated samples underwent a second χ-T cycle after the initial χ-T cycle. In the stepwise heating method, the maximum temperature of each cycle was gradually increased from 100°C to 700°C in 50°C steps. All χ-T measured using a Kappagridge-MFK2 system in an argon environment at a 976 Hz frequency. Hysteresis loops were measured to maximum applied fields of 1 T using a vibrating sample magnetometer (VSM, Princeton MicroMag 3900) at room temperature. Saturation magnetization (Ms), saturation remanent magnetization (Mrs), and coercivity (Bc) were obtained after high-field slope correction. The remanence coercivity (Bcr) was obtained from back-field demagnetization curves of 0 T back to −1 T. IRM acquisition curves with 100 measurement points and nonlinear field steps on a log scale up to 1 T were measured using the VSM. The IRM acquisition curves were decomposed into magnetic components using the method described in Maxbauer et al. (2016). First-order reversal curve (FORC) with 120 FORC were also measured using the VSM for powder samples, and FORC diagrams were processed using the FORCinel version 3.06 software from Harrison and Feinberg (2008).
The sample preparation, AF demagnetization experiments, and χ-T curve experiments were carried out at the Archaeological Geomagnetic Laboratory at Shandong University, and the rest of the experiments were carried out at the Magnetism Laboratory at Sun Yat-sen University.
3 Results
For the grey brick samples, χ ranged from 4.5 to 6 (×10–7 m3/kg), and the NRM ranged from 35 to 50 (×10–5 Am2/kg) (Supplementary Table S1). The χ and NRM of red brick samples were one order of magnitude higher than those of grey brick; the χ ranged from 40 to 170 (×10–7 m3/kg), and the NRM was ranged from 75 to 600 (×10–5 Am2/kg) (Supplementary Table S1).
Hysteresis loops for all powdered samples are closed below 0.3 T (Figure 3), which indicates a dominance of magnetically soft ferrimagnetic minerals (Dunlop, 2002). Grey brick samples show “potbellied” loops with Bc ranging between 20.5 mT and 22.5 mT, and Bcr ranging between 42 mT and 47 mT (Figures 3A–C). Red brick samples show “wasp-waisted” loops with Bc ranging between 10 mT and 12 mT, and Bcr ranging between 33 mT and 36 mT (Figures 3D–F).
FIGURE 3

Hysteresis loops and back-field demagnetization curves of representative samples. The blue lines are raw loops, orange lines are adjusted loops by paramagnetic correction, magenta lines are back-field demagnetization curves, and green lines are the amplified plot of adjusted loop between −200 mT and 200 mT.
IRM acquisition curves can be used to decomposed into magnetic mineral components based on coercivity spectra (Heslop et al., 2002). In general, four components are recognized for grey brick, and five components for red brick (Figure 4; Supplementary Table S2). In grey brick, components 1 (B1/2 = 37.82–41.6 mT, DP = 0.36) and 2 (B1/2 = 43.89–47.77 mT, DP = 0.25) are major remanence carriers, which were interpreted as magnetite/maghemite (Wang et al., 2022). Component 3 (B1/2 = 113.49–121.95 mT, DP = 0.21–0.25) was interpreted as partially-oxidized coarse-grained magnetite. Finally, component 4 (B1/2 = 208.92–231.52 mT, DP = 0.25–0.33) is attributed to antiferromagnetic hematite (Heslop et al., 2002).
FIGURE 4

IRM unmixing results of representative samples. Black lines are raw data, gray dots are gradient data, orange lines are the sum of components, and other color lines are individual components.
In red brick, components 1 (B1/2 = 9.08–9.61 mT, DP = 0.15) and 2 (B1/2 = 18.09–20.39 mT, DP = 0.14–0.18) likely represents the coarse-gained magnetite (Roberts et al., 2011). Component 3 (B1/2 = 43.39–44.17 mT, DP = 0.2) is a major remanence carrier and was interpreted as magnetic/maghemite. Components 4 (B1/2 = 122.73–169.73 mT, DP = 0.24–0.3) and 5 (B1/2 = 954.38–1015.62 mT, DP = 0.3–0.37) were interpreted as the same as grey brick components 3 and 4, respectively. In addition, the difference of IRM acquisition curves at high fields for the two types of brick also suggest the presence of considerable amounts of hematite in the red brick.
FORC diagrams were used to identify and discriminate among different components in a mixed magnetic mineral assemblage (Figure 5; Pike et al., 1999; Roberts et al., 2000). FORC diagrams for samples from grey brick were characterized by concentric distribution with moderate vertical spread, which indicate the presence of single domain (SD) particles with strong magnetostatic interactions (Figure 5; Roberts et al., 2017; Roberts et al., 2000). The FORC diagrams for red brick are elongated contours along the horizontal axis with small vertical spread. Red brick FORC diagrams also contain a secondary peak near the origin of the diagram, which indicate the presence of weak-interacting SD particles and SP particles (Figure 5; Roberts et al., 2017).
FIGURE 5
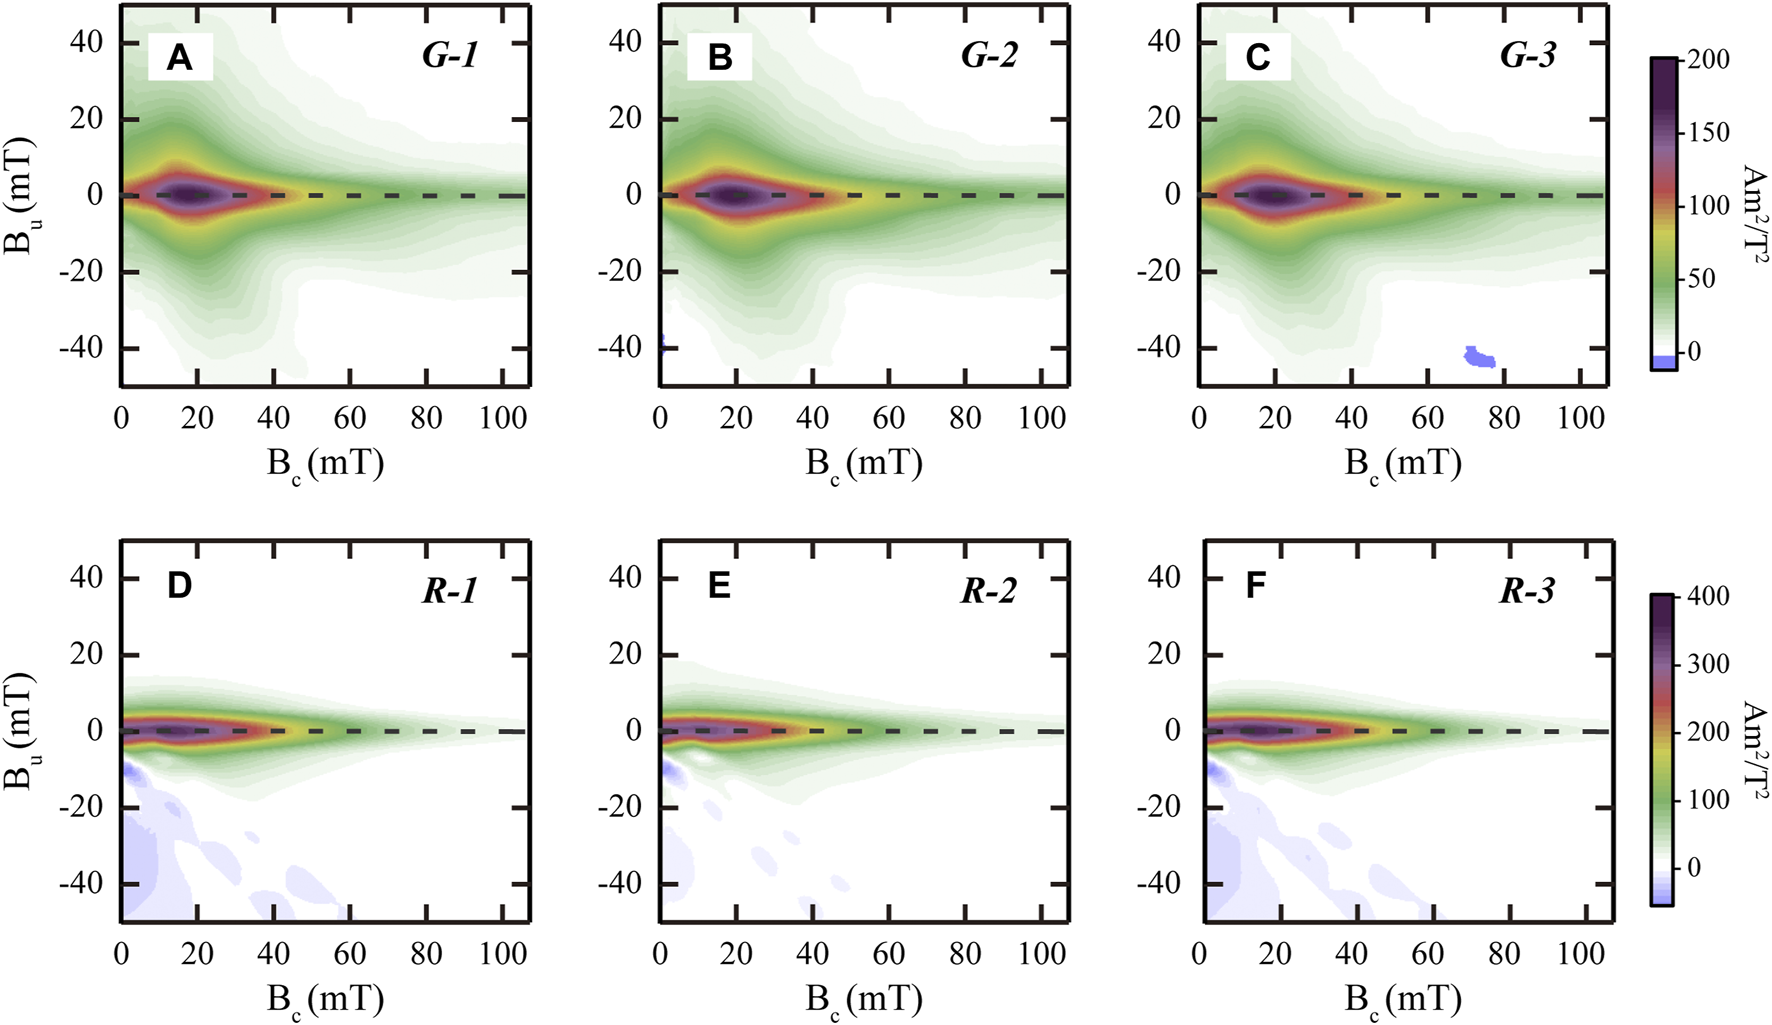
FORC diagrams of representative samples. Data were processed using FORCinel version 3.06 software from Harrison and Feinberg (2008), with smoothing parameters Sc0=Sc1=Sb1=7, Sb0=5. (A–C) is drawn using the same color scales on the right side of the (C), (E–F) is drawn using the same color scales on the right side of the (F).
χ-T curves are sensitive to magnetic mineralogical changes during thermal treatment, which can provide information about magnetic mineralogy (Deng et al., 2001). All heating curves are characterized by a marked drop at 585°C, the Curie temperature of magnetite, which demonstrates that magnetite is the dominant magnetic minerals in both bricks (Figure 6). The heating curve of red brick is still decreasing after 585°C, indicating the presence of partially-oxidized magnetite or hematite which also corresponding with the decomposition results of IRM. The steady increase of χ below approximately 250°C is interpreted as the unblocking of fine-grained ferrimagnetic particles. In the grey brick, a significant decrease of χ can be observed between 350°C and 360°C, but this decrease is reversible and can be observed in stepwise χ-T (Figure 6). This reversal change is not caused by the transformation of the mineral. It is most likely due to the changes of magnetic interactions during heating. For an SD particle with strong interaction, the interaction will first decrease and then increase during heating, which may affect the susceptibility characteristics at high temperature (Carvallo et al., 2004; Dodrill et al., 2015). For the R-2 samples in red brick, the decrease of χ between approximately 300°C and 360°C is irreversible, suggesting that the decrease of χ might be caused by the transformation of maghemite to hematite. In addition, almost all heating curves are higher than cooling curves, possibly due to the loss or oxidation of the magnetite and the transformation of ferromagnetic maghemite to antiferromagnetic hematite during heating (Liu et al., 2003; Zhang and Appel, 2023). In the secondary χ-T cycle and stepwise χ-T cycle, the χ-T curves of G-1, G-2, G-3, R-1 and R-3 are reversible, indicating the firing temperature of two bricks are high than 700°C. The presence of maghemite in the R-2 samples indicates that the firing temperature is unexpectedly below 350°C. It is surprising to see such a low temperature in the middle layer of a brick with a thickness of ∼6.4 cm. This is probably due to the short firing time at high temperature in kiln. Even though the initial firing temperature of the middle layer might have been higher, possibly exceeding 700°C, the short firing time may have led to incomplete transformation of the minerals. Overall, the significantly low values of χ, NRM and Ms of R-2 suggest that the red brick is heated unevenly (Supplementary Tables S1, S3; Figure 3).
FIGURE 6

Magnetic susceptibility versus temperature (χ-T) curves. (A–F) secondary heating method, (G–L) stepwise heating method. Black arrows in (D) represent the feature of partially-oxidized magnetite.
Orthogonal vector demagnetization plots (Zijderveld, 2013) and NRM decay diagrams for all samples are shown in Figure 7. The viscous remanent magnetization (VRM), which is acquired by large-sized, MD grains during transportation, storage, or preparation, can be progressively removed after 0–15 mT/100°C demagnetization. After VRM is removed, all samples showed a stable decay-to-origin component up to 150 mT/600°C, which was interpreted as the characteristic remanent magnetization (ChRM) of the samples. The NRM directions were determined using principal component analysis (PCA) for the linear part of ChRM, generally between 20 and 100 mT and 150°C–550°C. The direction obtained by AF and thermal demagnetization are the same for both bricks. Based on the magnetic and demagnetization results, we interpreted the ChRM of the grey brick to be dominantly carried by SD magnetite with strong magnetostatic interactions, and for the red brick by SD magnetite/maghemite withweak magnetostatic interactions.
FIGURE 7

Remanence decay curves (left) and Orthogonal vector plots (right) for the stepwise demagnetization of all samples. Blue and red circles represent projection onto the horizontal and vertical plane, respectively (AFD, Alter-field demagnetization; THD, thermal demagnetization).
4 Discussion
4.1 Spatial characteristics of rock magnetism in brick
The spatial distribution of the χ and NRM of the two bricks analyzed in this study is shown in Figure 8. In these figures, we see that the red brick shows significant spatial heterogeneity in χ and NRM, mainly in the second layer where the values are significantly lower than other layers (Figures 8B, D). The value ranking of χ and NRM of the red brick’s three layers are as follow: first layer third layer second layer. The grey brick, on the other hand, does not show any significant spatial differences (Figures 8A, C). According to the results of rock magnetism, the main reason for this difference in spatial distribution is related to the original firing temperature.
FIGURE 8

Spatial characteristics of NRM (A, B) and magnetic susceptibility (C, D) for the grey and red bricks.
The first and third layers of red brick shows reversible heating and cooling curves with a 20% decrease in χ after cooling to room temperature. This indicates that the magnetite was oxidized during heating. The second layer had an irreversible behavior with a 45%–55% decrease in χ after cooling, and a decrease between approximately 300°C and 360°C of the heating curve, which shows the thermal characteristics of maghemite and magnetite. While the presence of maghemite does not indicate that the firing temperature of the second layers was much lower than the other layers during initial firing. This uneven heating may be related to the short firing time for the red brick in the kilns which led to incomplete transformation of the minerals. Of course, the average firing temperature of the second layer is lower than other layers under short firing time. This is also consistent with the common sense that the inner temperature of an object is lower than the surface temperature when it is unevenly heated.
The final color of each brick depends on the composition of the raw materials used to make them and on the degree of mineral transformation during firing, which itself depends on temperature, firing time, and the redox environment inside the kilns (Maritan et al., 2006; Yang et al., 2014; Pérez-Monserrat et al., 2021). For raw materials containing iron oxides and hydroxides, or organic and/or Fe-bearing base clays, the brick color can vary from yellow to red in oxidation conditions, and from grey or black in reducing conditions (Kreimeyer, 1987; Maritan et al., 2006; Pérez-Monserrat et al., 2021). According to historical documents and recent research, in order to generate and maintain a reduction environment, the top of kiln needs to be sealed during firing (Song, 2008; Zhao et al., 2019). Subsequently, the bricks were allowed to cool when water was poured on the top of the kiln. As the bricks cooled, water would be drawn inside the kiln due to the pressure-gradient force between the lower internal pressure and the higher pressure of the surrounding atmosphere. This process resulted in the excess water reacting within the kiln, producing carbon monoxide and hydrogen during the cooling phase (Song, 2008). As a result, the bricks would acquire a grey color. Red bricks cool faster in an open environment with oxygen as compared to a closed environment with reduction conditions. The grey brick remains at a high temperature for a longer residence time than the red brick. This difference in cooling rate and firing time led to a significant difference of temperature between the inside and outside of the brick. As a result, the minerals inside the brick do not fully transform. According to the results of rock magnetism, the internal layer (R-2) of red brick has the maghemite which are not found in the surface layer (R-1, R-3), and the grain size of R-2 is coarser than R-1 and R-3, and more concentration of partially-oxidized coarse-grained magnetite. Due to the difference of firing temperature and firing time, the difference in the abundance, type and grain size of magnetic mineral between different layers are further manifested as the spatial heterogeneity in the magnetic parameters (χ and NRM).
In addition to χ and NRM, the above spatial heterogeneity is also observed in other parameters. For example, the values of Ms and Mrs of the second layer in the red brick is significantly lower than other layers (Figure 3; Supplementary Table S3). In the coercivity spectra, the contribution of component 4 (partially-oxidized coarse-grained magnetite) in the second layer (∼14%) is higher than in other layers (∼7%). However, there is no obvious difference in the Bc and Bcr of the three layers of the red brick, and the FORC diagram shows similar characteristics.
4.2 Implications for archaeomagnetism
Brick and other fired archeological artifacts (e.g., pottery, metallurgical slags, and kiln fragments) are favorable materials to recover the secular variation of the Earth’s magnetic field in archaeomagnetism research (Cai et al., 2017; Mahgoub et al., 2019; Wang et al., 2023). However, it is rare to obtain full vector information (both direction and paleointensity) of the Earth’s magnetic field due to the difficulty in preserving these materials in situ. In this study, the direction obtained from different positions of brick by different demagnetization method is similar. This suggests that the direction of the geomagnetic field can be accurately recorded even if the brick is not heated evenly. However, great caution is needed in using them to represent paleomagnetic directions, as those bricks were moved and rotated after firing.
In the analysis of paleointensity, ideal artifacts for analysis should possess non-interacting SD particles, as only non-interacting SD grains obey the Thellier laws of additivity, reciprocity, and independence (Dunlop and Özdemir, 2001; Dunlop, 2011). However, the magnetic minerals in natural materials have different sizes, shapes, and magnetic domains, which will have non-negligible effects on the results of paleointensity analyses (Levi, 1977; Xu and Dunlop, 2004; Dunlop, 2011). For example, the Arai plot, which used to calculate the paleointensity, shows that as the grain size increases, the plot will deviate more and more from the ideal SD line. This deviation leads to an underestimation of the true paleomagnetic field strength (Dunlop, 2011; Smirnov et al., 2017). Therefore, several parameters can be used to select the most suitable samples for paleointensity experiments. The Koenigsberger ratio (Q-ratio) is an appropriate parameter to distinguish well-heated samples from those that were not sufficiently heated to carry a complete TRM (Schnepp et al., 2004; 2020a; 2020b). In this study, grey brick has a higher Q-ratio than red brick, and the Q-ratio of R-2 is significantly lower than R-1 and R-3 (Figure 9). The rock magnetic results show that the magnetic mineral particles of grey brick are coarser (lower ARM/SIRM; Supplementary Table S4) and have strong interactions. Although the red brick shows weak interaction between particles, R-2 contains higher coercivity minerals (lower S-ratio and higher HIRM/SIRM; Supplementary Table S4) and grain size is coarser than R-1 and R-3. Since paleointensity experiments were not performed in this study, according the results of magnetism and the requirements of paleointensity theory, we speculate that the grey brick and R-2 are probably not ideal materials for paleointensity study. The differences in paleointensity information recorded in the unevenly heated samples need to be further studied.
FIGURE 9

NRM versus bulk susceptibility plot on a logarithmic scale. Isoline of Koenigsberger ratio (Q) are shown. The Q-ratio of all samples are plotted in the top.
5 Conclusion
In this paper, we carried out a detailed rock magnetic study on two archaeological bricks from Sundayuan site, China. Our results suggest that the dominant magnetic carrier in grey bricks is SD magnetite with strong magnetostatic interactions, while the SD magnetite in red brick is weak magnetostatic interactions. Compared with the grey brick, the red brick showed significant variations in its magnetic properties (χ and NRM) among the three layers analyzed. These variations could be caused by differences in firing temperature and residence time of the brick in the kiln. The results of stepwise χ-T confirmed that the firing temperature of surface layer is higher than internal layer of red brick. Our work suggests that the layers of red brick with well-heated might more suitable for paleointensity study, whereas the insufficiently heated layer of red brick and the grey brick with strong magnetic interaction are not ideal materials for paleointensity study.
Based on our findings, we recommend that future archaeomagnetism research should evaluate the χ, NRM and Q-ratio of artifacts before carrying out any paleointensity analyses. These tests are time-saving compared to other rock magnetism analyses (e.g., χ-T, loop, FORC). Combined with representative samples’ rock magnetism data, the suitable samples with sufficiently heated can be effectively selected. This is very useful for paleomagnetic experiments with very large numbers of samples.
Statements
Data availability statement
Paleomagnetic data have been deposited in the Magnetics Information Consortium (MagIC) database (DOI: 10.7288/V4/MAGIC/19925).
Author contributions
QC: Writing–original draft, Funding acquisition. QS: Funding acquisition, Investigation, Writing–review and editing. LL: Data curation, Writing–review and editing. WW: Funding acquisition. XY: Conceptualization, Writing–review and editing.
Funding
The author(s) declare financial support was received for the research, authorship, and/or publication of this article. This research is supported by the projects of Social Science Foundation of Shandong Province of China (2022-JCLS-03), National Natural Science Foundation of China (41904068), Major Program of National Social Science Foundation of China (20&ZD246).
Acknowledgments
The authors thank two reviewers for their helpful and constructive reviews of the manuscript. We thank LetPub (www.letpub.com) for linguistic assistance and pre-submission expert review and we are grateful to Wanyun Liu for assisting in the analysis of the thermal demagnetization. QC acknowledges the support of the Yale MacMillan Center for inviting her to the Yale University.
Conflict of interest
The authors declare that the research was conducted in the absence of any commercial or financial relationships that could be construed as a potential conflict of interest.
Publisher’s note
All claims expressed in this article are solely those of the authors and do not necessarily represent those of their affiliated organizations, or those of the publisher, the editors and the reviewers. Any product that may be evaluated in this article, or claim that may be made by its manufacturer, is not guaranteed or endorsed by the publisher.
Supplementary material
The Supplementary Material for this article can be found online at: https://www.frontiersin.org/articles/10.3389/feart.2023.1272317/full#supplementary-material
References
1
Ben-Yosef E. Tauxe L. Levy T. E. Shaar R. Ron H. Najjar M. (2009). Geomagnetic intensity spike recorded in high resolution slag deposit in Southern Jordan. Earth Planet. Sci. Lett.287 (3), 529–539. 10.1016/j.epsl.2009.09.001
2
Brown M. C. Donadini F. Korte M. Nilsson A. Korhonen K. Lodge A. et al (2015). GEOMAGIA50.v3: 1. general structure and modifications to the archeological and volcanic database. Earth, Planets Space67 (1), 83. 10.1186/s40623-015-0232-0
3
Cai S. Jin G. Tauxe L. Deng C. Qin H. Pan Y. et al (2017). Archaeointensity results spanning the past 6 kiloyears from eastern China and implications for extreme behaviors of the geomagnetic field. Proc. Natl. Acad. Sci.114 (1), 39–44. 10.1073/pnas.1616976114
4
Cai S. Tauxe L. Wang W. Deng C. Pan Y. Yang L. et al (2020). High-fidelity archeointensity results for the late neolithic Period from Central China. Geophys. Res. Lett.47 (10), e2020GL087625. 10.1029/2020GL087625
5
Carvallo C. Özdemir Ö. Dunlop D. J. (2004). First-order reversal curve (FORC) diagrams of elongated single-domain grains at high and low temperatures. J. Geophys. Res. Solid Earth109 (B4). 10.1029/2003JB002539
6
Deng C. Zhu R. Jackson M. J. Verosub K. L. Singer M. J. (2001). Variability of the temperature-dependent susceptibility of the Holocene eolian deposits in the Chinese loess plateau: a pedogenesis indicator. Phys. Chem. Earth, Part A Solid Earth Geodesy26 (11), 873–878. 10.1016/S1464-1895(01)00135-1
7
Dodrill B. C. Lindemuth J. R. Radu C. Reichard H. S. (2015). White Paper: high-temperature FORC study of single- and multi-phase permanent magnets. MRS Bull.40 (11), 903–905. 10.1557/mrs.2015.290
8
Dunlop D. J. Özdemir Ö. (2001). Beyond Néel’s theories: thermal demagnetization of narrow-band partial thermoremanent magnetizations. Phys. Earth Planet. Interiors126 (1), 43–57. 10.1016/S0031-9201(01)00243-6
9
Dunlop D. J. (2011). Physical basis of the Thellier–Thellier and related paleointensity methods. Phys. Earth Planet. Interiors187 (3), 118–138. 10.1016/j.pepi.2011.03.006
10
Dunlop D. J. (2002). Theory and application of the Day plot (Mrs/MsversusHcr/Hc) 1. Theoretical curves and tests using titanomagnetite data. J. Geophys. Res. Solid Earth107 (B3). 10.1029/2001JB000486
11
Harrison R. J. Feinberg J. M. (2008). FORCinel: an improved algorithm for calculating first-order reversal curve distributions using locally weighted regression smoothing. Geochem. Geophys. Geosystems9 (5). 10.1029/2008GC001987
12
Heslop D. Dekkers M. J. Kruiver P. P. Van Oorschot I. H. M. (2002). Analysis of isothermal remanent magnetization acquisition curves using the expectation-maximization algorithm. Geophys. J. Int.148 (1), 58–64. 10.1046/j.0956-540x.2001.01558.x
13
Kreimeyer R. (1987). Some notes on the firing colour of clay bricks. Appl. Clay Sci.2 (2), 175–183. 10.1016/0169-1317(87)90007-X
14
Levi S. (1977). The effect of magnetite particle size on paleointensity determinations of the geomagnetic field. Phys. Earth Planet. Interiors13 (4), 245–259. 10.1016/0031-9201(77)90107-8
15
Liu Q. Banerjee S. K. Jackson M. J. Chen F. Pan Y. Zhu R. (2003). An integrated study of the grain-size-dependent magnetic mineralogy of the Chinese loess/paleosol and its environmental significance. J. Geophys. Res. Solid Earth108 (B9). 10.1029/2002JB002264
16
Mahgoub A. N. Juárez-Arriaga E. Böhnel H. Manzanilla L. R. Cyphers A. (2019). Refined 3600 years palaeointensity curve for Mexico. Phys. Earth Planet. Interiors296, 106328. 10.1016/j.pepi.2019.106328
17
Maritan L. Nodari L. Mazzoli C. Milano A. Russo U. (2006). Influence of firing conditions on ceramic products: experimental study on clay rich in organic matter. Appl. Clay Sci.31 (1), 1–15. 10.1016/j.clay.2005.08.007
18
Maxbauer D. P. Feinberg J. M. Fox D. L. (2016). MAX UnMix: a web application for unmixing magnetic coercivity distributions. Comput. Geosciences95, 140–145. 10.1016/j.cageo.2016.07.009
19
Pérez-Monserrat E. M. Maritan L. Garbin E. Cultrone G. (2021). Production technologies of ancient bricks from padua, Italy: changing colors and resistance over time. Minerals11 (7), 744. 10.3390/min11070744
20
Pike C. R. Roberts A. P. Verosub K. L. (1999). Characterizing interactions in fine magnetic particle systems using first order reversal curves. J. Appl. Phys.85 (9), 6660–6667. 10.1063/1.370176
21
Roberts A. P. Almeida T. P. Church N. S. Harrison R. J. Heslop D. Li Y. et al (2017). Resolving the origin of pseudo-single domain magnetic behavior. J. Geophys. Res. Solid Earth122 (12), 9534–9558. 10.1002/2017JB014860
22
Roberts A. P. Florindo F. Villa G. Chang L. Jovane L. Bohaty S. M. et al (2011). Magnetotactic bacterial abundance in pelagic marine environments is limited by organic carbon flux and availability of dissolved iron. Earth Planet. Sci. Lett.310 (3), 441–452. 10.1016/j.epsl.2011.08.011
23
Roberts A. P. Pike C. R. Verosub K. L. (2000). First-order reversal curve diagrams: a new tool for characterizing the magnetic properties of natural samples. J. Geophys. Res. Solid Earth105 (B12), 28461–28475. 10.1029/2000JB900326
24
Schnepp E. Pucher R. Reinders J. Hambach U. Soffel H. Hedley I. (2004). A German catalogue of archaeomagnetic data. Geophys. J. Int.157 (1), 64–78. 10.1111/j.1365-246X.2004.02163.x
25
Schnepp E. Thallner D. Arneitz P. Leonhardt R. (2020a). New archeomagnetic secular variation data from Central Europe, II: intensities. Phys. Earth Planet. Interiors309, 106605. 10.1016/j.pepi.2020.106605
26
Schnepp E. Thallner D. Arneitz P. Mauritsch H. Scholger R. Rolf C. et al (2020b). New archaeomagnetic secular variation data from Central Europe. I: directions. Geophys. J. Int.220 (2), 1023–1044. 10.1093/gji/ggz492
27
Smirnov A. V. Kulakov E. V. Foucher M. S. Bristol K. E. (2017). Intrinsic paleointensity bias and the long-term history of the geodynamo. Sci. Adv.3 (2), e1602306. 10.1126/sciadv.1602306
28
Song Y. X. (2008). Tiangong kaiwu (in Chinese). Shanghai Rarebooks Publishing House.
29
Wang F.-G. Yang S.-X. Ge J.-Y. Ollé A. Zhao K.-L. Yue J.-P. et al (2022). Innovative ochre processing and tool use in China 40,000 years ago. Nature603 (7900), 284–289. 10.1038/s41586-022-04445-2
30
Wang Q. Gong Z. Victor S. K. Corolla M. Underhill A. P. McIntosh R. J. et al (2023). New archaeomagnetic directions from Late Neolithic sites in Shandong province, China. Geophys. J. Int.232 (2), 1159–1172. 10.1093/gji/ggac381
31
Wei Q. Li D. Cao G. Zhang W. Wang S. (1980). ARCHAEOMAGNE TIC RESEARCH OF JIANGZHAI RELIC, NEOLITHIC EPOCH. Chin. J. Geophys. (In Chinese)23 (04), 403–414.
32
Xu S. Dunlop D. J. (2004). Thellier paleointensity theory and experiments for multidomain grains. Journal of Geophysical Research Solid Earth109 (B7). 10.1029/2004JB003024
33
Yang Y. Yu S.-Y. Zhu Y. Shao J. (2014). The making of fired clay bricks in China some 5000 Years ago. Archaeometry56 (2), 220–227. 10.1111/arcm.12014
34
Zhang Q. Appel E. (2023). Reversible thermal hysteresis in heating-cooling cycles of magnetic susceptibility: a fine particle effect of magnetite. Geophysical Research Letters50 (6), e2023GL102932. 10.1029/2023GL102932
35
Zhao P. Zhang X. Qin L. Zhang Y. Zhou L. (2019). Conservation of disappearing traditional manufacturing process for Chinese grey brick: field survey and laboratory study. Construction and Building Materials212, 531–540. 10.1016/j.conbuildmat.2019.03.317
36
Zijderveld J. D. A. (2013). A. C. Demagnetization of rocks: analysis of results. Developments in Solid Earth Geophysics3, 254–286. 10.1016/B978-1-4832-2894-5.50049-5
Summary
Keywords
archaeomagnetism, fired brick, rock magnetism, China, magnetic properties
Citation
Chen Q, Sun Q, Liao L, Wang W and Yang X (2023) Magnetic characteristics of Chinese archaeological bricks and their implications for archaeomagnetism. Front. Earth Sci. 11:1272317. doi: 10.3389/feart.2023.1272317
Received
03 August 2023
Accepted
02 October 2023
Published
16 October 2023
Volume
11 - 2023
Edited by
Thelma Berquo, Concordia College, United States
Reviewed by
Daniele Thallner, University of Florida, United States
Shuhui Cai, Chinese Academy of Sciences (CAS), China
Updates
Copyright
© 2023 Chen, Sun, Liao, Wang and Yang.
This is an open-access article distributed under the terms of the Creative Commons Attribution License (CC BY). The use, distribution or reproduction in other forums is permitted, provided the original author(s) and the copyright owner(s) are credited and that the original publication in this journal is cited, in accordance with accepted academic practice. No use, distribution or reproduction is permitted which does not comply with these terms.
*Correspondence: Xiaoqiang Yang, eesyxq@mail.sysu.edu.cn
Disclaimer
All claims expressed in this article are solely those of the authors and do not necessarily represent those of their affiliated organizations, or those of the publisher, the editors and the reviewers. Any product that may be evaluated in this article or claim that may be made by its manufacturer is not guaranteed or endorsed by the publisher.