 Haiquan Zhang1,2
 Qian Zhang1,2*Yexin Zhou1,2Baofeng Lan3Xintao Feng1,2Yi Chen4Qian Yu1,2Jinxiang Cheng1,2Yupeng Men1,2Ankun Zhao1,2
- 1Chengdu Center of China Geological Survey (Geosciences Innovation Center of Southwest China), Chengdu, China
- 2Key Laboratory of Sedimentary Basin and Oil and Gas Resources, Ministry of Natural Resources, Chengdu, China
- 3Guizhou Energy Industry Research Institute Co., Ltd., Guiyang, China
- 4Guizhou Research Institute of Petroleum Exploration and Development, Guiyang, China
To further study the sedimentary environment of the black mudstone in the early Carboniferous Dawuba Formation in the Middle and Upper Yangtze regions and support regional shale gas exploration and related research, the major and trace elements of the Dawuba Formation in Well CY1, located in deep water shelf facies, were tested and analyzed. The results show that the study area contains mainly continental margin deposits affected by hydrothermal deposition, and they are rich in organic matter and have high primary productivity. The parent rocks are mainly acidic rocks, such as felsic igneous rocks, granites and some sedimentary rocks. And the provenance is mainly provided by acidic igneous rocks of the Jiangnan Paleouplift. An ICV<1 and high CIA and Th/U values indicate a warm and humid climate and under stong chemical weathering conditions. The values of V/(V+Ni), Cu/Zn and Ce/La suggest that organic-rich intervals of the Dawuba Formation accumulated under predominantly dysoxic conditions. The warm and humid climate is conducive to the flourishing of micropaleontology, and the high primary paleoproductivity and weakly reducing environment are conducive to the formation of organic-rich shale, forming high-quality reservoir source rock in the Dawuba Formation.
Introduction
Natural gas resources account for a relatively large proportion of the energy structure of China, affecting the development and security of the country in key areas of economy, politics, security, etc (Guo et al., 2023; Zhang J. et al., 2023). With the vigorous development of unconventional petroleum in China, the exploration and development of shale gas in lower Paleozoic state in the Sichuan Basin has achieved remarkable results (Zhang et al., 2022; Zou et al., 2023). To further expand the resource potential, it is imperative to evaluate the shale gas resource potential of new strata in the new area of the Middle and Upper Yangtze region (Gu et al., 2022a; Gu et al., 2022b; Qiu et al., 2022; Zhang Q. et al., 2023). A set of organic-rich black shales that developed in the lower Carboniferous Dawuba Formation in southern Guizhou Province is a shelf–platform basin facies deposit with a large thickness and wide distribution (Zhang et al., 2016; Liang et al., 2022; Feng et al., 2023). Previous studies have been conducted on the reservoir characteristics of black shale in the Dawuba Formation, but the detailed geochemical characteristics and depositional environment of this black shale are relatively unknown (Qie et al., 2015; Yang et al., 2022). Therefore, in order to gain a deeper understanding of the sedimentary environment and tectonic pattern of the early Carboniferous Epoch and to select the favorable area of shale gas, this paper selects the mudstone core of Well CY1 in Changshun Sag, which is relatively developed in the deepwater facies area, for systematic petrological, mineralogical and geochemical analysis, and studies the sedimentary environment of black mudstone formation of Dawuba Formation in detail, which is of great significance for further understanding and evaluating the shale gas exploration potential in this area.
Geological setting
The Carboniferous Dawuba Formation is mainly distributed in the Liupanshui–Ziyun–Luodian area of the southern Guizhou Depression, and in the study area, the Changshun Sag is located in the northeasteran of Ziyun area, which is mainly controlled by the Anshun–Guiyang fault and the Ziyun–Liupanshui fault (Ding et al., 2019; Liang et al., 2022) (Figure 1A). The main tectonic location is the southwest Yangtze passive continental margin, which has experienced multiple tectonic movements (Qie et al., 2015). Due to the continuous uplift of the central Guizhou uplift and Jiangnan uplift in the end of the Caledonian, the whole study area was a shallow sea environment (Fuquan, 1989; Chen et al., 2019; Yuan et al., 2019). During the Hercynian stage, the continuous expansion of the paleo-uplift and strong tectonic movement resulted in the formation of a NW-trending fault trough on the west side of the Ziyun–Liupanshui syndepositional fault through the action of strong tensile stress (Fuquan, 1989). The Late Devonian marine regression event made a carbonate platform deposition in the study area. In the Early Carboniferous period, sea transgression from the southeast direction, and the study area was transformed into shelf deposition, and gradually developed into carbonate platform facies in the late Carboniferous. Therefore, the Dawuba Formation was deposited in the inner depression of the platform and was controlled by a series of isolated carbonate platforms (Chen et al., 2018; Chen et al., 2019) (Figure 1A). The whole distribution was along the Ziyun–Liupanshui rifting trough, and the water gradually deepened from both sides of the rifting trough to the interior. From the tide flat to shelf facies (platform basin) transition, in the Zhenfeng area to the south of the Ziyun–Liupanshui fault, isolated platform deposition is developed, which makes the Dawuba Formation have a “platform-basin” facies sedimentary feature (Chen et al., 2019; Mei et al., 2021) (Figure 2). During the depositional period of the Dawuba Formation in the Changshun Sag, the water was deep and the resulting sedimentary rocks consisted of mainly mudstone initially, later incorporating limestone, indicating a gradually shallowing sedimentary sequence (Zhang et al., 2017).
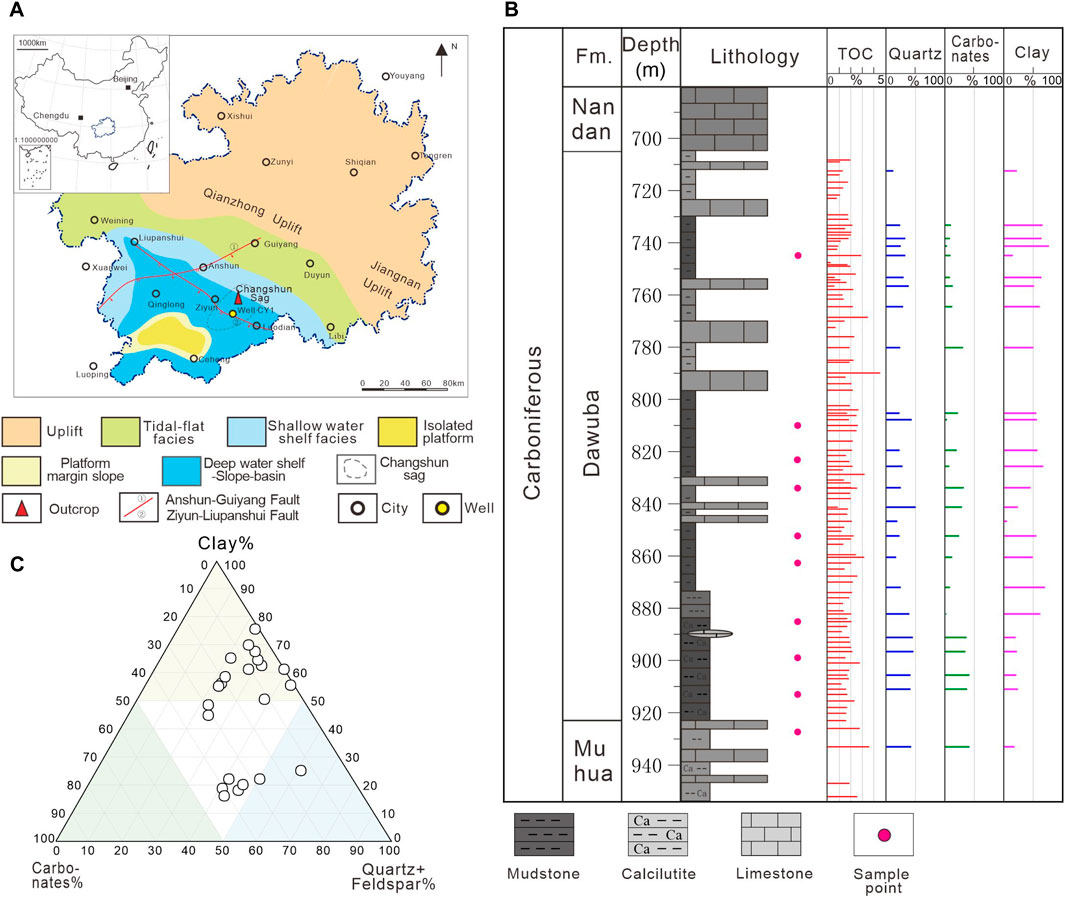
FIGURE 1. (A) Diagram of the sedimentary facies of the Dawuba Formation in Guizhou Province. (B) Stratigraphic column of the Well CY1 and the sampling location. (C) Ternary diagram of the mineral composition of the Dawuba Formation black mudstone.
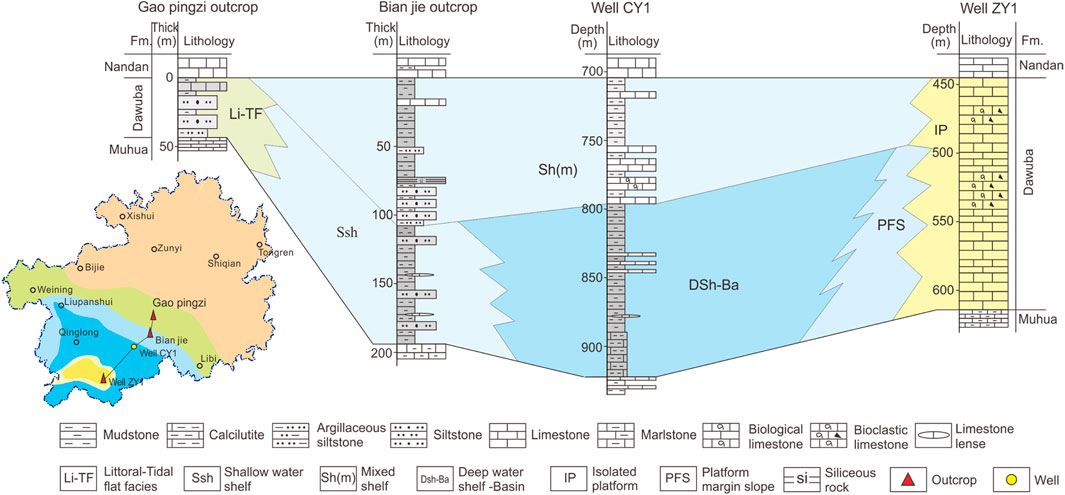
FIGURE 2. Stratigraphic correlation map of Dawuba Formation in Guizhou Province.
In this study, the mudstone of the Well CY1, located in the favorable shale gas formation facies–deep water shelf facies area, was selected to explore the sedimentary environment of the source rock formation. Well CY1 is located in the northern part of the Changshun Sag, far from the terrigenous detrital source area, and it is part of the seaward slope zone of the carbonate platform (Figure 1A). The true thickness of the well’s Dawuba Formation is 209.03 m, and it is in conforma-ble contact with the underlying Carboniferous Muhua Formation and the overlying Carboniferous Nandan Formation (Figures 1B, C). The lower part mainly consists of black carbonaceous mudstone and carbonaceous silty mudstone (Figure 3). These are part of the deepwater shelf-slope facies (Figure 2) and contain a few visible fossils (Figure 3B). The rocks are rich in organic matter with developed cracks (Figures 3C, D). The upper part is mainly gray argillaceous limestone with black mudstone (Figure 2), featuring fossils and bio-turbation structures (Figure 3E); it is a shallowing-upward sedimentary sequence, whose sedimentary environment changed from a deepwater shelf environment to a shallow-water shelf–platform slope (Figure 2). The black mudstone in the lower part of the Dawuba Formation is rich in organic matter, has a high total organic carbon content (the TOC mean value is 1.81%) (Figure 3C), has clay minerals and microfracture development (Figure 3D), and has great hydrocarbon generation potential, making it a favorable gas source rock and reservoir for shale gas exploration (Zhang et al., 2017).
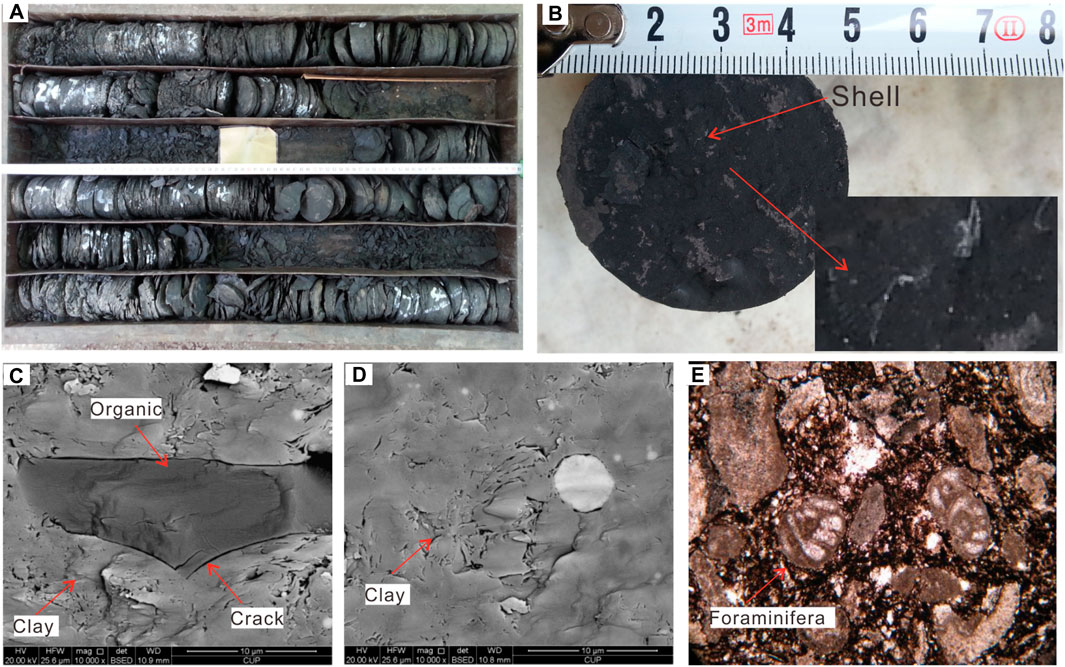
FIGURE 3. Lithologic characteristics of the Well CY1. (A) Black mudstone core in the lower part of the Dawuba Formation. (B) shell in the lower part of the Dawuba Formation. (C) organic matter and fracture in mudstone in the Dawuba Formation (SEM). (D) fractures of clay minerals in mudstone in the Dawuba Formation (SEM). (E) Foraminifera in the argillaceous limestone of the upper part of the Dawuba Formation.
Samples and methods
A total of 106 samples from the Well CY1 were selected for TOC analysis, 25 samples were selected for mineral composition testing, and 10 samples were collected from bottom to top for major and trace element analysis. The specific sampling locations and numbering are shown in Figure 1B. All tests were completed in the laboratory of the Chengdu Geological Survey Center. Prior to the analysis and test, fresh samples were ground to particle sizes of less than 0.2 mm under pollution-free conditions for TOC content analysis. The samples were ground to 200 mesh for major and trace element analysis. The major elements were detected by a Panaco Axios mAx PW4400/40 X-ray fluorescence spectrometer (Netherlands), and the analytical error was less than 1%. The analytical error of trace and rare earth elements was less than 5% according to the X-series II inductively coupled plasma mass spectrometer (ICP‒MS; ThermoFisher, United States). A ZJ207 Bruker D8 Advance X-ray diffractometer was used for X-ray diffraction analysis. Ni-filtering Cu target radiation was adopted. The working voltage was 40 kV, the working current was 40 mA, the emission slit and scattering slit were both 1°, and the receiving slit was 0.3 mm. The measurement criteria followed SY/T5163-2010, and High Score software was used for data analysis.
Analytical results
Petrological characteristics
Analysis of 106 black mudstone samples revealed a high total organic carbon (TOC) content in the Dawuba Formation, ranging from 0.78% to 4.51%, with an average of 1.81%. There are 98 organic-rich shale samples (TOC>1%), representing 92.45% of all samples (Figure 1B). A higher TOC content indicates higher paleoproductivity in the study area. The quantitative analytical results of X-ray diffraction show that the rocks are mainly composed of clay minerals, quartz and carbonate minerals, and clay minerals contents of 3%–76% and an average content of 43.44% (Table 1; Figure 1B). The quartz contents are 15%–45%, with an average of 26.08%. Carbonate minerals have low calcite content ranging from 1% to 74% with an average of 19.08%, and low dolomite content ranging from 1% to 37% with an average of 4.92%. The content of feldspar is low, and the feldspars are mainly plagioclase, with an average content of 3.28%. The pyrite content averages 2.2% and can be observed in most rocks. The clay minerals are mainly illite/smectite (average 80.79%) with small amounts of illite (average 11.63%), chlorite (average 4.91%) and kaolinite (average 4.11%) (Table 1; Figures 3C, D). According to the shale lithofacies division (Figure 1C), most of the sample points of Well CY1 plot in the clay lithofacies area and mixed shale facies. A high content of clay minerals is conducive to the adsorption of organic matter and the formation of organic-rich shale (Figures 3C, D). At the same time, it is conducive to the formation of micropores, thereby improving the adsorption capacity of shale gas and forming high-quality reservoirs (Zhang et al., 2022; Nie et al., 2023; Zhao et al., 2023).
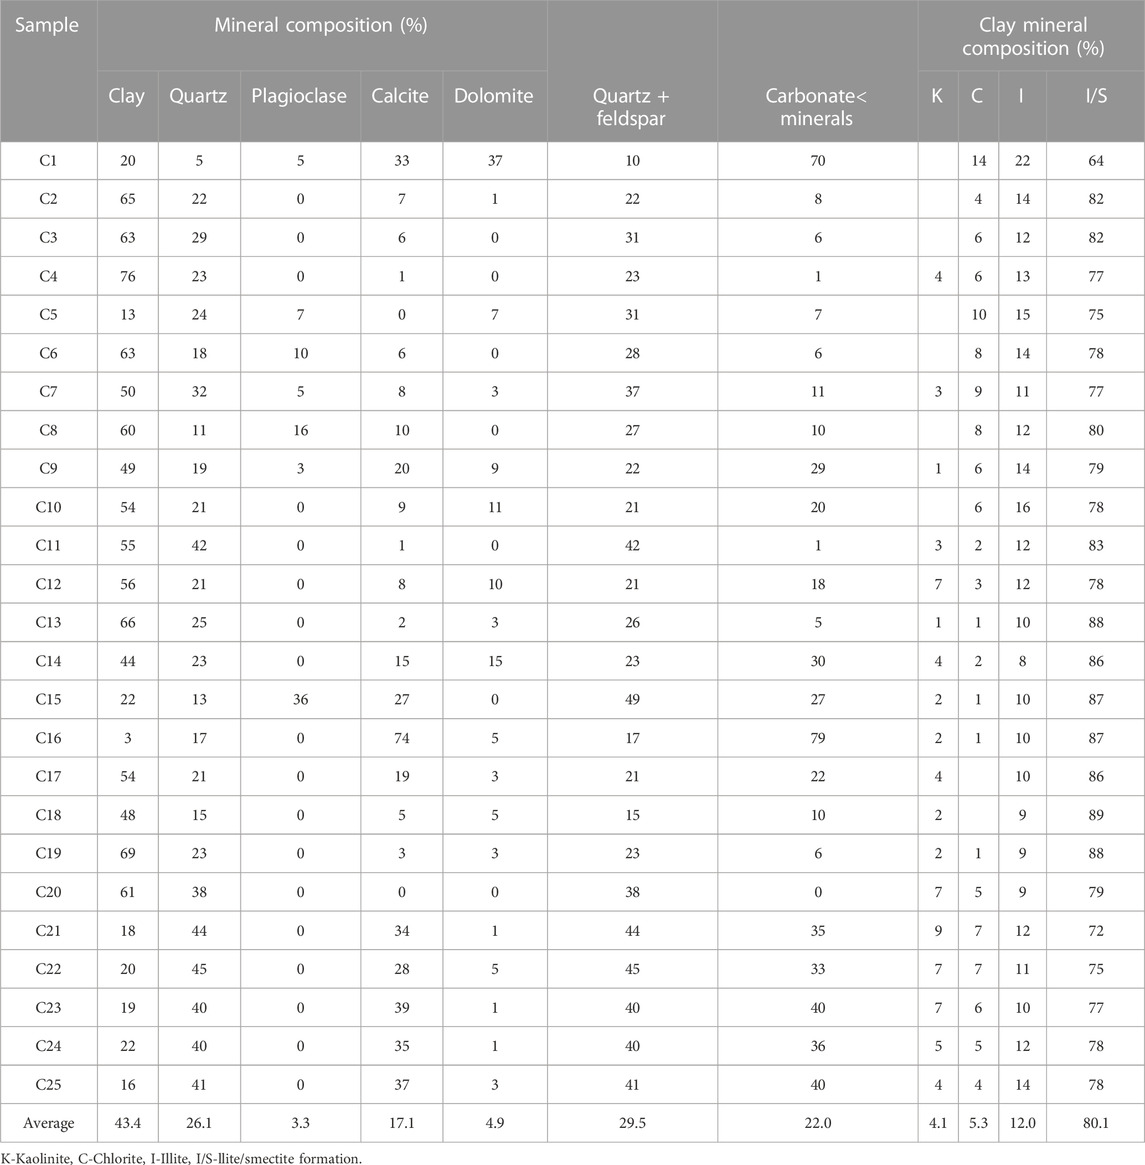
TABLE 1. Mineral composition (%) and clay mineral composition (%) of the Well CY1 well.
Major and trace element characteristics
The results of the major elements and related parameters in the Dawuba For-mation of Well CY1 are shown in Table 2 and Table 3. Compared with the Upper Continental Crust (UCC) values (Taylor and Mclennan, 1985), Al2O3, Fe2O3 and TiO2 are slightly enriched, and the other major ele-ments are slightly depleted. The enrichment of Al2O3 and TiO2 indicates that there was a continuous and stable input of terrigenous debris in the Dawuba Formation during the depositional period (Zhang J. et al., 2023). The loss on ignition (LOI) was high, with a mean value of 10.77%, which was related to the abundance of organic matter in the sample (Zhang Q. et al., 2023).
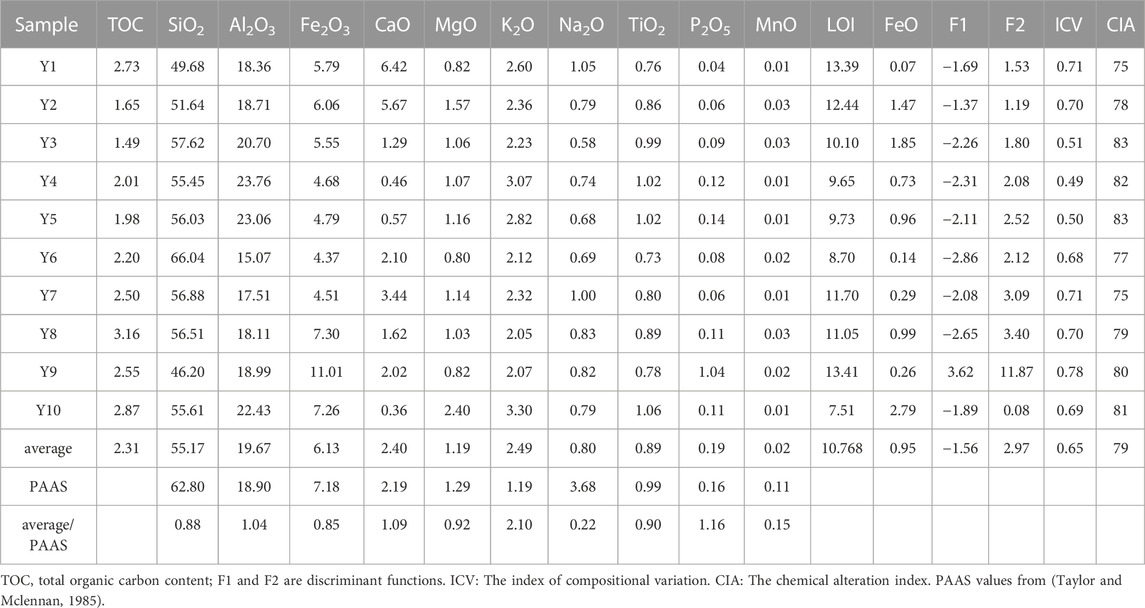
TABLE 2. TOC and major element (10–2) abundances and some associated parameters of mudstone from Well CY1.
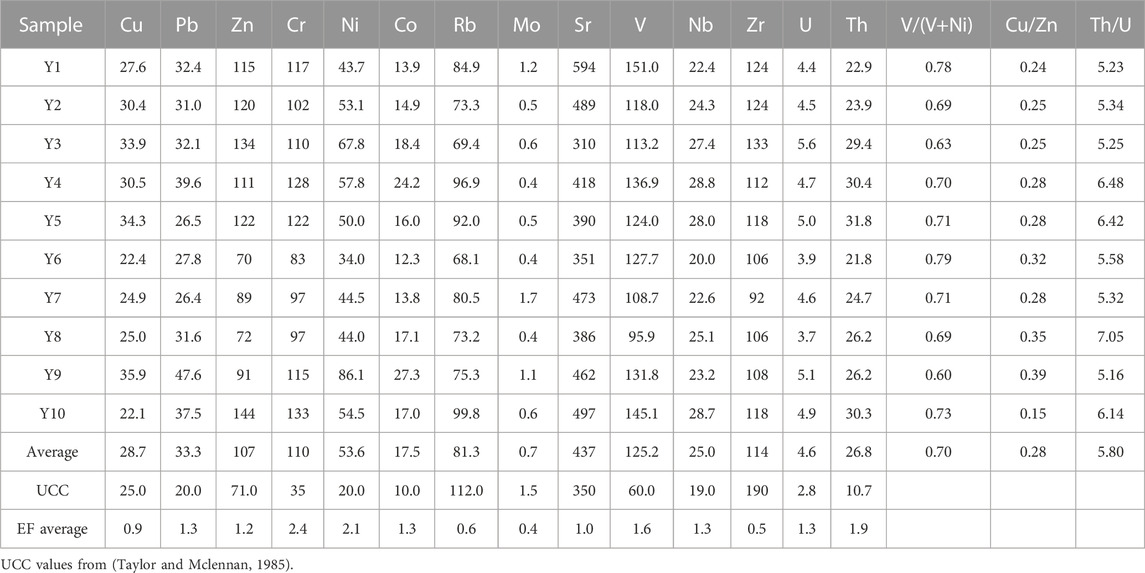
TABLE 3. Trace element (10–6) abundances and some associated parameters of mudstone from Well CY1.
The element enrichment factor (EF) = [(i/Al) sample/(i/Al) UCC] (Taylor and Mclennan, 1985; Condie, 1993; Mclennan, 2013), which is used to describe the enrichment of various trace elements in black shale, is defined as the ratio of the molar concentration of elements in the sample to the average molar concentration of the elements in the corresponding UCC (Taylor and Mclennan, 1985). Compared with the UCC, the trace elements of the Dawuba Formation in the study area are weakly enriched or not depleted except for Rb, Zr and Mo (Table 3). The enrichment of U, V, Ni, Cr, Cu, Zn may be related to hydrothermal activities or reductive sedimentary environment (Condie, 1993; Mclennan, 2013). Cu, Zn and Ni are all nutrient elements, and their enrichment indicates high paleoproductivity in this area (Steiner et al., 2001). The enrichment of Cr may be related to the influence of mantle material, it is suggested that mantle material may be involved in the diagenetic process of black rock series (Eker et al., 2012; Zhang et al., 2022). The lower abundance of redox-sensitive metals, such as Ni, V, and U, suggests that the sedimentary water during the Longmaxi Stage had low reducing conditions (Zhang et al., 2022).
Rare earth element characteristics
The total amount of rare earth elements (ΣREEs) in the black mud of the Well CY1 well ranging from 213.08×10⁻⁶ to 308.1×10⁻⁶, with an average value of 255.6×10⁻⁶ (Table 4), and the ratio of light to heavy rare earth elements (ΣLREE/ΣHREE) ranges from 4.63 to 12.90, with an average value of 10.05. The light REEs are considerably enriched relative to the heavy REEs. Moreover, the weak negative Eu anomaly (δEu ranging from 0.75 to 0.97 with average 0.84) and negligible δCe=0.72–1.11), negative Ce anomaly (δCes fluctuates from 0.72 to 1.11 with average 0.92), indicating a dysoxic or weak oxidation continental margin environment (Murray, 1994). The LaN/YbN values range from 0.91 to 1.62, with an average of 1.31 (Table 4). Most of the samlpes distributed in the continental margin (LaN/YbN ranging from 1.49 to 1.74) (Bhatia, 1985), while a few plot between the continental margin and the deep-sea basin (LaN/YbN values were 0.70) (Bhatia, 1985; Liang et al., 2022), indicating that the sedimentary period may have been influenced by pelagic and deep-sea sediments (Liang et al., 2022). The standard curve of chondrite of REE is L-shaped with right-leaning (Figure 4A), reveals a deficit of light rare earth enriched the heavy one, which is basically consistent with the REEs composition characteristics of the average UCC and PAAS and consistent with the deposition characteristics of crust source material (Gromet et al., 1984; Taylor and Mclennan, 1985). In the NASC-normalized diagram (Figure 4B), most samples are distributed almost horizontally, and the composition characteristics of REEs are similar to NASC, indicating that most sediment source rocks in the study area are mainly from the continental upper crust. The REE distribution model in the study area is not quite consistent (Figure 4) (Gromet et al., 1984), which indicates an unstable sedimentary basin with intense tectonic movement during the Dawuba period.
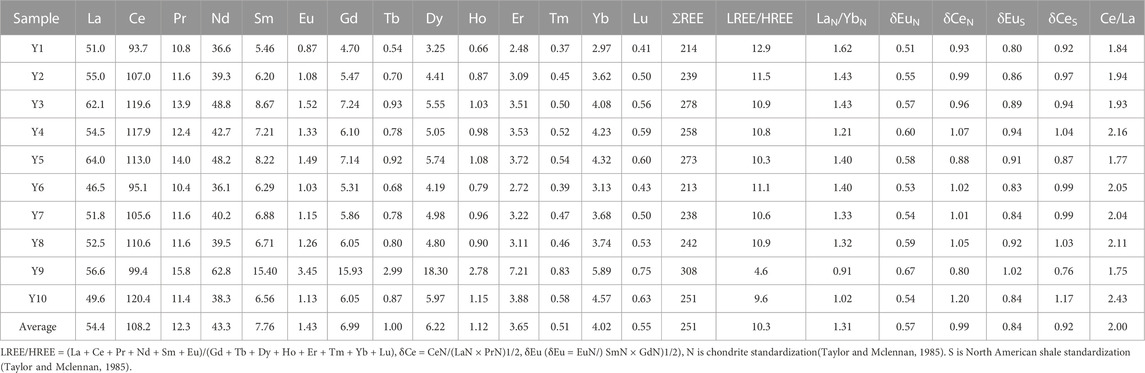
TABLE 4. Rare earth element (10−6) abundances and some associated parameters of Well CY1 black mudstone.
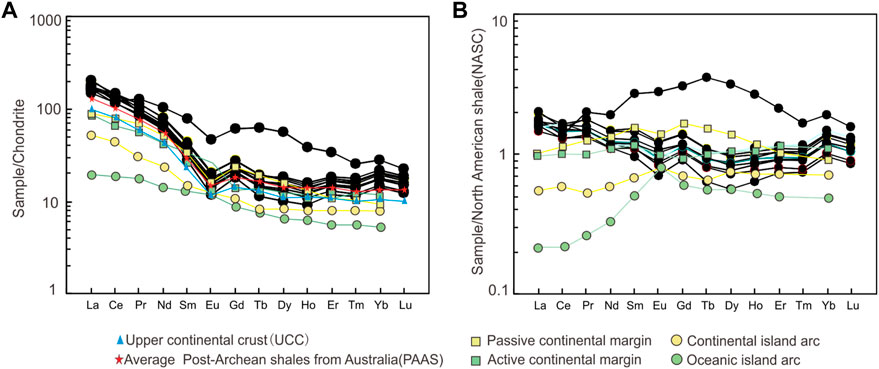
FIGURE 4. Chondrite-normalized (A) and NASC-normalized (B) REE patterns of black mudstone Well CY1. Map data from (Bhatia, 1985; Taylor and Mclennan, 1985).
Discussion
Rock source and origin
In marine sediments, the formation of black shale is a complex process, which is the result of the combined effects of terrigenous debris, hydrothermal sedimentation, biochemical processes, and other factors. The elements in rocks generally come from terrigenous detritus and the authigenic part of minerals, and the input of terrigenous detritus is a key factors affecting the mineral composition of black shale (Guo et al., 2023). Because the contents of A12O3 and TiO2 are mainly related to the input of terrigenous materials, they are relatively stable and rarely affected by diagenesis and later geological processes (Roser and Korsch, 1986). Therefore, the positive correlation between Al2O3 and TiO2, while the negative correlation between SiO2/A12O3 and A12O3 are indicate continuous input of terrigenous materials in the deposition process of the source region (Roser and Korsch, 1986). The black mudstone of Well CY1 shows this positive correlation (Figures 5A, B), which indicates that there is a high proportion of terrigenous material continuously input during the deposition of the Dawuba Formation. Meanwhile, Th, Nb, Ta, Zr, Rb and other incompatible elements are commonly from terrestrial sources (Cox et al., 1995). Figures 5C, D shows that Th, Nb and Al2O3 have a good positive correlation, indicating that the terrestrial source area of Nb and Th is relatively uniform, indicating that the terrestrial input background in the study area is relatively simple.
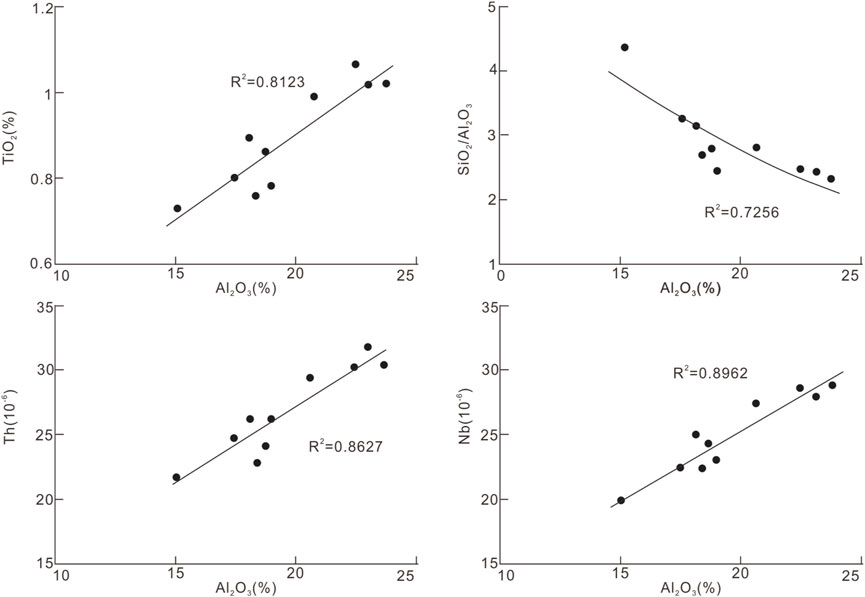
FIGURE 5. Correlation diagram of terrigenous clastic input of black mudstone in Well CY1.
Black shale formation is influenced by various factors. It is usually accompanied by oceanic anoxic events and the enrichment and mass extinction, and most of it is closely related to hydrothermal sediments (Qiu et al., 2022; Zhang et al., 2022; Zou et al., 2023). Hydrothermal activities will affect the content of some elements in sediments, especially trace elements. In general, submarine hydrothermal fluids are characterized by high contents of Cu, Pb, Zn, Ni, V, Cr and other elements (Li et al., 2017; Wang et al., 2018). The studied samples show slightly enriched elements, suggesting deep source material additions. Nagarajan et al. (2014) based on geochemistry of manganese deposits in the northeastern waters of Hokkaido, Japan believe that Co deposition is mainly related to hydrogenesis, while Ni and Zn are hydrothermal. Therefore, the discrimination diagram of these elements can be used to successfully distinguish hydrothermal deposition from non-hydrothermal deposition. It can be seen from the (Cu+Co+Ni)–Fe–Mn triangle diagram and Zn–Ni–Co triangle discrimination diagram (Rona, 1978; Rona et al., 1983; Adachi et al., 1986) (Figure 6) that most of the samples fall in the hydrothermal deposition area, indicating strong submarine hydrothermal deposition. Based on the above findings, it is suggested that hydrothermal deposition partly influenced the black shale of the Dawuba Formation in the study area during the tension environment of that period. Intense pressure created a faulted basin, where hydrothermal upwelling delivered nutrient-rich matter and formed the Dawuba Formation’s organic mudstone. However, relatively low concentrations of probably hydrothermal components in the studied rocks reflect that hydrothermal activity in the basin was not very high.
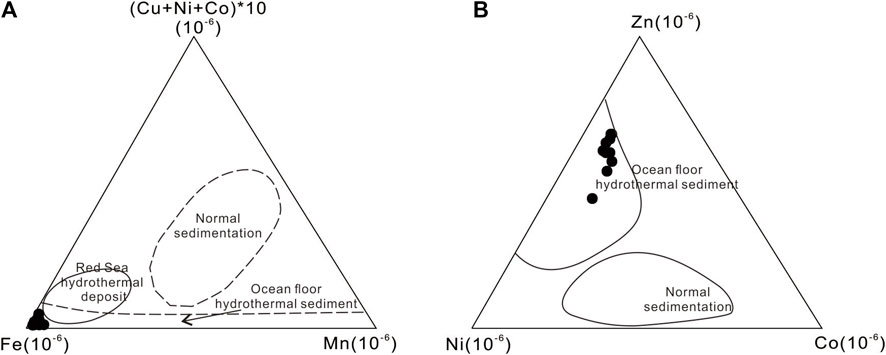
FIGURE 6. Identification diagram of hydrothermal influence on deposition of the studied mudstones. (A) based on Rona, 1978. (B) based on Adachi et al., 1986.
Provenance attribute and depositional tectonic background
The geochemical characteristics of detrital rocks in sedimentary rocks can effectively reflect the provenance characteristics. The relevant diagrams and ratios of major elements such as SiO2, TiO2, K2O, and Al2O3 and REEs such as La, Yb and REEs with low migration ability can be used as indicators determining provenance attribute of fine clastic rocks (Roser and Korsch, 1986; Cox et al., 1995). In the SiO2–TiO2 diagram (Figure 7A) (Roser and Korsch, 1986), most of the samples are mainly distributed in the igneous rock area, and one plot into the sedimentary rock area, indicating that the source rock has both igneous rock and sedimentary rock contributions. In the ΣREE–La/Yb diagram (Figure 7B) (Bhatia, 1985), the samples all plot in the intersection area of sedimentary rocks and granite. Combined with Figure 4A, the source rocks are mainly acidic rocks, such as felsic igneous rocks, granites and some sedimentary rocks. This is consistent with the intermediate-felsic rocks (e.g., the Caledonian and Hercynian diorite, granodiorite, plagiogranite) from the Jiangnan uplift in the northeastern margin of the study area.
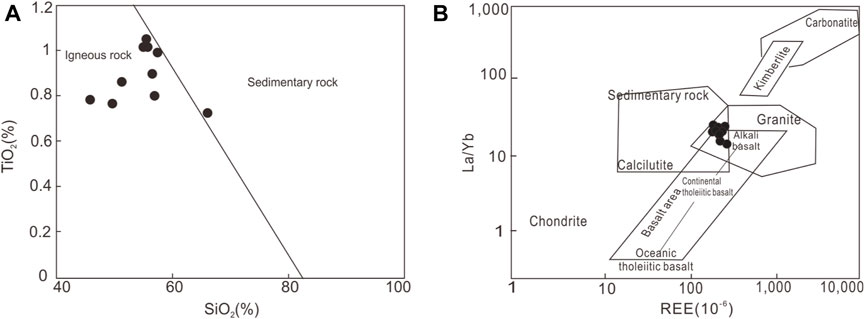
FIGURE 7. The source rock discrimination diagrams for mudstones of Well CY1. (A) base map from Roser and Korsch, 1986. (B) base map from Bhatia, 1985.
Previous studies indicate that sedimentary rock geochemistry can differentiate various tectonic settings. Roser and Korsch, (1988) established two discriminant functions, F1 and F2, according to the properties and characteristics of the main element oxides in sediments. The F1–F2 diagram can effectively distinguish the tectonic setting of the ancient sedimentary basin. The formulas are:
In the F1–F2 diagrams (Figure 8), the sample points in the study area mainly fall in the passive continental margin area, indicating that the sedimentary tectonic background of the study area is passive continental margin.
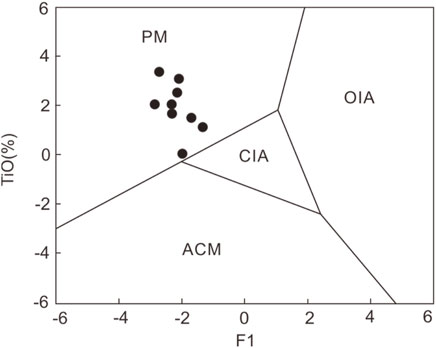
FIGURE 8. Tectonic setting discrimination diagrams of Well CY1. PM-passive continental margin; ACM-active continental margin; CIA-continental island arc; OIA-oceanic island arc. Base map is from (Roser and Korsch, 1988).
The distribution patterns of REEs are widely applied to identify modern and ancient sediments from different tectonic settings (Bhatia, 1985; Eker et al., 2012). In general, sediments at passive continental margins are characterized by light REE enrichment and negative Eu anomalies. In contrast, the parent rocks of the sediments on the active continental margin are mainly volcanic rocks with low differentiation, which are characterized by heavy REE enrichment and no negative Eu anomaly (Zhang et al., 2018). The light REEs are considerably enriched in shale samples in this area, and the ratio of light to heavy REEs (ΣLREE/ΣHREE) is 10.05. It show a weak negative Eu anomaly (mean 0.84) (Table 4; Figure 3), which is similar to sediments in the passive continental margin. Meanwhile, Bhatia (1985) summarized REE partitioning curves of miscellaneous sandstones under different tectonic settings. Most of the REE chondrite-normalized distribution patterns and NASC-normalized distribution patterns of the Dawuba Formation black mudstone exhibit characteristics similar to the REE partition curve of passive continental margins clastic rocks (Figure 4). This is in line with the results of main and microelement discrimination, suggesting that the tectonic background of the provenance area is mainly passive continental margin.
Provenance weathering and paleoclimatology
The index of compositional variation (ICV) can determine whether a clastic sedimentary rock was first deposited or recirculated (Cox et al., 1995; Zhang J. et al., 2023). The formula is as follows:
All of which are molar masses, and CaO* represents the CaO abundance derived from silicate minerals. To date, no direct methods have been used to quantify and distinguish the CaO contents in silicate portions and nonsilicate portions (apatite and carbonates). K2O* is the corrected K2O to eliminate the effect of potassium metasomatism on the results. The CaO* and K2O* contents studied here refer to the method described by McLennan and Taylor (1988) and Cox et al. (1995). It has been shown that the ICV value decreases because the primary sediments under strong weathering remain in the clay for a long time and are subjected to further weathering. Therefore, the clastic sedimentary rocks with low ICV values are considered to be from sedimentary sources containing large amounts of clay minerals, indicating the recirculation of sediments under active tectonic environments or the primary deposition of sediments under strong weathering conditions (Gaschnig et al., 2016; Zhang Q. et al., 2023). In contrast, clastic sedimentary rocks with high ICV values indicate primary deposition in an active tectonic environment (Moradi et al., 2016). Black mudstone in Well CY1 has an ICV value ranging from 0.49 to 0.71, averagely 0.65 (Figure 8A; Table 1), indicating high rock maturity. This suggests a provenance of sediment recirculation in an active tectonic environment or initial deposition under strong weathering conditions. Considering the geological history, it is probable that the Dawuba Formation was initially formed due to intensified rock weathering.
The chemical alteration index (CIA) is an important index used to judge the degree of chemical weathering in source areas (Gaschnig et al., 2016; Moradi et al., 2016). In the process of chemical weathering, Ca2+, Na+, and K+ of unstable minerals (e.g., feldspar, dark minerals) are lost in the form of ions along with surface fluids, while Si4+, Al3+, and Ti4+ of relatively stable minerals remain. Therefore, the CIA value increases with the strengthening of weathering. Generally, CIA values of 50–65 represent primary weathering in cold and dry environments, CIA values of 65–85 represent moderate weathering in warm and humid environments, and CIA values of 85–100 represent intense weathering in hot and humid environments (Gaschnig et al., 2016; Zhang J. et al., 2023). At the same time, since metasomatism makes Ca2+, Na+ and K+ unstable and affects CIA values, the effect of metasomatism should also be excluded when determining chemical weathering using CIA values. Under ideal conditions, if not metasomatized, the weathering proceeds along the direction of A‒CN or A‒K in the Al2O3−CaO* + Na2O−K2O (A‒CN‒K) diagram (Moradi et al., 2016). In the A‒CN‒K diagram, most samples in the study area are distributed along the A–CN direction, and the actual weathering line is basically parallel to the natural weathering line, indicating that the metasomatism of samples after deposition is weak, and the CIA value can be used to determine chemical weathering. The CIA value ranges from 75 to 83 (Table 1; Figure 8A), with an average of 79, indicating high chemical weathering due to intense weathering in warm and humid environments. Generally, climatic factors control sediment chemical weathering, while tectonic factors control source rock denudation and supply (Fedo et al., 1995). If the composition of major chemical elements in the sediment changes greatly and the samples in the A‒CN‒K triangle diagram are scattered and not compact, it indicates that the climate and tectonic environment are unstable in the provenance. In contrast, the compact distribution of plots in the A-CN-K diagram reflects the relatively stable chemical weathering and denudation in the source area (Fedo et al., 1995; Moradi et al., 2016). The distribution of studied sample is relatively compact (Figure 9B), indicating that the provenance was under relatively stable climatic and tectonic conditions during the depositional process. Moreover, the trend line of chemical weathering falls into the felsic igneous rock area (Figure 8B), indicating that the provenance consisted of mainly felsic igneous rock.
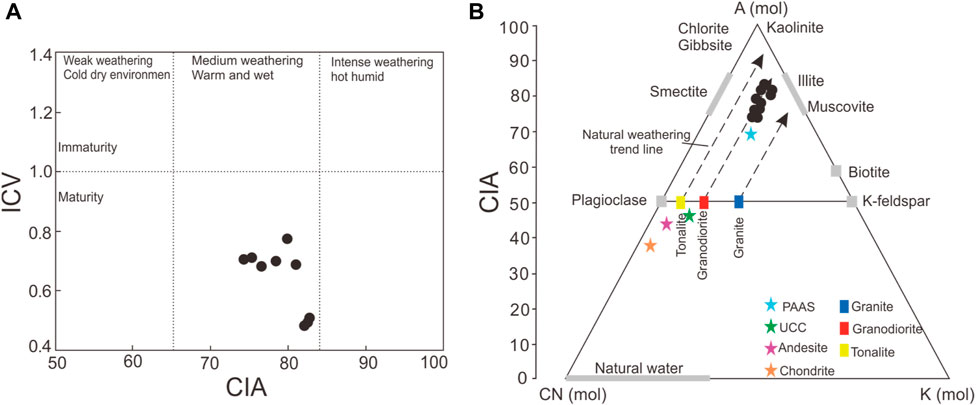
FIGURE 9. Palaeoclimate discrimination diagram of mudstones from the Well CY1. (A) The CIA−ICV diagram (Sensarma et al., 2008). (B) A−CN−K diagram of the studied rocks based on (Moradi et al., 2016).
In the weathering process, U is more active than Th, and the ratio of Th/U increases as a result of weathering (Taylor and Mclennan, 1985). Therefore, the trace element Th/U is also one of the indicators used to characterize the degree of chemical weathering. The values of Th/U in the samples also ranged from 5.23 to 7.05 (Table 2), with an average value of 5.8, which was significantly higher than that of UCC (3.89) and PAAS (4.71), indicating strong chemical weathering in the provenance area, which was consistent with the results discussed above.
Paleo-oxygenation facies
The paleo-oxygen phase refers to the synthesis of various rock, biological and geochemical features caused by the characteristics of dissolved oxygen in the water body and its related changes (Li et al., 2017; Wang et al., 2018). The paleo-oxygen phase is closely related to the generation, enrichment, deposition, burial and source rock formation of organic matter, which is the focus of shale gas geology (Qiu et al., 2022). Oxygenated water is essential for thriving plants, microorganisms, and animals. This boosts initial productivity and provides ample organic matter for later stages. Second, the reducing environment of water is related to whether it is conducive to the preservation of organic matter produced after the death of organisms, which is one of the main controlling factors for the formation of organic-rich sedimentary rocks (Nie et al., 2023).
Element V is highly reactive to redox conditions and concentrated in sediments affected by low-oxygen water. Both V and Ni belong to the iron group, but V is more likely to be enriched in the reducing environment than Ni (Zhou et al., 2015). Therefore, the value of V/(V+Ni) can reflect the oxidation‒reduction state of the sedimentary water body, and the value of V/(V+Ni) greater than 0.84, indicates an anoxic environment with the water sulfide and stratification. In a suboxic environment with a medium value (0.54–0.83) and no significant stratification, in a low value (0.46–0.53) show a dysoxic environment, the value less than 0.46 show a strong oxidizing environment (Zhao et al., 2016). The V/(V + Ni) values were 0.60–0.78, indicating a dysoxic–suboxic environment (Table 3; Figure 10). In addition, the Cu/Zn value can better reflect the degree of redox in the environment. If less than 0.21, it is an anoxic environment, and between 0.21 and 0.35 show a dysoxic environments. While ranging from 0.35 to 0.50 indicate a weak oxidation environments (Zhou et al., 2015; Zhao et al., 2016). The Cu/Zn values in the Well CY1 mudsone range from 0.15 to 0.39, with an average value of 0.28, which corresponds to a weak reduction environment. At the same time, the Ce/La ratio can also be used as a criterion for the oxidation reduction of sedimentary water (Zhang et al., 2017). A Ce/La ratio less than 1.5 indicates an oxygen-rich environment in the high-energy cycle, and a value between 1.5 and 1.8 indicates a dysoxic environment, while a value greater than 2 indicates a considerably anoxic environment (Zhou et al., 2015; Zhang et al., 2017). The Ce/La values in this study ranged from 1.75 to 2.43, with a mean of 2, also indicating a reducing environment. The δCe=0.72–1.11, with an average value of 0.92, shows a weak negative Ce anomaly, which also indicates a dysoxic environment in the depositional period of Dawuba Formation.
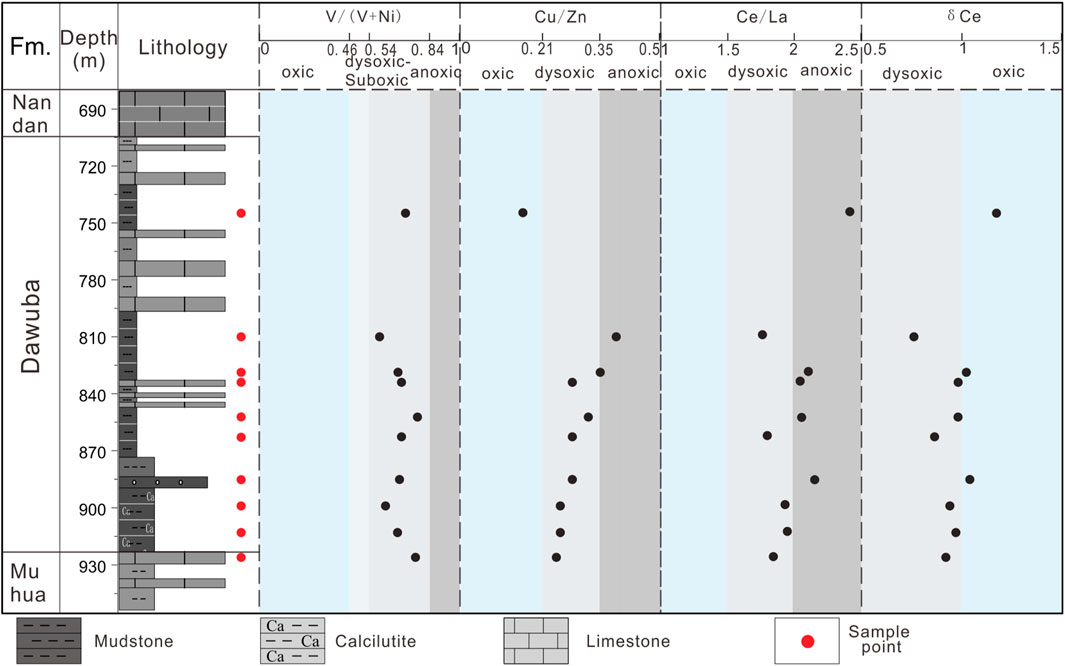
FIGURE 10. Column diagram of paleooxygen phase of Dawuba Formation (the threshold value is from Zhou et al., 2015; Zhao et al., 2016).
Sedimentary model and petroleum geological significance
The tectonic evolution of the Middle and Upper Yangtze region can be roughly summarized as follows: the Jinning Movement formed the basement at the end of the Neoproterozoic, the Craton basin evolution stage of plate movement in Southern China, the Proto–Tethis–Tethyan ocean evolution from the Early Paleozoic to the Middle Triassic, and then the intercontinental orogeny and foreland basin evolution in the Mesozoic and Cenozoic (Yuan et al., 2019; Liang et al., 2022). During the late Paleozoic, the southern Guizhou region was in the extensional conditionsforming as the Luipanshui–Ziyun–Luodian rifting trough that was subjected to marine transgression. The latter reached its maximum in the early Carboniferous, when the Carboniferous Dawuba Formation organic-rich mudstone was deposited (Liang et al., 2022; Yang et al., 2022). The lithofacies paleogeographic pattern of southern Guizhou is strictly controlled by regional fault expansion and tectonic compression, which is a sedimentary differentiation pattern between platforms and basins (Figure 11). Although the regional tectonic movement was intense, it still belonged to the passive continental margin sedimentary environment as a whole, which is consistent with the conclusion of the geochemical characteristics in this work (Yuan et al., 2019; Liang et al., 2022). The central Guizhou uplift and Jiangnan uplift are denudation areas of the early and Middle Caledonian uplift, and the uplift areas of the Carboniferous sedimentary period continue to uplift and expand and finally merge together (Yuan et al., 2019). The central Guizhou uplift is mainly exposed to Cambrian and Ordovician carbonate cap rocks, and the Jiangnan Paleouplift is mainly exposed to Precambrian felsic igneous rocks and metamorphic rock series (Liang et al., 2022; Yang et al., 2022). The petrological, mineralogical and geochemical characteristics reported in this work indicate that the parent rocks in the study area are mainly acidic rocks, such as felsic igneous rocks, granites and some sedimentary rocks, which is consistent with the lithology of the Jiangnan Paleouplift in the eastern part of the study area. Therefore, it is inferred that the provenance is mainly provided by acidic igneous rocks of the Jiangnan Paleouplift.

FIGURE 11. Depositional model of Dawuba Formation in the study area.
The tectonic stretching and extensive transgression created a low-oxygen environment that conducive to organic matter preservation. Frequent hydrothermal activities brought rich nutrients. In addition, the warm and humid climate, strong chemical weathering, and more terrigenous detritus input brought nutrients to organic matter, promoted the flourishing of organisms and produced higher paleoproductivity, and formed the organic-rich mudstone of Dawuba Formation. This mudstone layer has large thickness, wide regional distribution, high clay minerals content, and micro-fractures. It is a favorable source rock and reservoir for shale gas exploration and development.
Conclusion
A systematic study on the mineralogical, petrological and geochemical characteristics of the black mudstone of the early Carboniferous Dawuba Formation in Well CY1 shows the following:
The black mudstone in Well CY1 is characterized by high clay mineral and organic matter content. The high contents of Al2O3 and TiO2 indicate that terrigenous detritus had a great influence on the depositional process. The enrichment of U, V, Ni, Cr, Cu, Zn, loss of Sr and Zn–Ni–Co ternary discrimination diagram all indicate that the depositional period of the Dawuba Formation was affected by hydrothermal deposition.
According to the characteristics of major and trace elements, the high LREE/HREE values and the weak negative δEu anomalies indicate that the study area was on a passive continental margin, and the source rocks were mainly acidic rocks and the provenance is mainly provided by Jiangnan ancient land.
The ICV value of the Dawuba Formation black mud shale in the study area is less than 1. The average CIA value is 79, and the average Th/U value is 5.8, suggesting strong chemical weathering during the sedimentary period. The sedimentary climate was warm and moist, which was conducive to the flourishing of organisms and the generation of high ancient productivity.
According to the characteristics of V/(V+Ni), Cu/Zn and Ce/La, the mudstone deposits in the Dawuba Formation formed in a weakly reducing environment, which was conducive to the preservation of organic matter and the formation of favorable source rocks and reservoirs.
Data availability statement
The original contributions presented in the study are included in the article/Supplementary Material, further inquiries can be directed to the corresponding author.
Author contributions
HZ: Writing–original draft. QZ: Writing–original draft. YZ: Conceptualization, Formal Analysis, Writing–review and editing. BL: Conceptualization, Project administration, Formal Analysis, Writing–review and editing. XF: Methodology, Project administration, Writing–review and editing. YC: Methodology, Project administration, Writing–review and editing. QY: Data curation, Writing–review and editing. JC: Data curation, Writing–original draft. YM: Data curation, Formal Analysis, Writing–review and editing. AZ: Formal Analysis, Investigation, Writing–review and editing.
Funding
The authors declare financial support was received for the research, authorship, and/or publication of this article. The research was supported by the Guizhou Provincial Fund Project [Grant No. (2022) ZD005] and Guizhou Provincial Fund Project [Grant No. (2023)-344].
Conflict of interest
Author BL was employed by the Company Guizhou Energy Industry Research Institute Co., Ltd.
The remaining authors declare that the research was conducted in the absence of any commercial or financial relationships that could be construed as a potential conflict of interest.
Publisher’s note
All claims expressed in this article are solely those of the authors and do not necessarily represent those of their affiliated organizations, or those of the publisher, the editors and the reviewers. Any product that may be evaluated in this article, or claim that may be made by its manufacturer, is not guaranteed or endorsed by the publisher.
References
Adachi, M., Yamamoto, K., and Sugisaki, R. (1986). Hydrothermal chert and associated siliceous rocks from the northern Pacific their geological significance as indication od ocean ridge activity. Sediment. Geol. 47 (1-2), 125–148. doi:10.1016/0037-0738(86)90075-8
Bhatia, M. R. (1985). Rare earth element geochemistry of Australian Paleozoic graywackes and mudrocks: provenance and tectonic control. Sediment. Geol. 45 (1-2), 97–113. doi:10.1016/0037-0738(85)90025-9
Chen, J., Yi, T., Jin, J., Wang, M., Liu, N., and Li, D. (2018). Regioselectivity of oxidation by a polysaccharide monooxygenase from Chaetomium thermophilum. Coal Sci. Technol. 46 (8), 155–163. doi:10.1186/s13068-018-1156-2
Chen, R., Yuan, K., Zhang, Z., Xu, Q., Lu, S., and He, J. (2019). Geochemical characteristics of organic-rich shale in the Dawuba Formation, western Guizhou Province. Petroleum Geol. Exp. 41 (1), 10–15. doi:10.11781/sysydz201901010
Condie, K. C. (1993). Chemical composition and evolution of the upper continental crust: contrasting results from surface samples and shales. Chem. Geol. 104 (1-4), 1–37. doi:10.1016/0009-2541(93)90140-E
Cox, R., Lowe, D. R., and Cullers, R. L. (1995). The influence of sediment recycling and basement composition on evolution of mudrock chemistry in the southwestern United States. Geochimica Cosmochimica Acta 59 (14), 2919–2940. doi:10.1016/0016-7037(95)00185-9
Ding, J., Zhang, J., Li, X., Lang, Y., Zheng, Y., and Xu, L. (2019). Characteristics and controlling factors of organic matter enrichment of Lower Carboniferous black rock series deposited in inter-platform region, Southern Guizhou Depression. Lithol. Reserv. 31 (2), 83–95. doi:10.12108/yxyqc.20190210
Eker, C. S., Sipahi, F., and Kaygusuz, A. (2012). Trace and rare earth elements as indicators of provenance and depositional environments of Lias cherts in Gumushane, NE Turkey. Chem. Erde Geochem. 72 (2), 167–177. doi:10.1016/j.chemer.2011.11.004
Fedo, C. M., Nesbitt, H. W., and Young, G. M. (1995). Unraveling the effects of potassium metasomatism in sedimentary rocks and paleosols, with implications for paleoweathering conditions and provenance. Geology 23 (10), 921–924. doi:10.1130/0091-7613(1995)023<0921:uteopm>2.3.co;2
Feng, W., Li, R., Zhao, Z., Yu, Q., Liu, W., and Cao, J. (2023). Geological characterization and exploration potential of shale gas in the Carboniferous Jiusi Formation, northern Guizhou and Yunnan provinces, SW China. Energy Geosci. 4 (3), 100177. doi:10.1016/j.engeos.2023.100177
Fuquan, J. (1989). Carboniferous paleogeography and paleoenvironment between the North and South China blocks in eastern China. J. Southeast Asian Earth Sci. 3 (1), 219–222. doi:10.1016/0743-9547(89)90025-1
Gaschnig, R. M., Rudnick, R. L., Mcdonough, W. F., Kaufman, A. J., Valley, J. W., Hu, Z., et al. (2016). Compositional evolution of the upper continental crust through time, as constrained by ancient glacial diamictites. Geochim. Cosmochim. Acta 186, 316–343. doi:10.1016/j.gca.2016.03.020
Gromet, L. P., Haskin, L. A., Korotev, R. L., and Dymek, R. F. (1984). The "North American shale composite": its compilation, major and trace element characteristics. Geochim. Cosmochim. Acta 48 (12), 2469–2482. doi:10.1016/0016-7037(84)90298-9
Gu, Y., Cai, G., Hu, D., Wei, Z., Liu, R., Han, J., et al. (2022b). Geochemical and geological characterization of upper permian linghao formation shale in nanpanjiang basin, SW China. Front. Earth Sci. 10, 883146. doi:10.3389/feart.2022.883146
Gu, Y., Hu, D., Wei, Z., Liu, R., Hao, J., Han, J., et al. (2022a). Sedimentology and geochemistry of the upper permian linghao formation marine shale, central nanpanjiang basin, SW China. Front. Earth Sci. 10, 914426. doi:10.3389/feart.2022.914426
Guo, X., Hu, D., Shu, Z., Li, Y., Zheng, A., Wei, X., et al. (2023). Exploration, development, and construction in the Fuling national shale gas demonstration area in Chongqing: progress and prospects. Nat. Gas. Ind. B 10 (1), 62–72. doi:10.1016/j.ngib.2023.01.009
Li, Y., Zhang, T., Ellis, G. S., and Shao, D. (2017). Depositional environment and organic matter accumulation of upper ordovician lower silurian marine shale in the upper Yangtze platform, south China. Palaeogeogr. Palaeoclimatol. Palaeoecol. 466, 252–264. doi:10.1016/j.palaeo.2016.11.037
Liang, Y., Tang, X., Zhang, J., Liu, Y., Zhang, Y., Yuan, K., et al. (2022). Origin of lower carboniferous cherts in southern Guizhou, south China. Palaeogeogr. Palaeoclimatol. Palaeoecol. Int. J. Geol. Sci. 590, 110863. doi:10.1016/j.palaeo.2022.110863
Mclennan, S. M. (2013). Relationships between the trace element composition of sedimentary rocks and upper continental crust. Geochem. Geophys. Geosyst. 2 (4), 203–236. doi:10.1029/2000GC000109
McLennan, S. M., and Taylor, S. R. (1988). Crustal evolution: comments on “The Archean-Proterozoic transition: evidence from the geochemistry of metasedimentary rocks from Guyana and Montana” by A. K. Gibbs, C. W. Montgomery, P. A. O'day and E. A. Erslev. Geochimica Cosmochimica Acta 52 (1988), 785–787. doi:10.1016/0016-7037(88)90339-0
Mei, Y., Ji, Y., Ren, J., Zhang, H., and Zhou, Y. (2021). Shale gas accumulation conditions in the lower carboniferous jiusi formation of dianqianbei depression. J. Nat. Gas. Ind. 41 (S1), 51–59. doi:10.3787/j.issn.1000-0976.2021.S1.007
Moradi, A. V., Sari, A., and Akkaya, P. (2016). Geochemistry of the Miocene oil shale (Hançili Formation) in the Çankırı-Çorum Basin, Central Turkey: implications for Paleoclimate conditions, source–area weathering, provenance and tectonic setting. Sediment. Geol. 341 (15), 289–303. doi:10.1016/j.sedgeo.2016.05.002
Murray, R. W. (1994). Chemical criteria to identify the depositional environment of chert: general principles and applications. Sediment. Geol. 90 (3), 213–232. doi:10.1016/0037-0738(94)90039-6
Nie, H., Jin, Z., Li, P., Jay Katz, B., Dang, W., Liu, Q., et al. (2023). Deep shale gas in the Ordovician-Silurian Wufeng–Longmaxi formations of the Sichuan Basin, SW China: insights from reservoir characteristics, preservation conditions and development strategies. J. Asian Earth Sci. 244, 105521. doi:10.1016/j.jseaes.2022.105521
Nagarajan, R., Roy, P. D., Jonathan, M. P., Lozano, R., Kessler, F. L., and Prasanna, M. V. (2014). Geochemistry of Neogene sedimentary rocks from Borneo Basin, East Malaysia: paleo-weathering, provenance and tectonic setting. Chem. Erde Geochem. 74 (1), 139–146. doi:10.1016/j.chemer.2013.04.003
Qie, W., Liu, J., Chen, J., Wang, X., Mii, H., Zhang, X., et al. (2015). Local overprints on the global carbonate δ13C signal in Devonian–Carboniferous boundary successions of South China. Palaeogeogr. Palaeoclimatol. Palaeoecol. 418, 290–303. doi:10.1016/j.palaeo.2014.11.022
Qiu, Z., Liu, B., Lu, B., Shi, Z., and Li, Z. (2022). Mineralogical and petrographic characteristics of the Ordovician-Silurian Wufeng-Longmaxi Shale in the Sichuan Basin and implications for depositional conditions and diagenesis of black shales. Mar. Petroleum Geol. 135 (1), 105428. doi:10.1016/j.marpetgeo.2021.105428
Rona, P. A., Bostrom, K., Laubier, L., and Smith, K. L. (1983). Genesis of ferromanganese deposits diagnostic criteria for recent and old deposits. Springer US, 473–489. Chapter 20. doi:10.1007/978-1-4899-0402-7_20
Rona, P. A. (1978). Criteria for recognition of hydrothermal mineral deposits in oceanic crust. Econ. Geol. 73 (2), 135–160. doi:10.2113/gsecongeo.73.2.135
Roser, B. P., and Korsch, R. J. (1986). Determination of tectonic setting of sandstone-mudstone suites using SiO2 content and K2O/Na2O ratio. J. Geol. 94 (5), 635–650. doi:10.1086/629071
Roser, B. P., and Korsch, R. J. (1988). Provenance signatures of sandstone-mudstone suites determined using discriminant function analysis of major element data. Chem. Geol. 67 (1–2), 119–139. doi:10.1016/0009-2541(88)90010-1
Sensarma, S., Rajamani, V., and Tripathi, J. K. (2008). Petrography and geochemical characteristics of the sediments of the small River Hemavati, Southern India: implications for provenance and weathering processes. Sediment. Geol. 205 (3-4), 111–125. doi:10.1016/j.sedgeo.2008.02.001
Steiner, M., Wallis, E., Erdtmann, B. D., Zhao, Y., and Yang, R. (2001). Submarine-hydrothermal exhalative ore layers in black shales from South China and associated fossils-insights into a Lower Cambrian facies and bio-evolution. Palaeogr. Palaeoclimatol. Palaeoecol. 169 (3-4), 165–191. doi:10.1016/S0031-0182(01)00208-5
Taylor, S. R., and Mclennan, S. M. (1985). The continental crust: its composition and evolution. J. Geol. 94 (4), 57–72. doi:10.1086/629067
Wang, Y., Xu, S., Hao, F., Lu, Y., Shu, Z., Lu, Y., et al. (2018). Geochemical and petrographic characteristics of Wufeng-Longmaxi shales, Jiaoshiba area, southwest China: implications for organic matter differential accumulation. Mar. Petroleum Geol. 102, 138–154. doi:10.1016/j.marpetgeo.2018.12.038
Yang, J., Wen, H., Guo, X., Luo, C., Yu, W., Du, S., et al. (2022). Detrital zircon U–Pb ages and trace elements indicate the provenance of Early Carboniferous Li-rich claystone from central Guizhou, South China. Sediment. Geol. 442 (10), 106278–78. doi:10.1016/j.sedgeo.2022.106278
Yuan, K., Chen, R., Lin, T., Fang, X., Qin, Y., Wang, C., et al. (2019). Petrological characteristics and sedimentary environmentin the southern Guizhou during the Late Carboniferous. Petroleum Geol. Exp. 41 (01), 38–44. doi:10.11781/sysydz201901038
Zhang, H. Q., Wang, Z. H., Wang, H., Liu, W., Miao, Y. J., Li, Q., et al. (2016). Methemoglobin-based biological dose assessment for human blood. Sediment. Geol. Tethyan Geol. 36 (3), 30–36. doi:10.1097/HP.0000000000000522
Zhang, J., Li, Z., Wang, D., Xu, L., Li, Z., Niu, J., et al. (2023). Shale gas accumulation patterns in China. Nat. Gas. Ind. B 10 (1), 14–31. doi:10.1016/j.ngib.2023.01.004
Zhang, Q., Yu, Q., Wang, J., Xiao, Y., Chen, J., Zhao, A., et al. (2018). Sign backpropagation: an on-chip learning algorithm for analog RRAM neuromorphic computing systems. Rock Mineral analysis 37 (2), 217–223. doi:10.1016/j.neunet.2018.08.012
Zhang, Q., Men, Y., Yu, Q., Wang, G., Xiao, Y., Zhang, H., et al. (2022). Characteristics and enrichment genesis of the platinum group elements (PGEs) in organic rich shale of the wufeng and Longmaxi formations of upper ordovician and lower silurian in the Sichuan Basin. Minerals 12 (11), 1363. doi:10.3390/min12111363
Zhang, Q., Wang, J., Yu, Q., Wang, X., Zhao, A., Zhang, H., et al. (2017). The effect and safety of diacerein in patients with type 2 diabetes mellitus: a systematic review and meta-analysis. Sediment. Geol. Tethyan Geol. 37 (1), 97–106. doi:10.3969/j.issn.1009-3850.2017.01.013
Zhang, Q., Zhang, B., Yu, Q., Men, Y., Zhang, H., Kang, J., et al. (2023). Study on the prove-nance and tectonic setting of mudstone in the lower silurian Longmaxi formation of the yanyuan basin on the western margin of the Yangtze platform. Minerals 13 (2), 194. doi:10.3390/min13020194
Zhao, A., Wang, D., Zhang, Q., Lei, Z., Yu, Q., Zhang, D., et al. (2023). Sedimentary environment and organic matter accumulation of wufeng-longmaxi shales, southwest Yangtze platform: insights from geochemical and petrological evidence. China Geol. 6, 1–15. doi:10.31035/cg2022074
Zhao, J., Jin, Z., Jin, Z., Geng, Y., Wen, X., and Yan, C. (2016). Applying sedimentary geochemical proxies for paleoenvironment interpretation of organic-rich shale deposition in the Sichuan Basin, China. Int. J. Coal Geol. 163, 52–71. doi:10.1016/j.coal.2016.06.015
Zhou, L., Algeo, T. J., Shen, J., Hu, Z., Gong, H., Xie, S., et al. (2015). Changes in marine productivity and redox conditions during the Late Ordovician Hirnantian glaciation. Palaeogeogr. Palaeoclimatol. Palaeoecol. 420, 223–234. doi:10.1016/j.palaeo.2014.12.012
Keywords: Dawuba Formation, element geochemistry, provenance, tectonic setting, sedimentary environment
Citation: Zhang H, Zhang Q, Zhou Y, Lan B, Feng X, Chen Y, Yu Q, Cheng J, Men Y and Zhao A (2023) Geochemical characteristics and sedimentary environment of black mudstone in the early Carboniferous Dawuba Formation in the Middle and Upper Yangtze region. Front. Earth Sci. 11:1277359. doi: 10.3389/feart.2023.1277359
Received: 14 August 2023; Accepted: 02 October 2023;
Published: 16 October 2023.
Edited by:
Hu Li, Southwest Petroleum University, ChinaReviewed by:
Yifan Gu, Southwest Petroleum University, ChinaMeng Wang, Chongqing University of Science and Technology, China
Copyright © 2023 Zhang, Zhang, Zhou, Lan, Feng, Chen, Yu, Cheng, Men and Zhao. This is an open-access article distributed under the terms of the Creative Commons Attribution License (CC BY). The use, distribution or reproduction in other forums is permitted, provided the original author(s) and the copyright owner(s) are credited and that the original publication in this journal is cited, in accordance with accepted academic practice. No use, distribution or reproduction is permitted which does not comply with these terms.
*Correspondence: Qian Zhang, YW1hemluZzIwMjIyMDIyQDEyNi5jb20=