 Fu Yang
 Pengfei Jiang
 Zhonghui Duan1,2
- 1Key Laboratory of Coal Resources Exploration and Comprehensive Utilization, Ministry of Natural Resources, Xi’an, China
- 2Shaanxi Coal Geology Group Co., Ltd, Xi’an, China
- 3College of Geology and Environment, Xi’an University of Science and Technology, Xi’an, China
- 4School of Highway, Chang’an University, Xi’an, China
This study investigates pore distribution and permeability behavior of tar-rich coal following high-temperature pyrolysis at 500°C using X-ray computed tomography (CT) scanning. Coal samples post-pyrolysis were CT scanned, generating 1755 cross-sectional slices for three-dimensional reconstruction. An axial algorithm extracted pore distribution features, and geometric parameters were computed. An Equivalent Pore Network Model analyzed permeability characteristics. The results show that Post-pyrolysis pore distribution in tar-rich coal exhibited nonuniformity with a significant range in pore size distribution. Pores displayed concentrated spatial patterns. Total porosity was 14.24%, with 12.34% being connected. Most pores in Representative Elementary Volume (REV) regions fell within 10–50 μm in width and 20–60 μm in length, constituting over 40% of the total. Pore surface area peaked between 200–100 μm2, also comprising over 40% of the total. The Pore Network Model showed distinct characteristics in two REV regions: REV-1 demonstrated an early stage of development with poor connectivity, while REV-2 displayed a well-developed network with a bimodal coordination number histogram. The study highlights nonuniform post-pyrolysis pore distribution and significant pore size variations in tar-rich coal. This study is crucial for understanding permeability behavior in tar-rich coal after high-temperature pyrolysis.
1 Introduction
Coal, as the predominant global energy resource, finds extensive application in sectors such as power generation, heating, industrial production, and transportation (Li, 2021). In the realm of power generation, coal plays a pivotal role, constituting approximately 36% of the global energy mix (Wolde-Rufael and Yemane, 2010; Okoye-Chine and George, 2022). While many countries internationally are fostering the advancement and utilization of clean energy sources such as wind, solar, and hydropower (Jiang et al., 2010), the staggering worldwide coal production remains noteworthy. According to estimations by the International Energy Agency, global coal reserves are estimated to be around 11.395 billion metric tons. Furthermore, coal stands as the world’s second-largest energy resource, contributing to approximately a quarter of primary energy consumption, trailing only behind petroleum at 31.2% (IEA, 2018). Therefore, considering trends over recent decades, coal’s development still presents substantial prospects.
In recent years, tar-rich coal has garnered increasing attention due to its high tar content and abundant oil and gas resources (Zhang et al., 2013; Ju et al., 2021). Research indicates that the pyrolysis of one metric ton of tar-rich coal generates approximately 10% oil and 500 cubic meters of combustible gas. Notably, China possesses substantial reserves of tar-rich coal, with the Shaanxi Province in western China alone harboring reserves of 150 billion metric tons (Ju et al., 2021). As a significant consumer of petroleum, China’s abundant reserves of tar-rich coal, with their substantial tar resources, could offer an effective supplement to the nation’s petroleum supply. Rational development and utilization of tar-rich coal have the potential to provide a valuable complement to China’s petroleum supply. Relevant studies suggest that, considering a tar content of 10%, the potential petroleum resource from the exploitation of tar-rich coal in Shaanxi Province could reach up to 1.29 billion metric tons (Cheng, 2019).
Tar-rich coal, characterized by its abundant organic matter and tar content, exhibits a complex porous structure within its coal matrix (Xin et al., 2019). The porous network can be classified into four categories: micropores (diameter <10 nm), transitional pores (diameter 10–100 nm), mesopores (diameter 100–1,000 nm), macropores (diameter 1,000–10000 nm), and microcracks (diameter >10,000 nm) (Hodot, 1966). Among these, micropores, though smaller in size, possess a larger surface area, rendering them highly efficient and capable of accommodating substantial gas and liquid adsorption and storage (Mastalerz et al., 2008). Conversely, the presence of macroporous structures, characterized by larger diameters, confers advantages in gas storage and gas-liquid transport (Giffin, S et al., 2013). The extraction of tar involves in-situ underground pyrolysis, wherein tar-rich coal is heated to pyrolysis temperatures in its original geological layer and the resulting oil and gas products are subsequently extracted through drilling. The process of pyrolysis induces significant alterations in the pore structure of tar-rich coal, and the generated oil and gas products must flow through the high-temperature pyrolysis zone before they can be collected. Consequently, the investigation and quantitative characterization of the pore network structure during high-temperature pyrolysis of tar-rich coal hold paramount importance for optimizing and applying gas extraction, storage, and pyrolysis technologies.
With the advancement of technology, various research methods have emerged for studying pore network structures, including low-temperature gas adsorption, electron microscopy, mercury intrusion porosimetry, and nuclear magnetic resonance (Yao et al., 2008; Li et al., 2015; Nie et al., 2015; Zhao, 2017). CT technology is a non-destructive technique that does not damage the tested object, thus improving the accuracy of research data. It has significant advantages in studying the distribution characteristics of porous network structures and spatial flow features in objects. Therefore, CT technology is a more comprehensive and higher-resolution research method, facilitating the easier acquisition of relevant information about the porous structure of objects, particularly suitable for complex samples such as coal. Golab et al. (2013) utilized CT scanning to examine the three-dimensional distribution of minerals and pore fractures. Li et al. (2017) employed X-ray μ-CT to quantitatively analyze different pore sizes in bituminous and anthracite coal, establishing an equivalent pore network model to analyze permeability properties. Ni et al. (2017) quantitatively characterized large pores in coal using CT technology and performed numerical simulations of permeability based on three-dimensional reconstructions of coal samples. Currently, research on quantitative analysis of tar-rich coal after high-temperature pyrolysis using CT technology is relatively limited. This study aims to quantitatively characterize the pore structure of tar-rich coal after high-temperature pyrolysis, establish an equivalent network model, and analyze its permeability characteristics, providing guidance for in-situ pyrolysis processes of tar-rich coal.
In this study, Chinese tar-rich coal samples from Shanxi were selected for X-ray CT scanning after cooling to room temperature following pyrolysis at 500°C. A total of 1755−ΔΔCT slices were obtained and used for three-dimensional reconstruction. The pore distribution features of the coal samples after high-temperature pyrolysis were analyzed. Connected pores and isolated pores were extracted, their geometric parameters were analyzed, and a quantitative characterization was conducted. Subsequently, an equivalent pore network model (PNM) was established to investigate the developmental characteristics and pore flow properties of tar-rich coal after high-temperature pyrolysis. The aim of this study is to deepen the understanding of pore characteristics in tar-rich coal after high-temperature pyrolysis and to provide a scientific basis for the efficient development and utilization of tar-rich coal.
2 Experiment and method
2.1 Sample collection
The experimental samples were collected from the Jurassic coal seam in the Shenfu mining area of northern Shaanxi, China, at a burial depth of approximately 400 m. Industrial analysis and elemental analysis data are presented in Table 1. The original coal is cut and sanded to a smooth surface and polished to achieve a smooth surface, with dimensions approximately measuring 3.5 cm × 3.5 cm × 1.5 cm. The experimental specimens were subjected to heating under a nitrogen (N2) environment, reaching a temperature of 500°C over a duration of 2 h, followed by natural cooling to room temperature, yielding the tar-rich coal samples post high-temperature pyrolysis.

TABLE 1. Physical properties of tar-rich coal.
2.2 CT scan technical parameters
The CT scanning device employed in this study is the advanced Nikon XTH 320 X-ray inspection system. The test sample was a 7 mm cube sample. The instrument utilizes a cone-beam scanning mode, operating at a voltage of 119 kV and a current of 120 μA. Given the consideration of the high-temperature (500°C) pyrolyzed coal samples and the need for spatial resolution and noise control, This study determined that the spatial resolution of the CT scanner was 3.9 μm. The scanning process was conducted at a speed that resulted in an exposure time of 1 s per projection. Ultimately, a total of 1755 slices were acquired, each with a cross-sectional area of voxels and a thickness of 3.9 µm per slice.
2.3 CT digital image processing
2.3.1 Preprocessing of CT images
Due to the physical uncertainty of X-rays and the statistical limitations during the acquisition process, CT images inevitably exhibit noise. Therefore, it is crucial to apply filtering algorithms to CT images to eliminate noise, as this process significantly impacts subsequent image post-processing (Jing et al., 2017). Commonly used filtering algorithms include Convolution Filtering, Median Filtering, Gaussian Filtering, and Mean Filtering (Basran Parminder, 2011; Sun, 2022). The specific choice of filtering algorithm depends on the actual image characteristics. In this study, after performing calculations and trials with various algorithms, the unsharp masking algorithm was selected. One prominent feature of this algorithm is its ability to enhance image edges and details. This enables the capture of finer details during image post-processing, reducing errors in subsequent pore and crack threshold segmentation. The results of coal sample slicing are presented in Figure 1, where A represents the original slice and B depicts the slice after algorithm processing. The slices in Figure 1 consist of a series of grayscale images, with dark black representing pores and cracks, light black representing coal matrix, and white indicating high-density minerals. From the CT slices, a series of large-scale, elongated dark black pores and cracks can be observed, some of which are interconnected within the coal matrix. This phenomenon arises from the pyrolysis of organic matter within the coal at high temperatures, resulting in the formation of larger-scale pores and cracks. This differs from the pore and crack studies conducted by many researchers on coal samples at room temperature (Liu et al., 2017; Ju et al., 2018; Shi et al., 2018; Fan et al., 2020). In order to separately extract and three-dimensionally reconstruct pores, coal matrix, and minerals from the grayscale images, threshold segmentation processing is applied to the CT images. This study uses 16-bit images, which offer pixel grayscale values ranging from 0 to 65,535. Compared to 8-bit images, 16-bit images are more capable of capturing the finer details of pores and cracks, enhancing the precision and reliability of threshold segmentation results.
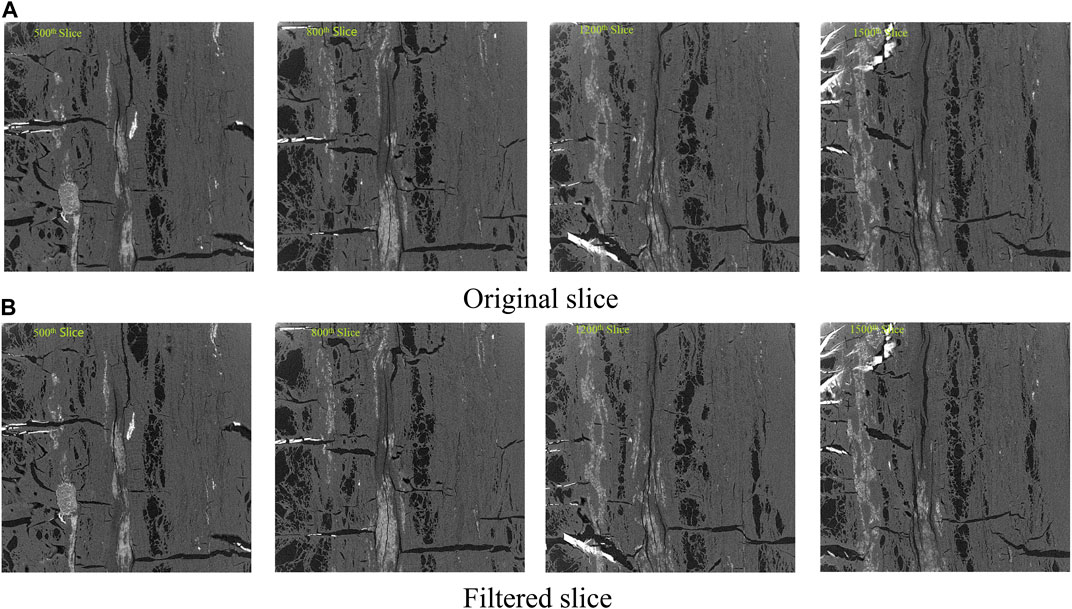
FIGURE 1. Original and filtered slice.
2.3.2 Three-dimensional visualization of tar-rich coal
After applying denoising to the original slices, not only can large-scale cracks be extracted but also the distribution of small pores can be captured. Consequently, based on the earlier threshold segmentation results, a three-dimensional reconstruction is performed. Many studies have presented three-dimensional visualizations of coal samples based on selected small regions for analysis (Ni et al., 2017; Fang et al., 2019). However, based on the analysis of CT data obtained from coal samples subjected to temperatures of 500°C, it has been ascertained that the distribution of pores and fractures cannot be adequately characterized within the confines of a single Region of Interest (ROI). Consequently, a supercomputing facility was harnessed to effectuate a comprehensive three-dimensional reconstruction of the entire coal specimen, thereby quantitatively delineating the post-pyrolysis state of the coal sample and the distribution profiles of various constituents. The result is shown in Figure 2.
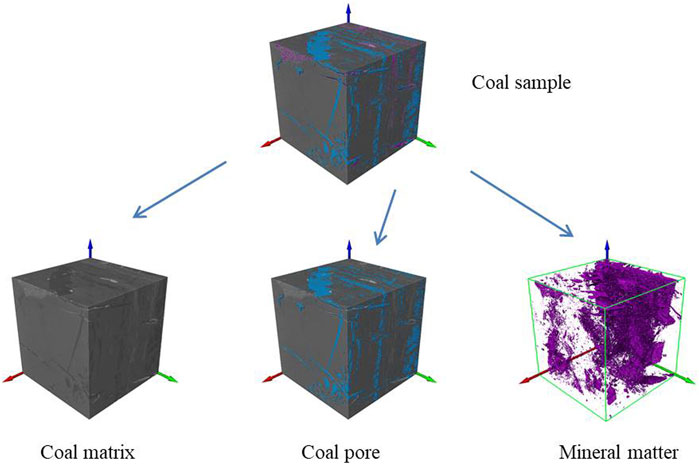
FIGURE 2. 3D visualization of coal sample.
Pores and cracks within the coal can be classified into connected pores and isolated pores. The axial algorithm functionality is employed for connectivity analysis of the threshold-segmented pores and cracks, resulting in the identification of connected and isolated pores. The outcomes of this analysis are depicted in Figure 3.
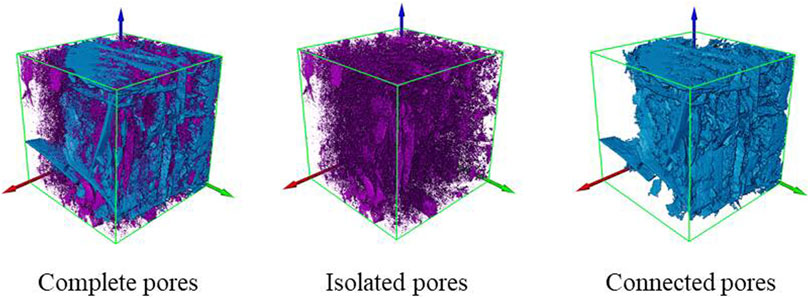
FIGURE 3. 3D visualization of coal pores.
3 Results and discussions
3.1 Pore distribution at high temperatures
Many researchers have conducted in-depth studies on coal pores and cracks using CT technology (Li et al., 2017; Ju, 2021). However, much of this research has primarily focused on the natural distribution of pores and cracks within coal structures at normal temperature. There has been limited exploration of the pore structure of coal at high-temperature pyrolysis. Yet, pore structure generated during high temperature pyrolysis in coal structures plays a crucial role in determining gas molecule adsorption capacity, water and liquid storage capabilities, as well as the significance of interconnected pores in the extraction of oil and gas.
In Figure 2, the blue material represents the pores and cracks within the coal structure, while the red color signifies minerals. Due to the high content of coal matrix (which is not shown in RGB color representation), the natural color of coal is displayed in black using the CT processing software. In Figure 3, RGB colors are employed to represent connected pores and isolated pores, providing a more comprehensive visualization of the distribution of pore and crack structures after high temperatures.
From Figures 2, 3, it is evident that the pore and crack structure of coal after high temperatures pyrolysis exhibits a large-scale elongated distribution, with some areas displaying extensive interconnected patterns. Additionally, it is clear that isolated pores and cracks are not distributed in a punctate manner; instead, they still maintain a larger-scale distribution. This contrasts with findings from other studies (Li et al., 2017; Wang et al., 2019). To gain a deeper understanding of the distribution of pores and cracks, algorithmic statistics were performed on the volumes of connected pores and isolated pores, as summarized in Table 2.

TABLE 2. Distribution of pore content in tar-rich coal.
The table clearly indicates that the porosity of coal is over 14%, with connected pores accounting for 12.3% of the total porosity, making up a significant proportion of 86.67%. This contrasts with other studies where the distribution of pores at room temperature CT coal structures mostly falls within 8% or lower. This difference highlights that the pyrolysis and volatilization of organic matter within coal at high temperatures lead to a rapid increase in coal porosity. Furthermore, it is worth noting that the distribution proportion of isolated pores is relatively low, accounting for only 1.9% of the entire coal sample. This suggests that at high temperatures pyrolysis, a portion of the organic matter in coal volatilizes and transforms into interconnected pores. Given that natural pores already exist in coal, these natural pores also gradually transform into interconnected pores at elevated temperatures.
3.2 Pore characterisation
3.2.1 REV selection
To further refine the characterization of pore structures in tar-rich coal after temperature pyrolysis, it is essential to quantitatively analyze the relevant geometric parameters of the pores, such as width, equivalent diameter, and shape factor. Therefore, the concept of the Representative Elementary Volume (REV) needs to be employed to capture the intrinsic features of the entire coal sample.
As discussed earlier, since the CT images are derived from coal samples at 500°C, the pore distribution may not necessarily follow a specific statistical probability distribution as seen in coal structures at room temperature. Through repeated attempts at pore data analysis, it is been challenging to extract a single effective REV that can represent the entire volume. In Figure 1, from various CT slices, it is evident that the pore structure of tar-rich coal does not exhibit a random distribution but rather shows aggregation and concentration patterns. On the left side of the slices, elongated and elliptical pores cluster together to form larger-scale pores; however, across different slices, there’s a longitudinal anisotropy, and no consistent top-to-bottom interconnected distribution is observed. On the right side of the slices, a large-scale interconnected pore distribution can be observed, showing isotropy in the vertical direction as well as the XY plane, indicating that the pore distribution not only spans the XY plane but also extends vertically. This may be due to the pyrolysis of organic matter in this region at 500°C, resulting in a large-scale interconnected pore distribution.
Considering the pore distribution characteristics of the coal sample at high temperatures, the slice images are divided into two larger regions: the left and right sides. Region of Interest (ROI) are then selected for each region, followed by the extraction of Representative Elementary Volume (REV) to characterize these differences. For the selection of the two ROI, we chose the pore aggregation region on the left side and the interconnected pore region on the right side, each using voxel-sized cubic volumes for pore volume calculations (increasing by 10 voxels each time). Ultimately, it was found that the pore volume stabilizes when the voxel count reaches 240 voxels for the left region and 270 voxels for the right region. To facilitate comparison, representative cubic volumes of voxel-sized ROIs were chosen for both sides, labeled as REV-1 (left) and REV-2 (right). The three-dimensional representation of these results can be seen in Figure 4.
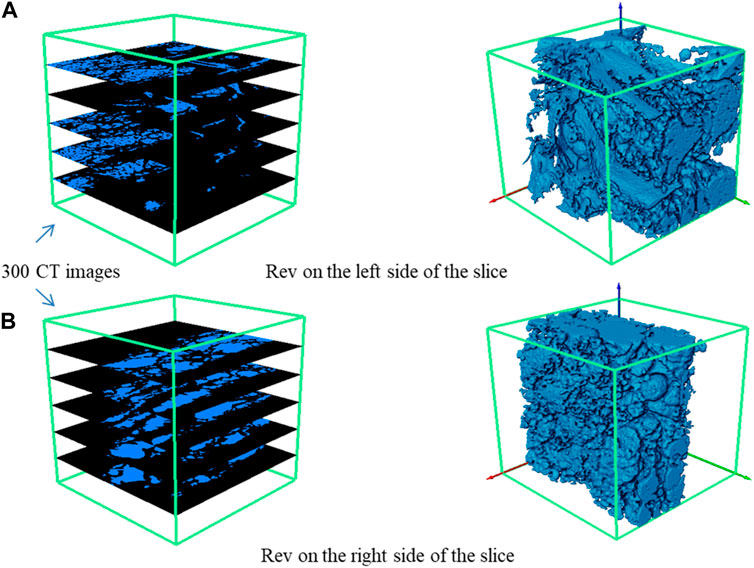
FIGURE 4. REV visualization. (A) Rev on the left side of the slice. (B) Rev on the right side of the slice.
3.2.2 Geometrical characterisation of pores
Based on the previous discussions and the selection of two representative REV locations, in order to better characterize the pore characteristics of the entire coal structure after high temperatures pyrolysis, pore geometric parameters were introduced in the post-processing software of CT images. The introduced geometric parameters include pore length, width, equivalent diameter, and surface area. Pore length and equivalent diameter play a crucial role in fluid transport and permeability within the coal; pore width affects gas adsorption capacity, while different surface areas are closely related to gas storage capacity. The characterization of these parameters contributes to a deeper understanding of pore changes in tar-rich coal at high temperatures. The frequency histogram results of the geometric parameters are shown in Figure 5. The formula for the equivalent diameter is expressed as depicted in Eq. 1.
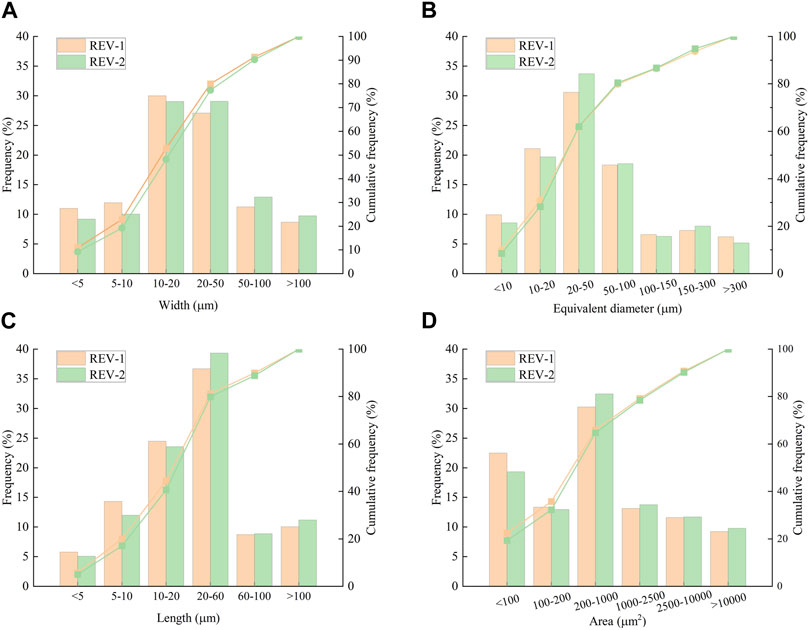
FIGURE 5. Frequency histogram of pore geometry parameters. (A) Frequency histogram of pore width in REV region; (B) Frequency histogram of pore equivalent diameter in REV region; (C) Frequency histogram of pore length in REV region; (D) Frequency histogram of pore area in REV region.
Where,
As observed in Figure 5, the distribution of geometric parameters for pores shows a noticeable change in scale compared to previous studies on coal pore structures at normal temperatures (Ju et al., 2018; Shi et al., 2018; Fang et al., 2019). This aligns with the conclusions drawn from the earlier discussions that the thermal decomposition of organic matter in tar-rich coal at 500°C leads to an enlargement of pores in terms of scale.
3.3 The establishment of the pore network model
3.3.1 PNM
In order to further quantitatively describe the spatial connectivity characteristics of the pore network structure, the introduction of a Pore Network Model (PNM) is utilized to analyze the flow characteristics of tar-rich coal. The PNM is a tool used to study fluid flow and transport in porous media at the microscale. This model equivalently represents the pore network in porous media as a network structure composed of interconnected pores and throats. In this representation, the connections between pores are depicted as sticks, representing the throats, while the largest sphere volume within a pore structure is represented by a sphere. The Pore Network Model allows for the quantitative characterization of structural parameters involved in the flow within interconnected pores. These parameters encompass geometric attributes of the participating pores, microscopic properties of the throats, and coordination numbers. The coordination number represents the number of throats connected to a pore node. A higher coordination number signifies more pathways for fluid flow, leading to a more complex flow path and better connectivity within the pore network. This metric serves as a powerful indicator to measure the connectivity of the pore and fracture network.
In accordance with the preceding discussions, considering the non-uniform distribution of pore structures in the coal sample at high temperature pyrolysis, we have selected the two aforementioned Regions of Interest (REV) to perform Pore Network Model (PNM) analysis. This enables us to quantitatively characterize the spatial connectivity characteristics. The resulting PNM models, as depicted in Figure 6, reveal that the REV-1 model comprises 40 pores and 57 throats, while the REV-2 model includes 59 pores and 191 throats. In the figure, the diameter of the rod-like structures represents the size of the throats, while the size of the spheres represents the volume of the pores. The variation in the throats and the sizes of the pore spheres are depicted using different RGB colors.
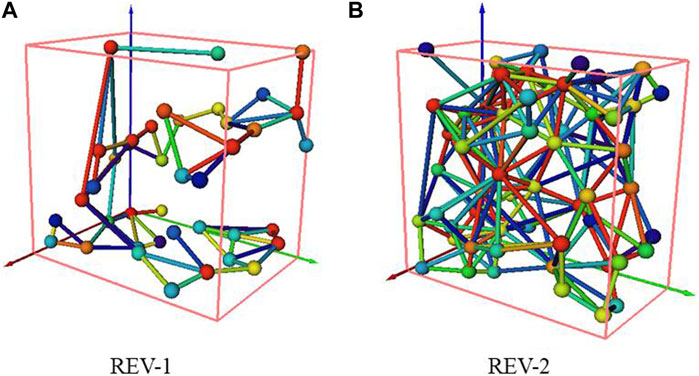
FIGURE 6. Pore network model. Note: For the comparison of REV-1 and. REV-2, a uniform range of colormap was chosen for the RGB color characterization of the throat and pore sizes in the PNM model.
3.3.2 Parametric analysis of the PNM
A statistical analysis of the lengths, equivalent diameters, and coordination numbers of throats in the Pore Network Model (PNM) is presented in Figure 7. Noticeable differences in coordination numbers between the two designated REV areas within the PNM permeability models are observed (Figures 7A, D). In the REV-1 area, coordination numbers predominantly fall within the range of 1–5, with a prominent concentration at a coordination number of 3. Notably, there are no interconnected pore with coordination numbers exceeding 6. Conversely, the coordination number histogram for the REV-2 area exhibits a bimodal distribution. The first peak occurs at a coordination number of 4, with the coordination number range primarily spanning from 1 to 5. The second peak appears at a coordination number of 8, covering a broader range from 6 to 17. Moreover, the cumulative frequency of coordination numbers exceeding 6 reaches 50%. It is important to highlight that the most intense temperature range for the pyrolysis of tar-rich coal generally falls between 450°C and 500°C. Beyond this range, organic matter within the coal gradually begins to volatilize, leading to the development of coal’s pore structure. The coal sample utilized in this study was subjected to a temperature of 500°C, placing the pore network structure in a transitional phase from development to more advanced stages.
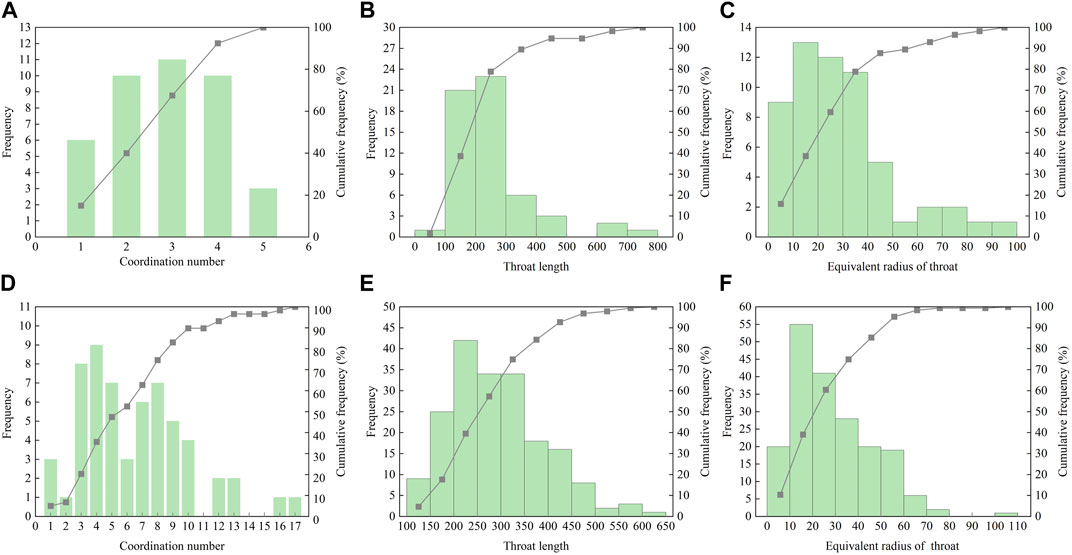
FIGURE 7. Histograms of PNM parameters. (A–C) for REV-1; (D–F) for REV-2.
Therefore, it can be reasonably inferred that the pore network structure in the REV-1 area is likely in a developmental state, resulting in lower coordination numbers and poor connectivity. On the other hand, the REV-2 area is in a phase of pore network development, with some pores still not fully matured within the region. This leads to a concentration of coordination numbers within the range of 1–5, consistent with the recently developed REV-1 region. Consequently, the bimodal structure of the coordination number histogram in the REV-2 area emerges. However, the cumulative frequency of coordination numbers exceeding 6 in the REV-2 area surpasses 50%. This observation suggests that despite the differing stages of pore structure development between the two REV regions, the REV-2 area exhibits notably improved connectivity due to a significant proportion of pores with coordination numbers exceeding 6.
However, it should be noted that an examination of Figures 7B, C, E, F reveals a relatively close distribution range for equivalent throat diameters and throat lengths, with similar shapes in the cumulative frequency curves. The primary divergence between the two lies in the frequency of parameter occurrence and the uniformity of interval distributions, where the frequencies differ by approximately a factor of two.
4 Conclusion
In this study, X-ray computed tomography (CT) scanning was employed to examine the 500°C pyrolyzed tar-rich coal. A total of 1755 slices were obtained, with a sample dimension of. Utilizing a threshold segmentation algorithm, the two-dimensional grayscale images were processed to extract the coal matrix, mineral components, and coal pores for subsequent three-dimensional reconstruction. Geometric parameters of the pores were extracted, and an Equivalent Pore Network Model (PNM) was employed to further investigate the permeability characteristics of the tar-rich coal after high-temperature pyrolysis. Subsequently, relevant parameter analyses were performed.
(1) The samples used in this study were tar-rich coal after pyrolyzed at 500°C. Based on observations from two-dimensional CT slices, the pores of the high-temperature pyrolysis in tar-rich coal exhibit non-uniformity, a distribution skewed towards larger scales, and a pronounced connectivity concentration in spatial distribution. The pore volume fraction was determined to be 14.24%.
(2) The medial axis algorithm was employed for pore extraction, resulting in the identification and subsequent three-dimensional reconstruction of connected and isolated pores. Among these, connected pores accounted for 12.34% of the total pore volume, while mineral components comprised 1.90%. Considering the entire pore structure, connected pores contributed to 86.67% of the pore volume. Due to the non-uniform and clustered distribution of pores in the tar-rich coal after high-temperature pyrolysis, two Representative Elementary Volume (REV) units were selected: REV-1 and REV-2. Despite a significant disparity in pore volume fractions between these two REV units, their geometric parameter frequency distributions exhibited a high degree of similarity. The geometric parameters of the pores were generally larger in scale compared to those at room temperature. Most pore widths were concentrated within the range of 10–50 μm, with a peak range of pore lengths at 20–60 μm, accounting for over 40% of the distribution. Similarly, the peak range of pore surface areas was 200–1,000 μm2, contributing to over 40% of the distribution.
(3) Based on the analysis of the equivalent pore network models for the two REV regions, the pore network structure of REV-1 was found to be in the developmental stage, with coordination numbers distributed within the range of 1–5, and no pores with coordination numbers exceeding 6, indicating poor connectivity. The pore network structure of REV-2 was in a progressively developing stage, with a bimodal distribution of coordination numbers. The first peak was in the range of 1–5, and the second peak was in the range of 5–17, with a peak coordination number of 8. Pores with coordination numbers exceeding 6 accounted for more than 50% of all pores, with nearly 10% of pores having coordination numbers exceeding 10. The frequency distribution of pore parameters (equivalent diameter and pore length) in the two REV regions exhibited relatively similar ranges, with the frequency difference approximately 2 times.
This study conducted an in-depth investigation into the pore distribution characteristics and permeability properties of tar-rich coal after high-temperature pyrolysis. This enhances our understanding of the evolution of pore structure in tar-rich coal under high-temperature pyrolysis. Furthermore, it will serve as a reference for optimizing the in-situ pyrolysis process of tar-rich coal to improve the efficiency of oil and gas extraction.
Data availability statement
The original contributions presented in the study are included in the article/supplementary material, further inquiries can be directed to the corresponding author.
Author contributions
FY: Conceptualization, Data curation, Funding acquisition, Supervision, Writing–original draft. PJ: Conceptualization, Methodology, Supervision, Writing–review and editing. ZD: Funding acquisition, Supervision, Writing–review and editing. ZC: Data curation, Software, Writing–original draft. ZW: Data curation, Software, Writing–original draft.
Funding
The author(s) declare financial support was received for the research, authorship, and/or publication of this article. This work was supported by the Key Scientific Research Project of Shaanxi Coal Geology (SMDZ-2020ZD-1); Shaanxi Province Young Science and Technology Nova Project (2022KJXX-24); Key R&D program of Shaanxi Province (2022GY-155); the Qinchuangyuan Scientist and Engineer Team Project of Shaanxi Province.
Conflict of interest
Authors FY, PJ, ZD and ZW were employed by the company Shaanxi Coal Geology Group Co., Ltd.
The remaining author declares that the research was conducted in the absence of any commercial or financial relationships that could be construed as a potential conflict of interest.
Publisher’s note
All claims expressed in this article are solely those of the authors and do not necessarily represent those of their affiliated organizations, or those of the publisher, the editors and the reviewers. Any product that may be evaluated in this article, or claim that may be made by its manufacturer, is not guaranteed or endorsed by the publisher.
References
Basran Parminder, S., Robertson, A., and Wells, D. (2011). CT image artifacts from brachytherapy seed implants: a postprocessing 3D adaptive median filter. Med. Phys. 38 (2), 712–718. doi:10.1118/1.3539648
Capuano, L. (2018). International energy outlook 2018 (IEO2018). Washington, DC, USA 2018: US Energy Information Administration EIA, 21.
Cheng, Q. (2019). “Technological innovation leads energy transformation,” in China petrochemical news (Beijing, China: Sinopec Group), 5. (in Chinese).
Fan, N., Wang, J., Deng, C., Fan, Y., Wang, T., and Guo, X. (2020). Quantitative characterization of coal microstructure and visualization seepage of macropores using CT-based 3D reconstruction. J. Nat. Gas Sci. Eng. 81, 103384. doi:10.1016/j.jngse.2020.103384
Fang, H.-H., Sang, S.-X., and Liu, S.-Qi (2020). Three-dimensional spatial structure of the macro-pores and flow simulation in anthracite coal based on X-ray μ-CT scanning data. Petroleum Sci. 17, 1221–1236. doi:10.1007/s12182-020-00485-3
Giffin, S., Littke, R., Klaver, J., and Urai, J. (2013). Application of BIB–SEM technology to characterize macropore morphology in coal. Int. J. Coal Geol. 114, 85–95. doi:10.1016/j.coal.2013.02.009
Golab, A., Ward, C. R., Permana, A., Lennox, P., and Botha, P. (2013). High-resolution three-dimensional imaging of coal using microfocus X-ray computed tomography, with special reference to modes of mineral occurrence. Int. J. coal Geol. 113, 97–108. doi:10.1016/j.coal.2012.04.011
Hodot, B. B. (1966). Outburst of coal and coalbed gas (Chinese Translation). Beijing, China: China Coal Industry Press, 318.
Jiang, B., Sun, Z., and Liu, M. (2010). China's energy development strategy under the low-carbon economy. Energy 35 (11), 4257–4264. doi:10.1016/j.energy.2009.12.040
Jing, Yu, Armstrong, R. T., Ramandi, H. L., and Mostaghimi, P. (2017). Topological characterization of fractured coal. J. Geophys. Res. solid earth 122 (12), 9849–9861. doi:10.1002/2017jb014667
Ju, Y., Xi, C., Zhang, Y., Mao, L., Gao, F., and Xie, H. (2018). Laboratory in situ CT observation of the evolution of 3D fracture networks in coal subjected to confining pressures and axial compressive loads: a novel approach. Rock Mech. Rock Eng. 51, 3361–3375. doi:10.1007/s00603-018-1459-4
Ju, Y., Zhu, Y., Zhou, H., and Xie, H. (2021). Microwave pyrolysis and its applications to the in situ recovery and conversion of oil from tar-rich coal: an overview on fundamentals, methods, and challenges. Energy Rep. 7 (2021), 523–536. doi:10.1016/j.egyr.2021.01.021
Li, Q. (2021). The view of technological innovation in coal industry under the vision of carbon neutralization. Int. J. Coal Sci. Technol. 8 (6), 1197–1207. doi:10.1007/s40789-021-00458-w
Li, Z., Liu, D., Cai, Y., Ranjith, P., and Yao, Y. (2017). Multi-scale quantitative characterization of 3-D pore-fracture networks in bituminous and anthracite coals using FIB-SEM tomography and X-ray μ-CT. Fuel 209, 43–53. doi:10.1016/j.fuel.2017.07.088
Li, Z., Liu, D., Cai, Y., Yao, Y., and Wang, H. (2015). Pore structure and compressibility of coal matrix with elevated temperatures by mercury intrusion porosimetry. Energy Explor. Exploitation 33 (6), 809–826. doi:10.1260/0144-5987.33.6.809
Liu, S., Li, X., Wang, D., Wu, M., Yin, G., and Li, M. (2020). Mechanical and acoustic emission characteristics of coal at temperature impact. Nat. Resour. Res. 29, 1755–1772. doi:10.1007/s11053-019-09562-w
Liu, S., Sang, S., Wang, G., Ma, J., Wang, X., Wang, W., et al. (2017). FIB-SEM and X-ray CT characterization of interconnected pores in high-rank coal formed from regional metamorphism. J. Petroleum Sci. Eng. 148, 21–31. doi:10.1016/j.petrol.2016.10.006
Mastalerz, M., Drobniak, A., Strąpoć, D., Solano Acosta, W., and Rupp, J. (2008). Variations in pore characteristics in high volatile bituminous coals: implications for coal bed gas content. Int. J. Coal Geol. 76 (3), 205–216. doi:10.1016/j.coal.2008.07.006
Ni, X., Miao, J., Lv, R., and Lin, X. (2017). Quantitative 3D spatial characterization and flow simulation of coal macropores based on μCT technology. Fuel 200, 199–207. doi:10.1016/j.fuel.2017.03.068
Nie, B., Liu, X., Yang, L., Meng, J., and Li, X. (2015). Pore structure characterization of different rank coals using gas adsorption and scanning electron microscopy. Fuel 158, 908–917. doi:10.1016/j.fuel.2015.06.050
Okoye-Chine, , George, C., Shiba, N., Rashama, C., Ugwu, S. N., Onyeaka, H., et al. (2022). Conversion of carbon dioxide into fuels—a review. J. CO2 Util. 62 (2022), 102099. doi:10.1016/j.jcou.2022.102099
Shi, X., Pan, J., Hou, Q., Jin, Y., Wang, Z., Niu, Q., et al. (2018). Micrometer-scale fractures in coal related to coal rank based on micro-CT scanning and fractal theory. Fuel 212, 162–172. doi:10.1016/j.fuel.2017.09.115
Sun, L., Zhang, C., Wang, G., Huang, Q., and Shi, Q. (2022). Research on the evolution of pore and fracture structures during spontaneous combustion of coal based on CT 3D reconstruction. Energy 260 (2022), 125033. doi:10.1016/j.energy.2022.125033
Wang, G., Qin, X., Han, D., and Liu, Z. (2021). Study on seepage and deformation characteristics of coal microstructure by 3D reconstruction of CT images at high temperatures. Int. J. Min. Sci. Technol. 31 (2), 175–185. doi:10.1016/j.ijmst.2020.11.003
Wang, G., Shen, J., Liu, S., Jiang, C., and Qin, X., Three-dimensional modeling and analysis of macro-pore structure of coal using combined X-ray CT imaging and fractal theory. Int. J. Rock Mech. Min. Sci., 2019, 123: 104082, doi:10.1016/j.ijrmms.2019.104082
Wolde-Rufael, , and Yemane, (2010). Coal consumption and economic growth revisited. Appl. Energy 87 (1), 160–167. doi:10.1016/j.apenergy.2009.05.001
Xin, F., Xu, H., Tang, D., Yang, J., Chen, Y., Cao, L., et al. (2019). Pore structure evolution of low-rank coal in China. Int. J. Coal Geol. 205, 126–139. doi:10.1016/j.coal.2019.02.013
Yao, Y., Liu, D., Tang, D., Tang, S., and Huang, W. (2008). Fractal characterization of adsorption-pores of coals from North China: an investigation on CH4 adsorption capacity of coals. Int. J. Coal Geol. 73 (1), 27–42. doi:10.1016/j.coal.2007.07.003
Zhang, Y., Wang, Y., Cai, L., Yao, C., Gao, S., Li, C. Z., et al. (2013). Dual bed pyrolysis gasification of coal: process analysis and pilot test. Fuel 112, 624–634. doi:10.1016/j.fuel.2012.01.038
Keywords: tar-rich coal, high temperature pyrolysis, pore structure, equivalent Pore Network Model, coordination number
Citation: Yang F, Jiang P, Duan Z, Cheng Z and Wang Z (2023) Quantitative characterization and analysis of pore-fractures in tar-rich coal under high-temperature pyrolysis based on micro-CT imaging. Front. Earth Sci. 11:1277520. doi: 10.3389/feart.2023.1277520
Received: 14 August 2023; Accepted: 28 November 2023;
Published: 29 December 2023.
Edited by:
Yingfeng Sun, University of Science and Technology Beijing, ChinaReviewed by:
Chang’An Wang, Xi’an Jiaotong University, ChinaZhiqiang Wu, Xi’an Jiaotong University, China
Copyright © 2023 Yang, Jiang, Duan, Cheng and Wang. This is an open-access article distributed under the terms of the Creative Commons Attribution License (CC BY). The use, distribution or reproduction in other forums is permitted, provided the original author(s) and the copyright owner(s) are credited and that the original publication in this journal is cited, in accordance with accepted academic practice. No use, distribution or reproduction is permitted which does not comply with these terms.
*Correspondence: Pengfei Jiang, amlhbmdwZkB4dXN0LmVkdS5jbg==