 Yi Du
Yi Du Chengfei Wu
 Chenghu Wang
 Guiqiang Yuan3*
 Jie Liao
- 1School of Earth Sciences and Engineering, Sun Yat-sen University, Zhuhai, China
- 2National Institute of Natural Hazards, Ministry of Emergency Management of China, Beijing, China
- 3Fankou Lead-Zinc Mine, Shaoguan, China
The stress background and rock fractures are essential factors affecting the stability of mines. In order to better understand the in situ stress background and rock fractures in the Guangdong Fankou Mine, we use ultrasonic borehole television scanning to measure rock fractures. The results indicate that rock fractures are intensively distributed at depths of −360 m to −450 m below the surface, suggesting the effect of intensive mining activities. The present maximum horizontal principal stress direction is NWW, which is consistent with the regional tectonic stress field direction. Systematic measurement of rock fractures is fundamental for further three-dimensional geological modeling and is significant for mining engineering.
1 Introduction
The various fractures in a rock mass and their spatial distribution and occurrence form the structure of the rock mass. Structural planes are the product of the tectonic movement of rocks in a long geological period. Many studies have shown that their formation relationship and spatial combination often have a specific regularity within a certain geological period. The specific manifestations are both discrete, and they also have the characteristics of group development. The development degree and scale of each dominant fracture are often related to tectonic movement.
The Fankou mining area is located on the northern edge of the Qujiang structural basin and is composed of sedimentary rocks. The Cambrian Bacun Group in the north and the Early Tertiary Danxia Group in the south are distributed over a large area from east to west. The Early Jurassic strata in the west and the Middle Jurassic Maziping Group in the east are exposed in a narrow strip extending from north to south, making the Fankou area a rectangular region centered on Dongtang and composed of Upper Paleozoic strata (Figure 1A). The Renhua Danxia Mountain near the Fankou Lead-Zinc Mine is a special landform formed by the development of red sandstone and sandy conglomerate from the Cretaceous to the Paleogene, and it is also the naming place of the Danxia landform (Li et al., 1990).
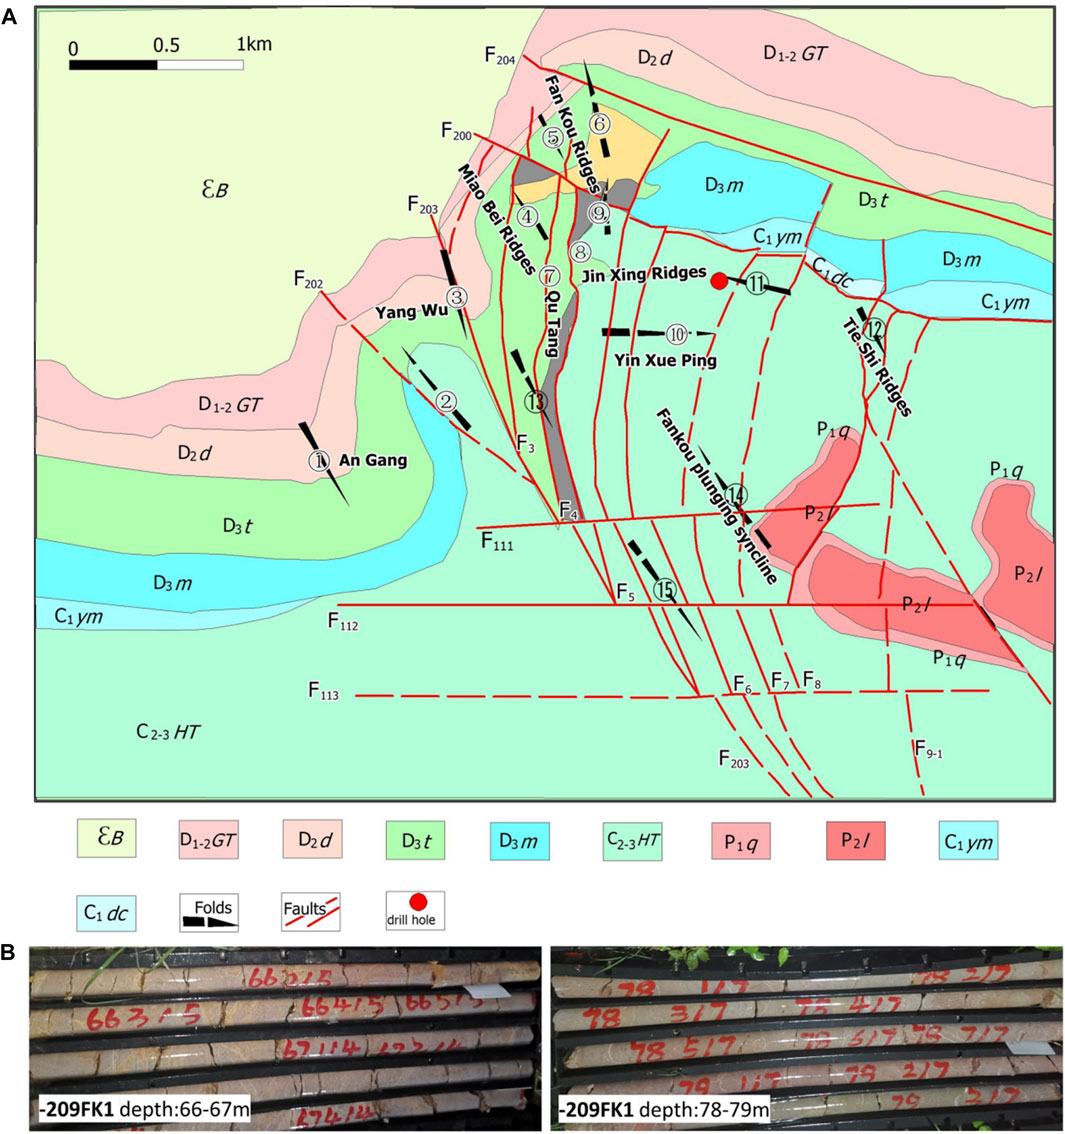
FIGURE 1. The tectonic setting around the Fankou Mine Area and the drill hole −209 FK1 core diagram. (A) Tectonic setting around the Fankou Mine Area (ϵb: Cambrian Bacun Group; D1-2GT: Devonian Laurel Group; D2d: Devonian Donggangling Formation; D3t: Devonian Tianziling Formation; D3m: Devonian Hat Peak Formation; C2-3HT: Carboniferous Hutian Group; P1q: Permian Qixia Formation; P2l: Permian Longtan Formation; C1ym: Carboniferous Gongao Formation; C1dc: Carboniferous Ceshui Section; Drill hole: –209FK1). (B) The drill hole −209 FK1 core diagram.
Traditional mining and geotechnical engineering design and construction are often carried out based on experience. When excavation activities are carried out on a small scale and close to the surface, the method of analogy by experience is often effective. However, as the scale of the excavation continues to expand and develop toward deeper depths, especially with the development of large underground mines, dams, tunnels, and high and steep slopes, the method of analogy by experience is increasingly losing its function. Excavation construction based on experience often leads to various instabilities, collapses, and/or destruction of rock engineering, making normal operations impossible, and it can lead to serious engineering accidents, causing major property losses and casualties.
The mining depth of the Fankou Mine ranges from +50 m to −750 m, and the average elevation of the mining area is +98 m. As the mining has developed toward deeper depths, due to changes in the structural environment, the mining operation environment has undergone tremendous changes, facing a series of problems such as rock bursts, collapses, roof falls, geothermal, and roadway support (Li et al., 1990). In particular, in the deep part of the mining area, as the in situ stress gradually increases, the rock strata develop, the ground pressure activity becomes more and more obvious, and the underground support engineering volume continues to increase. Therefore, how to address the complex geological mechanics conditions of deep mining and the various technical problems involved in mining is a major issue (Chen et al., 1990; Martin, 1990; Chen et al., 1998).
2 Geologic background
2.1 Tectonic setting
The Fankou lead–Zinc ore deposit is located in the middle section of Nanling, the eastern side of the Guangxi–Hunan–Guangdong depression in the South China fold system, and the tilting end of the Fankou Plunging Syncline on the northern edge of the Qujiang–Renhua Tectonic Basin in northern Guangdong, and the main outcrops in the basin are composed of Upper Paleozoic, Mesozoic, and Cenozoic strata. The tectonics are complex, with alternating uplifts and depressions, and coastal facies, shallow sea facies clastic rock construction, and carbonate rock construction are widely developed (Luo et al., 2013).
2.2 Stratigraphy and lithology of the Fankou Mine
The stratigraphy of the outcrops in the ore district from bottom to top is described below.
Cambrian Bacun Group (ϵbc): It is composed of epimetamorphic interlayers of sandstones and shales, with a thickness of more than 1500 m.
Middle Devonian Guitou Group (D2gt): It consists of a suite of terrestrial-littoral facies terrigenous clastic formations, which represents the bottom of a transgressive series. The bottom is composed of conglomerate; the lower part is composed of sandy conglomerate and quartzose sandstone intercalated with siltstones; and the upper part is composed of purple-colored silty shales intercalated with siltstone, with a thickness of 120–130 m. Regionally, the group unconformably overlies the Cambrian Bacun Group.
Middle Devonian Donggangling Stage (D2d): It conformably covers the underlying strata. This stage is divided into two substages based on the lithology. The lower substage (D2da, corresponding to the Qizhiqiao Fm.) consists of deep grey muddy silty shales, as well as siltstones intercalated with dolomites, with a thickness of approximately 50 m. The upper substage (D2db, corresponding to the Dongping Fm.) consists of deep grey limestones and dolomitic limestones, which are characterized by the appearance of stromatolithic limestones in the middle and laminated dolomitic siltstones in the top, with a thickness of approximately 70–120 m.
Upper Devonian Tianziling Fm. (D3t): It conformably covers the underlying strata. This formation can be divided into three subformations based on the lithology. The lower subformation (D3ta) consists of deep grey oolithic bioclastic limestones intercalated with nodular and banded limestone and thinly bedded marl, medium-to thickly bedded oolitic limestone, which are marked by the appearance of stromatoporoid limestone in the top and spheric stromatoporoid limestone in the bottom, with a thickness of approximately 90–115 m. The middle subformation (D3tb) consists of greyish-black banded and nodular limestone, which is marked by the presence of oncolite limestone in the bottom and dotted to massive pyrite-bearing banded limestones in the middle, with a thickness of approximately 110–150 m. The upper subformation (D3tc) consists of deep grey thickly bedded granophyric limestones and granophyric banded and nodular limestones, which are marked by the intercalation of marl, with a thickness of approximately 50–105 m.
Upper Devonian Maozifeng Fm. (D3m): It conformably covers the underlying strata. The formation can be divided into two parts. The lower part consists of banded siltstones and quartzose sandstones intercalated with thinly bedded dolomites. The upper part consists of silty shales and muddy shales intercalated with siltstones, with a thickness of approximately 110–140 m. This formation completely outcrops on the east and west sides of the ore district but is mostly missing within the mining area.
Lower Carboniferous Series (C1): It unconformably covers the underlying strata. The lower part consists of dolomitic limestones, and the upper part consist of light grey silty shales intercalated with sandstones. The stratum is completely developed in the eastern part of the ore district, but it thins in the mining area, where its thickness is only 10–17 m, and it is even missing locally. In the western part of the ore district, the series is completely missing.
Middle-Upper Carboniferous Series Hutian Group (C2+3ht): The lower part consists of massive to thickly bedded dolomites. The upper part consists of thickly bedded dolomitic limestones or limestones, with a thickness of approximately 400 m. This group slightly unconformably covers the underlying strata. The overlap of the stratum on the Devonian System can be seen in the ore district.
Permian System (P): The lower series consists of limestones. The upper series consists of sandy shales and siliceous shales. It belongs to the coal measures strata and conformably covers the underlying strata. This stratum is only present in the southeast corner of the ore district.
The ore-bearing layer in the mining area is mainly composed of shallow sea facies carbonate rock sedimentation. The ore-bearing layer is mainly composed of the strata of the Middle Devonian Donggangling Group to the base of the Middle-Upper Carboniferous Hutian Group. The main ore-bearing strata are the Devonian strata, followed by the Carboniferous strata. The periphery of the Fankou mining area is a product of Caledonian, Hercynian, Indosinian, and Yanshanian magmatic activities. In particular, the Yanshanian magmatic intrusion activity was very strong and formed large-scale magmatic rock belts near the northern and peripheral areas of the Fankou mining area in a nearly east–west direction. The magmatic activity in the mining area was weak (Yuan et al., 2019).
The area contains intense folds and well-developed faults, which control the production of the large deposits in the mining area. The directions of the tectonic lines include east–west, northeast to north–northeast, north–south, and northwest. Nearly north–south and east–west trending arc faults are developed locally. The structure of the mining area is the dominant factor controlling the ore. These structures not only control the output space of the ore body but also have a decisive effect on the formation of the ore deposit (Figure 1B) (Luo et al., 2018; Yuan et al., 2019).
2.3 Fault distribution in the Fankou Mine
The fault structures mainly trend north–northeast, are generally inclined to the east, and have dip angles of 60°–87°. The maximum fault displacement can reach 400 m. The faults have undergone multiple periods of activity, and a large amount of post-mineralization breccia has been generated. The ore body is controlled by the strata and faults, and the morphology of the main and secondary ore bodies in the mineralization complex is mostly vesicular, irregular lens-shaped, and pseudo-layered, with a few are irregular vein-shaped areas. In the profile, multiple layers of ore often form irregular feather-like structures through the north–eastward and north–northeastward main faults (Yuan, 2016).
The strike-slip reverse fault in the mining area formed in the Indosinian and Early Yanshanian; and the strike-slip normal fault was formed in the Late Yanshanian (the same group of faults cut through the Middle Jurassic strata west of Renhua). Some of the major faults may be the result of the reactivation of previous structures. These two groups of faults formed before the mineralization (there are ore bodies in the F4 and F12 fault zones), but they were reactivated later. In addition, in the tunnel, there are often north–northwest to northwest trending strike-slip faults, which are inclined to the east or west and have steep dip angles. The fault displacements (1–6 m) and scales are small, they cut through the ore body, and they are post-mineralization faults. At the contacts between the different lithologies, interlayer misalignment or small-scale interlayer fracture zones are often observed.
Shiling is the main mining area in the Fankou Lead–Zinc Mine. In the deep section of Shiling, fault structures are developed, among which the most important structure is F3. F3 is a pressure-twisting fault structure, and the accompanying small secondary structures are shear-type structures. The main fault parameters of the mine area are listed in Table 1.
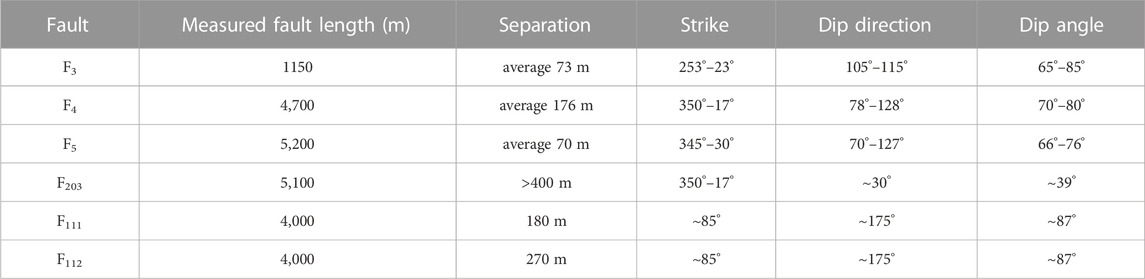
TABLE 1. The main fault parameters of the mine area.
Fault F3 is a right-lateral parallel reverse fault, and it mainly controls the ore in this block. It strikes 253°–23°, and dips 105°–115°, with dip angles of 65°–85°. The fracture zone is 0.1–2.5 m wide, and in some sections, it even exceeds 10 m. The fracture zone is filled with a large amount of ore rubble, surrounding rock rubble, and calcite rubble, which have different sizes, were squeezed to form tectonic lenses, cataclasite, and mylonite, are bonded by muddy material, with a poor bonding strength and intense foliation. Traction folds are often present in the upper and lower plate rock layers of the fault. In addition, there is a larger-scale branch structure in the lower plate of F3, which is compounded with fault F3 on the −650 m level. Its structural properties and dip and strike are similar to those of F3.
3 Methods
The information about the strata occurrence is an important technical parameter in engineering investigations. The development of downhole television imaging technology has provided a new development direction for extracting the occurrence information about rock formations. Ultrasonic television imaging logging uses high-frequency pulses to scan the wellbore in 360° to display the wellbore wall in all directions, and it provide information for achieve qualitative and quantitative interpretation (Wang Shuli et al., 2008). In engineering investigations, television imaging is used to determine the occurrence of structural planes of a rock mass (strike, inclination, and inclination angle of strata layers).
The testing uses the ABI40 integrated acoustic borehole imaging system developed by Mount Sopris in the United States. This system is a highly intelligent integrated logging system that combines various borehole measurement probes. A variety of borehole measurement probes, such as diameter–depth–inclination measurement probes and ultrasonic imaging probes, can be mounted on a single-core coaxial cable. It is suitable for small-diameter wellbore measurements, and the winch system is used to measure the borehole. The depth error range is ±5 cm per 100 m, which is at the leading level in China and abroad. The system can be divided into two parts: hardware (i.e., a winch, host control system, and acoustic TV probe) and software (i.e., system control software, probe control software, and WellCAD software for data interpretation and processing). The main instrument used for ultrasonic downhole television scanning is shown in Figure 2.
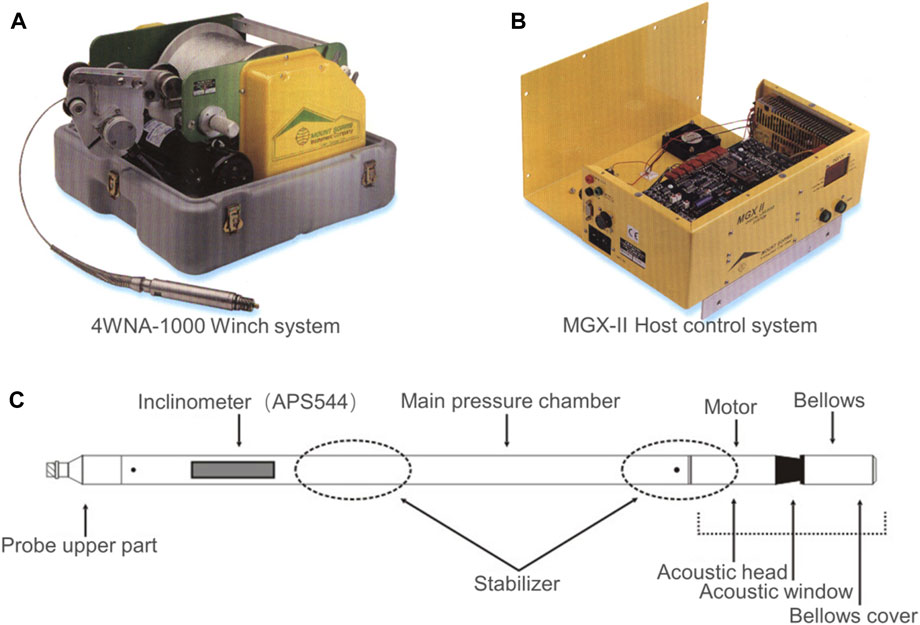
FIGURE 2. Framework of the ultrasonic downhole TV. (A) 4WNA-1000 winch system. (B) MGX-II host control system. (C) Schematic diagram of the structure of the ultrasonic downhole TV probe.
Borehole measurement is one of the primary methods of obtaining the current stress field. After core retrieval in a borehole, the structural stress concentration along the wellbore can cause rock mass fracturing and induce failure phenomena, which can reliably reveal the directions of one of the horizontal principal stresses (Zoback et al., 2003; Davatzes and Hickman, 2005). In shallow borehole stress environments, the tensile strength (T0) of the rocks is typically low, which often leads to the formation of tensional fractures in the borehole wall. Therefore, the direction of the stress field can be determined by accurately identifying induced fractures. One principal stress is assumed to be parallel to the axis of the vertical borehole, SV, and it is equal to the weight of the overburden (Hubbert and Willis, 1957). The formation of induced fractures is related to the rock strength, the directions of the horizontal principal stresses, and the magnitudes of the principal stresses. The relationship among these three factors is as follows:
where
The minimum value of
It is a tangential tensile stress (negative) when 0 >
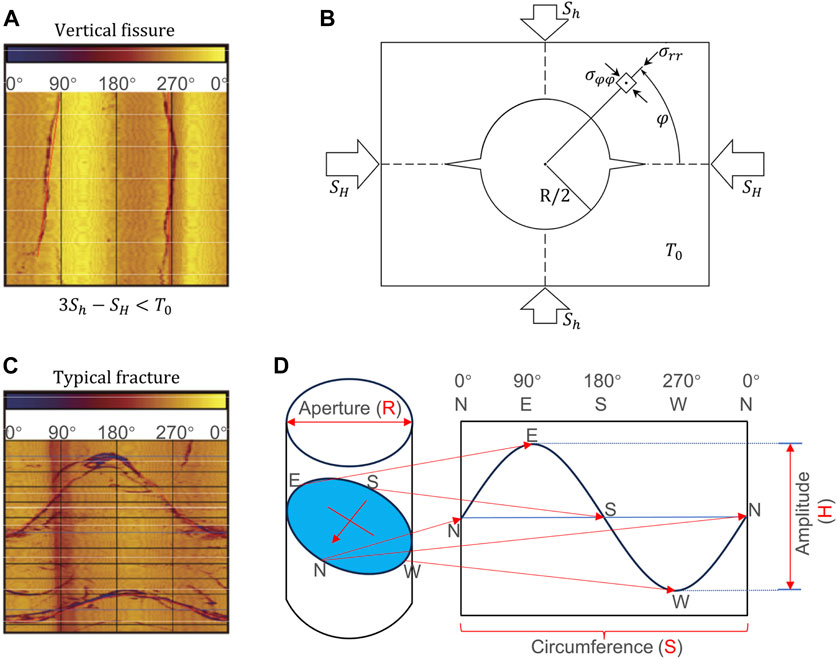
FIGURE 3. Schematic diagram of the downhole TV method and principle analysis diagram of the vertical induced fractures and typical structural fractures. (A) Geometry of hydraulic fracture visualized in a 2-D cut of a circular borehole. (B) Diagram of a typical vertical fissure. (C) Diagram of a typical inclined joint fracture. (D) Schematic diagram of logging fracture imaging and calculation.
From the perspective of the fracture formation factors, in addition to the induced fractures mentioned above, there are also natural structural fractures. Natural fractures often exhibit relatively complete sinusoidal curve profiles, while smaller fractures may exhibit partial sinusoidal curve profiles. Based on these sinusoidal curve profiles, the dip angle and dip direction of the fractures can be directly read.
The imaging log response is unwrapped along the true north direction, and the fracture imaging log exhibits a sinusoidal waveform. The dip direction of the fracture corresponds to the azimuth of the lowest point W. The wellbore diameter is calculated by dividing the circumference S by 2π, i.e., R = S/(2π). The dipping angle is determined by taking the arctangent of the sinusoidal waveform amplitude H divided by the wellbore diameter R, i.e., θ = arctan (R/H) (Figures 3C, D) (Yong et al., 1996).
4 Results
4.1 Determination of principal stress direction
The direction of the principal stress of the −209FK1 borehole was imaged using ultrasonic borehole television method. Four images acquired at various depths (i.e., 139.85–141.56 m, 196.4–198.07 m, 334.9–336.51 m, and 512.97–514.57 m) are shown in Figure 4. These images reveal the induced fractures surrounding the wall of the borehole. The curve shape is typical, indicating that the rock in the measured section is relatively complete and the logging test results are reliable. The ultrasonic drilling TV logging images show that the rupture surface is parallel to the axis of the borehole, and the determined directions of the maximum horizontal principal stress (SH) are N77°W, N83°W, N88°W, and N60°W from shallow to deep. Its dominant position is N77°W.
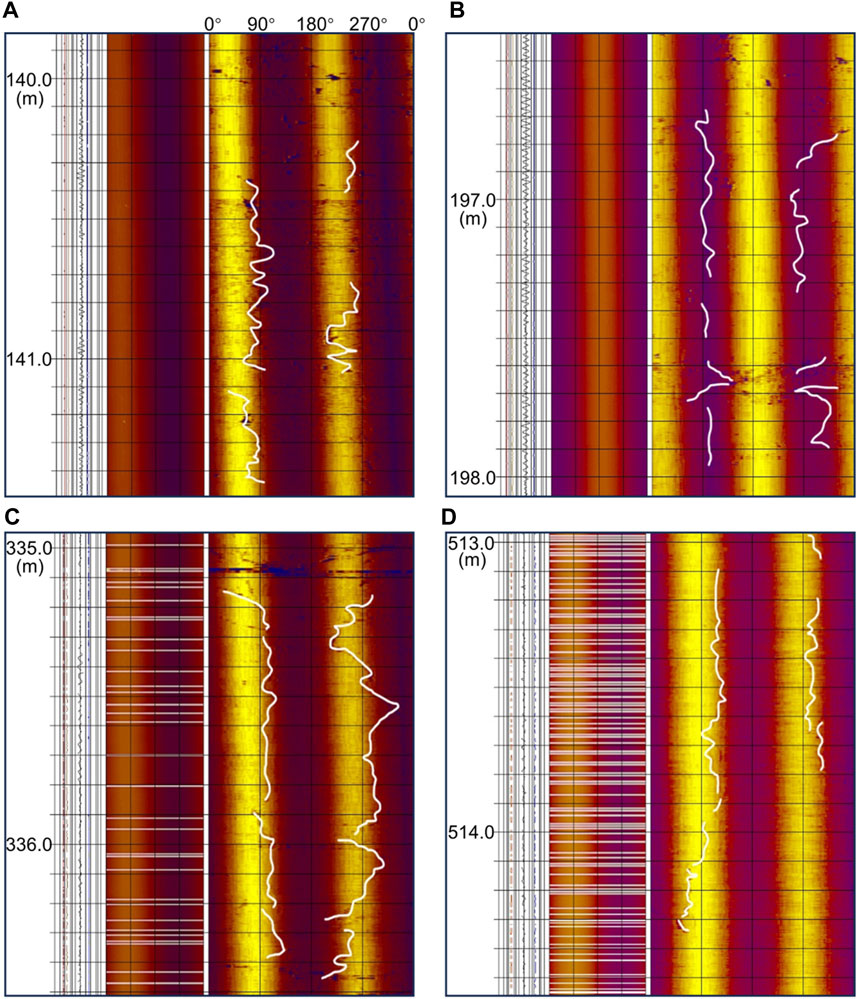
FIGURE 4. Images of induced cracks at different depths: (A) 139.85–141.56 m, (B) 196.40–198.07 m, (C) 334.96–336.51 m, and (D) 512.97–514.57 m.
4.2 Features of the imaged fractures
Nearly 2000 fractures were measured in borehole −209FK1 using the ultrasonic television scanning method. The dip directions and dip angles of these fractures were further analyzed using the WellCAD software. We plotted the rose diagrams and pole diagrams to show the variations in fractures with depth (Figures 5, 6). On the rose diagram (Figure 5A), the angle represents the dip direction of the fractures (with a space interval of 10°), while the radius indicates the number of fractures (with a space interval of 5). On the pole diagram (Figure 5B), the angle still represents the dip direction of the fractures; however, the radius represents the dip angles of the fractures. Thus, the dip angle of each fracture is explicitly displayed in the pole diagram.
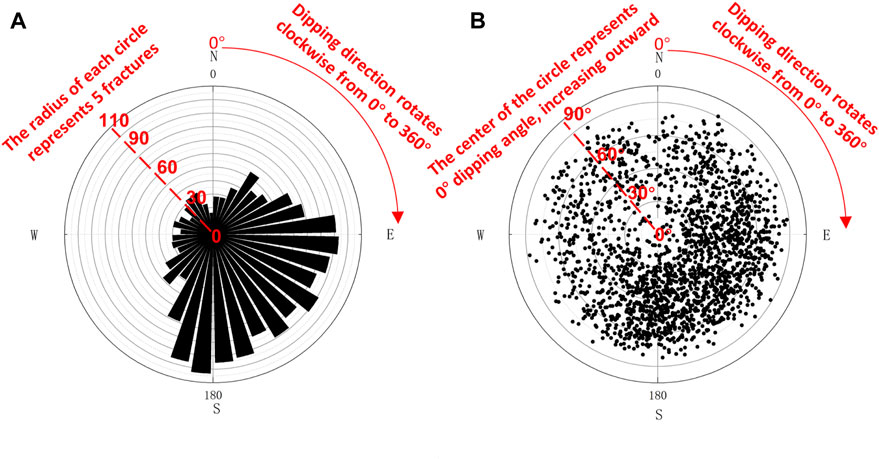
FIGURE 5. Rose and pole diagrams for all of the fractures. (A) Rose diagram; and (B) Pole diagram.
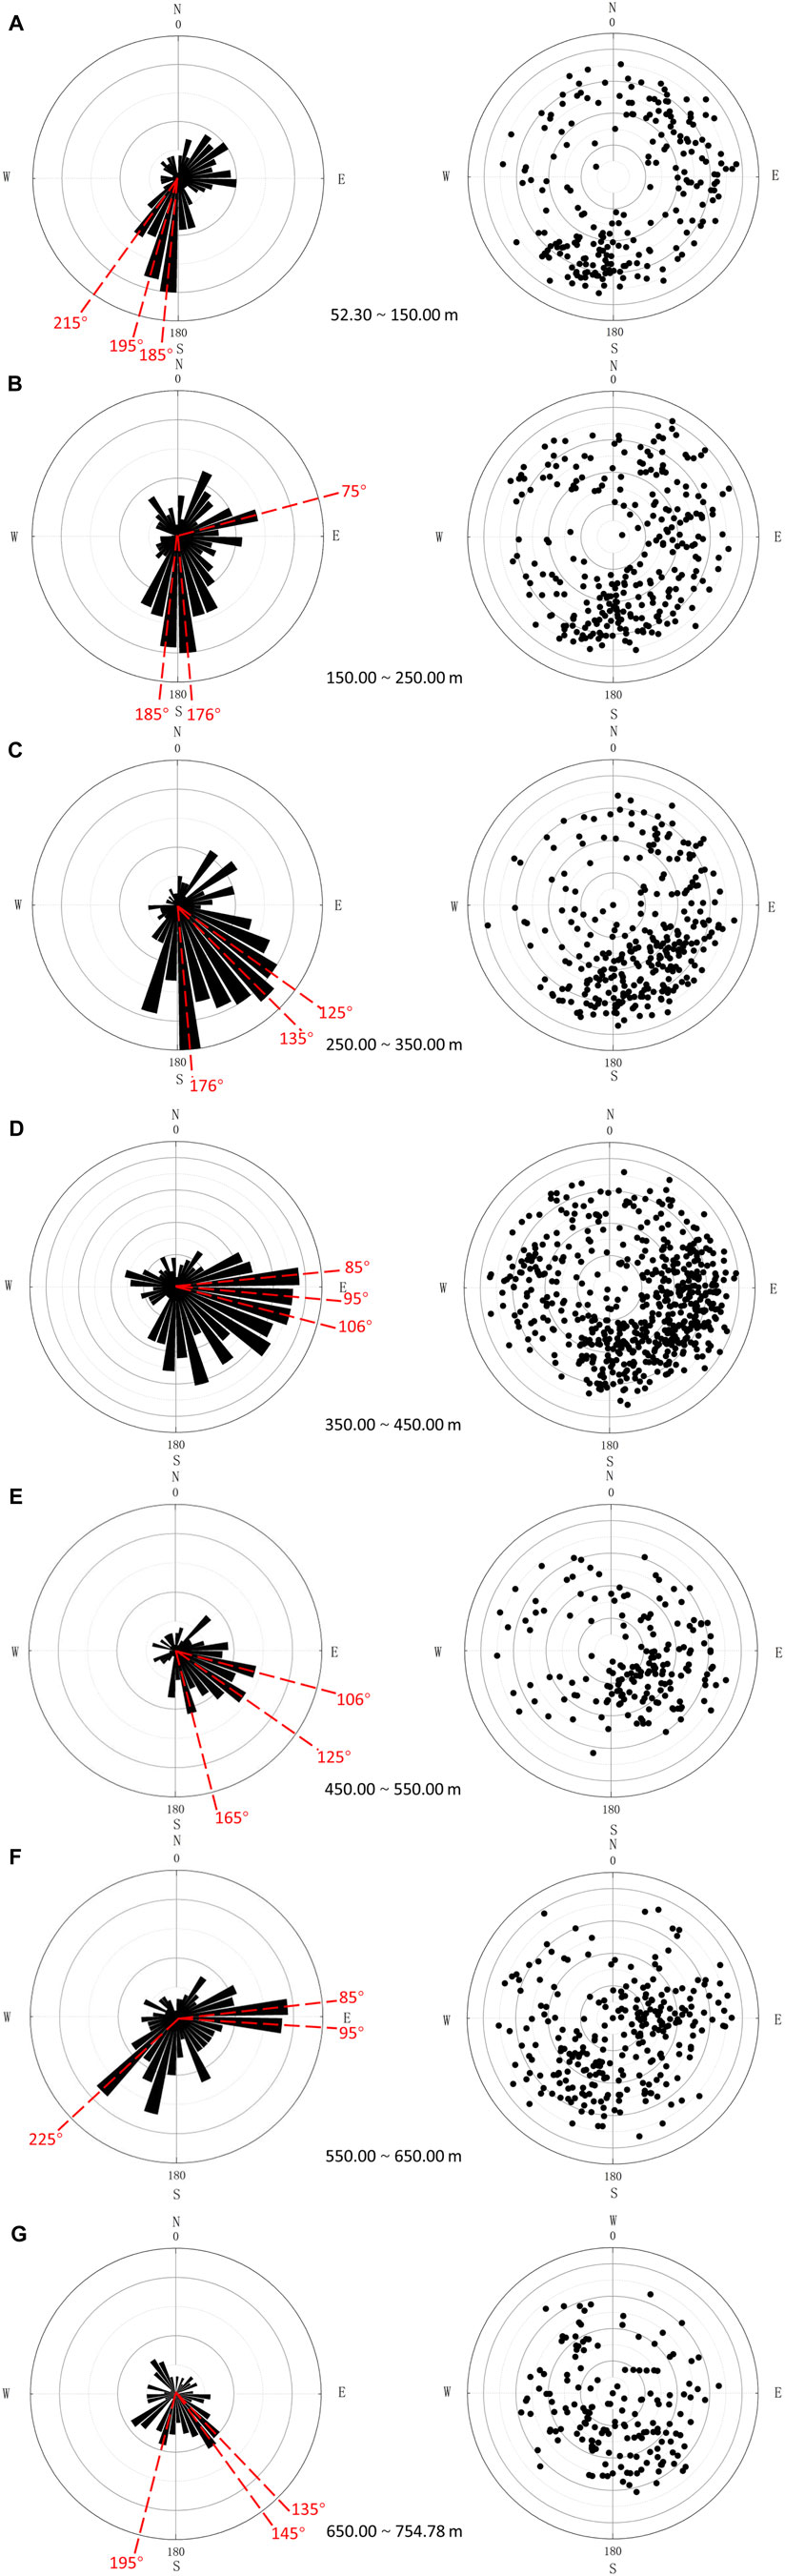
FIGURE 6. Rose and pole diagrams of fractures in-depth segments: (A) 52.30–150.00 m, (B) 150.00–250.00 m, (C) 250.00–350.00 m, (D) 350.00–450.00 m, (E) 450.00–550.00 m, and (F) 550.00–650.00 m.
First, we plotted all of the fractures on the same rose and pole diagrams (Figure 5). The distribution of the fractures is scattered and is characterized by large variations in the dip direction and angle. However, the dominant dip direction and angle of all of the fractures can be identified. The dominant dip direction is southeast (approximately 80°–190°), and the dominant dip angles are mainly concentrated in the range of 30°–80° (Figure 5).
Second, we plotted the dip direction and angle of the fractures in more detail by dividing the rose and pole diagrams into seven segments with a thickness of 100 m (Figure 6). The dominant dip direction of each segment is further summarized in Table 2. Both Figure 6; Table 2 show a remarkable feature of fracture concentration in the 350–450 m segment. The dominant dip direction of the fractures in this segment is southeast, and the dominant dip angles are 30°–80°, which are consistent with the trend of all of the fractures described above.
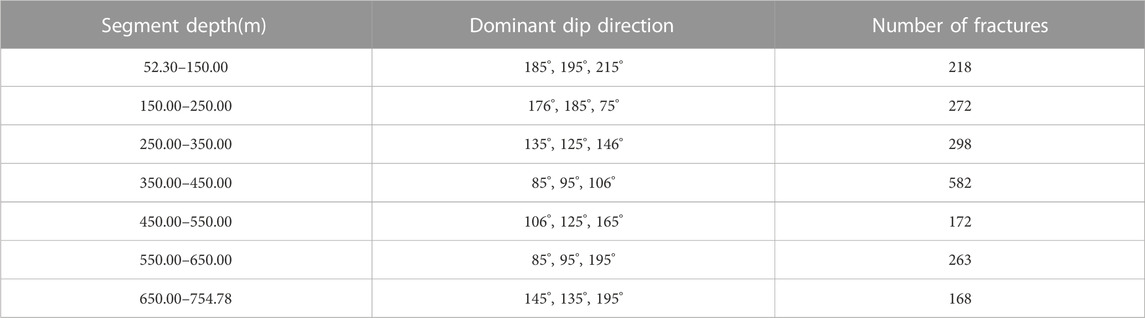
TABLE 2. Dip direction statistics of fracture changes with depth.
Furthermore, we analyzed the vertical variation in the dip angle of the fractures (Figure 7). The total number of fractures were plotted as the dip angle versus depth (Figure 7A). The most concentrated depth segment (350–450 m) and the dominant dip angles, which were determined via the following analysis, are labeled in Figures 7B–D. The dip angles were categorized into four groups, i.e., low dip angles (0°–20°), intermediate dip angles (20°–45°), steeply dip angles (45°–70°), and extremely steep dip angles (70°–90°). The percentage of each group is plotted in Figure 7B, and the dominant group is the steep dip angle (45°–70°), which accounts for more than half of the total number of fractures. The most densely distributed fractures are in the 350–450 m depth segment (nearly 600), and nearly 500 fractures are in the 50°–60° dip angle interval (Figures 7C, D).
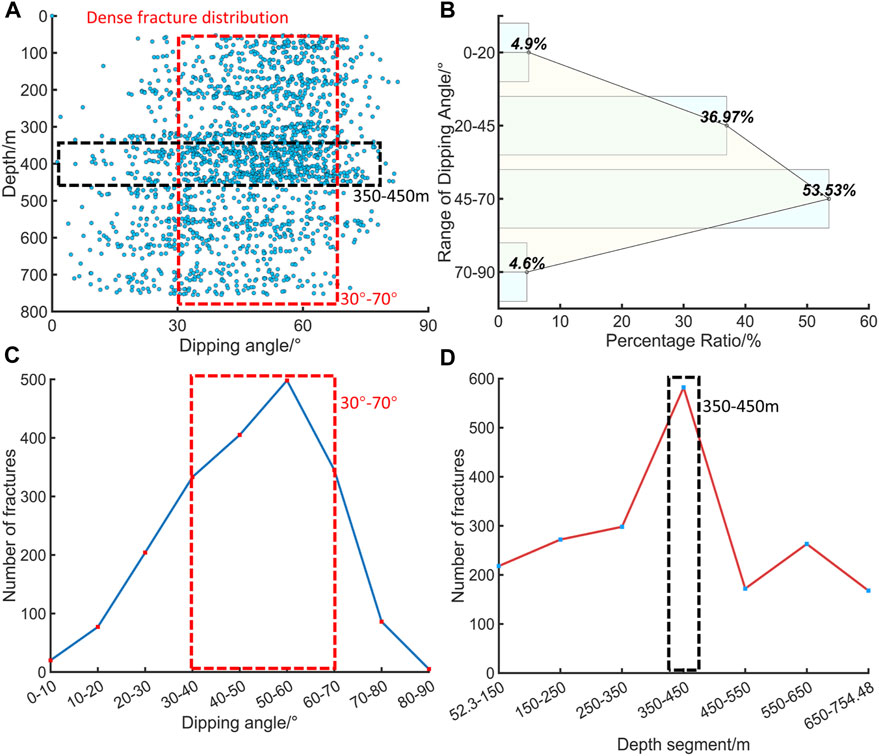
FIGURE 7. Dip angle variation at different depths. (A) Plot of dip angle of fractures versus depth. (B) Statistical histogram of the dip angles of the fractures (low dip angles: 0°–20°, intermediate dip angles: 20° < α ≦ 45°, steep dip angles: 45° < α ≦ 70°, and extremely steep dip angles: 70° < α ≦ 90°). (C) Plot of dip angles versus the number of fractures. (D) Plot of depth segment versus the number of fractures.
The distribution of the dip directions of the total number of fractures with depth is shown in Figure 8. The dip direction of the fractures varies greatly in space (Figure 8A), from 0° (north) to 360° (north). The dominant dip direction is southeast (ranging from 80° to 190°) (Figure 8B). The most dense fracture distribution occurs in the 350–450 m depth segment.
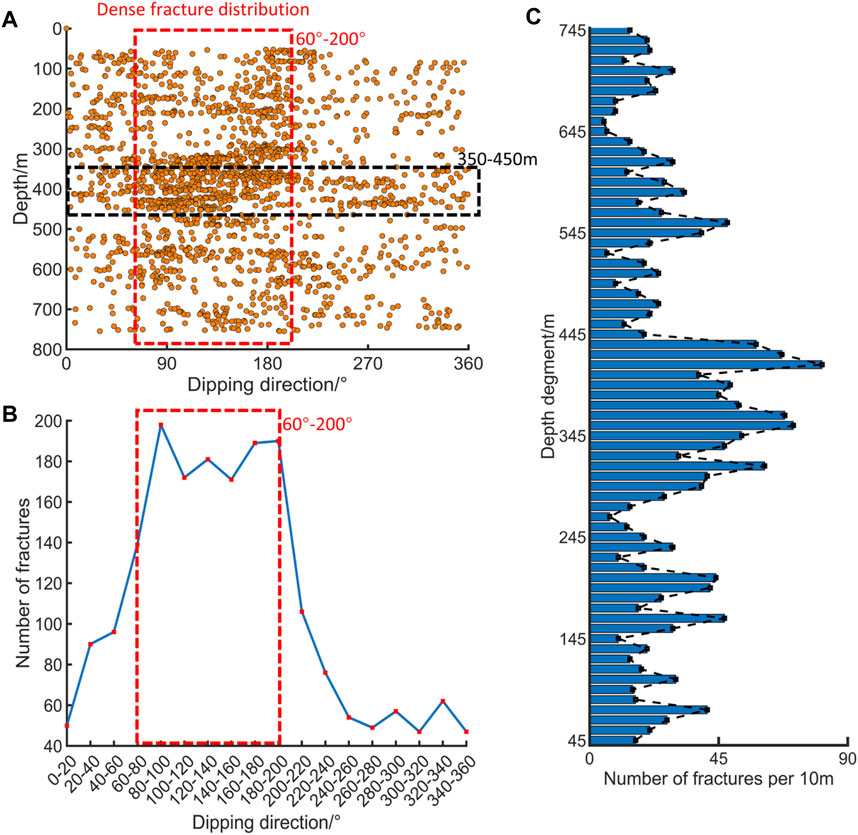
FIGURE 8. Dip direction variations in the different depth intervals and the density of the fractures with depth. (A) Plot of fractures in dip directions versus depth. (B) Plot of dip direction versus the number of fractures. (C) Bar graph of the fracture density with depth.
Another factor that can be quantified is the number of fracture joints, which are the intersection lines of two fractures (Figure 8C). This plot may indicate the density of the fractures. We plotted the fracture joints every 10 m. The segment with the greatest joint density is still 350–450 m. More specifically, the 420–430 m depth segment has the largest density (>8.1 lines/m), and the second largest density (∼7.1 lines/m) occurs in the 360–370 m depth segment.
5 Discussions
Kang et al. (2008) used 137 focal mechanism solutions from Guangdong Province and neighboring regions to invert the stress field and obtained the tectonic stress tensor data in 12 locations. Their results show that the directions of the average maximum and minimum principal stresses are 112° and 17°, respectively. Xie et al. (2004) divided the modern tectonic stress field in mainland China and neighboring areas, and their project area was located in the A201 South China main stress area. The overall regional stress field direction of this area is NWW (∼290°). Jiang and Li, (1992) also analyzed the stress field in the South China region using more than 200 small earthquake focal mechanism solutions and subdivided the stress field in the South China region into nine areas. The project area is located in area VI. The main compressive stress axis direction of this area is 292°, and the dominant direction of the main compressive stress is NWW.
The Mainland China Crustal Stress Environment Basic Database includes various types of stress data for mainland China and surrounding areas (Xie Furen et al., 2007; Hu et al., 2017), and 51 types of stress data for the research area and surrounding areas were queried from the database. These include 25 pieces of focal mechanism data, three pieces of fault slip data, six pieces of hydraulic fracturing data, and 17 pieces of stress relief data (Figure 9). Using the distance-weighted inversion of historical focal mechanism solutions around the epicenter, it was found that the tilt angle of the maximum principal stress axis in the regional tectonic stress field is high, indicating a strike-slip stress structure, and the principal stress axis is in the northwest to southeast direction.

FIGURE 9. The direction of the stress field around Fankou Mine based on multiple stress data.
The regional stress fields inferred from our ultra-sonic measurements are highly consistent with previous studies (Luo et al., 1990; Guo, 1991; Sun et al., 1991). On a large scale, we suspect that the stress field of the Fankou Lead–Zinc mine is mainly controlled by the large regional tectonic stress field. On a regional scale, the stress field in the Fankou Lead–Zinc mine varies largely in space, and the 350–450 m depth segment is unique, differing from the overlain and underlain layers.
The 350–450 m depth segment was further analyzed (Figures 10A, B), by comparing it to field observations in the mining roadways on a larger scale (Figure 10). The field observations show the intensively distributed fractures, and disasters such as collapse and roof falls are prone to occur (Figure 10C). If groundwater is involved, it is likely that water storage will occur in this depth segment, reducing the overall stability. The degree and frequency of disasters will increase significantly, and thus, future research should focus on this depth segment.
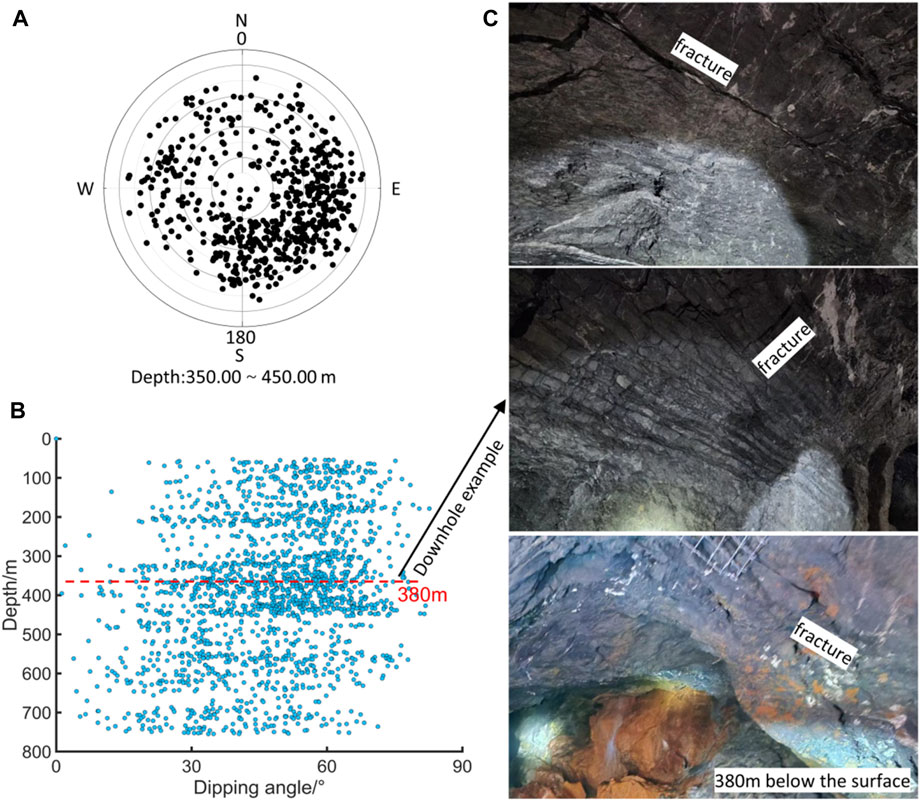
FIGURE 10. Detailed fracture distribution at depth. of 350.00–450.00 m (A) Pole diagram of the 350.00–450.00 m section below the borehole. (B) Distribution diagram of the dip angle of the borehole wall fracture with depth. (C) Diagram of the project at a depth of 380 m downhole.
In summary, ultra-sonic television scanning of the −209FK1 borehole revealed the spatial distribution of the fractures, suggesting large vertical variations in the dip direction and dip angle. A remarkable depth segment, i.e., 350–450 m, was identified, and it is characterized by a dense fracture distribution. The dominant dip direction of the fractures in the 350–450 m depth segment is southeast, and the dominant dip angles are 30°–80°. Future studies need to understand the nature of the 350–450 m depth segment.
Mineral mining areas have a complex tectonic history and are mostly high-stress environments. Only on-site drilling detection can accurately reveal the real underground structure in the project area. The multi-stress data’s stress field direction information around Fankou Mine verifies the accuracy of the ultrasonic underground television method. In addition, some researchers have utilized the orientation data of vertical fractures in pore walls to analyze the characteristics of the stress field in natural fault zones (Wang et al., 2020). Ultrasonic underground TV scanning can provide detailed measurement information for the identification of underground structural features. Based on detailed structural plane data, characteristics such as the principal stress directions and fracture concentration areas can be analyzed to optimize the mine’s exploration strategy and resource mining plan. We should focus on monitoring areas where cracks are concentrated and minimize operational risks. This line of analysis can be applied to similar data for other mines and regions around the world. Therefore, for underground mining projects in a certain area, precise structural plane identification in boreholes yield obtain accurate stress direction data and the spatial distribution of cracks, providing a reference for the project.
6 Conclusion
We conducted a systematic study to investigate the interaction between the spatial distribution of fractures, principal stress direction, and geological disaster revelation using ultrasonic borehole television scanning. The main conclusions are presented below.
1) The dominant direction of the maximum horizontal principal stress (SH) determined via ultrasonic drilling television scanning in the Fankou Lead–Zinc Mine is N77°W, which is in agreement with the regional stress field. When excavating tunnels and arranging caverns, it is appropriate to arrange the tunnel orientation or cavern axial direction as close as possible to the maximum principal stress direction.
2) Ultrasonic television scanning of the −209FK1 borehole revealed the spatial distribution of the fractures, and a remarkable depth segment, i.e., 350–450 m, was identified. This segment is characterized by a dense fracture distribution. The concentrated fractures in the 350–450 m depth segment may indicate a large risk of disasters such as collapse and roof falls. This depth segment should be given attention in the future production of the Fankou Lead–Zinc Mine.
Data availability statement
The original contributions presented in the study are included in the article/Supplementary material, further inquiries can be directed to the corresponding authors.
Author contributions
YD: Writing–original draft, Writing–review and editing. CiW: Writing–original draft, Writing–review and editing. CuW: Investigation, Writing–review and editing. GY: Data curation, Writing–review and editing. SO: Data curation, Writing–review and editing. JL: Project administration, Writing–review and editing. YA: Investigation, Writing–review and editing.
Funding
The author(s) declare that no financial support was received for the research, authorship, and/or publication of this article.
Conflict of interest
GY and SO were employed by the Fankou Lead-Zinc Mine.
The remaining authors declare that the research was conducted in the absence of any commercial or financial relationships that could be construed as a potential conflict of interest.
Publisher’s note
All claims expressed in this article are solely those of the authors and do not necessarily represent those of their affiliated organizations, or those of the publisher, the editors and the reviewers. Any product that may be evaluated in this article, or claim that may be made by its manufacturer, is not guaranteed or endorsed by the publisher.
References
Chen, P., Chen, H., and Gao, L. (1990). World in-situ stress measurement data compilation[M]. Beijing: Seismological Press.
Chen, Q., Wang, W., Sun, Y., et al. (1998). Rock mechanics and tectonic stress field analysis[M]. Beijing: Geological Publishing House.
Davatzes, N. C., and Hickman, S. H. (2005). Fault rock mineralogy and fluid flow in the Coso Geothermal Field. CA [C] ∥ American Geophysical Union Fall Meeting Abstracts.
Guo, Q. (1991). Hydro-fracturing stress measurement report for the second phase of guangzhou pumped storage power station.
Hubbert, K. M., and Willis, D. G. (1957). Mechanics of hydraulic fracturing. Pet. Trans. AIME T.P. 210, 153–168. doi:10.2118/686-g
Jiang, W., and Li, Y., Small earthquake source mechanism solutions and tectonic stress field in south China, China Earthq., 1992, 8(1):36–42.
Kang, Y., Yang, X., Xing, C., et al. Inversion of stress field in Guangdong and adjacent areas[J], Acta Seismol. Sin., 2008, 30(1):59–66.
Li, Y., Chai, D., and He, L. (2018). Structural system of Fankou lead-zinc mine field in renhua county, Guangdong Province. Nonferrous Met. Min. Sect. 70 (1), 46–49.
Luo, Z., et al. (1990). Report on the study of 3D in-situ stress measurement and distribution law of Fankou lead-zinc mine.
Luo, Z., Wang, W., Tang, S., et al. (2013). 3D in-situ stress measurement and distribution law of Fankou lead-zinc mine[R]. Shaoguan, Guangdong: Fankou Lead-Zinc Mine: Zhongjin Lingnan Nonferrous Metals Co., Ltd.
Martin, C. D. (1990). Characterizing in-situ stress domains at the AECL underground research laboratory. Can. Geotechnical J. 27, 631–646. doi:10.1139/t90-077
Shihe, Y., and Zhang, C. (1996). Well logging data processing and integrated interpretation. Petroleum University Press.
Sun, S., Gao, J., Ding, J., et al. Hydro-fracturing stress measurement of guangzhou pumped storage power station[J], Chin. J. Rock Mech. Eng., 1991, 10(4):374–381.
Tan, C., Sun, Y., et al. (2004). Study on tectonic stress plane. Chin. J. Rock Mech. Eng. 23 (23), 3970–3978.
Tan, C., Sun, Ye, and Wang, L. (2003). Discussion on issues worth noting in the measurement of In-situ stress. J. Geol. Mech. 9 (3), 275–280.
Tan, C., Wang, R., Sun, Y., Lei, W., Wu, S., Yang, M., et al. Numerical modelling estimation of the ‘tectonic stress plane’ (TSP) beneath topography with quasi-U-shaped valleys. Int. J. Rock Mech. Min. Sci., 2004, 41(2): 303–310. doi:10.1016/s1365-1609(03)00096-0
Wang, P., Wang, C., Wang, H., et al. (2020). Analysis of in-situ stress field characteristics of the Yishu Fault Zone using hole wall vertical crack azimuth data. Earthq. Geol. 42 (06), 1316–1334.
Xie, F., Cui, X., Zhao, J., et al. Zoning of modern tectonic stress field in Chinese mainland and adjacent areas[J], Chin. J. Geophys., 2004, 47(4):654–662.
Yuan, G. (2016). Analysis and prevention of rock burst geological factors in deep of Fankou lead-zinc mine. Metall. Collect. 223 (3), 37–42.
Yuan, G., Jia, H., Song, Y., and Yu, X., Geological characteristics and prospecting direction of deep deposits in the South of shiling, Fankou lead-zinc mine[J], J. Geol., 2019, 43(1):1–7.
Keywords: rock fracture, ultrasonic borehole television, stress background, Fankou, Lead-Zinc Mine
Citation: Du Y, Wu C, Wang C, Yuan G, Ouyang S, Liao J and An Y (2023) Stress background and rock fractures revealed by ultrasonic borehole television in the Fankou Lead-Zinc Mine. Front. Earth Sci. 11:1286335. doi: 10.3389/feart.2023.1286335
Received: 31 August 2023; Accepted: 17 November 2023;
Published: 29 December 2023.
Edited by:
Xintong Dong, Jilin University, ChinaReviewed by:
Luyuan Huang, China Earthquake Administration, ChinaZhang Zhiwei, Sichuan Earthquake Administration, China
Copyright © 2023 Du, Wu, Wang, Yuan, Ouyang, Liao and An. This is an open-access article distributed under the terms of the Creative Commons Attribution License (CC BY). The use, distribution or reproduction in other forums is permitted, provided the original author(s) and the copyright owner(s) are credited and that the original publication in this journal is cited, in accordance with accepted academic practice. No use, distribution or reproduction is permitted which does not comply with these terms.
*Correspondence: Chenghu Wang, aHVjaGVuZ3dhbmdAMTYzLmNvbSYjeDAyMDBhOw==; Guiqiang Yuan, Z3VpcWlhbmd5QDEzOS5jb20=
†These authors have contributed equally to this work and share first authorship