 Shijing Xu
 Jian Wang
 Nan Wu
 Qinghai Xu
- 1School of Petroleum Engineering, Yangtze University, Wuhan, Hubei, China
- 2Key Laboratory of Drilling and Production Engineering for Oil and Gas, Yangtze University, Wuhan, Hubei, China
- 3College of Geosciences, Yangtze University, Wuhan, Hubei, China
- 4Key Laboratory of Tectonics and Petroleum Resources (China University of Geosciences), Ministry of Education, Wuhan, Hubei, China
The Cambrian Yuertus Formation and Ordovician Saergan and Yingan formation source rocks, which TOC contents of 0.38%–4.30%, are well developed in the Keping area of the Tarim Basin. Reservoir bitumen had been found in the Cambrian Wusongger Formation and Shayilike Formation. In this study, the geochemical characteristics of the bitumen and source rocks were analyzed through biomarkers for oil-source correlation. The results show that the characteristics of the bitumen and Yuertus Formation source rocks are similar. Comparatively, the Yuertus Formation source rocks and bitumen have lower Pr/Ph values and higher C28/C29 regular steranes values. The maturity characteristics and depositional environment of the Cambrian source rocks in the Keping area and the platform basin areas are similar. Plots of Ph/n-C18 versus Pr/n-C17, Ts/(Ts+Tm) versus 4-/1-MDBT (methyl dibenzothiophene), and DBT/P (dibenzothiophene/phenanthrene) versus Pr/Ph distinguish the bitumen and source rocks well. As an original plot, we found that the Fla/Py (fluoranthene/pyrene) versus MP/P (methyl-phenanthrene/phenanthrene) intersection plot can be used to identify the possible sources of polycyclic aromatic hydrocarbons (PAHs) to a certain extent and can distinguish between the Cambrian and Ordovician source rocks in this study. Comprehensive analysis revealed that the bitumen samples most likely originated from the Yuertus Formation source rocks. It was also found that the biomarker characteristics such as the shape type of the C27-C28-C29 regular steranes, triarylosteranes, and triarylosteroids are not applicable to distinguishing the Cambrian and Ordovician source rocks in the Keping area. These research findings provide references for studying the Lower Paleozoic oil-source correlation in the platform in the Tarim Basin.
1 Introduction
The Lower Paleozoic strata in the Tarim Basin are one of the main areas of deep oil and gas exploration in China. On 2 September 1984, well SC2 in the Yakela structure in the Shaya uplift in the northeastern part of the Tarim Basin produced a prolific reservoir in the Ordovician strata, which was a prelude to Paleozoic oil and gas exploration in the Tarim Basin (Kang and Jia, 1984). In January 2020, well LT1 obtained a high yield of light crude oil from the Cambrian carbonate strata below 8,200 m, which is the deepest buried Paleozoic oil reservoir found in the world and also represents a major strategic discovery in the new domain and new stratum in the Tarim Basin (Yang et al., 2020; Zhu et al., 2022). It is generally believed that there are two main sets of source rocks in the Lower Paleozoic strata in the Tarim Basin, the Cambrian Yuertus Formation and the Middle-Upper Ordovician source rocks (Zhang et al., 2000a; 2002; Wang and Xiao, 2004; Huang et al., 2016; Jin et al., 2017; Yang et al., 2020; Li et al., 2021). However, the consensus on the main Lower Paleozoic source rock has not been reached by the explorers. At present, scholars have also conducted abundant research based on biomarkers (Zhang et al., 2000a; 2002; 2012; Wang and Xiao, 2004; Hu et al., 2016; Huang et al., 2016; Jin et al., 2017; Li et al., 2021).
Li et al. (1999) characterized the Cambrian-Lower Ordovician source rocks as having six high aspects and one low aspect (high abundances of dinosterane, 4-methyl sterane, 24-norcholestane, 24-nordiacholestane, gammacerane, and C28 regular steranes and a low abundance of diasteranes). By contrast, the Middle-Upper Ordovician source rocks are characterized by six low aspects and one high aspect. Based on this understanding, many scholars have concluded that the main source rocks in the platform basin area are the Middle-Upper Ordovician source rocks according to the biomarker characteristics of the crude oils from different oilfields, and the oil in only a few sites (such as oil from well TD2) is derived from the Cambrian-Lower Ordovician source rocks (Zhang et al., 2000b; 2002; Hanson et al., 2000; Zhu et al., 2012).
Zhang et al. (2000a, 2000b) took the biomarkers of the Xishanbulake Formation in well TD2 as the representative biomarkers of the Cambrian source rocks and concluded that the relative contents of C27, C28, and C29 regular steranes of the oil from the Cambrian source rocks have an incremental relationship, namely, C27<C28<C29. Moreover, the existence of this type of crude oil has indeed been reported in exploration research, such as the crude oil produced from wells TZ168, TZ30, and TZ16 and the inclusion of hydrocarbons in wells TZ11, TZ12, and TZ47 (Hanson et al., 2000; Cai et al., 2009a; Cai et al., 2009b; Cheng et al., 2016; Li et al., 2018), indicating that the oil in the northern and central Tazhong areas does have some contributions from the Cambrian source rocks. The peak heights of the regular steranes of the oil from the Ordovician source rocks are characterized by the order C27>C28<C29 (V-shaped), and most of the crude oil produced in the Lower Paleozoic strata is this type (Zhang et al., 2000a). However, with the increase in available geological data and the deepening of research, Wang et al. (2014) found that the regular sterane characteristics of the Cambrian oil from well ZS1 are similar to those of the Ordovician in the Tabei and Tazhong areas, both of which exhibit V-shaped patterns, such as wells XH1, KT1, and LT1. Therefore, the discovery of well ZS1 indicates that the Cambrian source rocks can generate not only crude oil characterized by six high aspects and one low aspect but also Ordovician-type crude oil characterized by six low aspects and one high aspect (Wang et al., 2014). In addition, the existing research results show that the Cambrian light oil in well LT1 has a good affinity with the Cambrian Yuertusi Formation source rocks (Deng, 2021). Regarding the relative sterane contents, Zhang et al. (2015) confirmed that the relative abundance of C28 sterane in the Cambrian source rocks is significantly higher, and C28/(C27+C28+C29) > 0.25, while the upper Ordovician source rocks have the opposite characteristics.
Jin et al. (2017) analyzed the differences between the Cambrian and Ordovician source rocks using the Cambrian mudstone in well XH1 and the gray mudstone in the Upper Ordovician Lianglitage Formation in well LN46 as representatives. They found that the most noticeable difference between Cambrian and Ordovician source rocks is the relative abundance of C21 and C23 tricyclic terpenes: the ratio of C21/C23 tricyclic terpenes in Cambrian source rocks is >1.0 in the Cambrian source rocks, while the ratio of C21/C23 tricyclic terpenes in Ordovician source rocks is <1.0. Zhang et al. (2015) considered that the oil in the Tazhong and Tabei areas as a typical representative of the Ordovician source rocks. This type of crude oil has a relatively low C24 tricyclic terpane content and pristane/phytane (Pr/Ph) ratio and a higher C23 tricyclic terpane content and dibenzothiophene/phenanthrene (DBT/P) ratio. According to Cai et al. (2009a), the crude oil from well TD2 has a higher gammacerane index, and the C30αβ hopane content is higher than the C29αβ hopane content.
In addition, it has been found that the crude oil derived from Cambrian source rocks in the Lunnan area of the Tarim Basin has higher contents of C26-20S, C26-20R+C27-20S, and C27-20R triaromatic steroids (TAS), while the crude oil derived from Ordovician source rocks has higher contents of C2820S and C2820R TAS (Li et al., 2006; Mi et al., 2007). Zhang et al. (2000a), Zhang et al. (2002) found that the TAS contents of the Cambrian source rocks from well He4, the crude oil from well TD2, and the Cambrian source rocks are high, while these compounds cannot be detected in the Middle-Upper Ordovician source rocks in wells TZ6 and LG9.
Although great progress has been made in the study of the main oil source of the Lower Paleozoic strata in the Tarim Basin, no consensus has been reached at present. In fact, the existing disputes reflect the complexity of the hydrocarbon genesis and sources in the Tarim Basin. Due to limited coring data, the deep burial of the source rocks, the high degree of thermal evolution, and the lack of effective source rock samples, direct evidence is lacking. Due to the basin’s size, hydrocarbon generation biomarkers for the source rocks in different zones of the same stratum may exhibit some differences, and/or the biomarkers of the hydrocarbon generated by different strata may show similarities. Thus, convincing direct and effective evidence supporting a Cambrian or Ordovician source has not been obtained.
In this study, we conducted multiple visits to the Keping area of the Tarim Basin many times to investigate the outcrops of Cambrian and Ordovician strata, and we found abundant reservoir bitumen in the Cambrian strata. The geochemical characteristics of the bitumen and the Cambrian and Ordovician source rock outcrop samples from this area were analyzed and compared to determine their sources. In addition, published data for the Cambrian source rocks and crude oil produced inside the basin were used for comparison. Several widely used parameters mentioned above were verified and different conclusions were reached. It should be noted that some commonly used plates are cited in this paper, and some new application opinions are proposed. The results of this study serve as a reference for research on the oil and gas sources in the Tarim Basin.
2 Geologic settings
The Tarim Basin is located in northwestern China. It is the largest oil-bearing basin in China with an area of approximately 56×104 km2, and is a superimposed basin developed on the pre-Sinian basement (Lin et al., 2012; Shi et al., 2017). The interior of the basin consists of multiple tectonic units (Figure 1B; modified from Yang et al., 2017a).
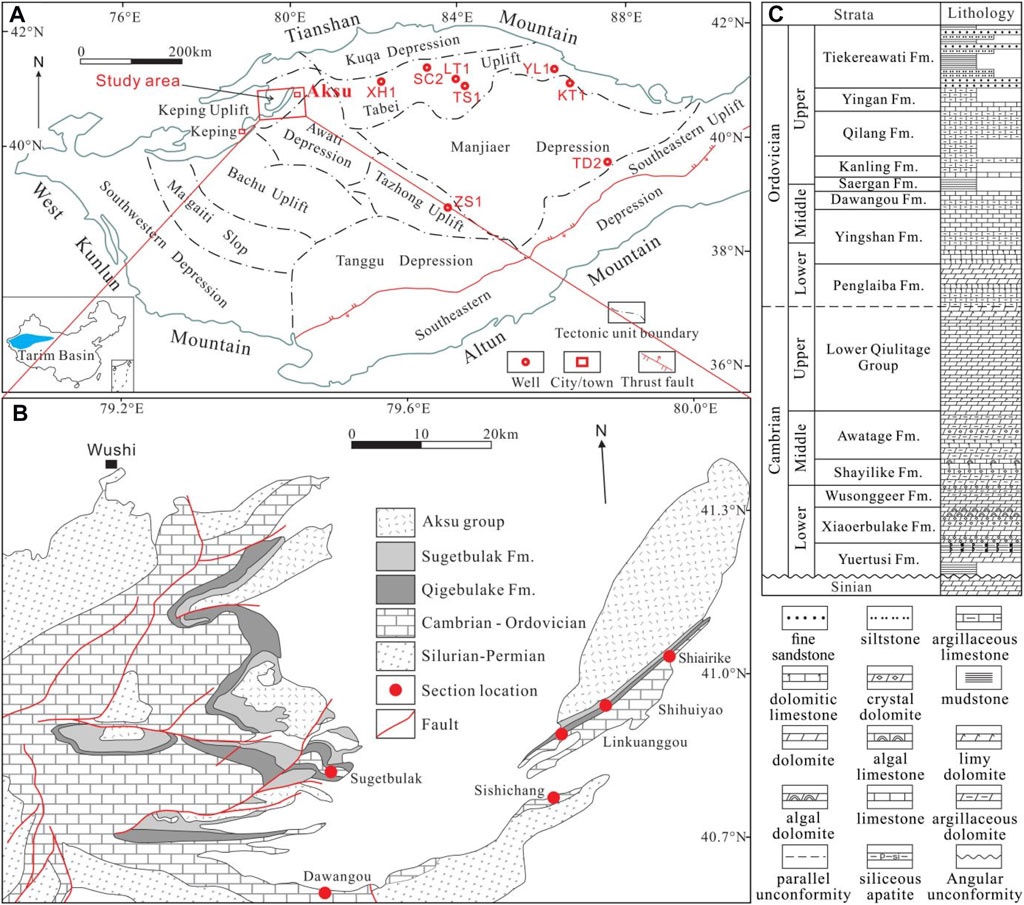
FIGURE 1. (A) Simplified tectonic map of the Tarim Basin, (B) geological sketch of Keping area (modified from Turner, 2010) and (C) the generalized stratigraphic column for Keping area (after Gao et al., 2012).
The study area is located in the Keping uplift, about 30 km from Aksu City. The Keping uplift is adjacent to the Wushi sag and the Wensu uplift to the north, the Bachu Uplift to the south, and the Awati depression to the east (Figure 1B). In the Early Cambrian, a large-scale rapid transgression occurred in the Keping uplift (Yang et al., 2017b). Phosphorous mudstone was developed in the Yuertus Formation (Є1y), and thick gypsum-salt rock and dolomite were deposited during the Middle-Upper Cambrian. The Lower-Middle Ordovician stratum is mainly composed of carbonate and mudstone, and deep-sea siliciclastic sedimentary rocks were deposited throughout the entire basin in the Upper Ordovician (Lin et al., 2012). The stratigraphic division of the Cambrian and Ordovician in the Keping area is shown in Figure 1C (Gao et al., 2012). The Cambrian Yuertus Formation and Ordovician Yingan (O3y) and Sargan (O2-3s) formations are relatively good source rocks.
3 Samples and methods
3.1 Samples
In this study, a total of 134 samples were collected from profiles in the Keping area. The sample information is presented in Table 1. Typical sample photographs are presented in Figure 2.
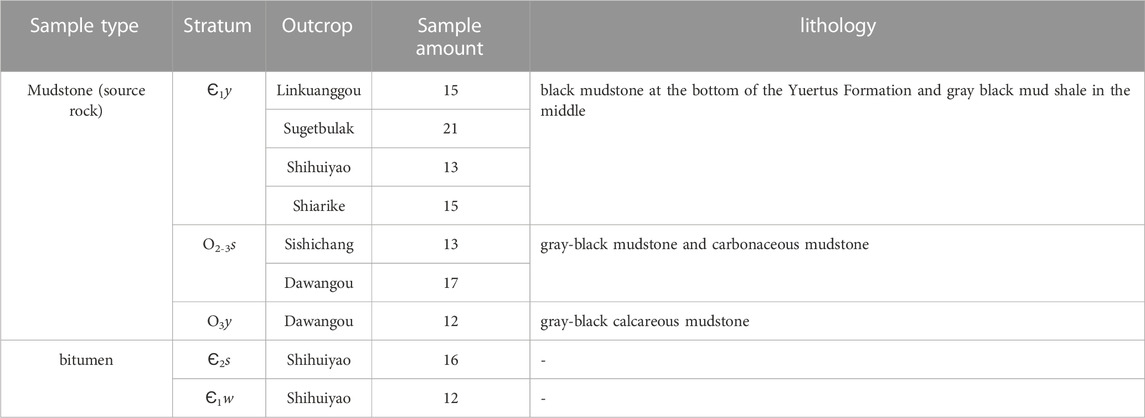
TABLE 1. Information of outcrop samples in Keping area.
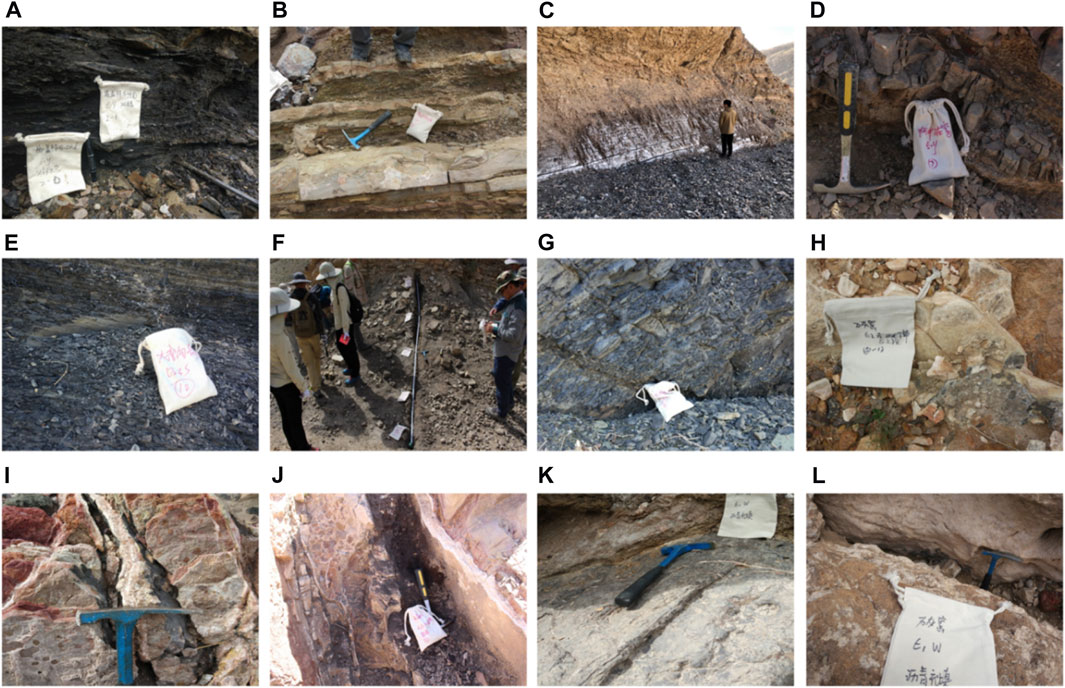
FIGURE 2. The typical sample characteristics of the source rocks and bitumen in Keping area. (A) black mudstones in the Є1y, Sugetbulak profile; (B) mudstone in the Є1y, Linkuanggou profile; (C) black shale in the Є1y, Shiairike profile; (D) mudstone in the Є1y, Shihuiyao profile; (E) black mudstones in the O2-3s, Dawangou profile; (F) black mudstones in the O2-3s, Sishichang profile; (G) black mudstones in the O3y, Dawangou profile; (H-J) bitumen in the Є2s, Shihuiyao profile; (K, L) bitumen in the Є1w, Shihuiyao profile.
Total organic carbon (TOC) and Rock-Eval Pyrolysis analyses were applied on 40 mudstone samples (Table 2). Sixteen mudstone samples (nine Cambrian samples and seven Ordovician samples) and nine bitumen samples were prepared for Soxhlet extraction. Gas chromatography-mass spectrometry (GC-MS) analysis was conducted on 25 extracts (Tables 3, 4).
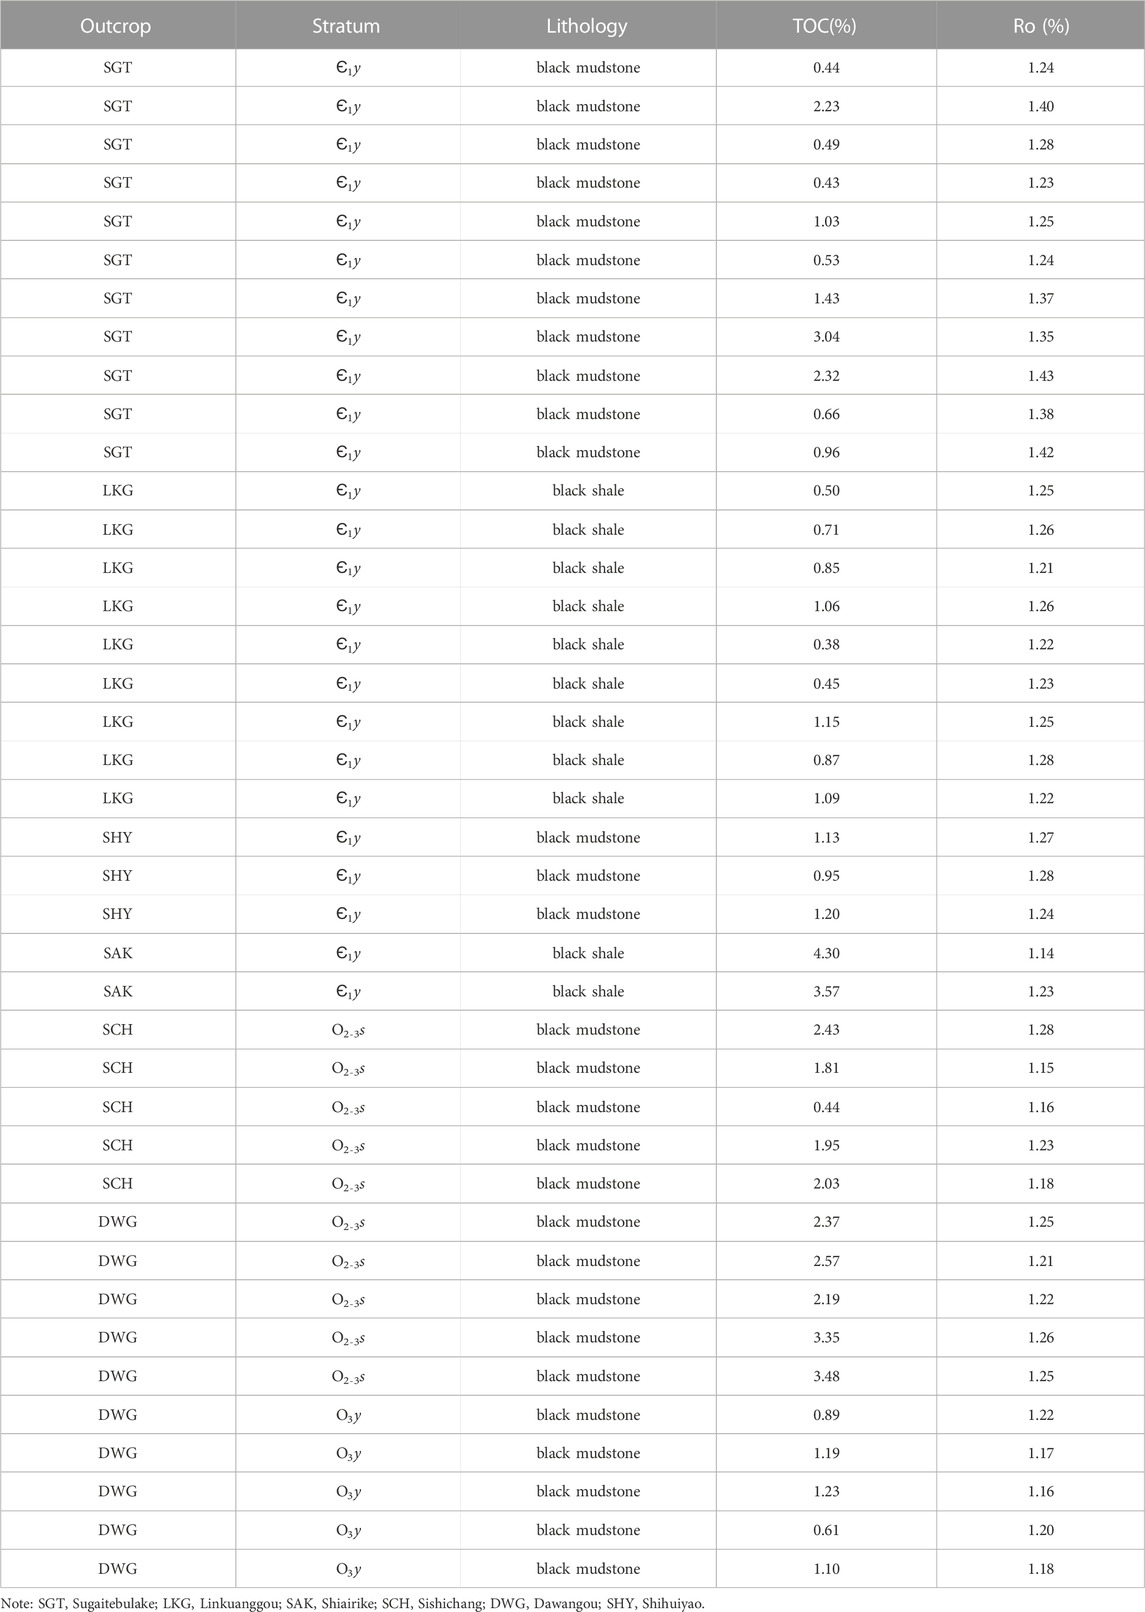
TABLE 2. TOC contents, maturity and Kerogen types of selected source rocks.
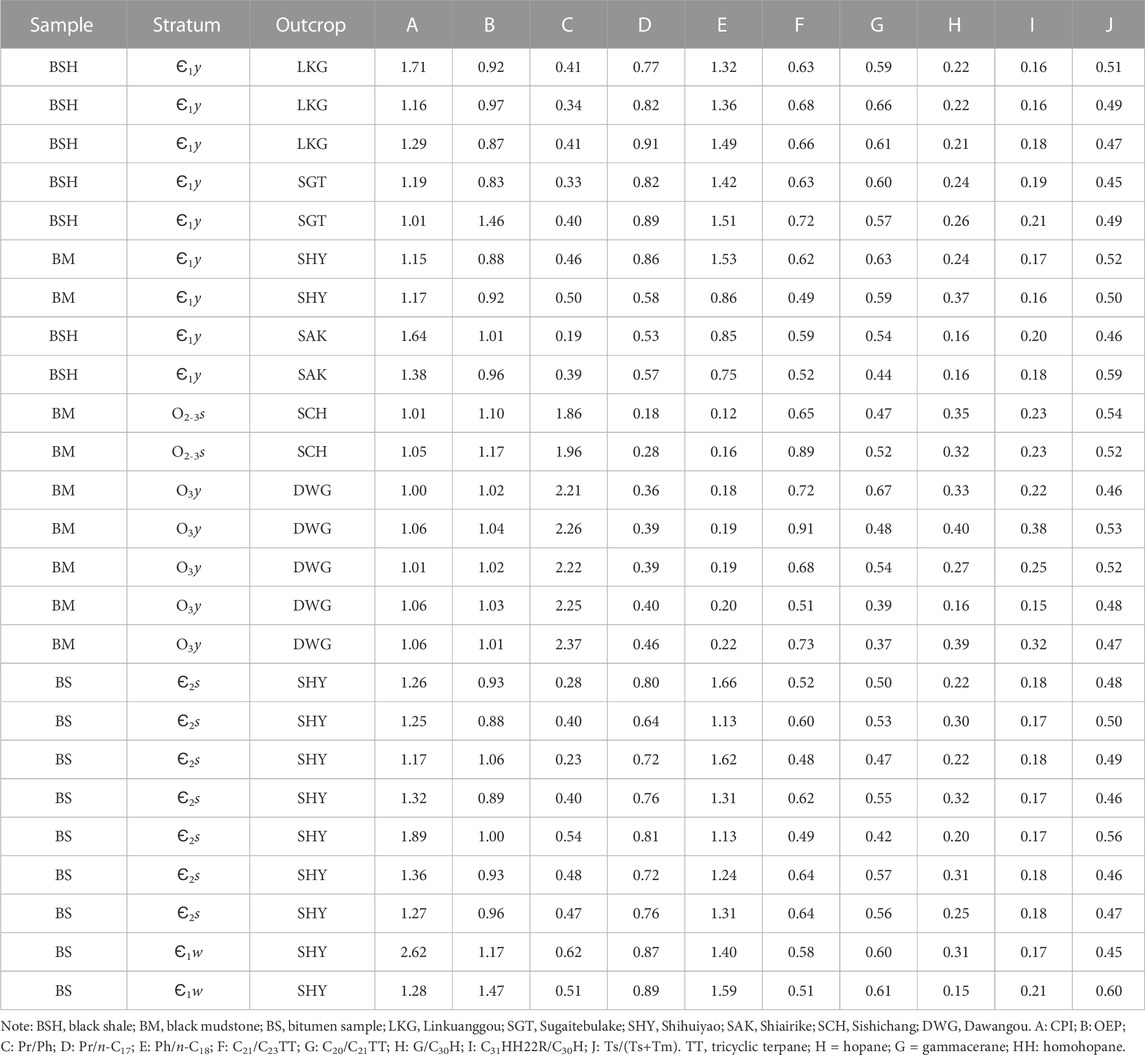
TABLE 3. Partial geochemical parameters of the source rock and bitumen samples.
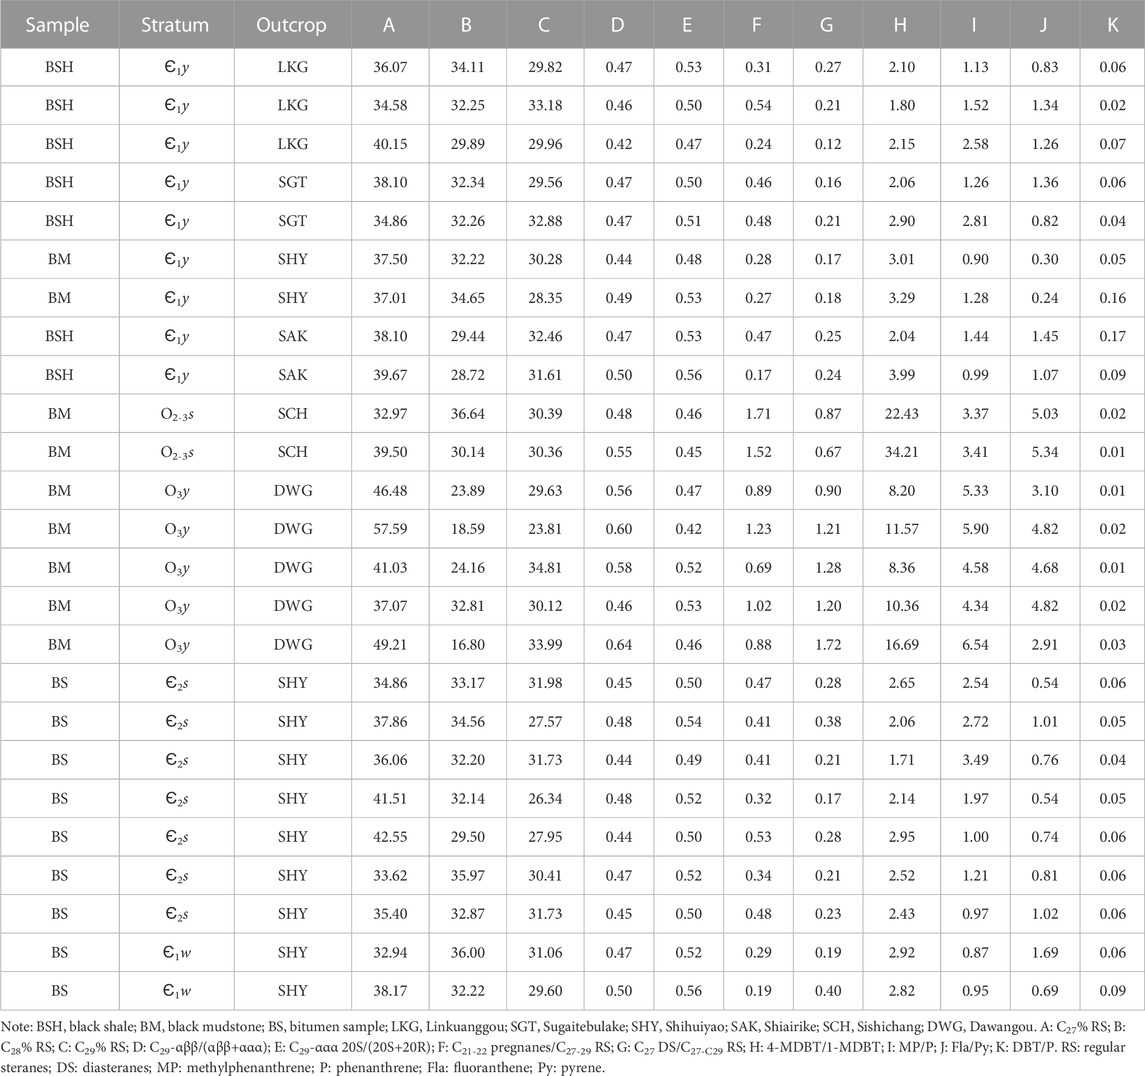
TABLE 4. Sterane and aromatic parameters of the source rock and bitumen samples used in this study.
To ensure the accuracy of the test results, more attention should be paid during the sampling. The external surfaces of the outcrops should be removed. Weathered and fresh samples can be distinguished according to their colors. Thus, the collection of a weathered sample can be easily avoided during the sampling process.
3.2 Analytical methods
3.2.1 Bulk measurements
Samples were thoroughly cleaned and ground into powder (≤200 mesh) before conducting analysis. The total organic carbon content (TOC) was determined following the elimination of carbonates with HCl. Approximately 100 mg sample was heated to 550°C, and then held for 600 s to measure TOC.
Rock-Eval analysis was performed using a Rock-Eval instrument. The quantity of pyrolysis products (S1, S2, mg, HC/g) produced by kerogen during gradual heating in a helium flow were measured. The samples were heated to 300 °C and hold for 5 min to release the S1 fraction, followed by a 25°C/min heating process until 650°C to release S2 fraction.
3.2.2 Vitrinite reflectance (Ro)
The mean vitrinite reflectance (Ro, %) was measured by polarized light immersion method. Reflected light microscope is a computerized MPVSP for reflectance measurement using MPV-Geor software.
The equivalent vitrinite reflectance is calculated based on the conversion relationship between bitumen reflectance (Ro, b) and vitrinite reflectance (Ro) proposed by Feng and Chen, (1988): Ro = 0.6569Ro, b + 0.3364.
3.2.3 Gas chromatography–mass spectrometry (GC–MS)
All samples were analyzed by gas chromatography (GC) and gas chromatography–mass spectrometry (GC–MS) (Table 3). Use the Trace GC Ultra system coupled with DSQ mass spectrometer to analysis saturated and aromatic hydrocarbon fractions. GC was equipped with a PTV injection system and a fused silica capillary column (SGE BPX5; 50 m, inner diameter = 0.22 mm, film thickness = 0.25 μm). Helium was used as carrier gas with a flow rate of 1 mL/min, and the temperature of the GC oven was programmed from 50°C (1 min isothermal) to 310°C with a flow rate of 3°C/min, followed by a 30 min isothermal phase. The injector temperature was programmed from 50°C to 300°C at a rate of 10°C/s and maintained for 10 min. Full scan mass spectra were recorded from m/z 50 to 330 at a scan rate of 2.5 scans/s. The quantification of aromatic fractions was carried out using 1-ethylpyrene as internal standard.
4 Results
4.1 Organic matter contents
4.1.1 Cambrian source rocks
The Є1y source rocks are mainly composed of dark carbonaceous shale. The TOC contents are 0.38%–4.30%, with an average of 1.34%. The equivalent Ro is 1.14%–1.43%. The TOC contents of the Є1y source rocks in well LT1 are higher than those of the outcrops in the Keping area (0.14%–29.8%; average of 5.65%) (Zhu et al., 2022).
4.1.2 Middle-Upper Ordovician source rocks
The Middle-Upper Ordovician source rocks mainly include O2-3s and O3y. The O2-3s source rocks mainly consist of gray-black and black carbonaceous mudstone mixed with a small amount of dark gray calcareous mudstone and micrite. The TOC contents are 0.44%–3.48%, with an average value of 2.33%, and the equivalent Ro values are 1.15%–1.28%. The lithology of the O3y source rock is composed of gray-black calcareous mudstone intercalated with dark gray banded argillaceous limestone. The TOC contents are 0.61%–1.23%, with an average of 0.98%; and the equivalent Ro values are 1.16%–1.20%.
4.2 n-Alkanes and isoprenoids
The distribution and relative contents of the n-alkanes can usually provide geochemical information such as the kerogen type and depositional environment. As shown in Figure 3, the distribution of the n-alkanes in the O2-3s and O3y source rocks is n-C12 to n-C32, exhibiting a unimodal distribution, and the dominant peak carbon number is n-C15 to n-C16 (Figure 3). The relative content of n-alkane compounds with carbon numbers of n-C12 to n-C26 accounts for the majority (Figure 4A). An unresolved complex mixture (UCM) was observed during the gas chromatography (GC) analysis of the Є1y source rocks and Cambrian bitumen samples, indicating that biodegradation had occurred (Ross et al., 2010). The distribution of the n-alkanes in the Є1y source rocks is n-C16–n-C32, exhibiting a unimodal distribution, and the dominant peak carbon number is n-C18 to n-C21 (Figure 3). The relative content of n-alkane compounds with carbon numbers of n-C16 to n-C26 accounts for the majority (Figure 4B). The distribution of the n-alkanes in the Є1w and Є2s bitumen is n-C16–n-C31, exhibiting a bimodal distribution, and the dominant peak carbon number is n-C18 to n-C19 (Figure 3). The relative content of the n-alkane compounds with carbon numbers of n-C16 to n-C29 accounts for the majority (Figure 4C). Compared with the Cambrian source rocks, the Ordovician source rocks have a higher content of low carbon number (<17) n-alkanes. The high carbon number n-alkane (n-C25 to n-C35) contents of the bitumen samples and source rocks are low, indicating the input of marine algae organic matter (Ebukanson and Kingh, 1986; Murray and Boreham, 1992).
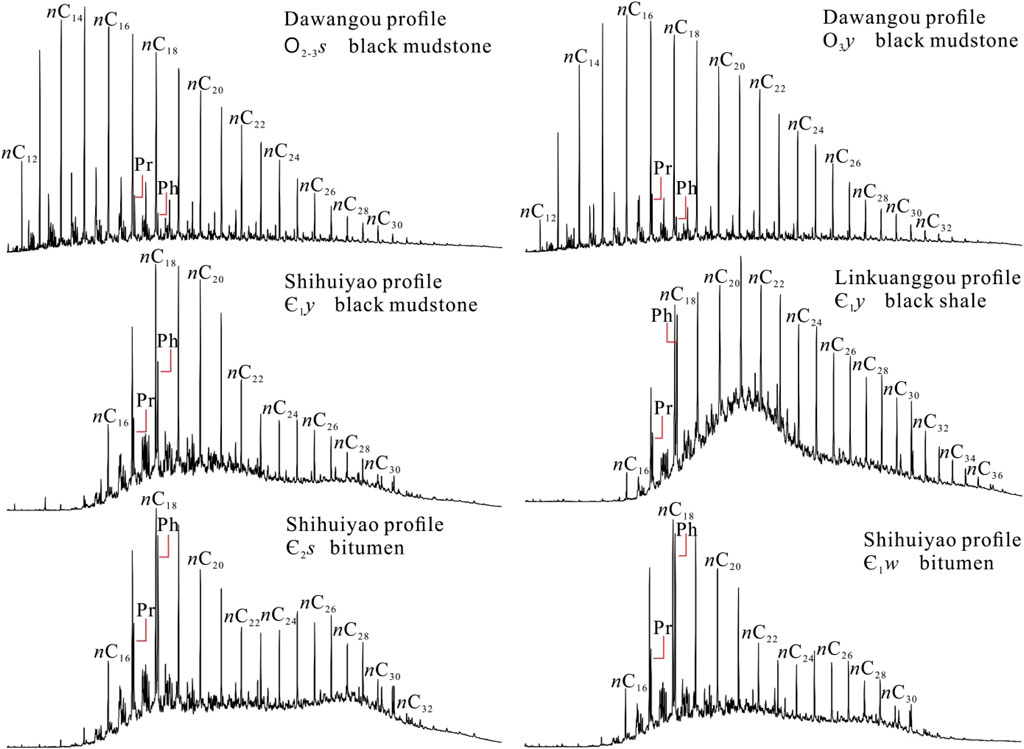
FIGURE 3. Gas chromatograms of selected source rock and bitumen samples.
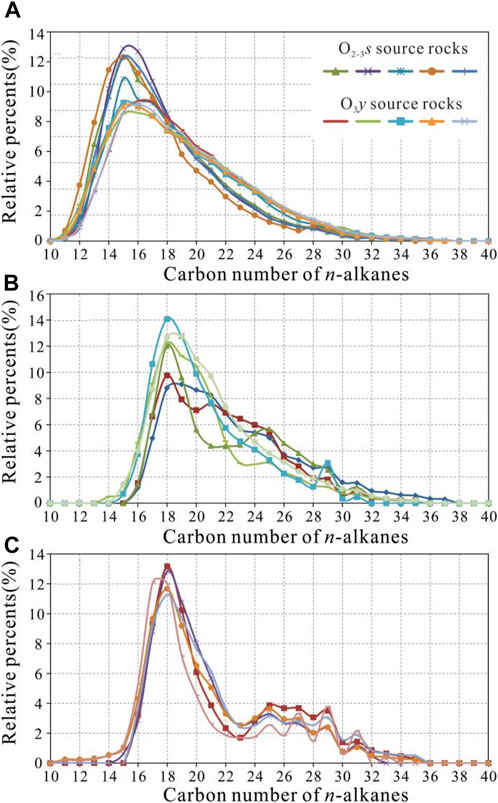
FIGURE 4. Distributions of n-alkanes in the source rocks and bitumen samples. (A) Ordovician source rocks; (B) Є1y source rocks; (C) bitumen samples.
The Pr/Ph ratio has been widely used as an indicator of the source of organic matter and the redox conditions of the sedimentary environment (Large and Gize, 1996). Pr/Ph ratio of >3.0 indicates that the main source of the organic matter is terrestrial plants (oxidizing conditions) (Peters et al., 2005). The extremely high Pr/Ph ratio may result from contamination. As another possibility, the contribution of particular biological precursors in shallow marine environments may be also responsible for the higher Pr/Ph ratio. Under anoxic conditions, the Pr/Ph values are low (<1.0) (Zhang and Huang, 2005), while under suboxic conditions, the values range from 1.0 to 3.0 (Waseda and Nishita, 1998). As shown in Table 3, the Pr/Ph ratios of the O3y and O2-3s source rocks are 2.21–2.37 and 1.86–1.96, respectively. The Cambrian source rock and bitumen samples exhibit a low Pr/Ph ratio (<0.6). The results indicate that the sedimentary environment of the source rock samples and the bitumen-producing source rocks was anoxic. The results show that the source rock samples and the bitumen-producing source rocks were deposited in an anoxic environment.
The low Pr/n-C17 and Pr/Ph ratios indicate that the source rocks of bitumen and the Є1y source rocks mainly involved the input of marine organic matter, while the Ordovician source rock samples were different (Figure 5A). The higher Pr/Ph values of Ordovician source rocks may be related to the contribution of particular biological precursors. The plot of Pr/n-C17 versus Ph/n-C18 can be used to assess the sedimentary environment and the organic matter type of source rocks (Shanmungam, 1985; Hanson et al., 2000). As shown in Figure 5B, the bitumen and Є1y source rock samples were deposited in a reducing environment, and the organic matter mainly came from algae. The characteristics of the bitumen and the Є1y source rocks are similar (Figure 5).
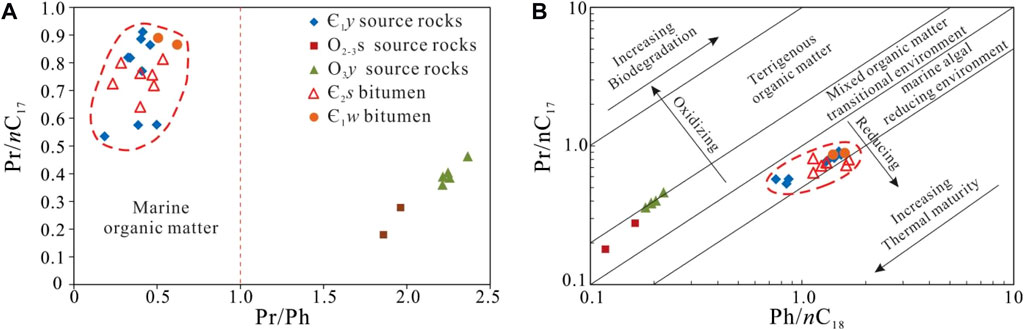
FIGURE 5. Crossplots for source rock and bitumen samples, including (A) Pr/n-C17 versus Pr/Ph (modified from Hakimi and Ahmed, 2016), showing sedimentary conditions and type of organic matter; and (B) Ph/n-C18 versus Pr/n-C17 (modified from Shanmungam, 1985).
4.3 Tricyclic terpanes and pentacyclic terpanes
Some of the tricyclic terpenoids (TTs) and hopanes are shown in Figure 6. TTs with carbon numbers of C19 to C31 were detected in most of the samples (Figure 6). A high abundance of TTs is an obvious feature of marine source rocks and marine-derived oils (Philp and Gilbert, 1986), and these compounds may be originated from prasinophycean algae such as Tasmanite (Simoneit et al., 1990; Greenwood et al., 2000) or Leiosphaeridia (Dutta et al., 2006).
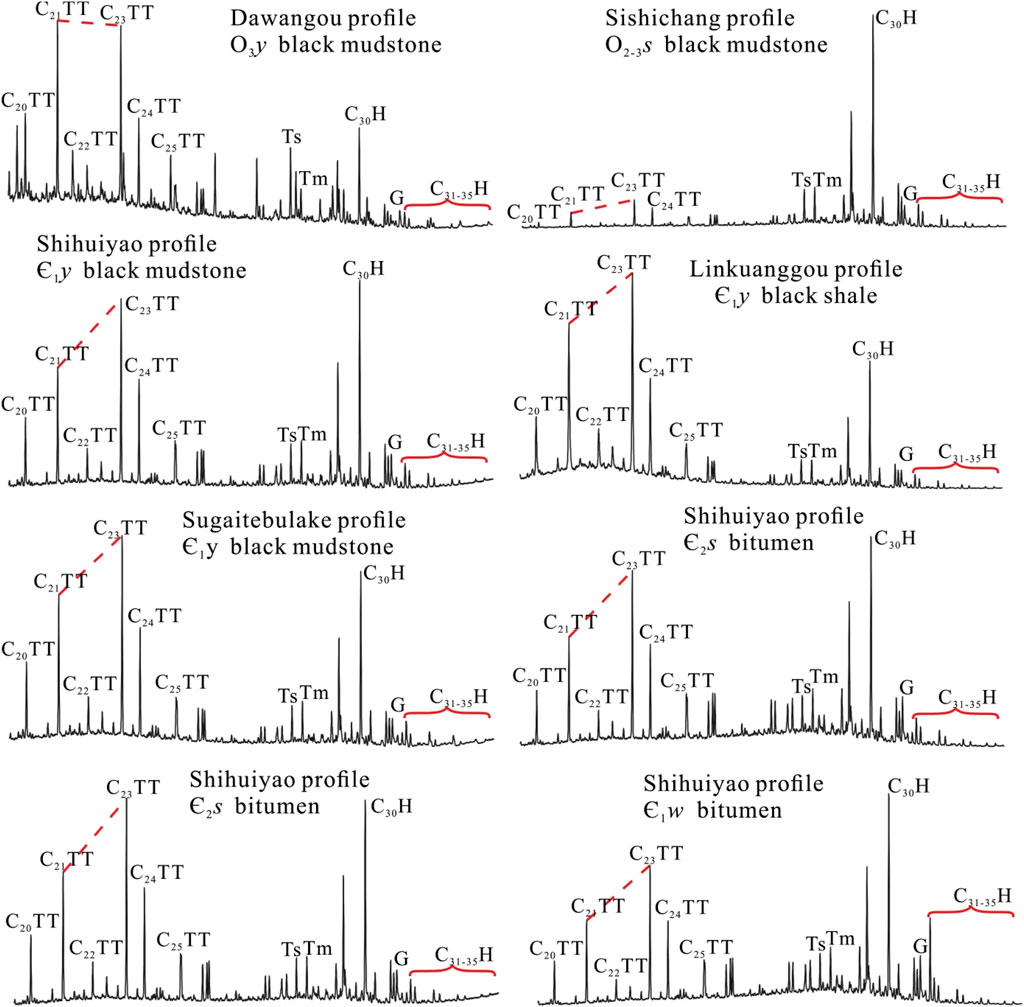
FIGURE 6. Typical mass chromatograms for terpane of source rocks and bitumen (m/z = 191). TT: tricyclic terpane; H: hopane; G: gammacerane.
Although short-chain tricyclic terpenoids are easily generated in the high maturity stage, terpanes are more resistant to thermal maturity than hopanes (Peters, 2000; Alberdi et al., 2001). Since the proportion of the C23 component in tricyclic terpenoids decreases with increasing maturity, it can be used to evaluate maturity (Peters and Moldowan, 1993; Farrimond et al., 1999). The distribution of tricyclic terpanes in all source rock and bitumen samples is as follows: C23>C21>C20 (C21/C23<1, C20/C21<1) (Figures 6, 7A; Table 3).
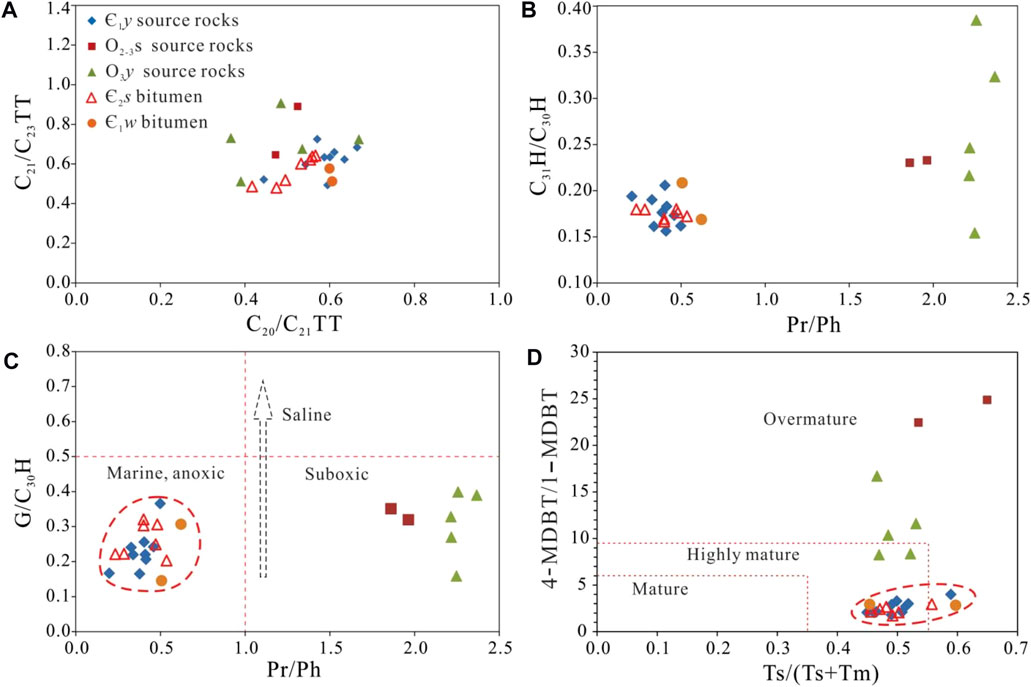
FIGURE 7. Crossplots among various terpanes biomarker parameters for source rock and bitumen samples. (A) C20TT/C23TT—C23TT/C21TT, (B) Pr/Ph—C31H22R/C30H, (C) Pr/Ph—G/C30H (revised after Tao et al., 2015), (D) 4-/1-MDBT—Ts/(Ts+Tm). TT: tricyclic terpanes; HH: homohopane; C31H: C31 hopane; C30H: C30-αβ hopane; G; gammacerane.
Extended hopanes (C31 hopane to C35 hopane) are usually influenced by the oxidative capacity of the sedimentary environment (Peters et al., 2005). The homohopanes (HH) are generally thought to be considered to originate from C35 hopanoids (Waples and Machihara, 1991; Peters et al., 2005). In this study, the homohopane distribution exhibits a decreasing trend from C31 to C35 (Figure 6). The plot of Pr/Ph versus C31 hopane 22R/C30-αβ hopane (C31H/C30H) is usually used to distinguish between the source rocks of different strata. As shown in Figure 10B, the bitumen and Є1y source rock results plot within a relatively concentrated area (Figure 7B).
Gammacerane (G) was originally identified in the bitumen of the Green River shale (hypersaline environment) (Henderson and Steel, 1971). A high content of gammacerane can indicate a saline-hypersaline environment (Hanson et al., 2000; Holba et al., 2003; Summons et al., 2008). The dominance of C30H is associated with clay-rich source rocks (Peters et al., 2005). The salinity of the sedimentary water can be effectively reflected by the gammacerane index (G/C30H). As shown in Figure 7C, the paleosalinity of the depositional environments of the Ordovician and Cambrian source rocks was similar, and the bitumen and Є1y source rock samples were deposited in an anoxic marine environment (Tao et al., 2015).
4.4 Steranes
The C27–C29 regular steranes and C21, C22 steranes (m/z = 217) are recognized on the key ion (m/z = 217) chromatograms (Figure 8). The C27 regular steranes are generally believed to originate from algae and aquatic organisms (Huang and Meinschein, 1979), and the C28 steranes may be related to the input of organic matter from phytoplankton (Moldowan and Talyzina, 1998), while the C29 regular steranes are typical steroids related to terrestrial plants (Volkman, 1986; Moldowan and Talyzina, 1998). The relative abundance of the regular C27–C28–C29 steranes is usually used to predict the sedimentary environment and the main source of organic matter (Moldowan et al., 1985). Moreover, even under strong thermal evolution, the relative peak heights of C27–C28–C29 steranes are still effective in oil-source correlation. As shown in Figure 8, the peak heights of the regular steranes in the Cambrian and Ordovician source rock and bitumen samples exhibit the following characteristics order: C27>C28<C29 (Figure 8), resulting in a V-shaped pattern. This indicates that the organic matter in both the source rock and bitumen samples came from marine sediments (ten Haven et al., 1988).
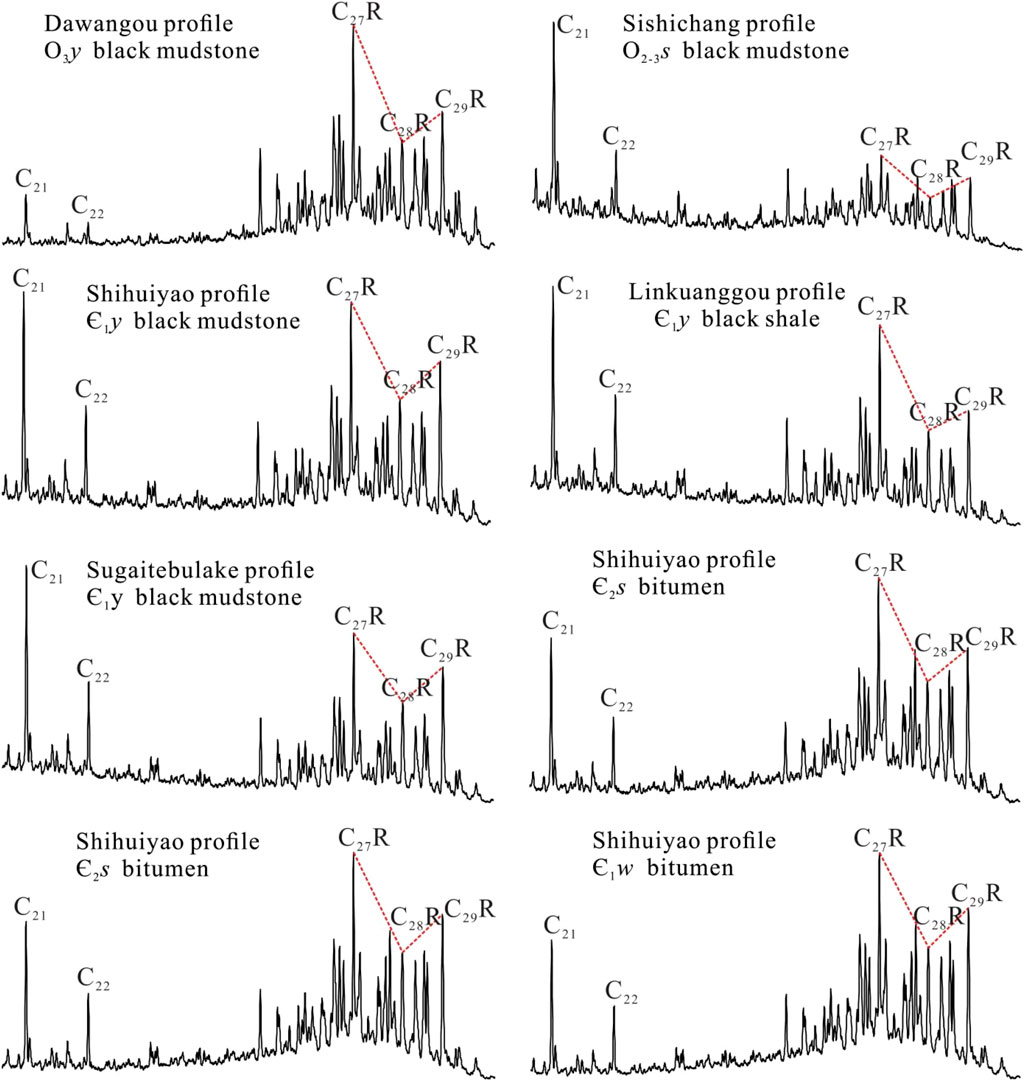
FIGURE 8. Typical mass chromatograms for sterane of source rocks and bitumen (m/z = 217). RS: regular steranes.
As shown in Figure 9A, the relative abundances of the regular C27, C28, and C29 steranes in the Ordovician source rocks exhibit the order of C27>C28<C29, while the order of most of the Є1y source rock and bitumen samples is C27>C28>C29 (Figure 9A; Table 4). The ternary diagram shows the relative contents of the C27–C28–C29 regular steranes (Figure 9B). The relative contents of the C27 regular steranes in the O3y, O2-3s, and Є1y source rocks and bitumen samples are 37.07%–57.59%, 32.97%–39.50%, 34.58%–40.15%, and 32.94%–42.55% (Table 4), respectively, which also indicates that the parent source of the two sets of source rocks and bitumen was mainly marine sediments (Li et al., 2017).
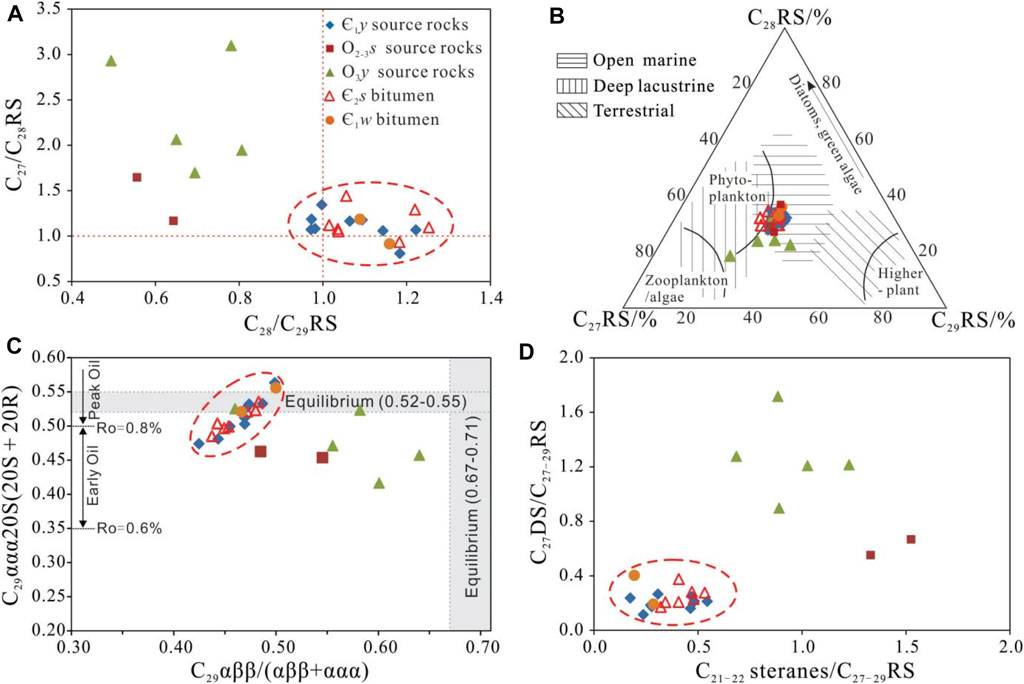
FIGURE 9. Several cross plots of sterane biomarker ratios, including (A) C28/C29 versus C27/C28 regular steranes, (B) Ternary diagram of regular steranes (C27-C28-C29) indicating the relationship between sterane compositions (modified from Huang and Meinschein, 1979), (C) C29 αββ/(αββ+ααα) versus C29 ααα20S/(20S + 20R), (D) C21-22 steranes/C27-29 regular steranes versus C27 diasteranes/C27-29 regular steranes. RS: regular steranes; DS: diasteranes.
The C29 ααα20S/(20S+20R) and C29 αββ/(αββ+ααα) parameters are usually used to predict the maturity of source rocks and oil (Mackenzie and McKenzie, 1983; Mackenzie et al., 1984; Peters et al., 1999). As depicted in Figure 9C, the distribution of the Є1y source rocks is consistent with that of the bitumen, both of which are quite different from that of the Ordovician source rocks.
C21 and C22 steranes are highly resistant to biodegradation due to the absence of an alkyl side chain (Dutta et al., 2013). It is generally believed that diasteranes originated from steroids catalyzed by clay minerals (Rubinstein et al., 1975; Gürgey, 1999). An oxic environment is conducive to the formation of diasteranes (Peters and Moldowan, 1993), and the contents of diasteranes increase with increasing maturity (Zumberge, 1987). The C27 diasteranes/C27-29 regular sterane ratios of the Ordovician source rocks are 0.67–1.72, while those of the Є1y source rocks and bitumen are relatively low, ranging from 0.12 to 0.40 (Figure 9C; Table 4). The above evidence indicates that there are differences in the clay content, sedimentary environment, and/or thermal evolution of the Cambrian and Ordovician source rocks.
4.5 Polycyclic aromatic hydrocarbons
TAS, MP, and DBT are aromatic hydrocarbon compounds that have been widely used in assessing thermal maturity (Radke, 1988; Chakhmakhchev et al., 1997; Kruge, 2000) and defining the depositional environment (Hughes et al., 1995; Radke et al., 2000). Triaromatic dinosteroids (TDS) have specific biogenic significance (Zhang et al., 2000a). Dinosterol, the precursor of dinosteroids (dinosterane and triaromatic dinosteroids), is derived almost entirely from dinoflagellates (Volkman et al., 1990; Volkman, 1998), so dinosterane can almost be considered to be molecular biological fossils of dinoflagellates (Zhang et al., 2000b).
It has been concluded that the C26-TAS 20S, C26-TAS 20R + C27-TAS 20S, C27-TAS 20R, and TDS contents of the Cambrian source rocks in the Tarim Basin are very high. By contrast, the crude oil derived from the Ordovician source rocks contains high contents of C28-TAS 20S and C28-TAS 20R but almost no TDS (Mi et al., 2007). However, the analysis of the Cambrian and Ordovician outcrop source rock samples from the Keping area shows that the contents of these compounds are relatively high in both types of source rocks (Figure 10). Therefore, such compounds cannot be used to distinguish between the Cambrian and Ordovician source rocks in the Keping area.
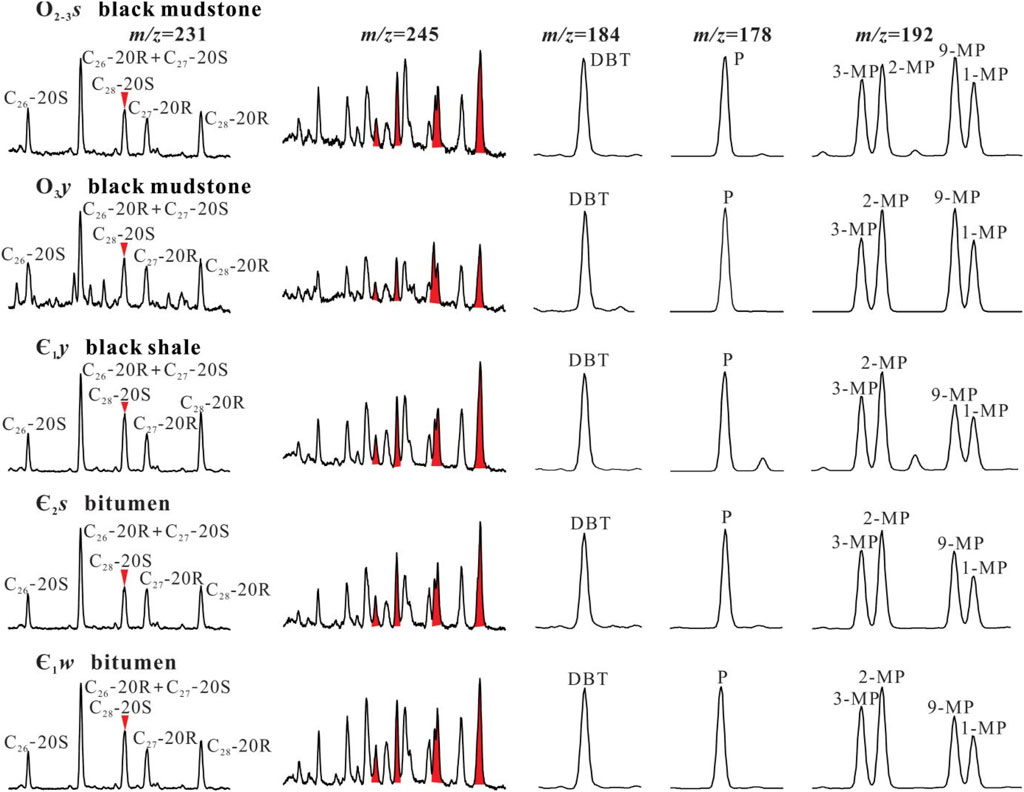
FIGURE 10. Gas chromatograms showing TAS (m/z = 231), TDS (m/z 245), DBT (m/z = 184) and MP (m/z = 192) for source rock and bitumen samples (The red labeled peaks in m/z = 245 are TDS).
The plot of dibenzothiophene/phenanthrene (DBT/P) versus Pr/Ph (Figure 11A) can be used to discriminate between different source rock lithologies and sedimentary environments (Hughes et al., 1995). As shown in Figure 11A, the O2-3s and O3y source rock samples cluster fairly close together in zone 3, corresponding to a source from marine or lacustrine shales (Figure 11A), while the Є1y source rock and bitumen samples cluster fairly close together in zone 2.
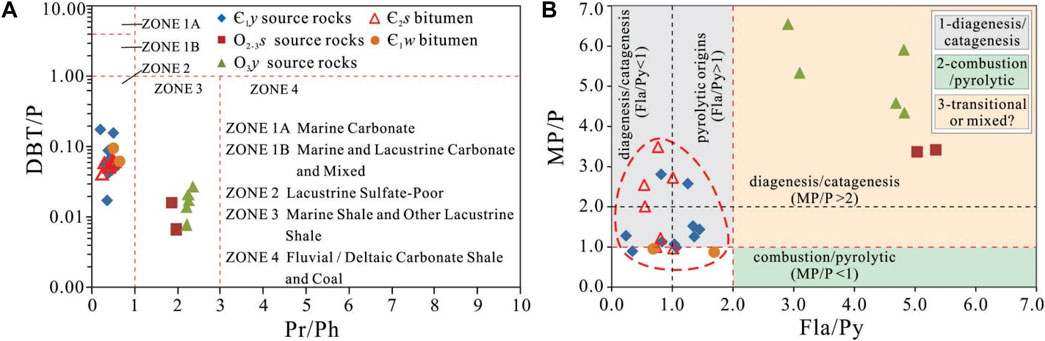
FIGURE 11. Crossplots among various PAHs biomarker parameters: (A) DBT/P versus Pr/Ph (revised after Hughes et al., 1995), (B) Fla/Py versus MP/P.
The plot of Fla/Py versus MP/P can also be used to distinguish between the Є1y and Ordovician source rocks, and the bitumen samples have a good correlation with the Є1y source rocks (Figure 11B).
5 Discussion
5.1 Maturity of organic matter
In the epigenetic stage, the C2718α (H)-trisnorhopane (Ts) is more resistant to degradation than the C2717α (H)-trisnorhopane (Tm) (Seifert and Moldowan, 1978). Although the Ts/(Ts+Tm) ratio is usually affected by the sedimentary facies of the organic matter and is especially sensitive to clay minerals (Moldowan et al., 1986), it is still widely used as a maturity parameter, and the ratio increases with increasing maturity. The maturity parameters of dibenzothiophene series compounds have become effective indexes for evaluating the molecular maturity of marine carbonate rocks and their hydrocarbon molecules in the high to over-mature stage. 4, 6-DMDBT/1, 4-DMDBT, 2, 4-DMDBT/1, 4-DMDBT, and 4-MDBT/1-MDBT (DMDBT: dimethyl dibenzothiophene; MDBT: methyl dibenzothiophene) and other maturity parameters had been proposed by researchers (Schou and Myhr, 1988; Chakhmakhchev et al., 1997; Luo et al., 2011).
The plot of Ts/(Ts+Tm) versus 4-/1-MDBT can also be used to distinguish between the Cambrian and Ordovician source rocks. The Ts/(Ts+Tm) ratios of the Є1y and Middle-Upper Ordovician source rock and bitumen samples are 0.45–0.59, 0.46–0.54, and 0.46–0.60, respectively (Figure 7D; Table 3). The distributions of the data points for the bitumen and Є1y source rocks are consistent (Figure 7D).
In this study, the Ts/(Ts+Tm) ratios of the Є1y and Ordovician source rocks are similar, but their 4-/1-MDBT ratios are quite different, ranging from 1.80 to 34.21. In addition, the Є1y source rocks in well LT1, which have ratios of 2.5–13.83, also exhibit similar characteristics (Yang et al., 2020). It is speculated that the reason for this phenomenon is that the source rock samples from the Keping area were collected from different profiles, especially Є2s, and the samples were collected from the Sishichang and Dawangou profiles. These two profiles are geographically far away from each other and may have experienced different weathering environments and different thermal evolution processes. Hence, this parameter may be not properly used as a maturity parameter (at least not proper for Cambrian source rocks).
The isomerization values of diasteranes and regular steranes are usually used to measure the maturity and the degree of degradation of organic matter. The regular sterane isomerization parameters, C29 ααα20S/(20S+20R) and C29 αββ/(αββ+ααα), increase as the degree of thermal evolution of the organic matter increases. During diagenetic evolution, the C29 ααα20S/(20S+20R) and C29 αββ/(αββ+ααα) ratios can reach the equilibrium endpoints of 0.52–0.55 and 0.67–0.71, respectively (Seilfert and Moldowan, 1986). For the samples in this study, the C29 ααα 20S/(20S+20R) ratios of the bitumen and the Є1y and Ordovician source rocks are 0.49–0.56, 0.47–0.56, and 0.42–0.53, respectively; and their C29 αββ/(αββ+ααα) ratios are 0.44–0.50, 0.42–0.50, and 0.46–0.64, respectively (Figure 12B; Table 4). These C29 αββ/(αββ+ααα) ratios are not within the equilibrium range of 0.67–0.71, which is inconsistent with the medium-high maturity revealed by the equivalent Ro values of 1.03%–1.42%.
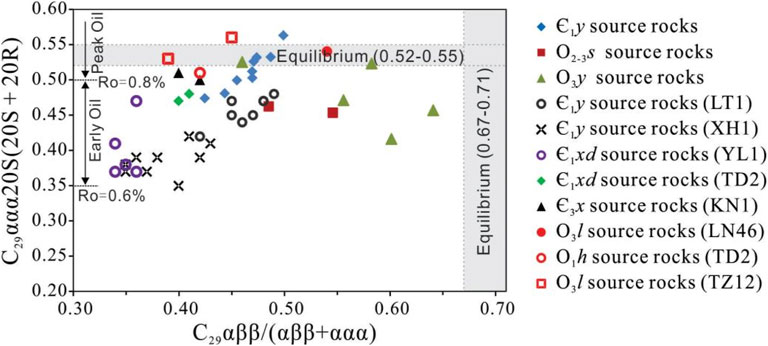
FIGURE 12. Crossplot of C29 αββ/(αββ+ααα) versus C29 ααα20S/(20S + 20R) (modified from Justwan et al., 2006). Vitrinite reflectance estimates after correlations in (Waples and Machihara, 1990; Peters and Moldowan, 1993). Data of well LT1 cited by Zhu et al. (2022), other wells cited by Chen et al. (2018).
The biomarker characteristics of some of the drilled source rocks in the basin are shown in Figure 12. The C29 ααα20S/(20S+20R) and C29 αββ/(αββ+ααα) ratios of the drilling samples shown in the plot are 0.34–0.51 and 0.33–0.49, respectively, which do not reach the equilibrium endpoint. They are also inconsistent with the actual maturity of the samples. For example, the Є1y (Є1xd) source rocks in wells LT1, XH1, and YL1 in the northern Tarim Basin are in the high maturity stage with equivalent Ro values of 1.4%–1.7% (Zhu et al., 2022), 1.39%–1.71% (Yang et al., 2016), and 1.73%–1.99% (Yang et al., 2016), respectively, which are higher than those of the Cambrian and Ordovician source rocks in the Keping area. However, the corresponding presumed maturity on the plot is 0.6%–0.8%. The Є1xd source rocks from well TD2, which are in the high maturity stage and have equivalent Ro values of 2.63%–2.95%, exhibit the same characteristics (Ma et al., 2005). The C29 ααα20S/(20S+20R) ratios of the Ordovician source rocks in wells LN46, TD2, and TD12 are close to the equilibrium endpoint. However, only the maturity of the O3l source rocks in wells LN46 and TZ12 is consistent with the chart for Justwan (1.10% (Yang et al., 2016) and 0.81%–1.30% (Zhou, 2019), respectively). The O1h source rock in well TD2 is currently in the over-mature stage, with equivalent Ro values of 2.44%–2.65% (Ma et al., 2005), and is no longer in the peak stage of oil generation.
Huang and Li (2018) suggested that this is because the evolution trend of the steranes may be reversed in the high maturity stage, and isomerization may exhibit immature configurations. Thus, it can be inferred that the maturity of the bitumen-producing source rock was lower than that of the current Є1y source rocks during the hydrocarbon generation period, which may be in the medium maturity stage.
5.2 Sedimentary environment
5.2.1 Saturated hydrocarbons
The Pr/Ph, Pr/n-C17, and Ph/n-C18 ratios are commonly used to analyze depositional environments and oil origins (Peters and Moldowan, 1993). Low values of these ratios (<1.0) have been recognized to be indicative of anoxic conditions (Peters et al., 2005). The Pr/Ph ratios of the Є1y source rocks and bitumen samples from the Keping area are less than 1.0, and the Pr/n-C17 and Ph/n-C18 ratios are 0.53–0.89 and 0.75–1.66, respectively. The plots of Pr/n-C17 versus Pr/Ph and Pr/n-C17 versus Ph/n-C18 indicate that the bitumens originated from marine source rocks deposited in a reducing environment with algal microbial input (Figure 5A; 5B). It is obvious that the Cambrian reservoir bitumen and the source rock of the Yurtusi Formation have a good relationship. The relatively low Pr/Ph, Pr/n-C17, and Ph/n-C18 ratios indicate a strongly anoxic sedimentary environment with a large amount of marine organic matter input for the Є1y source rocks and the source rocks of these bitumens (Peters et al., 2005). This is also confirmed by the ternary diagram of the regular steranes (Figure 9B).
The biomarker data for the Ph/n-C18 and Pr/n-C17 ratios and regular steranes C27–C28–C29 of some drilled Cambrian source rocks and crude oil from the Cambrian strata in the platform basin area are compared here (Figure 13). As shown in Figure 13, the sedimentary backgrounds of the Cambrian source rocks in the Keping area, Tadong area (well TD2), and Tabei area (wells LT1, XH1, YL1, and TS1) are similar, and all of these rocks were deposited in a reducing marine environment with algae organic matter input. Moreover, the crude oil samples from the Cambrian strata in wells TD2, XH1, and TS1 are well correlated with the Cambrian source rocks (Figure 13A). Therefore, it can be inferred that the Є1y mudstones might have contributed significantly for crude oil accumulation in the basin.
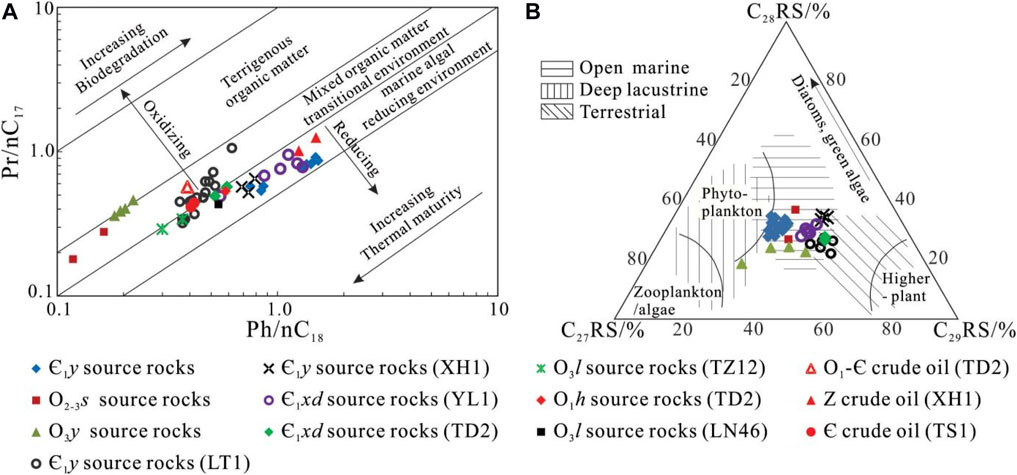
FIGURE 13. (A) Ph/n-C18 versus Pr/n-C17 (modified from Shanmungam, 1985), (B) Ternary diagram of regular steranes (C27-C28-C29) (modified from Huang and Meinschein, 1979). Data sources: LT1 Є1y source rocks (Yang et al., 2020; Zhu et al., 2022); XH1 Є1y source rocks (Yang et al., 2016); YL1 Є1xd source rocks (Yang et al., 2016); TD2 Є1xd source rocks (Yang et al., 2016); TD2 O1-Cam crude oil (Zhai et al., 2007); TS1 Cambrian crude oil (Zhai et al., 2007); XH1 Sinian crude oil (Han, 2021). RS: regular steranes.
5.2.2 Aromatic compounds
P) and DBT are formed during diagenesis and in the early stages of maturation. Reducing conditions are more favorable to the formation of DBT and lead to an increase in the DBT/P ratio (Li et al., 2017). It should be noted that all of the data points for the bitumen and Є1y source rocks plot in zone 2. Hughes et al. (1995) initially defined Zone 2 on the DBT/P versus Pr/Ph plot as the lacustrine sulfate-poor environment (Figure 11A). Since there is no evidence to prove the existence of lacustrine deposition in the study area, it is speculated that not only the lacustrine reducing conditions but also marine environments may produce sulfur-poor conditions, resulting in low DBT/P ratios.
Isomer ratios such as MP/P and Fla/Py have been widely used to distinguish between PAHs with diagenetic and combustion/pyrogenic origins (Prahl and Carpenter, 1983; Soclo et al., 2000; Yunker et al., 2002; Zakir Hossain et al., 2013). The high abundances of four-, five-, and six-ring PAHs are usually produced by combustion/pyrogenic processes (Oros and Simoneit, 2001; Oros et al., 2006; Denis et al., 2012). Fla and Py are usually produced from petroleum and mature kerogen (Yunker et al., 2002). Prahl and Carpenter (1983) reported that MP/P values of <1 indicate combustion or pyrolytic processes. MP/P values of >2 indicate diagenetics/catagenic sources (Garrigues et al., 1995; Budzinski et al., 1997). Fla/Py ratios of >1 have been proposed to be characteristic of pyrolytic origins, and values of <1 indicate petroleum-sourced PAHs (Sicre et al., 1987; Baumard et al., 1998).
The MP/P and Fla/Py ratios of the Є1y source rock and bitumen samples are 0.87–3.49 and 0.24–1.69, respectively. Most of the MP/P ratios are >1 (Table 4). However, the MP/P and Fla/Py ratios of the Ordovician source rocks are 3.37–6.54 and 2.91–5.43, respectively (Table 4). The plot of Fla/Py versus MP/P can be used to distinguish between the Cambrian and Ordovician source rocks (Figure 11B). Based on Figure 5B; Figure 11B, they have similar sedimentary environments and/or organic matter inputs. Plot of Pr/n-C17 versus Ph/n-C18 shows that the sedimentary environment of the Cambrian source rocks (Figure 5B) was a reducing marine environment. Therefore, it is possible to define MP/P values of >1 as the interval of diagenesis or catagenesis (fossil fuel or petroleum sources), and the range of the Fla/Py ratios indicates that petroleum-sourced PAHs can be modified to 0–2. Thus, we define MP/P values of >1 and Fla/Py values of <2 as diagenetically derived PAHs (region 1 in Figure 11B) and MP/P values of <1 and Fla/Py values of >2 as combustion/pyrogenic-derived PAHs (region 2 in Figure 11B). Region 3 in Figure 11B can be defined as reflecting a transitional or mixed source input area.
6 Conclusion
A total of 25 samples, including source rocks and bitumen, were analyzed via gas chromatography-mass spectrometry (GC-MS) to determine the oil-source correlation between the reservoir bitumen and the Cambrian-Ordovician source rocks in the Keping area. The comprehensive evaluation results reveal that the bitumen samples were most likely derived from the Є1y source rocks in the Keping area, NW Tarim Basin.
The Є1y, O2-3s, and O3y source rocks, which have high TOC contents of 0.38%–4.30% and equivalent Ro values of 1.04%–1.43%, are well developed in this area. Compared with the source rock samples drilled in the platform basin area, it can be inferred that the Є1y source rocks are a set of high-quality source rocks that are widely distributed in the basin and have considerable exploration prospects.
The carbon number distribution characteristics of the n-alkanes in the bitumen and Є1y source rocks are similar, and n-C12 –n-C16 n-alkanes are absent, while the characteristics of the Ordovician source rocks are the opposite. The plots of Pr/n-C17 versus Pr/Ph, Ph/n-C18 versus Pr/n-C17, and DBT/P versus Pr/Ph and several parameters, including G/C30H and C27–C28–C29 regular steranes, indicate that the Є1y source rocks and the bitumen-producing source rocks were deposited in a reducing marine sedimentary environment with considerable algal input. The Є1y source rocks and the bitumen-producing source rocks exhibit a good correlation. The plot of Ph/n-C18 versus Pr/n-C17 and the ternary diagram of the regular steranes show that the depositional environment and organic matter source of the Є1y source rocks in the Keping area are basically the same as those of the Cambrian source rocks and the related oil inside the basin. The O2-3s and O3y source rocks are more representative of mixed organic matter sources.
The Є1y source rock and bitumen samples have higher C28/C29 regular sterane ratios (>1) than Ordovician source rocks (<1). The Pr/Ph ratios also exhibit similar features, i.e., the Pr/Ph ratios of the Є1y source rocks and the bitumen samples are 0.19–0.62, while those of the Ordovician source rocks are 1.86–2.37. Abnormally lower C29 ααα20S/(20S+20R) and C29 αββ/(αββ+ααα) ratios were observed for the Cambrian and Ordovician source rocks in the Keping area and in boreholes inside the basin, which may indicate that the sterane evolution trend may be reversed in the high maturity stage, and the isomerization could exhibit immature configurations.
The plots of DBT/P versus Pr/Ph and Fla/Py versus MP/P also demonstrate that the Cambrian bitumen was produced from the Є1y source rocks. The low DBT/P ratios of the Є1y and Ordovician source rocks may indicate that not only reducing lacustrine conditions but also marine environments can cause sulfur-poor conditions. The plot of Fla/Py versus MP/P defines MP/P values of >1 and Fla/Py values of <2 as diagenetically derived PAHs, and MP/P values of <1 and Fla/Py values of >2 as combustion/pyrogenic-derived PAHs and can be used to identify the source of the PAHs in the strata to a certain extent.
Biomarker parameters that are generally considered to be useful for distinguishing between Cambrian and Ordovician source rocks, such as the C21/C23 TTs ratio, C27–C28–C29 regular sterane peak shape, TAS, and TDS, are not applicable in the Kepin area. For the bitumen and Cambrian-Ordovician source rocks in the Kepin area, these biomarker parameters exhibit the same characteristics, i.e., C21/C23<1, V-shaped C27–C28–C29 regular sterane peaks, and high C26-20S, C26-20R + C27-20S, C27-20R TAS, and TDS contents.
Data availability statement
The datasets presented in this study can be found in online repositories. The names of the repository/repositories and accession number(s) can be found in the article/Supplementary material.
Author contributions
SX: Conceptualization, Resources, Writing–original draft. JW: Formal Analysis, Visualization, Writing–review and editing. NW: Formal Analysis, Visualization, Writing–original draft. QX: Investigation, Visualization, Writing–review and editing.
Funding
The author(s) declare financial support was received for the research, authorship, and/or publication of this article. This work is supported by the Key Laboratory of Tectonics and Petroleum Resources (China University of Geosciences), Ministry of Education, Wuhan 430074, China (grant number TPR-2022-12), and the National Nature Science Foundation of China (Grant numbers 42202150).
Conflict of interest
The authors declare that the research was conducted in the absence of any commercial or financial relationships that could be construed as a potential conflict of interest.
The reviewer RY declared a shared affiliation with the author JW to the handling editor at time of review.
Publisher’s note
All claims expressed in this article are solely those of the authors and do not necessarily represent those of their affiliated organizations, or those of the publisher, the editors and the reviewers. Any product that may be evaluated in this article, or claim that may be made by its manufacturer, is not guaranteed or endorsed by the publisher.
References
Alberdi, M., Moldowan, J. M., Peters, K. E., and Dahla, J. E. (2001). Stereoselective biodegradation of tricyclic terpanes in heavy oils from the Bolivar Coastal Fields, Venezuela. Org. Geochem. 32, 181–191. doi:10.1016/S0146-6380(00)00130-3
Baumard, P., Budzinski, H., and Garrigues, P. (1998). Polycyclic aromatic hydrocarbons in sediments and mussels of the western Mediterranean Sea. Environ. Toxicol. Chem. 17, 765–776. doi:10.1002/etc.5620170501
Budzinski, H., Jones, I., Bellocq, J., Piérard, C., and Garrigues, P. H. (1997). Evaluation of sediment contamination by polycyclic aromatic hydrocarbons in the Gironde estuary. Mar. Chem. 58, 85–97. doi:10.1016/s0304-4203(97)00028-5
Cai, C., Li, K., Ma, A., Zhang, C., Chen, L., Worden, R. H., et al. (2009b). Distinguishing cambrian from upper ordovician source rocks: evidence from sulfur isotopes and biomarkers in the Tarim Basin. Org. Geochem. 40, 755–768. doi:10.1016/j.orggeochem.2009.04.008
Cai, C., Zhang, C., Cai, L., Wu, G., Chen, L., Xu, Z., et al. (2009a). Origins of palaeozoic oils in the Tarim Basin: evidence from sulfur isotopes and biomarkers. Chem. Geol. 268, 197–210. doi:10.1016/j.chemgeo.2009.08.012
Chakhmakhchev, A., Suzuki, M., and Takayama, K. (1997). Distribution of alkylated dibenzothiophenes in petroleum as a tool for maturity assessments. Org. Geochem. 26, 483–489. doi:10.1016/S0146-6380(97)00022-3
Chen, Z., Wang, T.-G., Li, M., Yang, F., and Cheng, B. (2018). Biomarker geochemistry of crude oils and Lower Paleozoic source rocks in the Tarim Basin, western China: an oil-source rock correlation study. Mar. Pet. Geol. 96, 94–112. doi:10.1016/j.marpetgeo.2018.05.023
Cheng, B., Wang, T.-G., Chen, Z., Chang, X., and Yang, F. (2016). Biodegradation and possible source of silurian and carboniferous reservoir bitumens from the halahatang sub-depression, Tarim Basin, NW China. Mar. Pet. Geol. 78, 236–246. doi:10.1016/j.marpetgeo.2016.09.023
Deng, Q. (2021). Sedimentary geochemical records and organic matter accumulation mechanisms in the Sinian-lower Cambrian strata: case studies in South China and the Tarim Basin, NW China. University of Chinese Academy of Sciences. (in Chinese with English Abstract).
Denis, E. H., Toney, J. L., Tarozo, R., Anderson, R. S., Roach, L. D., and Huang, H. (2012). Polycyclic aromatic hydrocarbons (PAHs) in lake sediments record historic fire events: validation using HPLC-fluorescence detection. Org. Geochem. 45, 7–17. doi:10.1016/j.orggeochem.2012.01.005
Dutta, S., Bhattacharya, S., and Raju, S. V. (2013). Biomarker signatures from Neoproterozoic-Early Cambrian oil, western India. Org. Geochem. 56, 68–80. doi:10.1016/j.orggeochem.2012.12.007
Dutta, S., Greenwood, P. F., Brocke, R., Schaefer, R. G., and Mann, U. (2006). New insights into the relationship between Tasmanites and tricyclic terpenoids. Org. Geochem. 37, 117–127. doi:10.1016/j.orggeochem.2005.08.010
Ebukanson, E. J., and Kingh, R. R. F. (1986). Maturity of organic matter in the Jurassic of southern England and its relation to the burial history of the sediments. J. Pet. Geol. 9, 259–280. doi:10.1306/bf9ab65e-0eb6-11d7-8643000102c1865d
Farrimond, P., Bevan, J. C., and Bishop, A. N. (1999). Tricyclic terpane maturity parameters: response to heating by an igneous intrusion. Org. Geochem. 30, 1011–1019. doi:10.1016/S0146-6380(99)00091-1
Feng, G., and Chen, S. (1988). Relationship between the reflectance of bitumen and vitrinite in rock. Nat. Gas. Ind. 8 (3), 20–25. (in Chinese with English Abstract).
Gao, P., Lü, X., Zhang, J., Hou, G., Liu, R., Yan, H., et al. (2012). Distribution characteristics and significance of hydrocarbon shows to petroleum geology in Kalpin area, NW Tarim Basin. Energy explor. Exploit. 30, 89–108. doi:10.1260/0144-5987.30.1.89
Garrigues, P., Budzinski, H., Manitz, M. P., and Wise, S. A. (1995). Pyrolytic and petrogenic inputs in recent sediments: a definitive signature through phenanthrene and chrysene compound distribution. Polycycl. Aromat. Comp. 7, 275–284. doi:10.1080/10406639508009630
Greenwood, P. F., Arouri, K. R., and George, S. C. (2000). Tricyclic terpenoid composition of Tasmanites kerogen as determined by pyrolysis GC-MS. Geochim. Cosmochim. Ac. 64, 1249–1263. doi:10.1016/S0016-7037(99)00326-9
Gürgey, K. (1999). Geochemical characteristics and thermal maturity of oils from the Thrace Basin (western Turkey) and western Turkmenistan. J. Pet. Geol. 22, 167–189. doi:10.1111/j.1747-5457.1999.tb00466.x
Hakimi, M. H., and Ahmed, A. F. (2016). Organic-geochemistry characterization of the Paleogene to Neogene source rocks in the Sayhut subbasin, Gulf of Aden Basin, with emphasis on organic-matter input and petroleum-generation potential. AAPG Bull. 100, 1749–1774. doi:10.1306/05241615201
Han, Q. (2021). Tectonic evolution of the ancient buried hill and controls of reservois and hydrocarbon accumulation in Xinhe-sandaoqiao area of the northwest of Tarim Basin. Northwest University. (in Chinese with English Abstract).
Hanson, A. D., Zhang, S., Moldowan, J. M., Liang, D. G., and Zhang, B. M. (2000). Molecular organic geochemistry of the Tarim Basin, northwest China. AAPG Bull. 84, 1109–1128. doi:10.1306/a9673c52-1738-11d7-8645000102c1865d
Henderson, W., and Steel, G. (1971). Isolation and characterization of a triterpenoid alcohol from the Green River shale. J. Chem. Soc. - Chem. Commun. 21, 1331–1332. doi:10.1039/c29710001331
Holba, A. G., Dzou, L. I., Wood, G. D., Ellis, L., Adam, P., Schaeffer, P., et al. (2003). Application of tetracyclic polyprenoids as indicators of input from fresh-brackish water environments. Org. Geochem. 34, 441–469. doi:10.1016/S0146-6380(02)00193-6
Hu, S., Wilkes, H., Horsfield, B., Chen, H., and Li, S. (2016). On the origin, mixing and alteration of crude oils in the Tarim Basin. Org. Geochem. 97, 17–34. doi:10.1016/j.orggeochem.2016.04.005
Huang, H., and Li, J. (2018). Biomarker signatures of sinian bitumens in the moxi-gaoshiti bulge of sichuan basin, China: geological significance for paleo-oil reservoirs: discussion. Precambrian Res. 314, 487–491. doi:10.1016/j.precamres.2018.05.012
Huang, H., Zhang, S., and Su, J. (2016). Palaeozoic oil–source correlation in the Tarim Basin, NW China: a review. Org. Geochem. 94, 32–46. doi:10.1016/j.orggeochem.2016.01.008
Huang, W., and Meinschein, W. G. (1979). Sterols as ecological indicators. Geochim. Cosmochim. Ac. 43, 739–745. doi:10.1016/0016-7037(79)90257-6
Hughes, W. B., Holba, A. G., and Dzou, L. I. P. (1995). The ratios of dibenzothiophene to phenanthrene and pristane to phytane as indicators of depositional environment and lithology of petroleum source rocks. Geochim. Cosmochim. Ac. 59, 3581–3598. doi:10.1016/0016-7037(95)00225-O
Jin, Z., Liu, Q., and Yun, J.Tenger (2017). Potential petroleum sources and exploration directions around the Manjar Sag in the Tarim Basin. Sci. China Earth Sci. 60, 235–245. doi:10.1007/s11430-015-5573-7
Justwan, H., Dahl, B., and Isaksen, G. H. (2006). Geochemical characterisation and genetic origin of oils and condensates in the South Viking Graben, Norway. Mar. Pet. Geol. 23, 213–239. doi:10.1016/j.marpetgeo.2005.07.003
Kang, Y., and Jia, R. (1984). Major advances in oil exploration in the Tarim Basin. Oil Gas Geol. 5, 324. (in Chinese with English Abstract).
Kruge, M. A. (2000). Determination of thermal maturity and organic matter type by principal components analysis of the distributions of polycyclic aromatic compounds. Int. J. Coal Geol. 43, 27–51. doi:10.1016/s0166-5162(99)00053-1
Large, D. J., and Gize, A. P. (1996). Pristane/phytane ratios in the mineralized Kupferschiefer of the Fore-Sudetic Monocline, southwest Poland. Ore Geol. Rev. 11, 89–103. doi:10.1016/0169-1368(95)00017-8
Li, F., Zhu, G., Lü, X., Zhang, Z., Wu, Z., Xue, N., et al. (2021). The disputes on the source of Paleozoic marine oil and gas and the determination of the Cambrian system as the main source rocks in Tarim Basin. Acta Pet. Sin. 42, 1417–1436. (in Chinese with English Abstract). doi:10.7623/syxb202111002
Li, L., Philip, R. P., and Nguyen, T. X. (2017). Origin and history of the oils in the Lawton oil field, southwestern Oklahoma. AAPG Bull. 101, 205–232. doi:10.1306/07251615167
Li, M., Wang, P., and Xiao, Z. (1999). Age-specific biomarkers profile in northwest China and geochronology of marine source rocks in the Tarim Basin. China University of Petroleum (Beijing. (in Chinese with English Abstract).
Li, M., Xiao, Z., Snowdon, L., Lin, R., Liang, D., Hou, D., et al. (2006). Migrated hydrocarbons in outcrop samples: revised petroleum exploration directions in the Tarim Basin. Org. Geochem. 31, 599–603. doi:10.1016/s0146-6380(00)00039-5
Li, Y., Xiong, Y., Liang, Q., Fang, C., Chen, Y., Wang, X., et al. (2018). The application of diamondoid indices in the Tarim oils. AAPG Bull. 102, 267–291. doi:10.1306/0424171518217073
Lin, C., Yang, H., Liu, J., Rui, Z., Cai, Z., and Zhu, Y. (2012). Distribution and erosion of the Paleozoic tectonic unconformities in the Tarim Basin, Northwest China: significance for the evolution of paleo-uplifts and tectonic geography during deformation. J. Asian Earth Sci. 46, 1–19. doi:10.1016/j.jseaes.2011.10.004
Luo, J., Cheng, K., Fu, L., Hu, Y., and Jiang, N. (2011). Alkylated dibenzothiophene index-a new method to assess thermaimaturity of source rocks. Acta Pet. Sin. 22, 39–43. (in Chinese with English Abstract). doi:10.7623/syxb200103006
Ma, A., Zhang, S., Zhang, D., and Liang, D. (2005). Organic geochemistry of TD-2 well in Tarim Basin. Xinjiang Pet. Geol. 26, 148–151. (in Chinese with English Abstract). doi:10.3969/j.issn.1001-3873.2005.02.008
Mackenzie, A. S., Beaumont, C., and McKenzie, D. (1984). Estimation of the kinetics of geochemical reactions with geophysical models of sedimentary basins and applications. Org. Geochem. 6, 875–884. doi:10.1016/0146-6380(84)90110-4
Mackenzie, A. S., and McKenzie, D. P. (1983). Isomerization and aromatization of hydrocarbons in sedimentary basins formed by extension. Geol. Mag. 120, 417–470. doi:10.1017/s0016756800027461
Mi, J., Zhang, S., Chen, J., Tang, L., and He, Z. (2007). The distribution of the oil derived from Cambrian source rocks in Lunnan area, the Tarim Basin, China. Chin. Sci. Bull. 52, 133–140. doi:10.1007/s11434-007-6004-x
Moldowan, J. M., Seifert, W. K., and Gallegos, E. J. (1985). Relationship between petroleum composition and depositional environment of petroleum source rocks. AAPG Bull. 69, 1255–1268. doi:10.1306/ad462bc8-16f7-11d7-8645000102c1865d
Moldowan, J. M., Sundararaman, P., and Schoell, M. (1986). Sensitivity of biomarker properties to depositional environment and/or source input in the Lower Toarcian of SW-Germany. Org. Geochem. 10, 915–926. doi:10.1016/S0146-6380(86)80029-8
Moldowan, J. M., and Talyzina, N. M. (1998). Biogeochemical evidence for dinoflagellate ancestors in the Early Cambrian. Science 281, 1168–1170. doi:10.1126/science.281.5380.1168
Murray, A. P., and Boreham, C. J. (1992). Organic Geochemistry in petroleum exploration. Canberra: Australian Geological Survey Organization, 230.
Oros, D. R., Radzi Bin Abas, M., Omar, N. Y., Rahman, N. A., and Simoneit, B. R. T. (2006). Identification and emission factors of molecular tracers in organic aerosols from biomass burning: Part 3. Grasses. Appl. Geochem. 21, 919–940. doi:10.1016/j.apgeochem.2006.01.008
Oros, D. R., and Simoneit, B. R. T. (2001). Identification and emission factors of molecular tracers in organic aerosols from biomass burning Part 1. Temperate climate conifers. Appl. Geochem. 16, 1513–1544. doi:10.1016/s0883-2927(01)00021-x
Peters, K. E. (2000). Petroleum tricyclic terpanes: predicted physicochemical behavior from molecular mechanics calculations. Org. Geochem. 31, 497–507. doi:10.1016/S0146-6380(00)00029-2
Peters, K. E., Clutson, M. J., and Robertson, G. (1999). Mixed marine and lacustrine input to an oil-cemented sandstone breccia from Brora, Scotland. Org. Geochem. 30, 237–248. doi:10.1016/s0146-6380(98)00216-2
Peters, K. E., and Moldowan, J. M. (1993). The Biomarker guide: interpreting molecular fossils in petroleum and ancient sediments. Englewood Cliffs: Prentice Hall, 270–271.
Peters, K. E., Walters, C. C., and Moldowan, J. M. (2005). The biomarker guide: biomarkers and isotopes in petroleum systems and Earth history. 2, second edition. Cambridge: Cambridge University Press.
Philp, R. R., and Gilbert, T. D. (1986). Biomarker distributions in Australian oils predominantly derived from terrigenous source material. Org. Geochem. 10, 73–84. doi:10.1016/0146-6380(86)90010-0
Prahl, F. G., and Carpenter, R. (1983). Polycyclic aromatic hydrocarbon (PAH)-phase associations in Washington coastal sediment. Geochim. Cosmochim. Ac. 47, 1013–1023. doi:10.1016/0016-7037(83)90231-4
Radke, M. (1988). Application of aromatic compounds as maturity indicators in source rocks and crude oils. Mar. Pet. Geol. 5, 224–236. doi:10.1016/0264-8172(88)90003-7
Radke, M., Vriend, S. P., and Ramanampisoa, L. R. (2000). Alkyldibenzofurans in terrestrial rocks: influence of organic facies and maturation. Geochim. Cosmochim. Ac. 64, 275–286. doi:10.1016/S0016-7037(99)00287-2
Ross, A. S., Farrimond, P., Erdmann, M., and Larter, S. R. (2010). Geochemical compositional gradients in a mixed oil reservoir indicative of ongoing biodegradation. Org. Geochem. 41, 307–320. doi:10.1016/j.orggeochem.2009.09.005
Rubinstein, I., Sieskind, O., and Albrecht, P. (1975). Rearranged sterenes in a shale: occurrence and simulated formation. J. Chem. Soc. Perkin Trans. 1, 1833–1836. doi:10.1039/P19750001833
Schou, L., and Myhr, M. B. (1988). Sulfur aromatic compounds as maturity parameters. Org. Geochem. 13, 61–66. doi:10.1016/0146-6380(88)90025-3
Seifert, W. K., and Moldowan, J. M. (1978). Applications of steranes, terpanes and monoaromatics to the maturation, migration and source of crude oils. Geochim. Cosmochim. Ac. 42, 77–95. doi:10.1016/0016-7037(78)90219-3
Seilfert, W. K., and Moldowan, J. M. (1986). Use of biological markers in petroleum exploration. Methods. geochem. geophys. 24, 261–290.
Shanmungam, G. (1985). Significance of coniferous rain forests and related organic matter in generating commercial quantities of oil, Gippsland Basin, Australia. AAPG Bull. 69, 1241–1254. doi:10.1306/AD462BC3-16F7-11D7-8645000102C1865D
Shi, K., Liu, B., Jiang, W., Gao, X., Liu, S., and Shen, Y. (2017). Sedimentary and evolutionary characteristics of sinian in the Tarim Basin. Pet. Res. 2, 264–280. doi:10.1016/j.ptlrs.2017.04.004
Sicre, M. A., Marty, J. C., Saliot, A., Aparicio, X., Grimalt, J., and Albaiges, J. (1987). Aliphatic and aromatic hydrocarbons in different sized aerosols over the Mediterranean Sea: occurrence and origin. Atmos. Environ. 21, 2247–2259. doi:10.1016/0004-6981(87)90356-8
Simoneit, B. R. T., Leif, R. N., Aquino Neto, F. R. D., Azevedo, D. A., and Albrecht, P. (1990). On the presence of tricyclic terpane hydrocarbons in Permian tasmanite algae. Naturwissenschaften 77, 380–383. doi:10.1007/BF01135736
Soclo, H. H., Garrigues, P., and Ewald, M. (2000). Origin of polycyclic aromatic hydrocarbons (PAHs) in coastal marine sediments: case studies in Cotonou (Benin) and Aquitaine (France) areas. Mar. Pollut. Bull. 40, 387–396. doi:10.1016/s0025-326x(99)00200-3
Summons, R. E., Hope, J. M., Swart, R., and Walter, M. R. (2008). Origin of Nama Basin bitumen seeps: petroleum derived from a Permian lacustrine source rock traversing southwestern Gondwana. Org. Geochem. 39, 589–607. doi:10.1016/j.orggeochem.2007.12.002
Tao, S., Wang, C., Du, J., Liu, L., and Chen, Z. (2015). Geochemical application of tricyclic and tetracyclic terpanes biomarkers in crude oils of NW China. Mar. Pet. Geol. 67, 460–467. doi:10.1016/j.marpetgeo.2015.05.030
Ten Haven, H. L., De Leeuw, J. W., Sinninghe Damste, J. S., Schenck, P. A., Palmer, S. E., and Zumberge, J. E. (1988). Application of biological markers in the recognition of palaeohypersaline environments. Geol. Sot. Spec. Publ. 40, 123–130. doi:10.1144/gsl.sp.1988.040.01.11
Turner, S. A. (2010). Sedimentary record of late neoproterozoic rifting in the NW Tarim Basin, China. Precambrian Res. 181, 85–96. doi:10.1016/j.precamres.2010.05.015
Volkman, J. K. (1986). A review of sterol markers for marine and terrigenous organic matter. Org. Geochem. 9, 83–99. doi:10.1016/0146-6380(86)90089-6
Volkman, J. K., Barrett, S. M., Blackburn, S. I., Mansour, M. P., Sikes, E. L., and Gelin, F. (1998). Microalgal biomarkers: a review of recent research developments. Org. Geochem. 29, 1163–1179. doi:10.1016/S0146-6380(98)00062-X
Volkman, J. K., Keamey, P., and Jeffrey, S. W. (1990). A new source of 4-methyl sterols and 5α(H)-stanols in sediments: prymnesiophyte microalgae of the genus Pavlova. Org. Geochem. 15, 489–497. doi:10.1016/0146-6380(90)90094-G
Wang, Z., and Xiao, Z. (2004). A comprehensive review of the oil source problems of marine crude oil in the Tarim Basin. Chin. Sci. Bull. 49, 1–8. (in Chinese with English Abstract).
Wang, Z., Xie, H., Chen, Y., Qi, Y., and Zhang, K. (2014). Discovery and exploration of cambrian subsalt dolomite original hydrocarbon reservoir at Zhongshen-1 Well in Tarim Basin. China Pet. Explor. 19, 1–13. (in Chinese with English Abstract). doi:10.3969/j.issn.1672-7703.2014.02.001
Waples, D. W., and Machihara, T. (1990). Application of sterane and triterpane biomarkers in petroleum exploration. Bull. Can. Pet. Geol. 38, 357–380. doi:10.2118/19824-PA
Waples, D. W., and Machihara, T. (1991). Biomarkers for geologists: a practical guide to the application of steranes and triterpanes in petroleum geology. AAPG methods Explor. Ser. 9.
Waseda, A., and Nishita, H. (1998). Geochemical characteristics of terrigenous and marine sourced oils in Hokkaido, Japan. Org. Geochem. 28, 27–41. https://10.1016/s0146-6380(97)00102-2.
Yang, F., Wang, T.-G., and Li, M. (2016). Geochemical study of Cambrian source rocks in the cratonic area of Tarim Basin, NW China. Nat. Gas. Geosci. 27, 861–872. (in Chinese with English Abstract). doi:10.11764/j.issn.1672-1926.2016.05.0861
Yang, H., Yu, S., Zhang, H., Li, T., Fan, S., Cheng, B., et al. (2020). Geochemical characteristics of Lower Cambrian sources rocks from the deepest drilling of Well LT-1 and their significance to deep oil gas exploration of the Lower Paleozoic system in the Tarim Basin. Geochimi 49, 666–682. (in Chinese with English Abstract). doi:10.19700/j.0379-1726.2021.01.017
Yang, X., Li, H., Yue, Y., Liu, S., Li, J., and Xiong, P. (2017a). The strata and palaeo-geomorphology framework at the end of neoproterozoic and development mode of source rocks at the beginning of Cambrian in Tarim Basin, China. Nat. Gas. Geosci. 2, 313–322. doi:10.1016/j.jnggs.2018.02.003
Yang, Z., Luo, P., Liu, B., Liu, C., Jie, M., and Chen, F. (2017b). The difference and sedimentation of two black rock series from Yurtus Formation during the earlist Cambrian in the Aksu area of Tarim Basin, Northwest China. Acta Petrol. Sin. 33, 1893–1918. (in Chinese with English Abstract).
Yunker, M. B., Macdonald, R. W., Vingarzan, R., Mitchell, R. H., and Sylvestre, S. (2002). PAHs in the Fraser River basin: a critical appraisal of PAH ratios as indicators of PAH source and composition. Org. Geochem. 33, 489–515. doi:10.1016/S0146-6380(02)00002-5
Zakir Hossain, H. M., Sampei, Y., and Roser, B. P. (2013). Polycyclic aromatic hydrocarbons (PAHs) in late Eocene to early Pleistocene mudstones of the Sylhet succession, NE Bengal Basin, Bangladesh: implications for source and paleoclimate conditions during Himalayan uplift. Org. Geochem. 56, 25–39. doi:10.1016/j.orggeochem.2012.12.001
Zhai, X., Gu, Y., Qian, Y., Jia, C., Wang, J., and Jun, J. (2007). Geochemical characteristics of the cambrian oil and gas in well tashen 1, the Tarim Basin. Petroleum Geol. Exp. 29, 329–333. (in Chinese with English Abstract). doi:10.3969/j.issn.1001-6112.2007.04.001
Zhang, S., Gao, Z., Li, J., Zhang, B., Gu, Y., and Lu, Y. (2012). Identification and distribution of marine hydrocarbon source rocks in the Ordovician and Cambrian of the Tarim Basin. Pet. explor. Dev. 39, 305–314. doi:10.1016/S1876-3804(12)60046-9
Zhang, S., Hanson, A. D., Moldowan, J. M., Graham, S. A., Fago, F., Chang, E., et al. (2000b). Paleozoic oil-source rock correlations in the Tarim basin, NW China. Org. Geochem. 31, 273–286. doi:10.1016/s0146-6380(00)00003-6
Zhang, S., and Huang, H. (2005). Geochemistry of Palaeozoic marine petroleum from the Tarim Basin, NW China: Part 1. Oil family classification. Org. Geochem. 36, 1204–1214. doi:10.1016/j.orggeochem.2005.01.013
Zhang, S., Huang, H., Su, J., Liu, M., Wang, X., and Hu, J. (2015). Geochemistry of Paleozoic marine petroleum from the Tarim Basin, NW China: Part 5. Effect of maturation, TSR and mixing on the occurrence and distribution of alkyl dibenzothiophenes. Org. Geochem. 86, 5–18. doi:10.1016/j.orggeochem.2015.05.008
Zhang, S., Liang, D., Li, M., Xiao, Z., and He, Z. (2002). Comparison of molecular fossils and oil sources in the Tarim Basin. Chin. Sci. Bull. 47, 16–23. (in Chinese with English Abstract). doi:10.1360/csb2002-47-S1-16
Zhang, S., Wang, F., Zhang, B., and Zhao, M. (2000a). Middle-upper ordovician source rock geochemistry of the Tarim Basin. Acta Pet. Sinia 21, 23–28. (in Chinese with English Abstract). doi:10.3321/j.issn:0253-2697.2000.06.004
Zhou, J. (2019). Geochemical characteristics and hydrocarbon accumulation model of the ordovician reservoirs in Tazhong area. China University of Petroleum. (East China) (in Chinese with English Abstract).
Zhu, G., Hu, J., Chen, Y., Xue, N., Zhao, K., Zhang, Z., et al. (2022). Geochemical characteristics and formation environment of source rock of the lower cambrian Yuertusi formationin well Luntan1 in Tarim Basin. Acta Geol. Sin. 96, 2116–2130. (in Chinese with English Abstract). doi:10.19762/j.cnki.dizhixuebao.2022285
Zhu, G., Zhang, S., Su, J., Huang, H., Yang, H., Gu, L., et al. (2012). The occurrence of ultra-deep heavy oils in the Tabei Uplift of the Tarim Basin, NW China. Org. Geochem. 52, 88–102. doi:10.1016/j.orggeochem.2012.08.012
Keywords: Tarim Basin, Keping area, Cambrian-Ordovician source rocks, bitumen, biomarker compounds, oil-source correlation
Citation: Xu S, Wang J, Wu N and Xu Q (2023) Geochemical characteristics of Cambrian bitumen and Cambrian-Ordovician source rocks in the Keping area, NW Tarim Basin. Front. Earth Sci. 11:1323705. doi: 10.3389/feart.2023.1323705
Received: 18 October 2023; Accepted: 20 November 2023;
Published: 28 December 2023.
Edited by:
Jingbin Wang, SINOPEC Petroleum Exploration and Production Research Institute, ChinaReviewed by:
Rui Yang, China University of Geosciences Wuhan, ChinaYufu Han, Tianjin University, China
Umar Ashraf, Yunnan University, China
Copyright © 2023 Xu, Wang, Wu and Xu. This is an open-access article distributed under the terms of the Creative Commons Attribution License (CC BY). The use, distribution or reproduction in other forums is permitted, provided the original author(s) and the copyright owner(s) are credited and that the original publication in this journal is cited, in accordance with accepted academic practice. No use, distribution or reproduction is permitted which does not comply with these terms.
*Correspondence: Jian Wang, d2FuZ2ppYW4yMDE3QHlhbmd0emV1LmVkdS5jbg==