 Kimberley K. Mayfield1,2,3*
 Tristan J. Horner3,4*
 Adi Torfstein5,6
 Maureen E. Auro3,4Peter W. Crockford3,4,7
 Adina Paytan1,8
- 1Department of Ocean Sciences, University of California at Santa Cruz, Santa Cruz, CA, United States
- 2Atmosphere, Earth, and Energy Division, Lawrence Livermore National Lab, Livermore, CA, United States
- 3NIRVANA Labs, Woods Hole Oceanographic Institution, Woods Hole, MA, United States
- 4Department of Marine Chemistry and Geochemistry, Woods Hole Oceanographic Institution, Woods Hole, MA, United States
- 5The Fredy and Nadine Herrmann Institute of Earth Sciences, The Hebrew University of Jerusalem, Jerusalem, Israel
- 6Interuniversity Institute for Marine Sciences, Eilat, Israel
- 7Department of Earth Sciences, Carleton University, Ottawa, ON, Canada
- 8Department of Earth and Planetary Science, University of California at Santa Cruz, Santa Cruz, CA, United States
The isotopic composition of barium (δ138Ba) has emerged as a powerful tracer of deep-ocean circulation, water mass provenance, and the oceanic Ba cycle. Although the δ138Ba of water masses is primarily controlled by the balance between pelagic barite precipitation and Ba resupply from ocean circulation, questions remain regarding the isotopic offset associated with pelagic barite formation and how the resultant Ba isotope compositions are transmitted through the water column to marine sediments. To address these questions, we conducted a time series study of dissolved, particulate, and sedimentary Ba chemistry in the Gulf of Aqaba (GOA), in the northern Red Sea, from January 2015 to April 2016. These data span significant seasonal changes in hydrography, primary productivity, and aerosol deposition, revealing three principal findings. First, the dissolved Ba chemistry of the GOA is vertically uniform across the time series, largely reflecting water mass advection from the Red Sea, with mean dissolved Ba concentrations of 47.9 ± 4.7 nmol kg−1 and mean δ138Ba = +0.55‰ ± 0.07‰ (±2 SD, n = 18). Second, despite significant variations in particulate matter composition and flux, the δ138Ba of sinking particulate Ba maintained a consistent isotope composition across different depths and over time at +0.09‰ ± 0.06‰ (n = 26). Consequently, these data imply a consistent Ba isotope offset of −0.46‰ ± 0.10‰ (±2 SD) between sinking particulates and seawater. This offset is similar to those determined in previous studies and indicates that it applies to particulates formed across diverse environmental conditions. Third, barite-containing sediment samples deposited in the GOA exhibit δ138Ba = +0.34‰ ± 0.03‰, which is offset by approximately +0.2‰ relative to sinking particles. While the specific mechanism driving this offset remains unresolved, our results highlight the importance of performing site-specific proxy validations and exercising careful site selection when applying novel paleoceanographic proxies.
1 Introduction
Barium (Ba) stable isotopes (δ138Ba [‰] = 138Ba/134Baspl./138Ba/134Bastd. – 1) are an emerging oceanographic proxy for tracing Ba utilization and deep-ocean circulation (Hsieh and Henderson, 2017; Horner and Crockford, 2021). These applications are based on the observed distribution of δ138Ba in seawater, which is sensitive to the cycling—precipitation and dissolution—of barite (BaSO4) and large-scale ocean circulation (e.g., Horner et al., 2015; Bates et al., 2017). The general assumption is that the Ba isotope composition of pelagic barite (BaSO4) is controlled primarily by the δ138Ba of the fluid source (seawater), with a near-constant Ba isotope offset. Thus, measurement of δ138Ba in barite deposits can be used to reconstruct the Ba isotope composition of ancient seawater, which is related to past Ba cycling and ocean circulation (e.g., Bridgestock et al., 2018; Crockford et al., 2019). For these applications to be robust, it is important to understand the controls on the δ138Ba of BaSO4 from source to sink—from pelagic barite formation in the water column to burial in marine sediments. However, few constraints on these processes exist in modern marine environments, highlighting the need for additional data from diverse environments.
Dissolved Ba in seawater exhibits a nutrient-like depth profile, most similar to silica or alkalinity (Chan et al., 1976; Chung, 1980; Lea and Boyle, 1989). This distribution arises because dissolved Ba is generally removed from seawater at shallower depths than where it is regenerated. Unlike silica, whose upper water column profile is dictated by biological uptake in the photic zone, the nutrient-like profile of Ba is primarily controlled by the precipitation of BaSO4 (e.g., Dehairs et al., 1980; Bishop, 1988). This observation is noteworthy because the ocean above 1,000 m is predominantly undersaturated with respect to BaSO4 (e.g., Monnin et al., 1999; Mete et al., 2023).
The prevailing hypothesis explaining BaSO4 formation is that Ba accumulates in pelagic microenvironments associated with sinking particles (e.g., Chow and Goldberg, 1960; Bishop, 1988). Barium formation in these microenvironments is likely facilitated by microbial processes, specifically through the production of extracellular polymeric substances, which can accumulate Ba and drive BaSO4 nucleation (e.g., Deng et al., 2019; Martinez-Ruiz et al., 2020; Light et al., 2023). Although the isotope effects associated with each step of this process remain to be resolved, BaSO4 formation is known to produce a significant negative fractionation of Ba isotopes of ≈ −0.3‰ (Von Allmen et al., 2010; Middleton et al., 2023a). The net effect of this process is that light Ba isotopes are preferentially incorporated into BaSO4, leaving the residual seawater enriched in isotopically heavy Ba by a corresponding amount (Horner et al., 2015; Horner et al., 2017; Cao et al., 2020a). This scenario aligns with numerous global observations documenting lower [Ba] and heavier δ138Ba in water masses that have undergone extensive BaSO4 precipitation (Bates et al., 2017; Hsieh and Henderson, 2017; Bridgestock et al., 2018; Geyman et al., 2019; Cao et al., 2020a). This scenario is also consistent with δ138Ba in sediments, which are generally isotopically lighter than the δ138Ba of seawater from which they formed by ≈ −0.5‰, a pattern observed in the South Atlantic (Bridgestock et al., 2018) and the Equatorial Pacific (Crockford et al., 2019; Middleton et al., 2023b). Likewise, co-located particles and seawater exhibit similar Ba isotope offsets on the order of −0.4 to −0.5‰, in both freshwater (Horner et al., 2017) and seawater (Horner et al., 2017; Cao et al., 2020b). Despite some progress, there remains a scarcity of measurements of δ138Ba in sinking particles and co-located seawater. Additional measurements could provide needed validation of key assumptions noted above by illuminating the sensitivity of the Ba isotope fractionation factor for pelagic BaSO4 precipitation to changes in environmental conditions or demonstrate that it is constant across space and time.
In addition to the uncertainties in isotopic fractionation of Ba during BaSO4 formation, numerous unanswered questions persist regarding the influence of deposition and burial on the δ138Ba of sedimentary BaSO4. Barite burial rates have been found to correlate with export productivity in some pelagic environments (e.g., Eagle et al., 2003; Paytan and Griffith, 2007; Griffith and Paytan, 2012), which has underpinned the use of BaSO4 accumulation as a proxy for export productivity changes over geologic timescales (e.g., Paytan et al., 1996; Ma et al., 2014; Ma et al., 2015). However, the extent to which changes in export productivity impact the δ138Ba of pelagic BaSO4 (and BaSO4 extracted from marine sediments) remains unclear.
Despite recent progress in understanding the isotopic behavior of Ba in the marine realm, several issues remain unresolved. First, few studies have directly quantified the isotopic offset between sinking particulate Ba and dissolved Ba in seawater, nor the myriad variables that may affect this offset, such as temperature, salinity, and particulate fluxes. Second, it remains unclear if changes in environmental conditions, such as variations in productivity or dust fluxes, impact the fractionation factor for pelagic BaSO4 formation. Third, these processes have not been tracked on a source-to-sink basis, where the δ138Ba of Ba is monitored in seawater, in particles through the water column, and buried into sediments.
To address these issues, we performed a time-series study of Ba chemistry in a well-studied location with continuous site characterization, the Gulf of Aqaba (GOA), in the northern Red Sea. Our study, conducted on samples collected between January 2015 and April 2016, is ideal as it extends the range of environments in which Ba cycling has been studied to a hotter, saltier basin than previous studies, while providing a wealth of ancillary data for context. Additionally, the GOA possesses essentially a single, well-mixed Ba source—northern Red Sea seawater—and is relatively shallow (800 m), simplifying the source-to-sink characterization. Specifically, we examined the Ba chemistry of GOA seawater and sinking particles, along with aerosol, groundwater, and sediment samples. Focusing on a single site throughout a time series, rather than surveying different environments, provides a unique opportunity to investigate the Ba chemistry of a single locale across large variations in lithogenic inputs, productivity, and water column conditions. This approach allows for a detailed analysis of how various factors influence Ba isotope compositions from the water column to the sediments, which is a critical step in the continued development of barium-based proxies within the marine realm.
2 Study site
2.1 Geographic and geologic setting
The Gulf of Aqaba is surrounded by arid deserts and lacks riverine inputs (Figure 1); hence, in addition to seawater exchange with the Red Sea across the Straits of Tiran, external dissolved sources of Ba are confined to limited groundwater discharge (Shellenbarger et al., 2006) and periodic flash flood events (<5 per year), which do not noticeably impact the water column chemistry (Katz et al., 2015). Terrigenous sources of particulate matter include atmospheric dust deposition and flash flood-transported sediments (Katz et al., 2015; Torfstein et al., 2017). The provenance of dust inputs to the GOA varies seasonally but is generally derived from desert regions surrounding the gulf, such as the Sahara, Negev, and Arabian deserts (Chen et al., 2007; 2008; Torfstein et al., 2017). Relative to annually averaged dust fluxes (∼28 g m−2 yr−1; Chen et al., 2008), which are some of the highest in the world, flash flood events transport an order of magnitude more solid mass to the GOA (∼830 g m−2 yr−1), but the material arrives in discrete events and is quickly deposited, not lingering in the water column (Katz et al., 2015; Torfstein et al., 2020). In this study, we assume that mineral dust and flash flood-transported sediments have a common chemical composition, since the flash floods essentially transport surficial sediments of aeolian origin from the surrounding region to the GOA (Katz et al., 2015; Torfstein et al., 2020). Likewise, despite increases in nutrient inputs to the GOA over recent decades (Lazar et al., 2008), we assume that these changes have not perturbed regional Ba chemistry (e.g., Steiner et al., 2017).
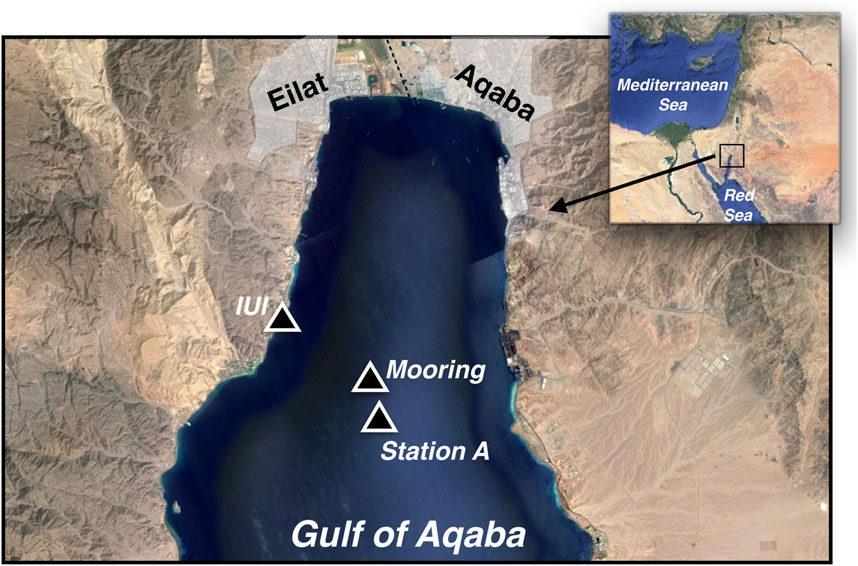
Figure 1. Map of the study area in the Gulf of Aqaba (GOA), showing key locations including the Interuniversity Institute (IUI), the sediment trap mooring site, and Station A, where dissolved samples were collected. The inset map highlights the GOA’s position at the northern end of the Red Sea.
2.2 Oceanographic setting
The GOA is the northernmost extension of the Red Sea (Figure 1) and is strongly undersaturated with respect to BaSO4 (≤25% saturation; e.g., Monnin et al., 1999; Mete et al., 2023). This undersaturation is driven by warm sea surface temperatures (20°C–28°C), high salinity, and low dissolved Ba concentrations ([Ba]; see Results Section). The only marine source of dissolved Ba to the GOA is the narrow Straits of Tiran, through which surface water with low Ba content from the Red Sea enters the GOA and deeper waters leave the basin. The GOA is ≈180 km long and on average ≈800 m deep, with an average water residence time of around 7 years (Silverman and Gildor, 2008). The GOA exhibits two distinct seasons: highly stratified, summer months (May–October) and well-mixed, winter months (November–April; Figure 2; Silverman and Gildor, 2008). During the summer, high sea surface temperatures lead to intense stratification, which minimizes mixing and causes photic zone waters to become oligotrophic (NO3− < 200 nM and PO4−3 < 60 nM), resulting in low chlorophyll-a concentrations (Chl-a ∼0.1 μg/L; Lindell and Post 1995; Labiosa et al., 2003; Figure 2). As temperatures cool, however, deep mixing (to around 300–400 m) is facilitated, bringing nutrients to the surface and surface Chl-a increases by approximately an order of magnitude (Chl-a > 1 μg/L; Lindell and Post 1995; Labiosa et al., 2003; Figure 2). During the time series relevant to this study (January 2015–April 2016), particulate organic carbon (POC) percentages of total particulate matter falling from the surface waters ranged from 7% to 32% (Torfstein et al., 2020; Figure 3).
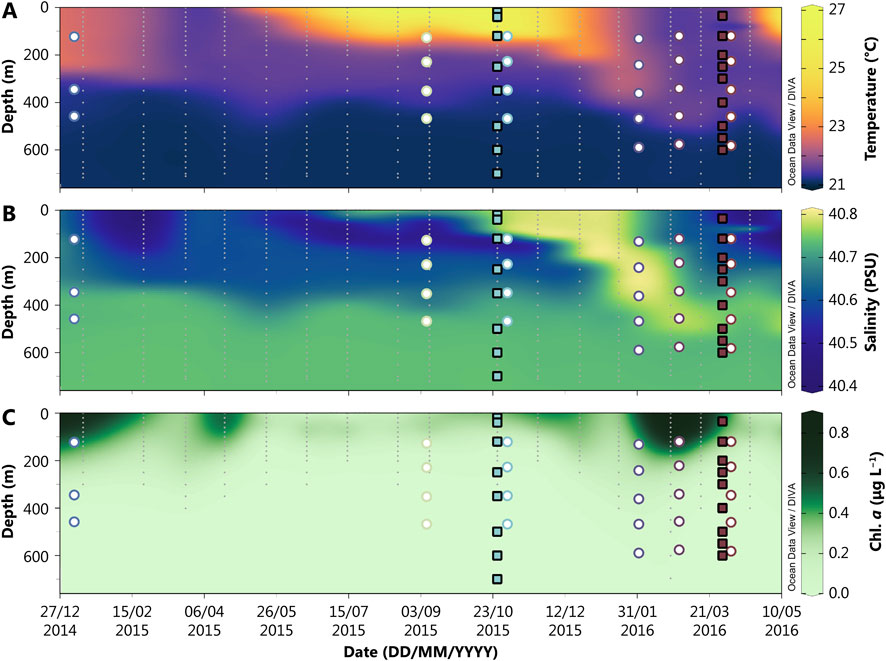
Figure 2. Hovmöller diagram displaying temperature (A), salinity (B), and chlorophyll a (C) in the Gulf of Aqaba from 2015 to 2016. Discrete hydrographic samples are marked with grey dots. Closed squares represent the times and depths where dissolved samples were collected for analysis of barium chemistry, while open circles denote the times and depths of sediment trap sample collection. The colors of the symbols correspond to the month of sampling and are consistent across subsequent figures.
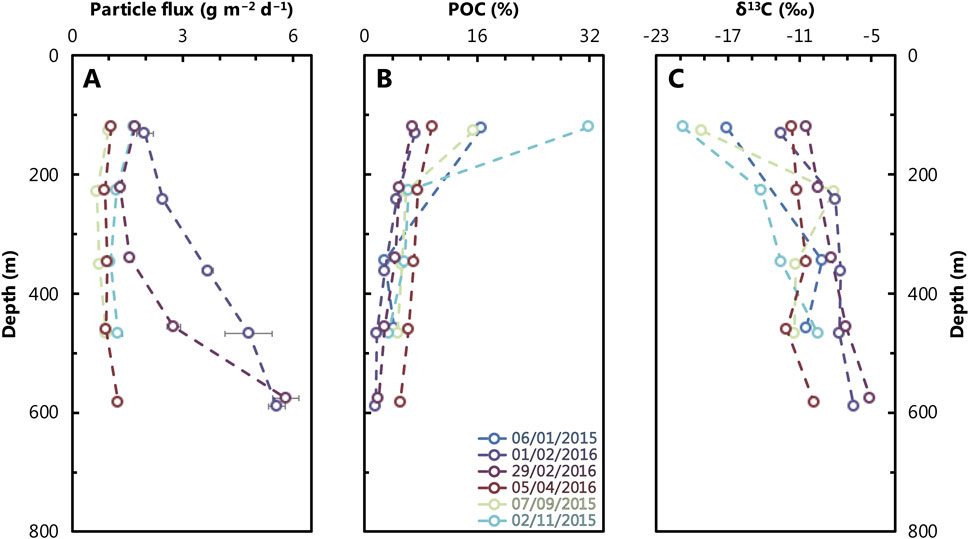
Figure 3. Depth profiles of particle flux (A), particulate organic carbon (B), and particulate carbon isotope compositions (δ13C, relative to Vienna Peedee Belemnite standard), (C) from the study site (Figure 1) in the GOA between 2015 and 2016. Color scheme follows that in Figure 2. Analytical uncertainty is within the size of the data points plotted, except for some particle flux measurements where uncertainties are shown as horizontal bars along with the individual data.
The previous work in this study area, along with the significant differences from other regions of the marine environment that have been investigated for Ba cycling, makes the GOA an ideal location to extend the understanding of Ba cycling in the water column, particles, and sediments.
3 Materials and methods
3.1 Sampling
This study builds upon the Red Sea Dust, Marine Particulates and Seawater Time Series (REDMAST) sampling campaign (Torfstein et al., 2020), which involves simultaneous sampling of aerosols at the Interuniversity Institute (IUI) for Marine Sciences in Eilat, seawater profiles at “Station A” (29° 28.95′ N, 34° 56.22′ E), and sinking particulates from a nearby sediment trap mooring (Figure 1). Further data was provided by the Israel National Monitoring Program (NMP) for the Gulf of Eilat (Shaked and Genin, 2018). Sampling is conducted on an approximately weekly (dust) and monthly (sediment traps and seawater profiles) basis, providing an exceptionally well-characterized marine setting. Seawater profiles for dissolved constituents are sampled according to GEOTRACES cruise protocols (Cutter et al., 2014). Briefly, seawater samples were collected using acid-cleaned, Teflon-coated GO-Flo bottles (General Oceanics) and transported to the IUI clean lab within 1–2 h. At the lab, samples were filtered through an acid cleaned Acropak 500 0.8/0.2 µm polyethersulfone sterile cartridge, acidified using trace metal clean 6 M HCl to a pH of ≤2, and stored refrigerated in acid-cleaned polypropylene vials.
Sediment trap samples were collected using the collection and processing methods detailed in Torfstein et al. (2020) and Chernihovsky et al. (2018). In brief, the sediment trap mooring has been deployed continuously since January 2014, proximal to Station A (Figure 1). The traps (KC Denmark A/S) were deployed at five depths: 120, 220, 340, 450, and 570 m. To minimize sample degradation during deployment, the traps were filled with a saturated brine poisoned with HgCl2. Post-retrieval sinking particles were settled and the effluent was partially decanted before sieving through a 1 mm sieve to remove large organisms. The residue (<1 mm) was rinsed three times with ultrapure water (Milli-Q) to remove salts, freeze-dried, and weighed. A split of the sample was wet sieved through a series of stainless-steel sieves (500, 125, and 63 µm mesh) and freeze-dried again. The size fraction utilized in this study was the <63 µm since BaSO4, the primary phase of particulate Ba in the water column, is generally ≤3 µm in size (Griffith and Paytan, 2012; Light and Norris, 2021).
Subsampling for this study was designed to include samples that span the largest range of primary production at our site, based on NMP records of chlorophyll concentrations. This subsampling strategy was predicted to maximize the range of biologically driven seasonality in Ba cycling. In addition to seawater and particualte samples, two aerosol samples and one coastal groundwater sample were collected as a means of characterizing the Ba isotope composition of non-marine Ba inputs to the system. The aerosol samples were from August of 2015 and January of 2016, collected as a part of studies conducted by Hartman et al. (2020) and Chien et al. (2019), respectively. The 2015 aerosol sample was collected using a total suspended particulate sampler attached to a 5-meter-long pole on the roof of the IUI. The 2016 aerosol sample was collected during a dust storm from an air filter at the IUI. The groundwater sample was collected in August of 2017 from a coastal well on the IUI campus, approximately 3 m from the high tide line and approximately 1.5 m deep, as part of this study. The salinity of the groundwater sample, however, was almost indistinguishable from local seawater and its Ba chemistry was first reported in Mayfield et al. (2021).
Finally, a sediment core was retrieved at Station A (Figure 1) using a MC-400 four-barrel multi-corer (Ocean Instruments, San Diego, CA) from a depth of ∼720 m. Two intervals from the core were analyzed, from depths of 2–5 cm and 31 cm. A well-dated sediment core from the same location (Steiner et al., 2017) constrains the deposition age of these samples to be ∼1,970–2,000 and mid-18th century, respectively; thus, these samples represent modern and pre-industrial sedimentary endmembers.
3.2 Chemical preparation
Initial sample preparation was conducted at the IUI clean lab (1,000 class with 100 class workstations) using double-distilled acids. The particulate and aerosol samples were prepared identically to one another, where ∼5 mg of bulk material was dissolved in 1 mL of aqua regia at 120°C overnight, dried down, then further dissolved in mixture of 2 mL of HF–HNO3 at 120°C overnight, and dried again. Dried samples were transported, alongside the groundwater and seawater samples, to Woods Hole Oceanographic Institution (WHOI), where they were reconstituted with 1 mL of 1 M HNO3 for multi-element (Al, P, Ba) analysis and for further preparation before Ba isotope analysis.
Sediment core samples were processed using a sequential leaching procedure designed to quantitatively separate BaSO4, along with other refractory insoluble minerals, from the sediment, as described by Gonneea and Paytan (2006). This procedure was performed on ≈15 g of sediment for each sample and included reactions with acetic acid, sodium hypochlorite, hydroxylamine, and an HF–HNO3 mixture. Each of these leaching steps was intended to dissolve specific sedimentary fractions: carbonate, organic matter, Fe–Mn oxyhydroxide, and silicate fractions, respectively. The final residue was expected to be comprised of BaSO4 and other refractory minerals. However, due to large inputs of insoluble terrigenous material into the GOA, such from aeolian dust and flood deposits) relative to authigenic minerals forming in the water column, the non-BaSO4 component constituted a significant fraction of the samples. Scanning electron microscopy (SEM) conducted with a ThermoFisher Scientific Phenom Pro G6 Desktop SEM (Figure 4) revealed that the sediment samples contained an abundance of undigested minerals. To remove at least some of this material, the post-leaching sediment fraction was wet sieved to collect the <20 µm size fraction. This fraction was assumed to contain all the pelagic BaSO4, whose crystals are generally ≤3 µm. It is important to note, however, that this <20 µm “BaSO4-containing fraction,” which was utilized for Ba isotope analysis, is primarily composed of refractory terrigenous minerals in addition to pelagic BaSO4.
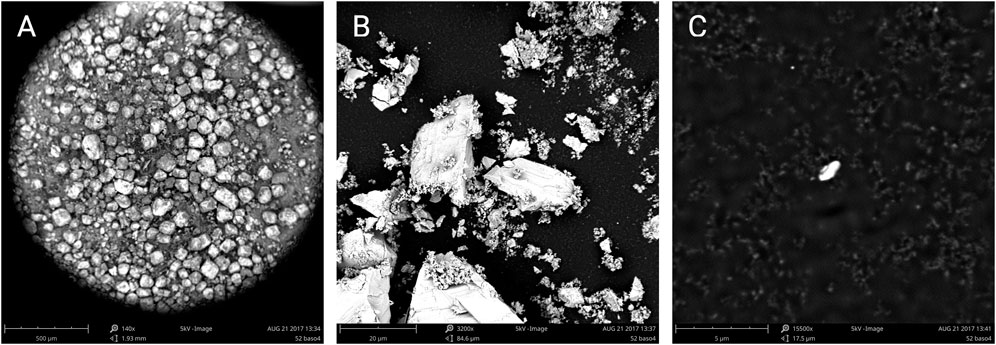
Figure 4. Scanning electron microscope images of the barite-containing fraction of GOA sediment. (A) Overview of the remaining sample at a 500 µm scale. (B) A portion of the remaining sample at a 20 µm scale. (C) A highly refractory mineral, possibly barite, at a 5 µm scale.
3.3 Multi-element and barium-isotopic analyses
Reagents used in the chemical and analytical procedures were distilled to Optima-grade standards. All particulate samples were analyzed for Ba, Al, and P concentrations on a Thermo Scientific iCAP Q quadrupole inductively coupled plasma mass spectrometer (ICP-MS) at WHOI, using an external calibration to standards of known concentration. Samples were then prepared for Ba isotope analysis using the method described by Bates et al. (2017). In brief, an aliquot containing ≈50 ng of Ba was taken from each sample and spiked with a known quantity of 135Ba–136Ba double spike solution to achieve a spike-to-sample ratio of between one and two. Samples were then equilibrated with the spike for at least 18 h. Aqueous samples were co-precipitated with Ba-free 1 M Na2CO3 solution, and the precipitate was then dissolved in 2 M HCl. Solid samples were also dried and reconstituted in 2 M HCl, at which point Ba was separated from sample matrices using a two-stage gravimetric column chemistry (Horner et al., 2015). Purified samples were analyzed in low resolution mode in the WHOI Plasma Facility using a Thermo Finnigan Neptune multiple-collector ICP-MS. A spiked standard—NIST SRM 3104a—was measured every fifth analysis and sample isotopic data are reported relative to the nearest four analyses of NIST SRM 3104a using δ138Ba notation.
Precision, accuracy, and blanks were monitored throughout the study. Analytical precision is reported as the larger of either the long-term 2 SD reproducibility (±0.03‰; Horner et al., 2015) or the measured 2 SE uncertainty obtained from sample replicate analyses (where n was between 2 and 8). Accuracy was monitored by processing reference materials through our processing pipeline alongside samples of unknown composition. In this study, we processed aliquots of G-2 (granite; United States Geological Survey), NASS-6 (seawater; National Research Council Canada), and two aliquots of SAFe D1 (#591 and #596, seawater; GEOTRACES), for which we obtained δ138Ba = +0.03 ± 0.03, +0.46 ± 0.03 +0.33 ± 0.03, and +0.33‰ ± 0.03‰, respectively (Tables 1, 2). Dissolved [Ba] for the seawater standards was determined using isotope dilution as 50.3 ± 2.5, 99.0 ± 3.0, and 99.4 ± 3.0 nmol kg−1. These values agree with published results for G-2 (+0.03‰ ± 0.03‰; Van Zuilen et al., 2016), NASS-6 (+0.51‰ ± 0.03‰, 49.2 nmol kg−1, assuming a density of 1.025 kg L−1; Tieman et al., 2020), and SAFe D1 (+0.29‰ ± 0.02‰, 99.3 nmol kg−1, Cao et al., 2020a; +0.27‰ ± 0.02‰, 99.6 nmol kg−1; Hsieh and Henderson, 2017). Procedural blanks were monitored by processing small (≤5 ng) aliquots of double spike through the entire protocol, and the quantity of processing-derived Ba was calculated using isotope dilution. These blanks are generally negligible for solid samples (≤50 pg; i.e., ≤0.1% of Ba present in a sample) but are generally higher for dissolved samples (≈0.3–1.0 ng) due to residual Ba in the Na2CO3 reagent. However, reagent blanks were considerably higher during one batch of seawater sample processing, which we discuss further in Section 4.1.
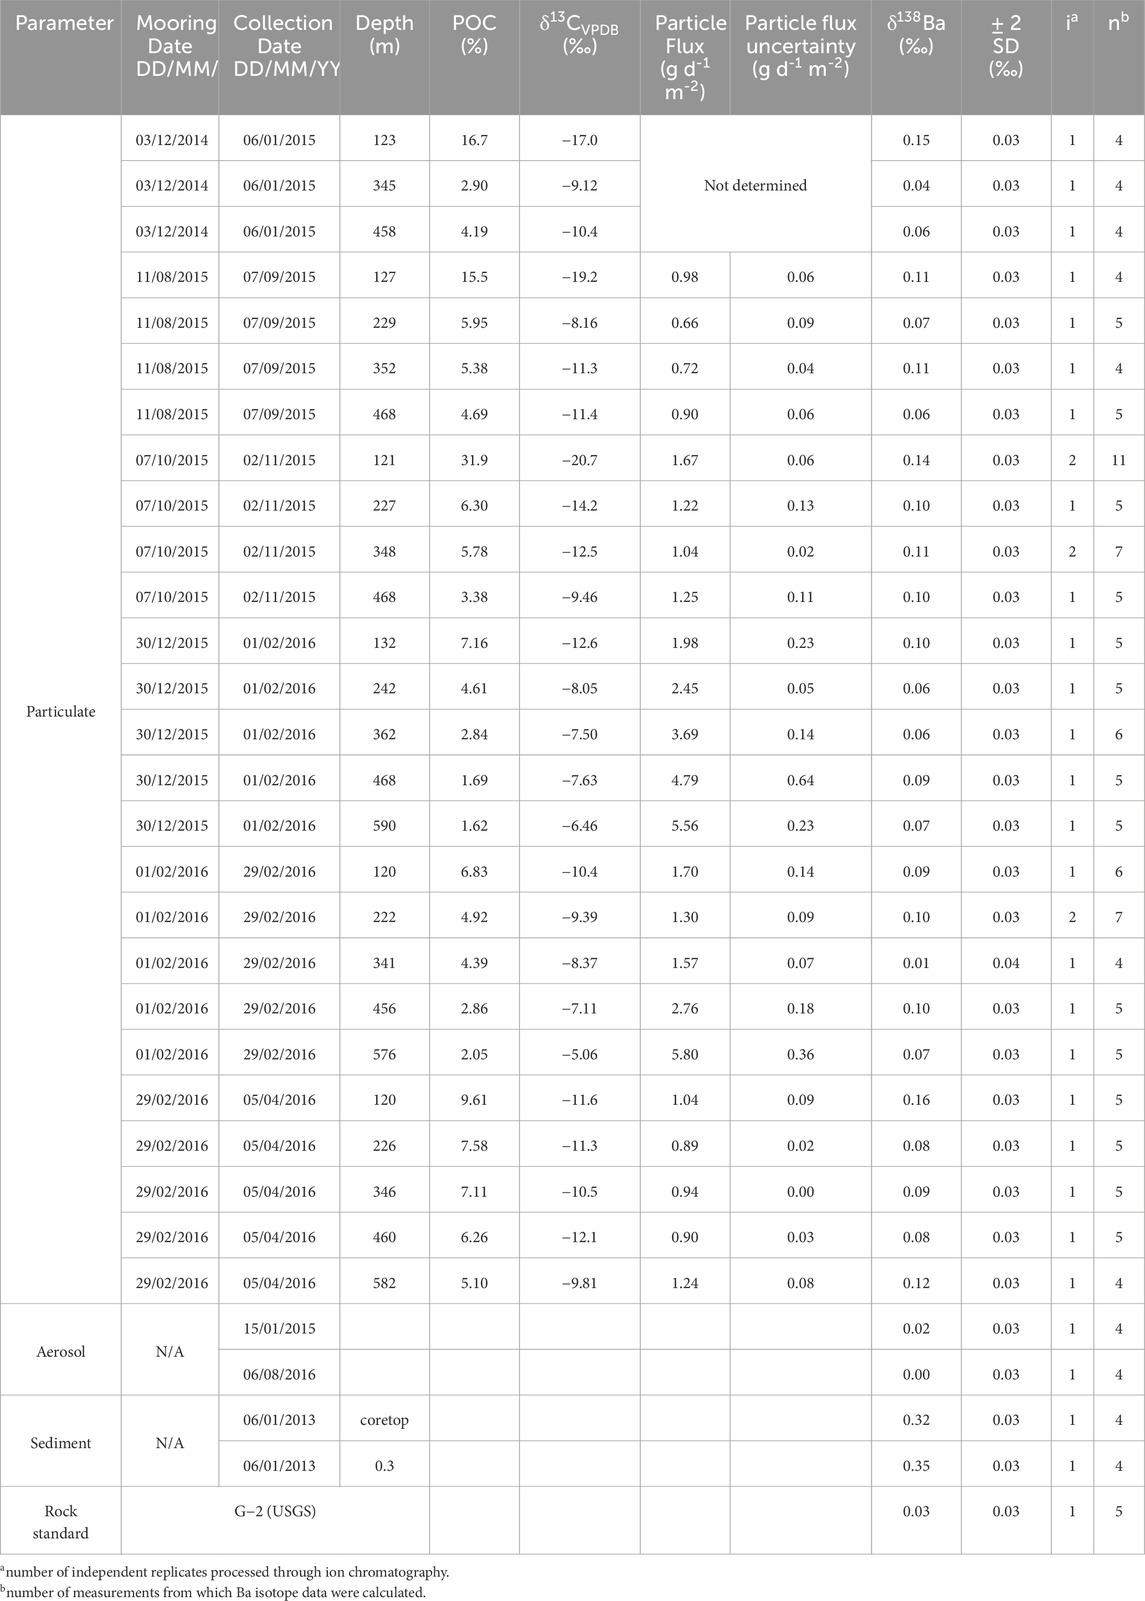
Table 1. Particulate sample data. From left-to-right, this table shows: sample collection details, particulate organic carbon contents, depth at which the sample was collected, carbon isotope compositions, bulk particle fluxes (g d−1 m−2) and their associated 1σ uncertainty, as well as barium isotope values and their associated 2 SD uncertainty. Data for other solid-phase samples are shown at the bottom of the table. Note that POC, δ13C, and particle flux data are from Torfstein et al. (2020); all other data are this study.
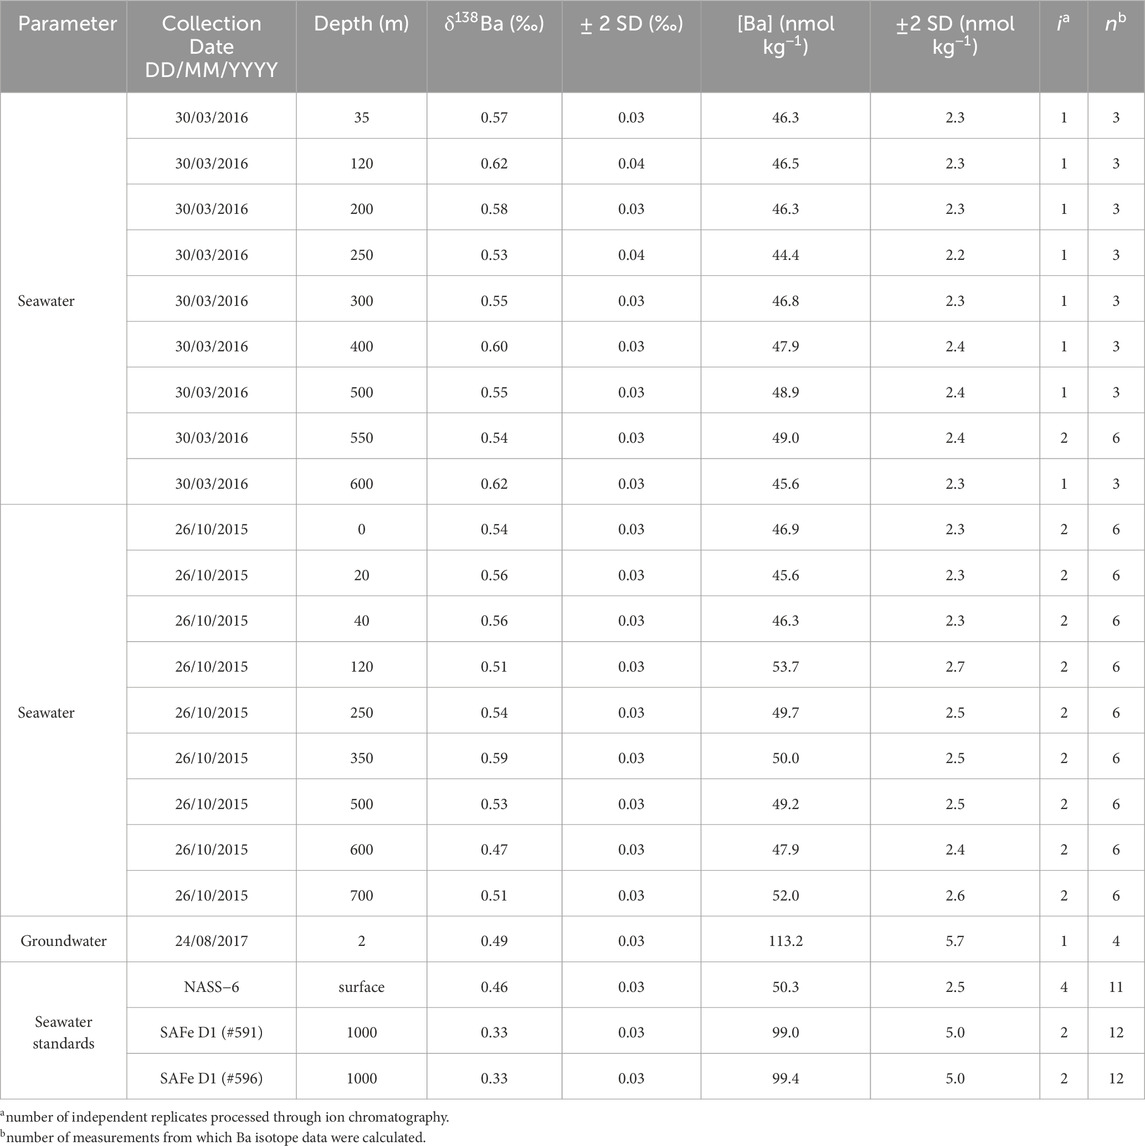
Table 2. Dissolved sample data. From left−to−right, this table shows: the sample substrate, date of collection, depth at which the sample was collected, barium isotope compositions and their associated 2 SD uncertainty, as well as barium concentration measurements and their associated 2 SD uncertainty.
4 Results
4.1 Dissolved barium chemistry in the GOA
Blank-corrected [Ba] and δ138Ba data are reported in Table 2. A typical blank correction for dissolved [Ba] processed through two-stage ion exchange chromatography is around 0.3–1.0 ng, equivalent to ≈1% of the Ba in a sample. However, during one batch of sample processing in this study, we observed that the Ba blank for seawater samples was considerably higher than usual, around 6 ng per sample, equivalent to 15% of the total Ba present in the seawater samples. This necessitated a larger-than-usual blank correction. To validate this correction, seawater samples from 26 October 2015, were re-analyzed once the blanks were more consistent with our long-term levels (0.3 ng, or 0.8% of total Ba). Results from this reprocessing yielded a mean [Ba] of 47.5 ± 5.3 nmol kg−1 (±2 SD, n = 9), which is identical, within uncertainty, to the blank-corrected values from the batch with the larger blank correction (50.6 ± 5.3 nmol kg−1; ±2 SD, n = 9).
Typically, we do not apply a blank correction to δ138Ba data. However, due to the significant magnitude of the blank correction for some seawater samples, we opted to include this correction, assuming a blank composition of 0‰ (Horner et al., 2015). As with the [Ba] data, we were able to compare the blank-corrected Ba isotope data for 26 October 2015 (mean ± 2 SD δ138Ba = +0.53‰ ± 0.06‰; n = 9), against the re-analysis with lower blanks (+0.55‰ ± 0.09‰, n = 9), again finding that the two sets of samples exhibited identical Ba isotope chemistry. In Table 2, we averaged results for 26 October 2015, from the two sets of analyses and considered their Ba chemistry as if they resulted from a single batch of processing. We likewise assume that the Ba data from 30 March 2016, which were processed only once (with the higher Ba blanks), are robust. Indeed, these samples exhibit essentially identical mean [Ba] and δ138Ba (46.8 ± 2.8 nmol kg−1 and +0.57‰ ± 0.06‰; ±2 SD, n = 9) to the samples from 26 October 2015, further suggesting that the blank correction was appropriate.
Blank-corrected dissolved [Ba] spans a narrow range between 44.4 and 56.4 nmol kg−1, with a mean from the two profiles of 47.9 ± 4.7 (±2 SD, n = 18). Assuming that GOA samples fall on the global array of δ138Ba versus 1/[Ba] (e.g., Horner and Crockford, 2021), we would expect seawater from this region to exhibit δ138Ba between +0.45 and +0.60‰. The range of δ138Ba is from +0.47 to +0.62‰, with a mean of +0.55‰ ± 0.07‰ (±2 SD, n = 18; Figure 5). The similarity of dissolved δ138Ba in the GOA to the expected values serves as an additional check on the oceanographic consistency of our data, despite the larger-than-usual blank correction.
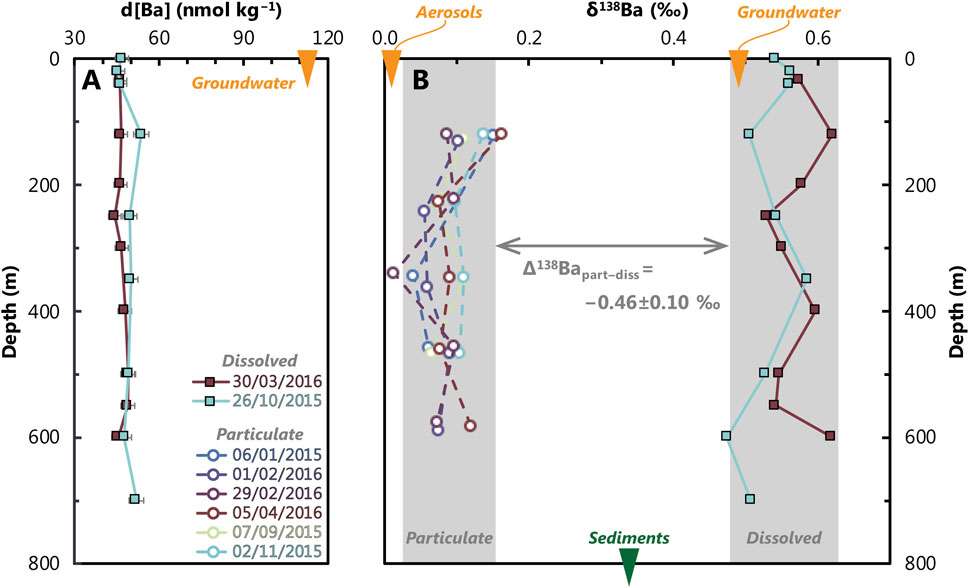
Figure 5. Depth profiles of dissolved barium concentration (d[Ba]), (A) and barium isotope (δ138Ba) values of particulate and dissolved phases (B) from the study site (Figure 1). The composition of non-marine barium sources is shown as an orange arrow at the top of each panel, while the composition of GOA sediments is marked with a green arrow at the bottom of (B). Vertical grey bars provide a visual aid for the typical range of values in the water column for 2015 to 2016. Analytical uncertainty is shown as horizontal bars in panel A; however, to reduce visual clutter, these are not shown in panel B (typical uncertainty is ± 0.03‰–0.04‰; Table 1).
4.2 Elemental and barium-isotopic patterns in sinking particulate matter
We report particle data for both element concentration (quantity per gram of sediment recovered from the traps) and particulate profiles in terms of mass flux (i.e., quantity per area per time). In the concentration profiles (Figure 6), we observe distinct patterns for particulate Al, P, and Ba. Particulate Al concentrations vary from 16 to 49 mg g−1, showing a roughly monotonic increase with depth down to 600 m. There is seasonal variation, with lower [Al] in samples collected during February and April compared to those from September and November. Particulate P concentrations are highest at the surface, up to 6.6 mg g−1, decrease sharply, and then remain constant between 2 and 3 mg g−1 below 300 m. In terms of a seasonal pattern, we observed elevated p[P] during September and November at the shallowest sediment trap. Particulate Ba concentrations (p[Ba]) are most similar to those of p[P], with minimal seasonal variation. Excluding the 121 m sample from 02/11/2015, the range of p[Ba] spans 156–386 μg g−1. Concentrations are generally flat across all seasons, except the single sample from 02/11/2015, which shows much higher p[Ba] of 881 μg g−1.
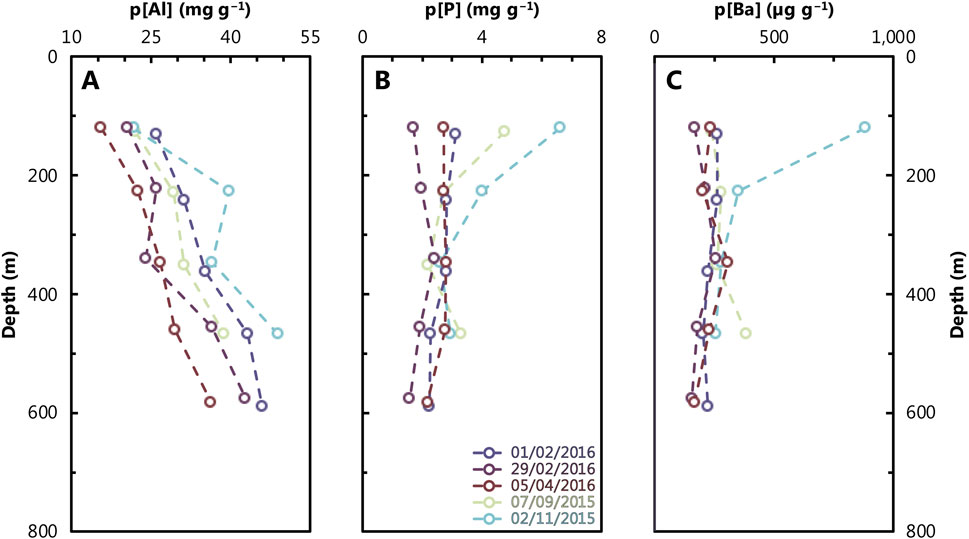
Figure 6. Depth profiles of particulate Al (A), P (B), and Ba (C) at the study site (Figure 1). Refer to Figure 2 caption for color scheme. Analytical uncertainty is within the size of the data points plotted.
Particulate Ba data are often reported as BaXS (=p[Ba] – p[Al] × Ba:AlUCC; e.g., Jacquet et al., 2005). This term refers to particulate Ba that is ‘in excess,’ of the average upper continental crust (UCC) ratio of Ba:Al, aiming to remove the contribution of aeolian particles to total particulate Ba and report only the Ba carried by bioauthigenic phases, such as organic matter and BaSO4. A commonly used UCC Ba:Al ratio is 1.28 mmol:mol (Jacquet et al., 2005). However, applying this ratio to our GOA particulate samples results in negative particulate BaXS values. Therefore, we calculate pBaXS using a Ba:Al ratio of 0.72 mmol:mol, noting that the regional Ba:Al crustal ratio must be equal to or lower than the lowest observed particulate Ba:Al of 0.72 mmol:mol (Table 3). This adjustment ensures that the lowest pBaXS in our GOA profiles is 0 mol. However, to avoid using an ad hoc Ba:Al ratio, we chose to report our data as total particulate Ba. Nevertheless, the correlation between total pBa and pBaXS yields an R2 = 0.96, indicating that the trends between these two properties are nearly identical.
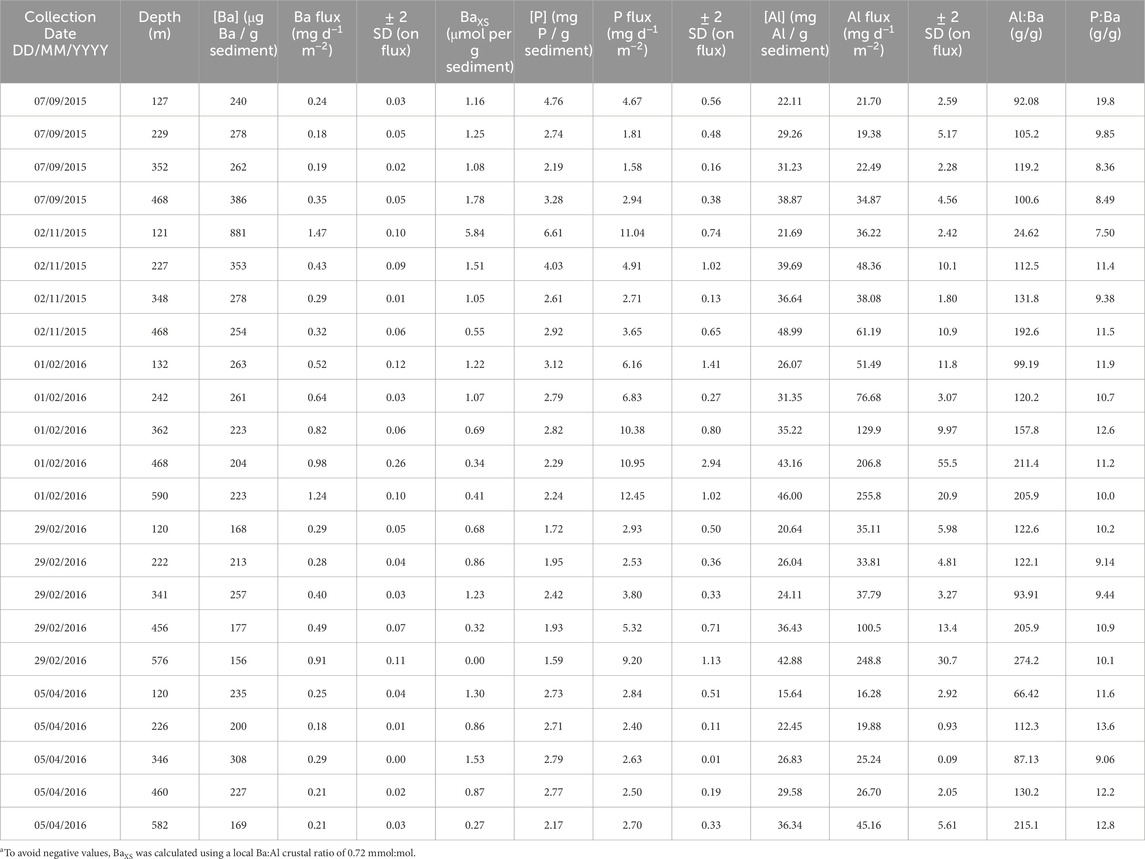
Table 3. Particulate multi−element data. This table shows: date of sample collection, depth at which the sample was collected, as well as the concentration and flux (and associated 2 SD uncertainty) for Ba, Al, and P. The final two columns show ratios of particulate Al:Ba and P:Ba.
The mass flux of Al, P, and Ba (Figure 7) is strongly influenced by the total particle flux (Figure 3). In general, the total particle flux increases with depth, with the highest fluxes observed in February 2016. Consequently, the fluxes of particulate Al, P, and Ba also increase with depth and show the same seasonal pattern as the total mass flux. An exception is the surface sample from November 2015, which exhibits very high particulate P and Ba fluxes, that are coincident with high POC content and low δ13C, indicating that this material is most likely of a biological origin.
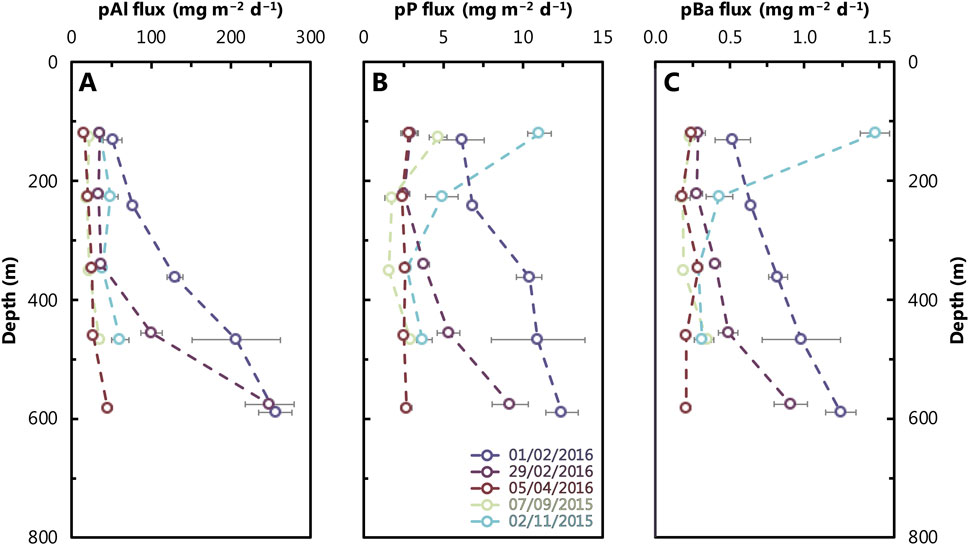
Figure 7. Depth profiles of particulate Al (A), P (B), and Ba (C) fluxes at the study site (Figure 1). Refer to Figure 2 caption for color scheme. Analytical uncertainty is within the size of the data points plotted, except for some measurements where uncertainties are shown as horizontal bars along with the individual data points.
Despite significant changes in the concentration and flux of Al, P, and Ba, we observe no discernible trends in the distribution of particulate δ138Ba across the time series (Figure 5). Regardless of the time of year, productivity, or overall mass flux, the isotope composition of particulate Ba remains essentially constant at +0.09‰ ± 0.06‰ (±2 SD, n = 26). Given the invariant dissolved δ138Ba of +0.55‰ ± 0.07‰, we calculate the average particulate–dissolved offset for Ba isotopes, Δ138Bapart–diss (≡ δ138Bapart−δ138Badiss), in the GOA to be −0.46‰ ± 0.10‰ (Figure 5).
We further investigated potential trends between the flux of different phases using property–property plots (Figure 8). There is no obvious correlation between the concentration of particulate Ba and Al (R2 = 0.04). Similarly, there is no discernible correlation between particulate δ138Ba and the particulate Al:Ba ratio (R2 = 0.03). Although there is a strong correlation between p[Ba] and p[P] (R2 = 0.73), no relationship is observed between particulate δ138Ba and the particulate P:Ba ratio (R2 = 0.01). This latter observation suggests that while the presence of biogenic particles can influence the flux of particulate Ba, it does not affect its Ba isotope composition. Our analysis indicates that the isotopic composition of Ba in the particles is not influenced by any of the variables studied.
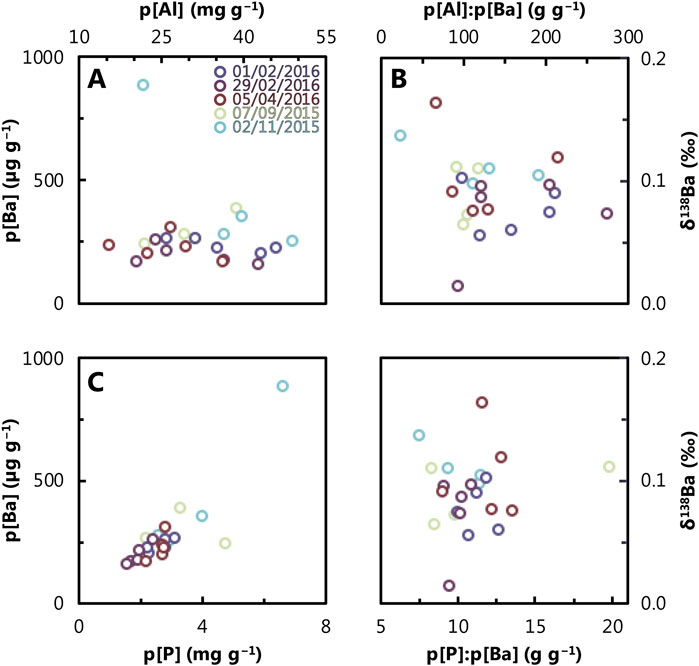
Figure 8. Property–property plots for: (A) p[Al] versus p[Ba], (B) particulate δ138Ba versus particulate [Al]:[Ba], (C) p[Ba] versus p[P], and (D) particulate δ138Ba versus particulate [P]:[Ba]. Refer to Figure 2 caption for color scheme and Table 3 for uncertainties on specific measurements.
4.3 Characterization of non-marine barium sources
We characterized non-marine Ba inputs by analyzing a local groundwater sample and two aerosol samples. The local groundwater sample, collected approximately 3 m from the shoreline, had a salinity of 39, which is similar to, though slightly lower than, the typical 40.5–40.8 observed in the GOA during our study (Figure 2). The Ba isotope composition of this sample was +0.49‰ ± 0.04‰, similar to the δ138Ba of GOA seawater (+0.55 ± 0.07‰), but the Ba content was significantly higher at 113.2 ± 5.7 nmol kg−1 (Figure 5). Assuming salinity is conservative, this groundwater sample is likely comprised of 96% seawater and 4% meteoric freshwater. Given these mixing proportions and our analytical uncertainty, it is not possible to calculate a true meteoric endmember composition for this region, beyond noting that it likely possesses higher [Ba] than GOA seawater.
The two dust samples analyzed in this study exhibited statistically identical δ138Ba values of +0.02‰ ± 0.03‰ and 0.00‰ ± 0.03‰, with a weighted mean of +0.01‰ ± 0.03‰ (Figure 5; Table 1). This isotopic composition is consistent with the mean δ138Ba for the upper continental crust of 0.00‰ ± 0.05‰ (Charbonnier et al., 2018; Nan et al., 2018). The August 2015 aerosol sample had been previously characterized by Chien et al. (2019), who reported that total Ba concentrations in the aerosols were approximately 140 μg g⁻1, of which 16%–26% was soluble. This is within the range of 0–2,240 µg Ba g⁻1 for dust samples collected over a previous 4-year time series (Torfstein et al., 2017).
4.4 Barium isotope composition of GOA sediments
The δ138Ba of two sedimentary samples, specifically the <20 µm “BaSO4-containing fraction” (see Section 3.2), deposited at Station A during the late 20th and mid-18th centuries, were +0.32‰ ± 0.03‰ and +0.35‰ ± 0.03‰, respectively (Table 1; Figure 5). Their weighted δ138Ba is +0.34‰ ± 0.03‰, which is offset by −0.22‰ ± 0.08‰ with respect to dissolved Ba in the GOA and +0.25‰ ± 0.07‰ relative to sinking particulate matter.
5 Discussion
5.1 Uniformity of barium chemistry in the Gulf of Aqaba
The Gulf of Aqaba is characterized by a single inflow source, deep seasonal mixing (Silverman and Gildor, 2008; Biton and Gildor, 2011), and relatively low productivity, with conditions generally considered oligotrophic (Chernihovsky et al., 2018; Foster et al., 2009; Labiosa et al., 2003; Figures 2, 3). As a result, values of dissolved [Ba] and δ138Ba in the GOA are vertically uniform, at 47.9 ± 4.7 nmol kg−1 and +0.55‰ ± 0.07‰, respectively (Figure 5). Given the short residence time of water in the GOA of 7 years, we speculate that the seawater in the GOA resembles the Ba chemistry of inflowing Red Sea seawater at the Straits of Tiran. For comparison, profiles of dissolved [Ba] and δ138Ba vary significantly more in the open ocean, typically between 30 and 150 nmol kg−1 (Mete et al., 2023) and +0.25 to +0.65‰ (Horner and Crockford, 2021; Yu et al., 2022). Despite large changes in dust fluxes and productivity, profiles of particulate δ138Ba are uniform in the GOA at +0.09‰ ± 0.06‰ (±2 SD, n = 26). While less is known about the range of Ba isotope compositions in marine particles, particulate [Ba] is known to vary from 0 to >1 nmol kg−1 in seawater (Rahman et al., 2022).
The homogeneity of Ba chemistry in the GOA simplifies the selection of representative values of δ138Ba for particulate and dissolved phases in the calculation of Δ138Bapart–diss. Some previous studies have faced challenges in estimating Δ138Bapart–diss due to vertical variation in dissolved δ138Ba and uncertainties regarding the depth ranges over which particles formed (Horner et al., 2017; Cao et al., 2020b), rendering the resultant value of Δ138Bapart–diss less certain. The homogeneous nature of the water column in the GOA, largely due to it reflecting advection from the northern Red Sea, obviates the need for such choices, eliminating this source of ambiguity.
To calculate the isotopic offset of the particulate load from dissolved seawater in the GOA, the average seawater δ138Ba value (+0.55‰ ± 0.07‰) was subtracted from the average particulate δ138Ba value (+0.09‰ ± 0.06‰; 2 SD, n = 26), which yielded a Δ138Bapart–diss of −0.46‰ ± 0.10‰ (±2 SD). This value is comparable to previously reported offsets in field settings, including the South Atlantic (−0.53‰ ± 0.04‰; Horner et al., 2017), Lake Superior (−0.41‰ ± 0.09‰; Horner et al., 2017), and the South China Sea (−0.5‰ ± 0.1‰; Cao et al., 2020a). An offset of −0.5‰ is also similar to that between BaSO4 in sedimentary core tops and overlying surface seawater (Bridgestock et al., 2018; Crockford et al., 2019; Middleton et al., 2023b).
5.2 Invariance of the dissolved–particulate barium isotope offset across diverse oceanic conditions
The similar Δ138Bapart–diss values observed in the GOA compared to previous studies suggest that particle formation, most likely in the form of pelagic BaSO4, results in a similar Ba isotope fractionation across diverse environments. This similarity implies that Δ138Bapart–diss is relatively insensitive to several environmental parameters, such as temperature, salinity, particle flux, and particle composition. For example, the GOA exhibits higher surface temperatures (≈27°C) compared to other studied environments, such as the South China Sea (≈23°C; Cao et al., 2020a) or Lake Superior (≈10°C; Horner et al., 2017), yet Δ138Bapart–diss is identical, within uncertainty, at ≈−0.5‰ ± 0.1‰. Similarly, the higher salinity of the GOA (≈40; Figure 1) compared to normal marine environments (≈35) or freshwater (≈0) also does not appear to significantly affect Δ138Bapart–diss (Horner et al., 2017; Cao et al., 2020a). We also note that large changes in the flux (Figures 3, 7) and composition (Figures 3, 6) of particles through the GOA do not affect dissolved or particulate δ138Ba. Altogether, these results suggest that Δ138Bapart–diss can be considered constant across a broad range of temperatures, salinities, and particle fluxes at approximately −0.5‰ (Figure 5).
The relatively narrow range in dissolved–particulate offsets observed in the GOA makes it challenging to identify other factors that may control Δ138Bapart–diss. However, the stability of Δ138Bapart–diss, despite large temporal changes in other chemical properties that we monitored, allows us to exclude these properties as significant influences on Δ138Bapart–diss. For example, we do not observe any correlation between particulate δ138Ba and particulate Al:Ba or P:Ba (Figure 8). This observation indicates that the Ba isotope composition of particulates does not respond to aeolian inputs, which exhibit δ138Ba ≈0.0‰, nor fluctuations in productivity. Notably, however, the quantity of particulate Ba is correlated with that of P, supporting the link between Ba and export productivity in the GOA.
Altogether, these results are consistent with the notion that the primary control on the Ba isotope composition of particles depends primarily on the δ138Ba of the fluid source (seawater) rather than any of the studied environmental variables. This is a potentially valuable finding from a proxy perspective since it validates one of the key assumptions needed to apply δ138Ba in BaSO4 as a paleoceanographic proxy: that particulate δ138Ba reflects seawater δ138Ba with an offset of 0.5‰, regardless of ambient T or S, which may not be known in ancient settings. The next steps in the validation chain concern whether processes occurring at the seafloor and within the sediment pile affect particulate δ138Ba, which we explore next.
5.3 Potential explanations for the barium isotope offset between particles and sediments in the GOA
We examined the BaSO4-containing fraction from two marine sediment cores collected at Station A and found that they exhibited a mean δ138Ba of +0.34‰ ± 0.03‰ (Figure 5; Table 1). This value is intermediate between the Ba isotope composition of sinking particulate fluxes (+0.09‰ ± 0.06‰) and dissolved Ba in the GOA (+0.55‰ ± 0.07‰). Below, we consider three possible explanations for this offset.
The first explanation is that the BaSO4-containing fraction does not represent the same pelagic BaSO4 that sank through the water column in the GOA. This could be due to environmental or processing reasons. For example, it is possible that most pelagic BaSO4 in the GOA dissolves at the seafloor due to low ambient barite saturation (e.g., Mete et al., 2023), and the sedimentary minerals analyzed here represent other minerals, which could be exogenous BaSO4 washed in during storm events or non-BaSO4 phases. Alternatively, our processing may not recover the majority of the BaSO4 fraction in GOA sediments. This is possible since the non-BaSO4 component in the sediment constituted a large fraction of the total sample, which contained many non-BaSO4 minerals that were not digested (Figure 4). While we attempted to concentrate the proportion of BaSO4 in these samples by sieving out particles >20 μm, it is challenging to quantify the exact proportion of sedimentary Ba present in BaSO4 without additional tests that are beyond the scope of this study.
A second possibility is that the δ138Ba of the BaSO4-containing fraction reflects the water composition at the time these samples formed, albeit with an offset of −0.5‰. This would imply that these sedimentary BaSO4 were derived from waters possessing δ138Ba ≈+0.8‰, sank to the seafloor, and were buried in the sediments without further modification. This explanation implies that δ138Ba of seawater in the Gulf of Aqaba was ≈+0.3‰ heavier than present values within the last 50 years. While possible, we deem this possibility implausible as seawater δ138Ba exceeding +0.75‰ has yet to be observed in the modern ocean (Horner and Crockford, 2021; Yu et al., 2022).
A final possibility is that the Ba isotope compositions of the BaSO4-containing fraction was initially similar to that of sinking pelagic BaSO4 (i.e., ≈+0.1‰), but has since been modified by early diagenetic reactions, reaching their present composition of +0.34‰. We identify two potential mechanisms that could explain this modification. The first, suggested by Scholz et al. (2023), proposes that authigenic BaSO4 precipitation in subsurface sediments leads to a preferential incorporation of heavy barium isotopes. As a result, solid-phase δ138Ba is shifted toward heavier compositions and pore water δ138Ba to lighter values. A second mechanism, posited by Middleton et al. (2023a; b), suggests that the BaSO4 in some sediments achieves Ba isotope equilibrium with the surrounding pore fluid through ion exchange, driving offsets between the solid and fluid of up to 0.2‰. In this explanation, porewaters should be offset to heavier values than the solid phase and would be predicted to exhibit δ138Ba ≈+0.5‰, similar to the δ138Ba of seawater in the GOA.
Unfortunately, we cannot definitively rule out any of these three scenarios as δ138Ba data for porewaters from this site are not available; such measurements would likely prove decisive in determining which of these explanations is most likely. Regardless, this result emphasizes the significance of conducting site-specific proxy validations and exercising careful site selection before applying novel paleo proxies.
6 Conclusion
We report results from a time series study of dissolved and particulate Ba chemistry in the Gulf of Aqaba, Red Sea, spanning January 2015 to April 2016. Our study provides valuable insights into the behavior and cycling of Ba in a well-characterized marine environment. Despite differences in hydrography, productivity, and dust fluxes across the time series—ranging from summer stratification and low productivity to deep winter mixing and high productivity—dissolved [Ba] and δ138Ba values remained invariant and vertically uniform at 47.9 ± 4.7 nmol kg−1 and +0.55‰ ± 0.07‰, respectively (±2 SD, n = 18). This uniformity likely reflects the Ba chemistry of the inflowing Red Sea seawater at the Straits of Tiran. Similarly, despite large changes in the flux and chemical composition of particulate matter, the Ba isotope composition of sinking particles was temporally and vertically uniform at +0.09‰ ± 0.06‰ (±2 SD, n = 26). The homogeneity of Ba chemistry in the GOA simplifies the calculation of isotopic offsets between dissolved and particulate phases. The observed offset, Δ138Bapart–diss, assumed to reflect Ba isotope fractionation during BaSO4 formation, was found to be invariant at −0.46‰ ± 0.10‰ (±2 SD), comparable to other marine settings. This consistency suggests that Ba isotope fractionation during particle formation is relatively insensitive to environmental variables such as temperature, salinity, or productivity. Instead, the primary control on the Ba isotope composition of particles is the δ138Ba of the fluid source—seawater. This uniformity across varying conditions suggests that ancient seawater δ138Ba can be reconstructed from particulate BaSO4 without the need for corrections based on environmental conditions, thus simplifying the use of Ba isotopes as a paleoproxy. However, additional characterization of the Ba chemistry of particles—both sinking and suspended—across variations in species assemblage and in deeper water columns is required to fully validate this finding. Additionally, our analysis of Ba isotopes in sediments underlying the GOA revealed a significant Ba isotope offset between the BaSO4-containing fraction and sinking particulates. We posit that this offset is derived from other, non-BaSO4 phases in GOA sediments, historical variations in the Ba isotope composition of Red Sea seawater, or early diagenetic processes, though we cannot currently distinguish between these possibilities without additional Ba isotope data from GOA sediment porewaters. This unexplained Ba isotope offset underscores the importance of conducting site-specific proxy validations and exercising careful site selection before the application of novel paleoproxies, such as δ138Ba in BaSO4.
Data availability statement
The original contributions presented in the study are included in the article/supplementary material, further inquiries can be directed to the corresponding authors.
Author contributions
KM: Conceptualization, Data curation, Formal Analysis, Funding Acquisition, Investigation, Visualization, Writing–original draft, Writing–review and editing. TH: Conceptualization, Data curation, Formal Analysis, Funding Acquisition, Investigation, Resources, Supervision, Validation, Visualization, Writing–original draft. Writing–review and editing. AT: Conceptualization, Funding Acquisition, Resources, Supervision, Visualization, Writing–review and editing. MA: Investigation, Supervision, Writing–review and editing. PC: Formal Analysis, Writing–original draft. Writing–review and editing. AP: Conceptualization, Funding Acquisition, Supervision, Writing–review and editing.
Funding
The author(s) declare that financial support was received for the research, authorship, and/or publication of this article. This material is based upon research supported by the U.S. National Science Foundation, specifically a Graduate Research Fellowship (to KM), and grant numbers OIA-IRES 1358134 (to AP), OCE-1736949 (to TH), and OCE-2023456 (to TH). This research was further supported by grants from the Northern California chapter of the Achievement Rewards for College Scientists Foundation and the International Association of Geochemistry. AT acknowledges support from the Israel Science Foundation (grants 927/15 and 834/19). Additionally, TH. recognizes support from the Woods Hole Oceanographic Institution’s Breene M. Kerr Early Career Scientist Endowment Fund.
Acknowledgments
We acknowledge T. Benaltabet, C. Brady, F. Lon, J. T. Middleton, D. Schultz, and B. Yarden for their assistance and advice with this study. Any use of trade, firm, or product names is for descriptive purposes only and does not imply endorsement by the U.S. Government.
Conflict of interest
The authors declare that the research was conducted in the absence of any commercial or financial relationships that could be construed as a potential conflict of interest.
Publisher’s note
All claims expressed in this article are solely those of the authors and do not necessarily represent those of their affiliated organizations, or those of the publisher, the editors and the reviewers. Any product that may be evaluated in this article, or claim that may be made by its manufacturer, is not guaranteed or endorsed by the publisher.
References
Bates, S. L., Hendry, K. R., Pryer, H. V., Kinsley, C. W., Pyle, K. M., Woodward, E. M. S., et al. (2017). Barium isotopes reveal role of ocean circulation on barium cycling in the atlantic. Geochimica Cosmochimica Acta 204, 286–299. doi:10.1016/j.gca.2017.01.043
Bishop, J. K. (1988). The barite-opal-organic carbon association in oceanic particulate matter. Nature 332 (6162), 341–343. doi:10.1038/332341a0
Biton, E., and Gildor, H. (2011). The general circulation of the gulf of Aqaba (gulf of Eilat) revisited: the interplay between the exchange flow through the Straits of tiran and surface fluxes. J. Geophys. Res. Oceans 116 (8). doi:10.1029/2010JC006860
Bridgestock, L., Hsieh, Yu Te, Porcelli, D., Homoky, W. B., Allison, B., and Henderson, G. M. (2018). Controls on the barium isotope compositions of marine sediments. Earth Planet. Sci. Lett. 481, 101–110. doi:10.1016/j.epsl.2017.10.019
Cao, Z., Li, Y., Rao, X., Yu, Y., Hathorne, E. C., Siebert, C., et al. (2020b). Constraining barium isotope fractionation in the upper water column of the South China Sea. Geochimica Cosmochimica Acta 288, 120–137. doi:10.1016/j.gca.2020.08.008
Cao, Z., Siebert, C., Hathorne, E. C., Dai, M., and Frank, M. (2020a). Corrigendum to “Constraining the oceanic barium cycle with stable barium isotopes” [Earth Planet. Sci. Lett. 434 (2016) 1–9]. Earth Planet. Sci. Lett. 530, 116003. doi:10.1016/j.epsl.2019.116003
Chan, L. H., Edmond, J. M., Stallard, R. F., Broecker, W. S., Chung, Y. C., Weiss, R. F., et al. (1976). Radium and barium at GEOSECS stations in the atlantic and pacific. Earth Planet. Sci. Lett. 32 (2), 258–267. doi:10.1016/0012-821X(76)90066-2
Charbonnier, Q., Moynier, F., and Bouchez, J. (2018). Barium isotope cosmochemistry and geochemistry. Sci. Bull. 63 (6), 385–394. doi:10.1016/j.scib.2018.01.018
Chen, Y., Mills, S., Street, J., Golan, D., Post, A., Jacobson, M., et al. (2007). Estimates of atmospheric dry deposition and associated input of nutrients to gulf of Aqaba seawater. J. Geophys. Res. Atmos. 112 (4), 1–14. doi:10.1029/2006JD007858
Chen, Y., Paytan, A., Chase, Z., Measures, C., Beck, A. J., Sañudo-Wilhelmy, S. A., et al. (2008). Sources and fluxes of atmospheric trace elements to the gulf of Aqaba, Red Sea. J. Geophys. Res. Atmos. 113 (5), 1–13. doi:10.1029/2007JD009110
Chernihovsky, N., Torfstein, A., and Almogi-Labin, A. (2018). Seasonal flux patterns of planktonic foraminifera in a deep, oligotrophic, marginal sea: sediment trap time series from the gulf of Aqaba, northern Red Sea. Deep-Sea Res. Part I Oceanogr. Res. Pap. 140, 78–94. doi:10.1016/j.dsr.2018.08.003
Chien, C.Te, Benaltabet, T., Torfstein, A., and Paytan, A. (2019). Contributions of atmospheric deposition to Pb concentration and isotopic composition in seawater and particulate matters in the gulf of Aqaba, Red Sea. Environ. Sci. Technol. 53 (11), 6162–6170. doi:10.1021/acs.est.9b00505
Chow, T. J., and Goldberg, E. D. (1960). On the marine geochemistry of barium. Geochim. Cosmochim. Acta 20 (3-4), 192–198. doi:10.1016/0016-7037(60)90073-9
Chung, Y. (1980). Radium-barium-silica correlations and a two-dimensional radium model for the world ocean. Earth Planet. Sci. Lett. 49 (2), 309–318. doi:10.1016/0012-821x(80)90074-6
Crockford, P. W., Wing, B. A., Paytan, A., Hodgskiss, M. S. W., Mayfield, K. K., Hayles, J. A., et al. (2019). Barium-isotopic constraints on the origin of post-marinoan barites. Earth Planet. Sci. Lett. 519, 234–244. doi:10.1016/j.epsl.2019.05.018
G. Cutter, P. Andersson, L. Codispoti, P. Croot, R. Francois, M. Lohanet al. (2014). “Sampling and sample-handling protocols for GEOTRACES cruises (Version 2.0),” GEOTRACES standards and intercalibration committee. Available at: https://www.geotraces.org/methods-cookbook/.
Dehairs, F., Chesselet, R., and Jedwab, J. (1980). Discrete suspended particles of barite and the barium cycle in the open ocean. Earth Planet. Sci. Lett. 49 (2), 528–550. doi:10.1016/0012-821x(80)90094-1
Deng, N., Stack, A. G., Weber, J., Cao, B., De Yoreo, J. J., and Hu, Y. (2019). Organic–mineral interfacial chemistry drives heterogeneous nucleation of Sr-rich (Bax, Sr1−x)SO4 from undersaturated solution. Proc. Natl. Acad. Sci. 116 (27), 13221–13226. doi:10.1073/pnas.1821065116
Eagle, M., Paytan, A., Arrigo, K. R., Dijken, G. van, and Murray, R. W. (2003). A comparison between excess barium and barite as indicators of carbon export. Paleoceanography 18 (1), 1021. doi:10.1029/2003PA000922
Foster, R. A., Paytan, A., and Zehr, J. P. (2009). Seasonality of N2 fixation and NifH gene diversity in the gulf of Aqaba (Red Sea). Limnol. & Oceanogr. 54 (1), 219–233. doi:10.4319/lo.2009.54.1.0219
Geyman, B. M., Ptacek, J. L., LaVigne, M., and Horner, T. J. (2019). Barium in deep-sea bamboo corals: phase associations, barium stable isotopes, & prospects for paleoceanography. Earth Planet. Sci. Lett. 525, 115751. doi:10.1016/j.epsl.2019.115751
Gonneea, M. E., and Paytan, A. (2006). Phase associations of barium in marine sediments. Mar. Chem. 100 (1-2), 124–135. doi:10.1016/j.marchem.2005.12.003
Griffith, E. M., and Paytan, A. (2012). Barite in the ocean - occurrence, geochemistry and palaeoceanographic applications. Sedimentology 59 (6), 1817–1835. doi:10.1111/j.1365-3091.2012.01327.x
Hartman, A., Torfstein, A., and Almogi-labin, A. (2020). Climate swings in the northern Red Sea over the last 150, 000 Years from ε Nd and Mg/Ca of marine sediments. Quat. Sci. Rev. 231, 106205. doi:10.1016/j.quascirev.2020.106205
Horner, T. J., and Crockford, P. W. (2021). Barium isotopes: drivers, dependencies, and distributions through space and time. Cambridge University Press. doi:10.1017/9781108865845
Horner, T. J., Kinsley, C. W., and Nielsen, S. G. (2015). Barium-isotopic fractionation in seawater mediated by barite cycling and oceanic circulation. Earth Planet. Sci. Lett. 430, 511–522. doi:10.1016/j.epsl.2015.07.027
Horner, T. J., Pryer, H. V., Nielsen, S. G., Crockford, P. W., Gauglitz, J. M., Wing, B. A., et al. (2017). Pelagic barite precipitation at micromolar ambient sulfate. Nat. Commun. 8 (1), 1342–1411. doi:10.1038/s41467-017-01229-5
Hsieh, Y.-te, and Henderson, G. M. (2017). Barium stable isotopes in the global ocean: tracer of Ba inputs and utilization. Earth Planet. Sci. Lett. 473, 269–278. doi:10.1016/j.epsl.2017.06.024
Jacquet, S. H. M., Dehairs, F., Cardinal, D., Navez, J., and Delille, B. (2005). Barium distribution across the Southern Ocean frontal system in the Crozet–Kerguelen Basin. Mar Chem. 95, 149–162. doi:10.1016/j.marchem.2004.09.002
Katz, T., Ginat, H., Eyal, G., Steiner, Z., Braun, Y., Shalev, S., et al. (2015). Desert flash floods form hyperpycnal flows in the coral-rich gulf of Aqaba, Red Sea. Earth Planet. Sci. Lett. 417, 87–98. doi:10.1016/j.epsl.2015.02.025
Labiosa, R. G., Arrigo, K. R., Genin, A., Monismith, S. G., and Van Dijken, G. (2003). The interplay between upwelling and deep convective mixing in determining the seasonal phytoplankton dynamics in the gulf of Aqaba: evidence from SeaWiFS and MODIS. Limnol. Oceanogr. 48 (6), 2355–2368. doi:10.4319/lo.2003.48.6.2355
Lazar, B., Erez, J., Silverman, J., Rivlin, T., Rivlin, A., Dray, M., et al. (2008). Recent environmental changes in the chemical-biological oceanography of the gulf of Aqaba (Eilat). Recent Environ. Change, 114–115.
Lea, D., and Boyle, E. (1989). Barium content of benthic foraminifera controlled by bottom-water composition. Nature 338 (6218), 751–753. doi:10.1038/338751a0
Light, T., Martínez-Ruiz, F., and Norris, R. (2023). Marine barite morphology as an indicator of biogeochemical conditions within organic matter aggregates. Geochimica Cosmochimica Acta 358, 38–48. doi:10.1016/j.gca.2023.08.012
Light, T., and Norris, R. (2021). Quantitative visual analysis of marine barite microcrystals: insights into precipitation and dissolution dynamics. Limnol. Oceanogr. 66 (10), 3619–3629. doi:10.1002/lno.11902
Lindell, D., and Post, A. F. (1995). Ultraphytoplankton succession is triggered by deep winter mixing in the Gulf of Aqaba (Eilat), Red Sea. Limnol. Oceanograp 40 (6), 1130–1141. doi:10.4319/lo.1995.40.6.1130
Ma, Z., Gray, E., Thomas, E., Murphy, B., Zachos, J., and Paytan, A. (2014). Carbon sequestration during the palaeocene–eocene thermal maximum by an efficient biological pump. Nat. Geosci. 7 (5), 382–388. doi:10.1038/ngeo2139
Ma, Z., Ravelo, A. C., Liu, Z., Zhou, L., and Paytan, A. (2015). Export production fluctuations in the eastern equatorial Pacific during the Pliocene-Pleistocene: reconstruction using barite accumulation rates. Paleoceanography 30 (11), 1455–1469. doi:10.1002/2015pa002860
Martinez-Ruiz, F., Paytan, A., Gonzalez-Munoz, M. T., Jroundi, F., Abad, M. D. M., Lam, P. J., et al. (2020). Barite precipitation on suspended organic matter in the mesopelagic zone. Front. Earth Sci. 8, 567714. doi:10.3389/feart.2020.567714
Mayfield, K. K., Eisenhauer, A., Santiago Ramos, D. P., Higgins, J. A., Horner, T., Auro, M., et al. (2021). The importance of groundwater discharge in the marine isotope budgets of Li, Mg, Ca, Sr, and Ba. Nat. Commun. 12 (1), 1–9. doi:10.1038/s41467-020-20248-3
Mete, O. Z., Subhas, A. V., Kim, H. H., Whitmore, L. M., Shiller, A. M., Gilbert, M., et al. (2023). Barium in seawater: dissolved distribution, relationship to silicon, and barite saturation state determined using machine learning. Earth Syst. Sci. Data 15 (9), 4023–4045. doi:10.5194/essd-15-4023-2023
Middleton, J. T., Hong, W. L., Paytan, A., Auro, M., Saito, M., and Horner, T. J. (2023a). Barium isotope fractionation in barite-fluid systems at chemical equilibrium. Chem. Geol. 627, 121453. doi:10.1016/j.chemgeo.2023.121453
Middleton, J. T., Paytan, A., Auro, M. E., Griffith, E. M., and Horner, T. J. (2023b). Barium isotope signatures of barite–fluid ion exchange in Equatorial Pacific sediments. Earth Planet. Sci. Lett. 612, 118150. doi:10.1016/j.epsl.2023.118150
Monnin, C., Jeandel, C., Cattaldo, T., and Dehairs, F. (1999). The marine barite saturation state of the world’s oceans. Mar. Chem. 65 (3–4), 253–261. doi:10.1016/S0304-4203(99)00016-X
Nan, X. Y., Yu, H. M., Rudnick, R. L., Gaschnig, R. M., Xu, J., Li, W. Y., et al. (2018). Barium isotopic composition of the upper continental crust. Geochimica Cosmochimica Acta 233, 33–49. doi:10.1016/j.gca.2018.05.004
Paytan, A., and Griffith, E. M. (2007). Marine barite: recorder of variations in ocean export productivity. Deep-Sea Res. Part II Top. Stud. Oceanogr. 54 (5–7), 687–705. doi:10.1016/j.dsr2.2007.01.007
Paytan, A., Kastner, M., and Chavez, F. P. (1996). Glacial to interglacial fluctuations in productivity in the equatorial Pacific as indicated by marine barite. Science 274 (5291), 1355–1357. doi:10.1126/science.274.5291.1355
Rahman, S., Shiller, A. M., Andersonz, R. F., Charettez, M. A., Hayes, C. T., and Gilbert, M. (2022). Dissolved and particulate barium distributions along the US GEOTRACES North Atlantic and East Pacific Zonal Transects (GA03 and GP16): Global implications for the marine barium cycle. Glob. Biogeochem. Cyc. 36 (6), e2022GB007330. doi:10.1029/2022GB007330
Scholz, F., Cheng, J., Zhang, Z., Vosteen, P., Siebert, C., and Frank, M. (2023). Benthic-pelagic coupling and isotopic fractionation of barium in Kiel Bight, SW Baltic Sea. Front. Mar. Sci. 10, 1101095. doi:10.3389/fmars.2023.1101095
Shaked, Y., and Genin, A. (2018). Israel national monitoring Program at the gulf of Eilat annual report. Available at: https://www.gov.il/BlobFolder/reports/eilat_national_monitoring_program_reports/he/marine_coastal_environment_NMP_2018.pdf.
Shellenbarger, G. G., Monismith, S. G., and Paytan, A. (2006). The importance of submarine groundwater discharge to the nearshore nutrient supply in the gulf of Aqaba (Israel). Limnol. & Oceanogr. 51 (4), 1876–1886. doi:10.4319/lo.2006.51.4.1876
Silverman, J., and Gildor, H. (2008). The residence time of an active versus a passive tracer in the gulf of Aqaba: a box model approach. J. Mar. Syst. 71, 159–170. doi:10.1016/j.jmarsys.2007.06.007
Steiner, Z., Lazar, B., Torfstein, A., and Erez, J. (2017). Testing the utility of geochemical proxies for paleoproductivity in oxic sedimentary marine settings of the gulf of Aqaba, Red Sea. Chem. Geol. 473 (March), 40–49. doi:10.1016/j.chemgeo.2017.10.012
Tieman, Z. G., Stewart, B. W., Capo, R. C., Phan, T. T., Lopano, C. L., and Hakala, J. A. (2020). Barium isotopes track the source of dissolved solids in produced water from the unconventional Marcellus Shale gas play. Environ. Sci. & Technol. 54 (7), 4275–4285. doi:10.1021/acs.est.0c00102
Torfstein, A., Kienast, S. S., Yarden, B., Rivlin, A., Isaacs, S., and Shaked, Y. (2020). Bulk and export production fluxes in the gulf of Aqaba, northern Red Sea. ACS Earth Space Chem. 4 (8), 1461–1479. doi:10.1021/acsearthspacechem.0c00079
Torfstein, A., Teutsch, N., Tirosh, O., Shaked, Y., Rivlin, T., Zipori, A., et al. (2017). Chemical characterization of atmospheric dust from a weekly time series in the north Red Sea between 2006 and 2010. Geochimica Cosmochimica Acta 211, 373–393. doi:10.1016/j.gca.2017.06.007
Van Zuilen, K., Nägler, T. F., and Bullen, T. D. (2016). Barium isotopic compositions of geological reference materials. Geostand. Geoanalytical Res. 40 (4), 543–558. doi:10.1111/ggr.12122
von Allmen, K., Böttcher, M. E., Samankassou, E., and Nägler, T. F. (2010). Barium isotope fractionation in the global barium cycle: first evidence from barium minerals and precipitation experiments. Chem. Geol. 277 (1), 70–77. doi:10.1016/j.chemgeo.2010.07.011
Keywords: barium isotopes, marine sediments, pelagic barite, seawater chemistry, trace metal analysis
Citation: Mayfield KK, Horner TJ, Torfstein A, Auro ME, Crockford PW and Paytan A (2024) Barium cycling in the Gulf of Aqaba. Front. Earth Sci. 12:1178487. doi: 10.3389/feart.2024.1178487
Received: 02 March 2023; Accepted: 01 August 2024;
Published: 12 September 2024.
Edited by:
Rut Pedrosa Pàmies, Marine Biological Laboratory (MBL), United StatesReviewed by:
Frank Dehairs, Vrije University Brussels, BelgiumChristopher Siebert, Helmholtz Association of German Research Centres (HZ), Germany
Copyright © 2024 Mayfield, Horner, Torfstein, Auro, Crockford and Paytan. This is an open-access article distributed under the terms of the Creative Commons Attribution License (CC BY). The use, distribution or reproduction in other forums is permitted, provided the original author(s) and the copyright owner(s) are credited and that the original publication in this journal is cited, in accordance with accepted academic practice. No use, distribution or reproduction is permitted which does not comply with these terms.
*Correspondence: Kimberley K. Mayfield, bWF5ZmllbGQ4QGxsbmwuZ292; Tristan J. Horner, dHJpc3Rhbi5ob3JuZXJAd2hvaS5lZHU=