 Xiaoning Liu
 Gongwen Wang
 Jingyi Lv1,6
- 1School of Earth Sciences and Resources, China University of Geosciences, Beijing, China
- 2Frontiers Science Center for Deep-Time Digital Earth, China University of Geosciences, Beijing, China
- 3Shandong Engineering Research Center of Application and Development of Big Data for Deep Gold Exploration, Weihai, China
- 4MNR Key Laboratory for Exploration Theory and Technology of Critical Mineral Resources, China University of Geosciences, Beijing, China
- 5Beijing Key Laboratory of Land and Resources Information Research and Development, Beijing, China
- 6China Communications Informations and Technology Group Co., LTD., Beijing, China
- 7Xincheng Gold Limited Company of Shandong Gold Group, Yantai, China
The orientation of deep-seated orebodies was observed shifted from the northwest to north at the Xincheng deposit in the Jiaoxibei gold field during the mining operations. To make informed decisions, understanding the geological factors influencing this directional change is crucial for mining engineers. Prior research suggested that the ore-controlling fault morphology might correlate with the orebody positions and the thickness of alteration zones. Hence, the morphology of fault structures emerges as a key point in this work. First, we constructed a three-dimensional (3D) fault surface model. A large fault framework was interpreted using gravity–magnetic–electrical geophysical datasets, and then, the local details of the fault surfaces were characterized using an interpolation method based on the drillhole fault gouge data. Subsequently, we statistically assessed the spatial association between fault morphology and orebody positioning using the standardized C-values method and demarcated the ore-controlling structures on fault surfaces using quantitative indicators. The indicators of fault dips, fault azimuths, and the second-order trend residuals of fault surfaces represented the fault morphology. The drillhole grade data (Σsampling grade * sampling length) were used to describe the scale of mineralization zones, and the cumulative thickness of the pyrite–sericite altered rocks indicated the intensity of alteration zones. Finally, a geostatistical structural analysis was used to depict the mineralization orientation at different locations. Through these methods, we aim to propose a potential pattern of how ore-controlling fault morphology spatially influences the positions and orientations of orebodies. This comprehensive approach offers valuable insights into exploring deep-seated mineralization at the Xincheng deposit, aiding in a better understanding of the deposit’s geological dynamics for future mining endeavors.
1 Introduction
The Jiaoxibei gold field stands as a world-class gold field. The dominant controls over its gold deposits are northeast-trending major fault zones, including the Sanshandao, Jiaojia, and Zhaoping fault zones. Extensive geological surveys have indicated that variations in the occurrence of the three major faults might have controlled the formation of diverse ore-forming spaces (Lv et al., 2017). Horizontally, fault inflections created extensional spaces that facilitated the mineral accumulation and hosted numerous gold orebodies. Vertically, changes in fault dip angles generated extensional structures, also facilitating orebody formation (Li et al., 2002). Spatially, alteration zones overlapped mineralization and structural zones (Li et al., 2002). Highly altered zones, such as quartz–sericite zones, often coincide with fractured rock zones and high-grade mineralization (Song et al., 2015). Based on this, previous researchers proposed several metallogenetic models in the Jiaoxibei area. One renowned model, the “step metallogenetic model” proposed by Song et al. (2012), suggested that ore-controlling faults form several stepped changes in the dip angle along their inclined direction, corresponding to stepped distributions of gold deposits/orebodies. These models not only offer valuable insights into understanding the genesis of gold deposits in the Jiaoxibei region but also provide guidance for resource exploration endeavors.
The Xincheng gold deposit is an altered rock-type deposit situated on the Jiaojia Fault zone. During mining operations, the mine engineers encountered a challenge: the orebody abruptly stopped along the strike but then reappeared toward the north. Therefore, predicting the trend of deep-seated ore bodies has become a critical concern for mining experts. However, existing models such as the “step metallogenetic model” remain a qualitative empirical model, failing to quantitatively express the specific structural features governing mineralization areas or pinpoint the location of deep-seated gold orebodies (Mao et al., 2019). This study used 3D geological modeling to model the fault surfaces (Mao et al., 2020; Huang et al., 2022) and the Xincheng deposit and then used quantitative methods to evaluate the potential spatial relationships between the ore-controlling fault surface morphology and the orebody positions. Additionally, geostatistical methods were used to explore how ore-controlling structures influence the orientation of mineralization. This comprehensive methodology aims to provide a more detailed and quantitative understanding of the structural controls on the orebody distribution in the Xincheng deposit.
3D geological and mineralization modeling is important for intelligent mining and production. It can pose a challenge for vein-type gold orebodies and potential target modeling using geological and geophysical exploration datasets (Pang et al., 2022). Wang et al. (2021) used 3D/4D modeling to delineate district-scale targeting using multisource and multiscale datasets in the northwestern Jiaodong Peninsula. However, detailed 3D models that correlate at the camp/deposit/orebody scale are necessary for mine production using the dataset from drillholes and underground mining tunnels. Therefore, in this paper, we used these data to perform 3D geological modeling in the Xincheng deposit for exploration targeting at depth.
Geostatistics initially evolved for ore deposit modeling and mineral reserve estimation (Matheron, 1963). In 3D ore deposit modeling, the Kriging method is commonly used. One of the fundamental characteristic of geostatistics, anisotropy, is defined as direction-related phenomena exhibited by subsurface attributes in ore deposits (Journel and Huijbregts, 1978). In hydrothermal deposits, high-grade ores are often associated with specific controlling structures, such as faults, shear zones, and folds (Wang et al., 2019). Consequently, the orientation and scale of mineralization primarily depend on the interaction among ore-controlling structures, fluid flow, and host rock types. In a regular geometric mineralized zone with a stable mineralization direction and scale, the relationship among mineralization, fluid flow, and ore-controlling structures might be relatively straightforward. Thus, investigating the local anisotropy and scale of mineralized zones can provide insights into mineralization processes on scales of hundreds of meters (Blenkinsop, 2004). The primary objective of ore deposit geostatistical structural analysis is to understand the behavior of grade distribution and relate this information to ore deposit structural features (Monteiro et al., 2004). In this study, directional variograms serve as the tool for understanding the orebody, and the process of modeling these variograms is termed structural analysis in the context of geostatistics (Journel and Huijbregts, 1978). This approach helps uncover crucial insights into the distribution and behavior of mineralization within ore deposits.
2 Geological backgrounds
2.1 Regional geology of the Jiaoxibei gold field
The Jiaodong area lies on the southeastern margin of the North China Craton, comprising metamorphic basement rocks and Mesozoic clastic sedimentary cover sequences. The area exhibits widespread intrusive rocks resulting from Mesozoic magmatic activities, such as the 230–200 Ma Shidao pluton, approximately 160 Ma-old Linglong and Kunsan plutons, Guojialing pluton of around 130 Ma, and approximately 110 Ma-old Sanfoshan and Laoshan plutons. Volcanic rocks predominantly consist of the 124–110 Ma Qingshan Group, smaller-scale Early Cretaceous mafic dikes, and limited occurrences of Late Triassic syenites (Zhu et al., 2012; Zhu et al., 2015; Qiu et al., 2022).
The Jiaoxibei gold field, situated in the northwestern part of the Jiaodong area, is controlled by the secondary fault zones of the Tan–Lu Fault Zone. Three northeast-trending ore-controlling fault zones, the Sanshandao, Jiaojia, and Zhaoping fault zones, are sequentially located from west to east (Figure 1A), hosting large to super-large gold deposits. The fault structure system facilitating pathways for ore-forming fluids and serving as the main hosting sites for orebodies played a crucial role in the formation of these substantial gold deposits. Two mineralization types are prevalent in the region: the sulfide–quartz vein type and fractured alteration rock type. The former involves multi-stage gold-bearing sulfide veins overlying larger-scale quartz veins, typically filling secondary fault structures. The latter mainly developed at the contact interface between basement metamorphic rocks and Mesozoic granite, within the northeast-trending fault zones, strictly controlled by regional main fault zones and alteration zones. The orebodies in this context often display veinlet disseminated structures within the footwall of fault zones, experiencing extensive fracturing and hydrothermal alteration (Fan et al., 2021). Both types were formed under the same structural stress field in different structural ore-forming spaces (Song et al., 2012).
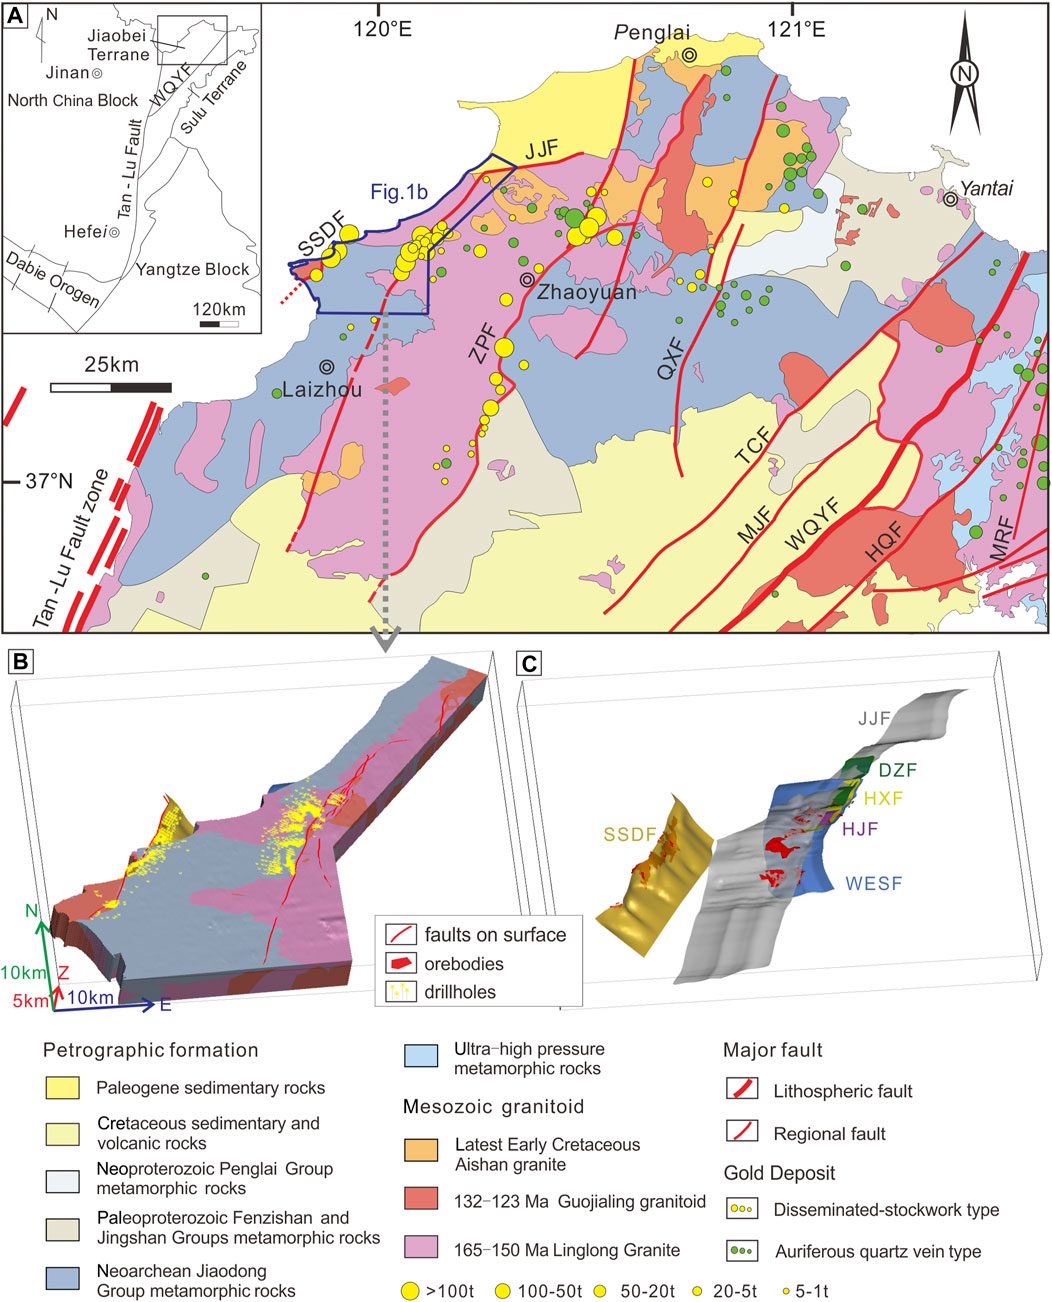
FIGURE 1. (A) Geological map of the Jiaoxibei gold metallogenic belt [modified from the work of Yang et al. (2016)]. HQF, Haiyang–Qingdao Fault; HSF, Haiyang–Shidao Fault; JJF, Jiaojia Fault; MJF, Muping–Jimo Fault; MRF, Muping–Rushan Fault; QXF, Qixia Fault; RCF, Rongcheng Fault; SSDF, Sanshandao Fault; TCF, Taocun Fault; WHF, Weihai Fault; WQYF, Wulian–Qingdao Yantai Fault; and ZPF, Zhaoping Fault. (B) Regional rock and (C) ore-control faults model in Jiaojia and Sanshandao ore districts (Wang et al., 2021; Zhang et al., 2023).
The Jiaojia Fault zone trends generally northeast and dips northwestward, exhibiting a gentle undulating geometry (Huang et al., 2019). This fault zone hosts super-large to large gold deposits such as the Jiaojia (234 t Au), Xincheng (139 t Au), Shaling (309 t Au), and Tengjia (206 t Au) deposits, each characterized by structural variations in occurrence (Yang et al., 2016). Additionally, its subsidiary faults zones—Hedong, Wang’ershan, and Hexi faults—control smaller-scale gold deposits. On the western side of the Jiaojia Fault zone lies the Sanshandao Fault zone, trending in the northeast direction overall and locally dipping toward the southeast. Its continuous and stable main fault exhibits an “S shape on a plane, showing a wavy appearance. This fault zone controls super-large to large gold deposits such as Cangshang (67 t Au), Xinli (48 t Au), Sanshandao (>500 t Au), Xiling (383 t Au), and the Beibuhaiyu (470 t Au) deposits (Yu et al., 2016; Wang, 2020).
The fractural zone, alteration zone, and mineralization zone in the Jiaoxibei gold field coincided spatially. The fault zone exhibits structural and alteration zoning around its main fault surface, featuring fault gouge, and differing degrees of fracturing. The alteration zoning includes pyritized sericites (mineralized zone), sericites, and alkali-altered rocks. Notably, there exists a spatially positive correlation among the degree of structural deformation, alteration intensity, and the enrichment degree of gold minerals (Li et al., 2022). Previous studies on this area have revealed various aspects of fault structures’ control over alteration and mineralization. These include differential alteration and mineralization between the hanging wall and footwall due to the fault gouge, the influence of structural development on alteration and mineralization intensities, the connection between structural properties and alteration/mineralization types, and the impact of fault occurrences on alteration and mineralization intensities (Deng et al., 1996; Dong, 2022).
2.2 Mineralization characteristics of the Xincheng deposit
The Xincheng deposit is a typical altered rock-type gold deposit, situated near the northern side of the Jiaojia Fault zone (Figure 2A). The Mesozoic granitoids cover approximately 90% of the outcrop area and are widely distributed throughout the deposit. The Jiaojia Fault, intersecting the intrusive rock contact zone between Linglong granite and Guojialing granodiorite, played a pivotal role in shaping and positioning the orebodies (Lu et al., 2011). The tectonically altered rock exhibited both horizontal and vertical zoning on either side of the fault (Figures 2B, C). The hanging wall displays sericitized granitic fractured rocks and sericitized granites, while the footwall features minor pyritic sericitized vesicular rocks, pyritic sericitized fractured rocks, pyritic sericitized granitic fractured rocks, pyritic sericitized granites, and potassic granites. These tectonic alteration zones gradually transitioned to each other, with the alteration intensity gradually decreasing from the main fault toward its surroundings (Ma, 2011).
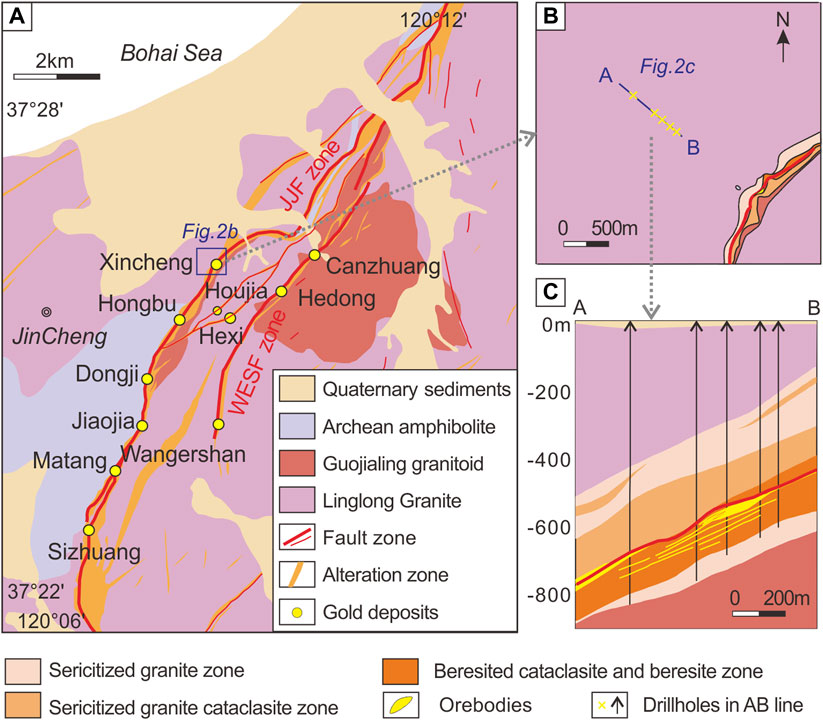
FIGURE 2. (A) Geological map of the Jiaojia Fault zone [modified from the work of Yang et al. (2016)]. (B) Geological map of the Xincheng deposit. (C) AB profile of the Xincheng deposit.
The main orebodies of the Xincheng deposit, No. I and No. V (Figure 3A), constitute 98.6% of the proven reserves. The No. I orebody, the larger orebody with 185 t Au reserves, is characterized by disseminated- and stockwork-style ores. It has a consistent tabular shape, with an average strike of 37°, inclined toward the northwest at a dip angle between 20° and 30°. Adjacent to the No. I orebody, the No. V orebody is characterized by quartz–pyrite and quartz–sulfide vein-style ores, comprising a set of subparallel veins filling subsidiary northeast-trending faults. It appears as a stratiform-like S-shape lens with an average strike of 31° and dips 30°–40° northwestward (Yang et al., 2016).
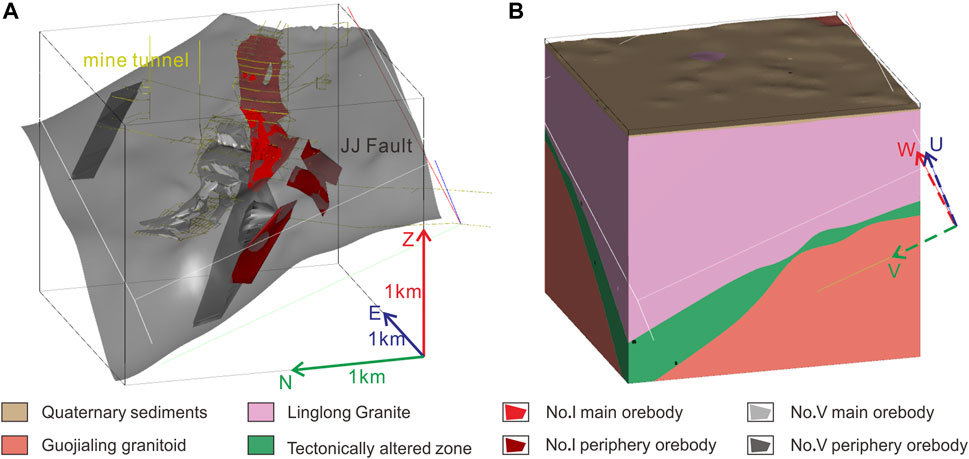
FIGURE 3. Xincheng deposit model consisting of (A) the Jiaojia Fault (JJF) surface, orebodies, mine tunnel, and (B) rocks of Quaternary sediments, Linglong granite, the tectonically altered zone, and Guojialing granitoid.
3 3D modeling of the Xincheng deposit
During mining operations, a shift in the orebody direction at the Xincheng deposit was noted at depth—from northwestward to northward. To uncover the mineralization pattern, understanding the deposit’s mineralization characteristics is crucial. We gathered datasets including 210 drillholes with Au grade and lithology data, over 34,000 trench samples with gold grade data, 26 cross-sectional profiles, and 17 underground level maps at different elevations from the Xincheng deposit. Then, the 3D geological modeling techniques were used to visualize the spatial distribution of host rocks, fault surfaces, orebodies, altered rocks, and gold grades.
Based on the SKUA-GOCAD 3D modeling software, the spatial relationships among geological structural bodies were visualized. Figures 3A, B present the 3D geological model of the Xincheng deposit, incorporating Quaternary sediment, Linglong granite, the alteration zone, Guojialing granodiorite, and the Jiaojia Fault using the discrete smooth interpolation (DSI) method (Mallet, 2002) based on the drillhole lithology data. Additionally, the explicit modeling method was used to create orebody models, including the main orebodies No. I and No. V, alongside peripheral orebodies. The main No. I orebody has consistent geometry and uniform thickness, whereas the main No. V orebody exhibits thickness variation—thicker in shallow areas, tapering toward the middle, and reappearing in the deeper sections, with orebody orientation northward. The alteration zone encompassed all orebodies and would serve as the geological domain for subsequent attribute modeling of alteration lithologies and gold grade. A grid model with a 25 m * 25 m * 7.5 m block size was created to capture the spatial distributions of geological attributes. Before attribute modeling, a coordinate system rotation (denoted as UVW in the rotated coordinate system) was performed to flatten the alteration zone (Armstrong et al., 2011).
In this study, lithological modeling variables were chosen based on their spatial correlation with orebodies: sericite alteration, pyrite alteration, and fracture rock types (Figure 4), accounting for 90.7%, 18.7%, and 39% of the overall distribution, respectively. These attributes were converted into indicator data for indicator kriging (IK) modeling, applied independently to each categorical variable. Before using IK, it was essential to model directional variograms for each variable (Figures 5A–C). The geological knowledges, variogram mapping, and sample data configurations were considered to determine the directions of the horizontal minimum and minimax continuity on the UV coordinate plane. The W-axis indicates the vertical direction of the variogram. The directional variograms were then computed and fitted using the variogram models, which involved a single anisotropic structure model for each variable (Table 1).
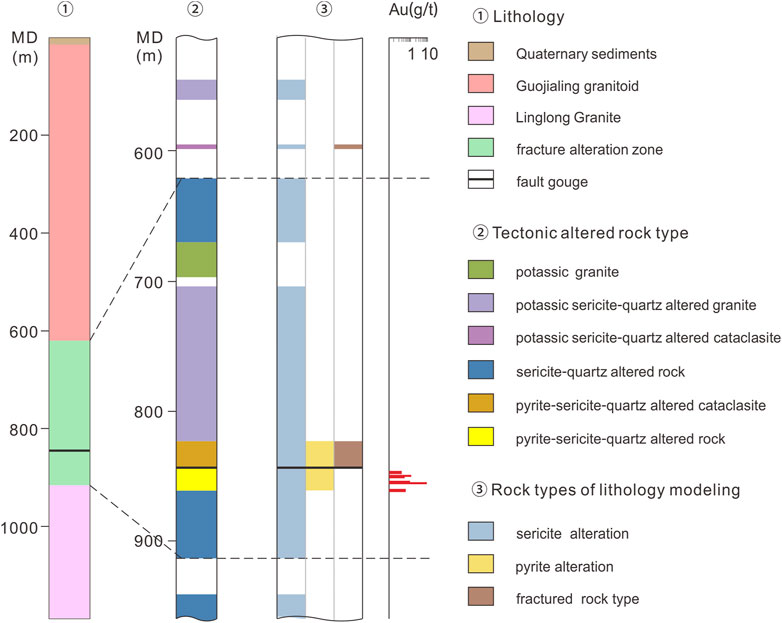
FIGURE 4. Schematic representation of a drillhole geology log and gold grade assay data in the Xincheng deposit.
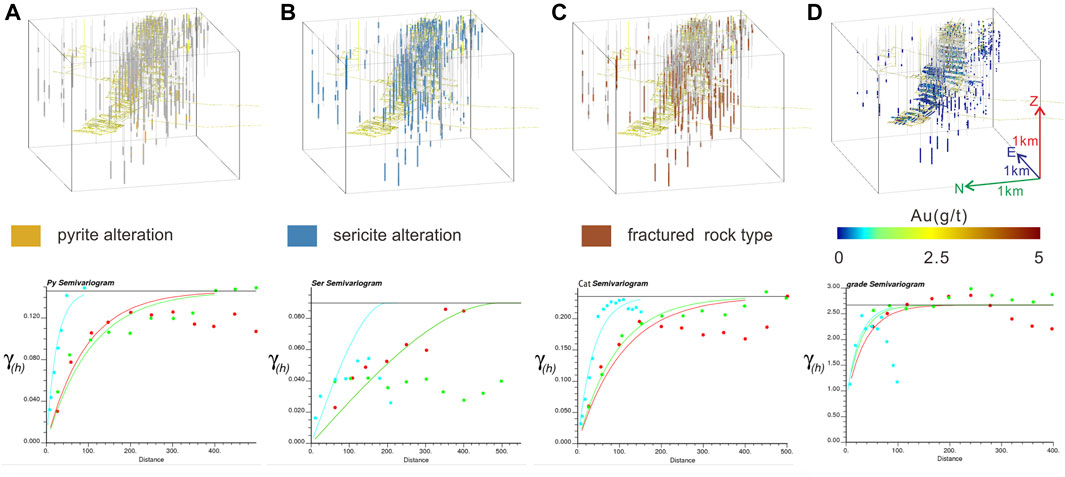
FIGURE 5. Spatial distribution and directional variograms of three rock types and grade data. The horizontal maximum and minimum directions represented by the red and green lines are as follows: (A) 0° and 90° of the pyrite alteration (abbreviated as Py); (B) 40° and 130° of the sericite alteration (abbreviated as Ser); (C) 70° and 160° of the fractural rock type (abbreviated as Cat); and (D) 35° and 125° of the grade data, respectively. The vertical variograms are represented by blue lines.
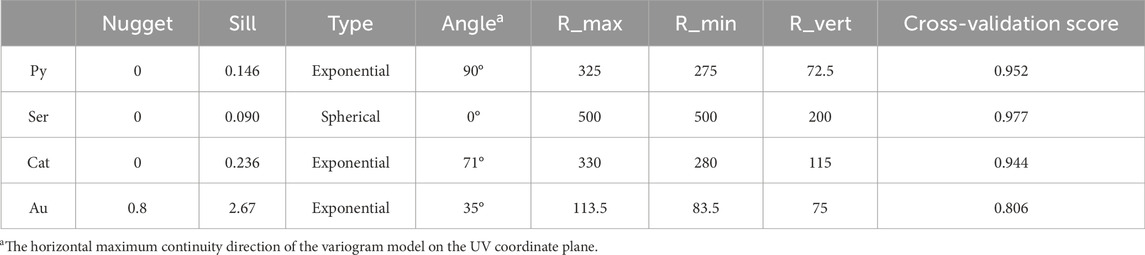
TABLE 1. Variogram models’ parameters and cross-validation scores of the four variables.
The horizontal variograms of sericite alteration exhibited a zonal anisotropy, making its fitting difficult (Figure 5B). Considering this rock type’s global proportion exceeding 90%, an isotropic structure with a quarter of the study area as the ranges of influence was chosen for its variogram model. Following this, the variogram models for three rock types were evaluated by cross-validation, all scoring above 0.90. Subsequently, Boolean operations were used on the three categorical models, generating 2˄3 combinations (Figure 6A). For example, grids labeled as pyritic sericitized rock resulted from the intersection of the pyrite alteration, sericite alteration, and non-fracture rock type. Notably, the combination of pyritic altered rock (the intersection of pyrite alteration, non-sericite alteration, and non-fracture rock types) was designated as an “unknown rock” class due to its absence from the drillhole records.
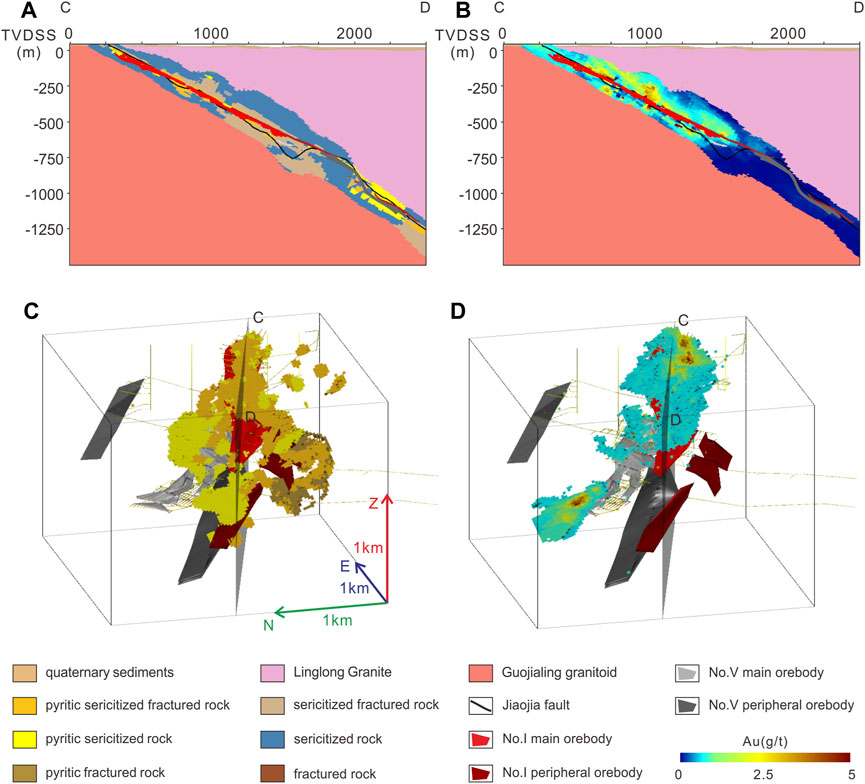
FIGURE 6. (A) Distribution of rocks and tectonically altered lithologies and (B) estimated grade on CD cross-section. (C) Blocks of the pyritic sericitized fractured rock, pyritic sericitized rock, and pyritic fractured rock covering most of the orebody area. (D) High-grade blocks (over 1.5 g/t) covering most of the main orebody area.
The coefficient of variation (CV) for grade data from both drillhole and trench samples stands at 3.17 (Figure 7A). Empirically, a CV exceeding 2.0 indicates high heterogeneity in a variable (Pyrcz and Deutsch, 2014). To improve the grade variogram modeling, outliers were initially identified using a cumulative probability plot (Deutsch and Journel, 1997), with the value exceeding 11 g/t, and substituted with 11 g/t to reduce the overestimation bias. Then, the grade data were smoothed by averaging grade values within each covered cell, resulting in 4,790 smoothed data with a CV of 1.44 (Figure 7B) as the input for subsequent grade estimation. Before applying the ordinary kriging (OK) method (Neufeld et al., 2005), the grade variogram model was fitted (Figure 5D), and its parameters are detailed in Table 1. To assess the accuracy of the variogram model, the blocks with estimated grades were classified into ore and waste using a cutoff grade of 1.5 g/t, yielding a cross-validation score of 0.806. Moreover, as the threshold increased from 1.0 g/t to 2.5 g/t, the cross-validation score progressively increased from 0.78 to 0.87.
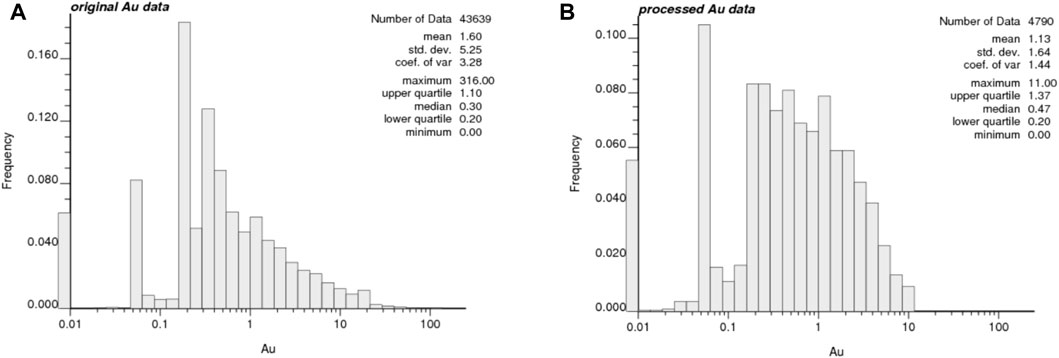
FIGURE 7. Histograms of (A) original grade data and (B) processed grade data from drillholes and trenches.
The distribution of the altered rock type and grade reveals that high-grade blocks near the Jiaojia Fault are primarily associated with lithologies of pyritic sericitized fractured rock, pyritic sericitized rock, and pyritic fractured rock (Figures 6A, B). The blocks cover most of the orebodies but notably exclude the deeper section of the No. V main orebody (Figure 6C). It is due to the paucity of drillhole logging information in these parts of the deposit, which was partially compensated for by the presence of gold grade data in trenches. Blocks with estimated grades over the 1.5 g/t cutoff (Figure 6D) closely align with the main orebody model, exhibiting a trend from the northwest to north, from shallow to deep. On the other hand, blocks with estimated grades below the cutoff grade correspond to the peripheral orebodies, with lower tenor of mineralization.
4 Methods and results
4.1 Ore-controlling fault surface modeling
In the Jiaojia and Sanshandao ore districts, approximately 1,300 drillholes, hundreds of geological profiles, high-precision 1:25,000 ground gravity data, 1:50,000 ground magnetic data, and 23 magnetotelluric profiles with depths of 5000 m were collected and modeled by Wang et al. (2021). The geological and geophysical data (Bencharef et al., 2022) were used to construct a 3D rock and fault model with a depth of 0 km–5 km, including the Jiaodong Group metamorphic rocks, Linglong granites, Guojialing granodiorites, Jiaojia Fault, and Sanshandao Fault (Figures 1B, C) (Zhang et al., 2023). However, the model resolution was 250 mX * 250 mY * 100 mZ. Hence, this study specifically focused on refining the position and morphology of fault surfaces. The fault gouge data extracted from drillholes, designated as the Jiaojia and Sanshandao main faults, were used to accurately reconstruct the fault surfaces. For the areas between drillholes, the DSI method (Mallet, 2002) was applied to interpolate the fault surfaces smoothly. The surface resolution related to the average spacing of drillholes is approximately 100 m. Subsequent morphology analyses focused on the areas of the fault surface intersected by drilling, while the original morphology was maintained in areas lacking drillhole control, as shown in Figure 8.
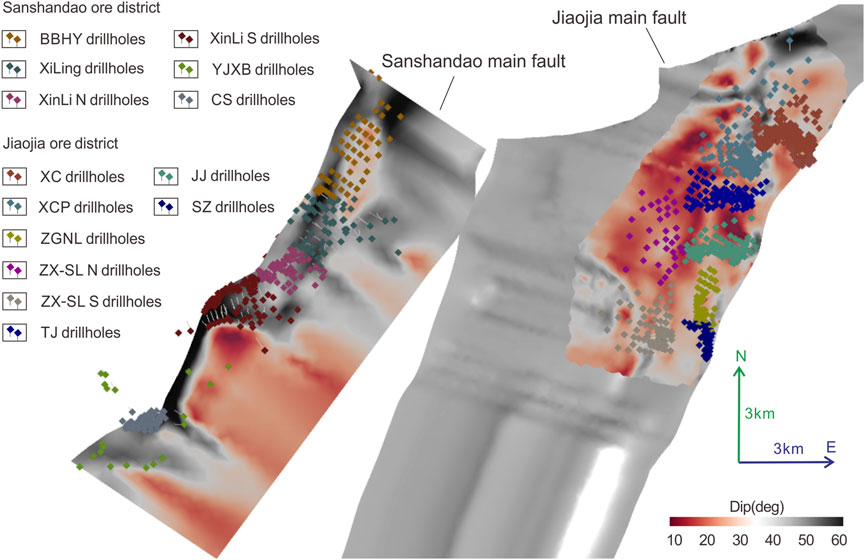
FIGURE 8. Fault surface model corrected by the fault gouge data on drillholes, colored by the fault dip for subsequent morphology analysis.
4.2 Assessment of the association between the fault morphology and orebodies
To quantitatively assess the spatial correlation between the fault surface morphology and orebody positioning, we projected fault morphology indicators and orebody positions onto the fault surfaces for analysis. The fault morphology indicators included second-order trend residuals (specifically for the Jiaojia Fault), fault dips, and azimuths. Orebody indicators were binary data derived from orebody projection onto the fault surfaces. Quantitative evaluation was conducted using the studentized C-values method (Carranza, 2004; Xiao et al., 2023), prediction–area (P–A) plots (Yousefi and Carranza, 2015; Behera and Panigrahi, 2021), and receiver operating characteristic (ROC) curves (Unal, 2017). Figures 11A–C depict the assessment results of these methods for the second-order trend residual indicator of the Jiaojia Fault. Furthermore, mineralization and alteration intensities were quantified as indicators in order to evaluate their spatial associations with orebody positioning. The cumulative grade indicator was defined by the sum of the product of sampling grades and sampling lengths along drillholes, while the alteration thickness indicator represented the cumulative thickness of pyrite–sericite altered rocks. Both indicators were interpolated using the OK method and projected onto the fault surfaces, as shown in Figures 9, 10.
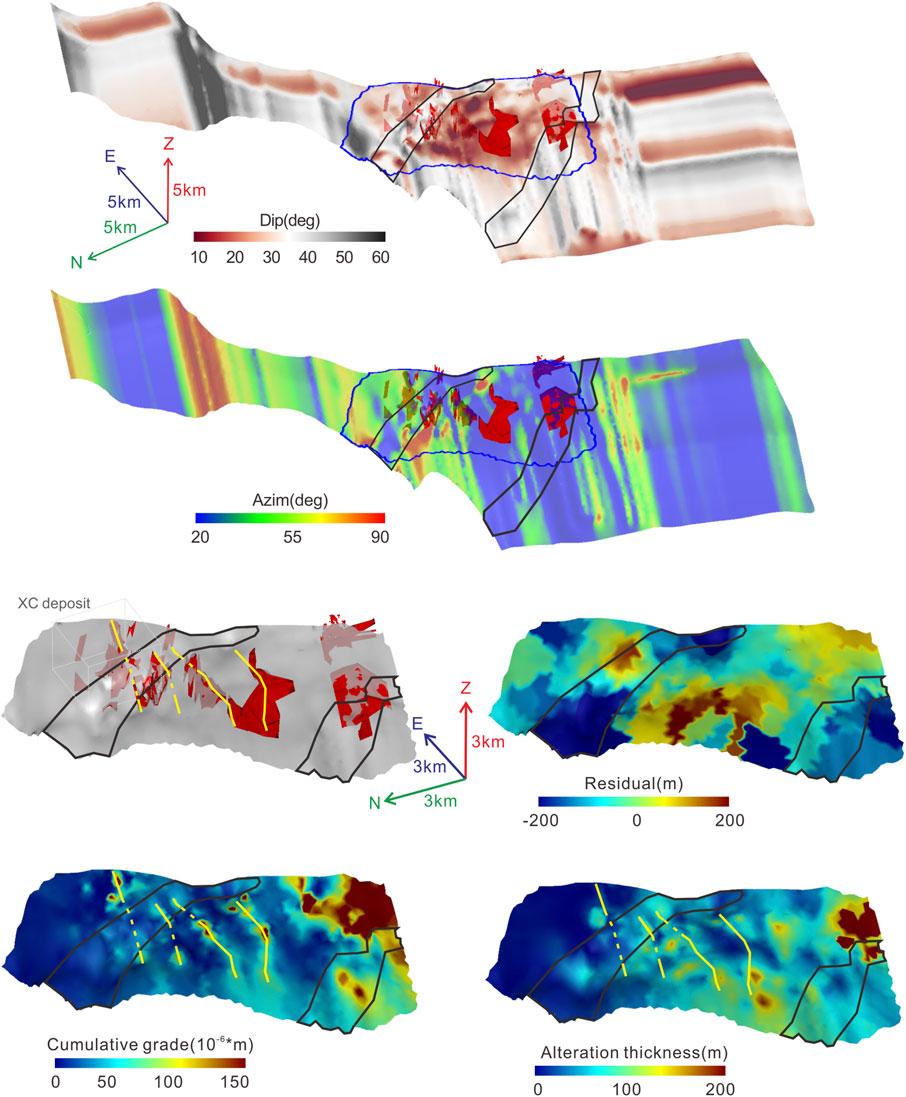
FIGURE 9. Isoclinal views showing the Jiaojia Fault surfaces colored by different indicators: the fault dip, fault azimuth, second-order trend residual, the alteration thickness (the cumulative thickness of pyritic sericitized fractured lithology), and the cumulative grade (Σ sample grade * sample length).
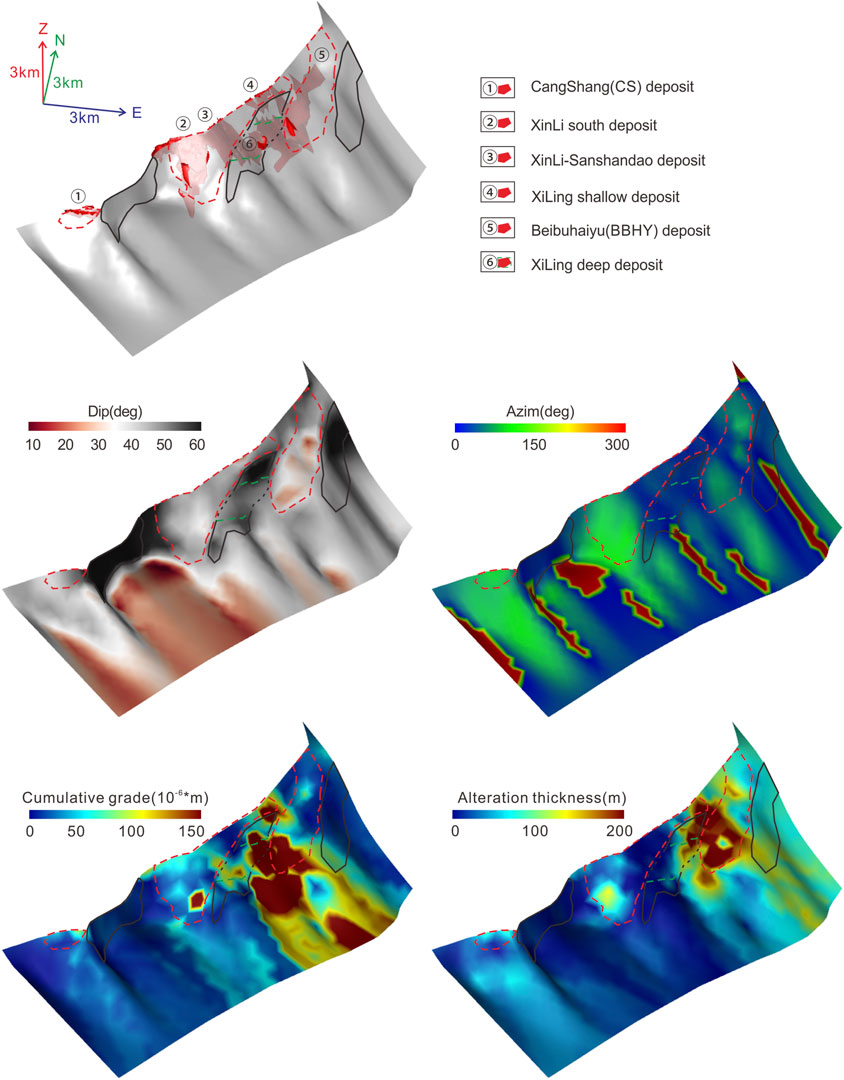
FIGURE 10. Isoclinal views showing the Sanshandao Fault surfaces colored by different indicators: the fault dip, fault azimuth, the alteration thickness (same as above), and the cumulative grade (same as above).
The studentized C-value is useful in determining cutoff levels to convert multiclass evidential data into binary predictors. Values of studentized-C>1.96 suggest a statistically significant spatial association at α=0.05 (Bonham-carter et al., 1989). In P–A plots, dual ordinate axes represent the prediction rate of known orebodies covered by the indicator classes and the proportion of areas occupied by those classes in the total study area. When the intersection point of an indicator lies higher on the ordinate axis, it indicates that more orebodies are covered by this indicator within a smaller area. The ratio (normalized density) of the prediction rate to area proportion at the intersection point is used to assess the correlation significance. Values between 0 and 1 signify a negative correlation, while values >1 imply a positive correlation (Yousefi and Carranza, 2015).
The indicator value at the intersection serves as the threshold of an interval associated with the orebodies. The ROC curve is plotted with the false positive rate as the abscissa axis and the true positive rate as the ordinate axis (Unal, 2017). An area under the curve (AUC) > 0.5 represents the indicator that is relevant to the orebodies. The Youden Index (Youden, 1950) determines the optimal cutoff threshold of an indicator by identifying the position of its maximum value, calculated as the true positive rate minus the false positive rate.
The AUC index from the ROC curve and the normalized density in the P-A plot were used to rank all the indicators according to their association significance with the orebodies, as detailed in Table 2. The results revealed that the fault residual showed the strongest association in the Jiaojia ore district, while the fault dip was the most significant in the Sanshandao ore district. Using the studentized C-value, the P–A plot, and the ROC curve provided thresholds for ore-indicating intervals. The dual thresholds from the studentized C-value closely aligned with the single threshold from the other methods, as shown in Tables 3, 4. Therefore, the dual thresholds were used to demarcate the ore-related areas depicted in Figure 11D. Additional assessments of other indicators in the Jiaojia ore district are shown in Supplementary Figures S1–S4.
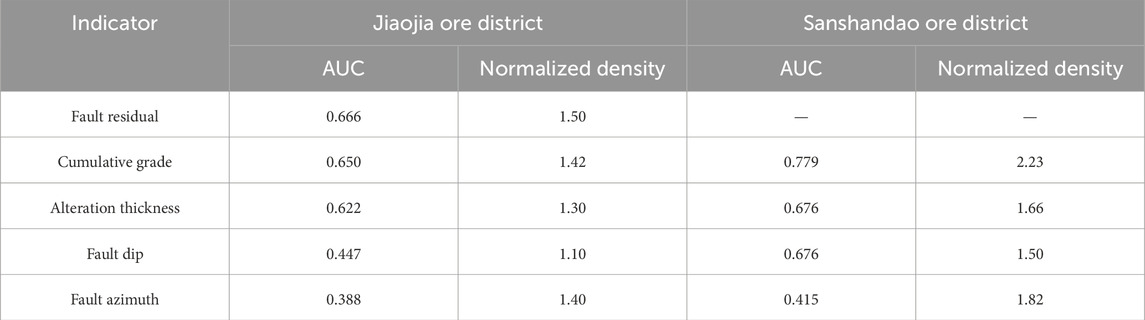
TABLE 2. Significance order of the spatial association between the potential indicators and the orebodies.

TABLE 3. Thresholds of indicators determined for a spatial correlation with known orebodies in the Jiaojia ore district.

TABLE 4. Thresholds of indicators determined for a spatial correlation with known orebodies in the Sanshandao ore district.
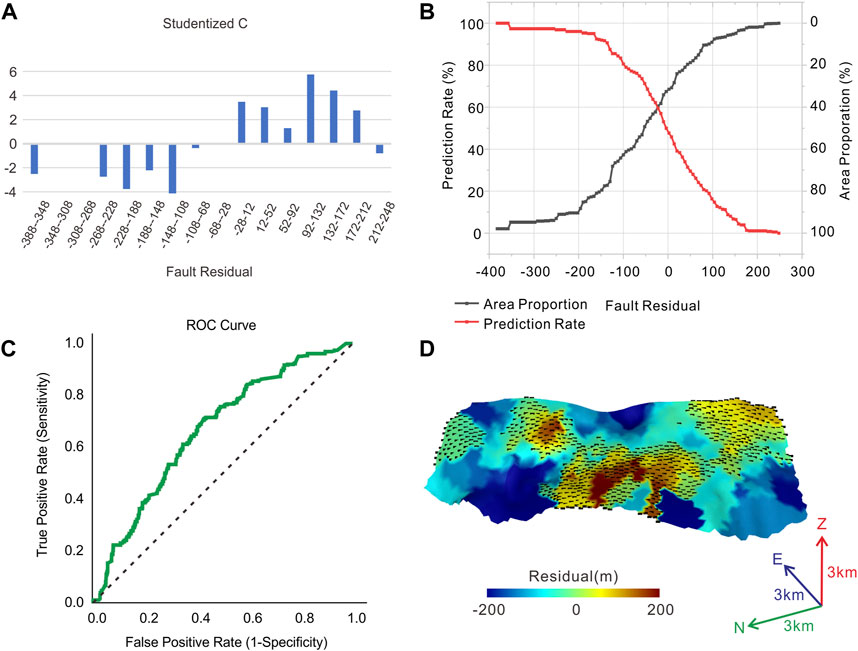
FIGURE 11. Assessment results using (A) studentized-C values, (B) P–A plot, and (C) ROC curve methods to the fault residual indicator in the Jiaojia ore district. (D) Interval range projected onto the fault surface denoted by black dots using studentized-C values.
4.3 Geostatistical structural analysis
Geologic continuity and variogram continuity are direction-dependent. In the presence of sparse data, such as in petroleum reservoirs, directions of continuity are most often known from geological interpretation. In the case of geological ambiguity, but enough data available, the variogram can be calculated in a large number of directions and distances to observe directions of greater or lesser continuity. The variogram map takes the idea of posting the variogram values in a number of directions on a map where the center of the map is the lag distance of zero (Pyrcz and Deutsch, 2014). The calculation of the variogram values γ(h) is described as follows (Deutsch and Journel, 1997):
where γ(h) is the variogram, vector h incorporates the magnitude and direction of the lag, and N(h) is the number of sample pairs separated by the vector h. xi and xi+h are the locations of each pair of points belonging to domain A, and n is the sample number. Z(xi) is the value of the regionalization variable Z at xi location, and E{Z(x)} is the expected value of Z(x). Therefore, the main use of the variogram map is to detect the anisotropy on a 2D plane, which is defined by a single angle that identifies the “major” and “minor” horizontal directions of continuity. The vertical direction assumed to be perpendicular to the horizontal direction, in this case, is the W-axis direction.
The maximum continuous direction extracted semi-quantitatively from the variogram map of grade data represents the mineralization direction. The range extracted in that direction indicates the scale of maximum autocorrelation of grade data. In this paper, a line representing the mineralization direction and a circle with the range as its radius are defined as the mineralization structure circle, which is used to visually express the mineralization structure of deposits or orebodies at different locations.
Prior to generating the variogram map, defining geological domains to represent gold deposits/orebodies is necessary. It should be noted that the variogram map will be very noisy and of little use in the presence of sparse data, whereas merging data across diverse geological facies might mask crucial geological differences. Hence, in the vertical direction, we exacted blocks intersecting the drillholes and filtered for blocks with average sampling grades above a set value as the domain and verified them using orebody depth (Figure 12A). These blocks were then horizontally subdivided into subdomains representing distinct deposits, considering orebody positions and drillhole spacing, as illustrated in Figures 8, 12B. In addition, to mitigate the outlier impact on variogram values, a normal score transformation was applied to grade data within each subdomain prior to variogram mapping. Supplementary Figure S5 outlines four variogram map types and the criteria used to empirically identify maximum continuous direction and range, depicted by mineralization structure circles in Figures 12B, 13.
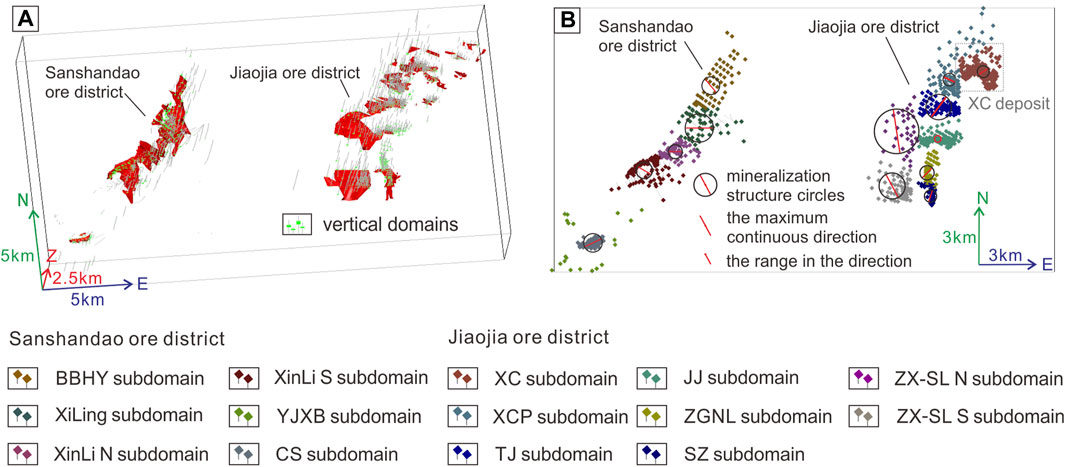
FIGURE 12. (A) Vertical domain and (B) horizontal sub-domains representing the mineralized geological bodies.
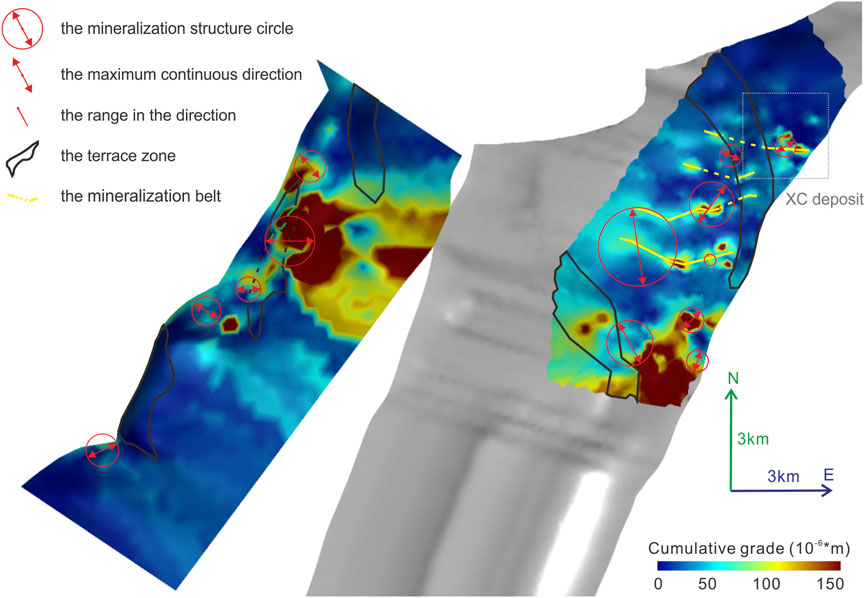
FIGURE 13. Mineralization structure circles were projected onto the Sanshandao and Jiaojia Fault surfaces, superimposed with the cumulative grade indicator.
5 Discussion
5.1 Division of different types of ore-controlling structures
In the Jiaojia ore district, the convex areas in the Jiaojia Fault surface indicated by the fault residual (Figure 11D) are spatially correlated to highly mineralized areas and highly altered areas indicated by the mineralization and alteration indicators which reveal four mineralized belts (highlighted by yellow lines) orientated northeastward. Conversely, areas of fault dip>35° displayed two steep terrace zones (black solid lines). These zones exhibited almost perpendicular to the mineralization belts, which displayed discontinuities at their intersection, particularly in the deeper part of the Xincheng deposit (Figures 9, 13).
In the Sanshandao ore district, areas with lower fault dips extending in the north–northeast direction were outlined as the mineralized belts (red dashed lines), encompassing most of the orebodies. Notably, between orebodies ③ and ④, a large orebody exists, but a data gap leaves a blank area. Alternating parallel to these mineralized belts, areas characterized by higher fault dips represent steep terrace zones (black solid lines) (Figure 10). Almost all orebodies were located within the mineralized belts, except for orebody ⑥, which is situated within a local area of the terrace zone, where the fault dip is relatively gentle, bridging both sides of the mineralized belts. This particular zone might serve as a conduit for the transport and precipitation of gold minerals.
5.2 Mineralization structure indicated by the mineralization structure circles
Figure 13 illustrates a difference between the direction of the mineralized belts and the directions of the mineralization structure circles. This difference results from that the former representing the mineralization direction at the scale of the ore district, while the latter representing it at the scale of deposits or orebodies. Moreover, the directions of the mineralization structure circles differ between the Jiaojia ore district and the Sanshandao ore district, primarily northwest–northeast and east–southeast, respectively. It implied that the migration pathways for ore-forming fluids generated under the same tectonic stress field were distinct in the two regions, resulting in their different mineralization directions.
The size of ore reserves is dependent on many variables, such as confidence in mineral resource and engineering considerations. Despite that, the radii of the mineralization structure circles appear to relate to the size of the representative deposit or orebody. Statistics based on the reported ore reserves in the Jiaojia ore district revealed that the Shaling (SL) deposit (309 t Au) and Tengjia (TJ) deposit (206 t Au), having the largest reserves, correspond to the largest mineralization structure circles—ZX-SL N, ZX-SL S, and TJ subdomains. Similarly, in the Sanshandao ore district, the largest reserves in the Xiling deposit (383 t Au) and Beibuhaiyu (BBHY) deposit (470 t Au) align with the largest radii of mineralization structure circles (Xiling and BBHY subdomains). This correlation suggests that within the same ore-bearing structures, the better continuity in the grade data across different areas signifies larger orebody sizes.
5.3 Inference of deep orebody tendency in the Xincheng deposit
In this section, we explored how morphology of the Jiaojia Fault impacts the position and orientation of the orebodies in the Xincheng deposit. We divided the main orebodies, No. I and No. V, into nine sections to draw their mineralization structure circles (Figure 14A). Figures 14A, B illustrate the distribution of the Jiaojia Fault dip, fault azimuth, peripheral orebodies, and mineralization structure circles of the main orebodies viewed from above. Notably, the western side of the Xincheng deposit displayed a steep north–south terrace zone on the Jiaojia Fault’s surface, mirroring a localized version of the terrace zone depicted in Figure 13. This area hosted lower-grade peripheral orebodies, while higher-grade main orebodies were positioned east of this zone. Interestingly, the deeper section of the main No. V orebody extended northward along the edge of the terrace zone.
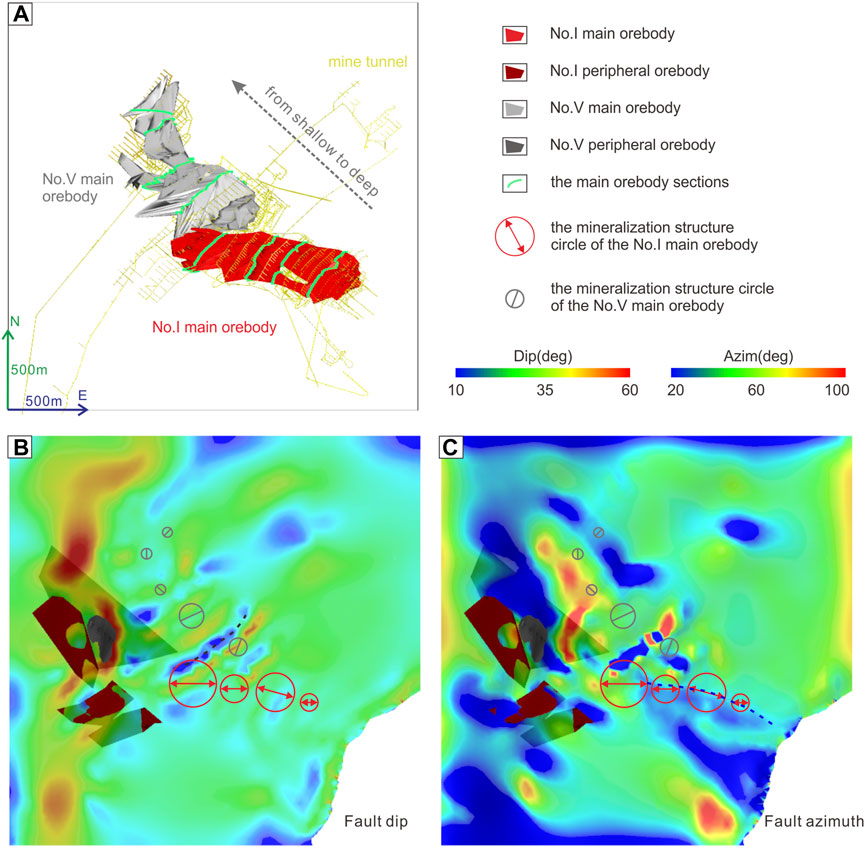
FIGURE 14. (A) Division of the main No. I and No. V orebodies of the Xincheng deposit into 4 and 5 sections, respectively. Mineralization structure circles projected onto the Jiaojia Fault surface, color-coded by (B) fault dip and (C) fault azimuth. Schematic representation depicting the relationship between the main orebodies and fault orientation. The mineralization trend of the No. I orebody, oriented nearly east–west, appears associated with a change in fault strike from north–northeast to northeast, indicated by a blue dashed line. The thicker sections within the No. V orebody, V-1 and V-2, appear related to an abrupt change in the fault dip, denoted by a black dashed line. A steep north–south terrace zone on the western side of the Xincheng deposit seems correlated with the northward orientation of the No. V orebody and its mineralization direction.
The mineralization directions of the mineralization structure circles of the No. I main orebody are consistently toward nearly east–west, while those for the No. V main orebodies rotated clockwise with depth. The alignment of the No. I orebody’s mineralization directions seemed linked to the shift in fault strike from north–northeast to northeast (marked by a blue dashed line), creating a structural space that formed a uniformly thick orebody (Figure 14C). Conversely, thicker sections in the No. V orebody, V-1 and V-2, may result from abrupt changes in the fault dip (marked by a black dashed line). In deeper sections such as V-3, V-4, and V-5, mineralization directions shifted gradually from northwest to north to northeast, coinciding with reduced circle sizes. Meanwhile, the orientation of the deeper No. V orebody shifted northward, with reducing orebody volume (Figure 14B). This might correlate with a discontinuity in the mineralization belt where the terrace zone intersected it, causing ore-forming materials to deposit along the northern edge in smaller quantities.
6 Conclusion
The morphology of the ore-controlling faults in the Jiaoxibei gold field significantly impacted the spatial positioning and orientation of gold orebodies. Quantitative assessments revealed that gently dipping zones in the Jiaojia Fault and Sanshandao Fault correspond to ore-bearing belts, while areas with larger fault dips formed steep terrace zones, potentially interpreting the continuity of mineralization belts. The 3D fault surface model distinctly outlined their spatial positions. The mineralization directions and scales of deposits or orebodies can be semi-quantitatively expressed using geostatistical structural analyses. In the Xincheng deposit, the 3D geological model indicated a shift in the orebody orientation from the northwest to north at depth and a reduction in orebody volume. Meanwhile, mineralization structure circles also showed a shift of the mineralization directions from the northwest to north to northeast, with smaller circle sizes. These changes can be attributed to the discontinuity of mineralization belts and the obstruction caused by the terrace zone. Consequently, it is inferred that the deeper orebody would extend northward along the edge of the terrace zone, with smaller orebody sizes.
Data availability statement
The data analyzed in this study are subject to the following licenses/restrictions: due to the nature of this research, participants of this study did not agree for their data to be shared publicly, so supporting data are not available. The raw data supporting the conclusion of this article will be made available by the authors, without under reservation. Requests to access these datasets should be directed to XL, bHhuQGVtYWlsLmN1Z2IuZWR1LmNu.
Author contributions
XL: writing–original draft, methodology, formal analysis, and visualization. GW: supervision, project administration, and funding acquisition. JL: data processing and resources. YP: project administration and resources. XZ: validation and resources. All authors contributed to the article and approved the submitted version.
Funding
This study was financially supported from the National Key Research and Development Program (Nos. 2022YFC2903604 and 2016YFC0600105), the “Project on 3D Geological Modeling and Deep Ore Body Extension Prediction of Xincheng Gold Deposits” (No. 2019-G-09), the “Deep-Time Digital Earth” Science and Technology Leading Talents Team Funds for the Central Universities for the Frontiers Science Center for Deep-Time Digital Earth, China University of Geosciences (Beijing) (No. 2652023001), Shandong Engineering Research Center of Application and Development of Big Data for Deep Gold Exploration, and Technology Innovation Center for Exploration and Exploitation of Strategic Mineral Resources in Plateau Desert Region, Ministry Resources (No. KFKT20230102).
Acknowledgments
This paper was completed with the help of Professor Clayton Deutsch and Dr. Qu Jiannan from the University of Alberta, who improved the geostatistical modeling. Dr. Zhang Zhiqiang from the China University of Geosciences (Beijing) and Dr. Luo Jinhui from China University of Mining and Technology contributed valuable suggestions for the improvement of this paper. The fieldwork and data collection were performed with the help of the leaders and technicians of the Xincheng Gold Mine and Shandong Gold Mining Co., Ltd. The data preprocessing work was partially completed by Xuewei Shao, Jiayang Tang, and Bin Li.
Conflict of interest
Author JL was employed by China Communications Informations and Technology Group Co., Ltd. Authors YP and XZ were employed by Xincheng Gold Limited Company of Shandong Gold Group.
The remaining authors declare that the research was conducted in the absence of any commercial or financial relationships that could be construed as a potential conflict of interest.
The reviewer LQ declared a shared affiliation with the authors LX, GW, and LJ to the handling editor at time of review.
Publisher’s note
All claims expressed in this article are solely those of the authors and do not necessarily represent those of their affiliated organizations, or those of the publisher, the editors, and the reviewers. Any product that may be evaluated in this article, or claim that may be made by its manufacturer, is not guaranteed or endorsed by the publisher.
Supplementary material
The Supplementary Material for this article can be found online at: https://www.frontiersin.org/articles/10.3389/feart.2024.1217016/full#supplementary-material
References
Armstrong, M., Galli, A., Beucher, H., Loc'h, G., Renard, D., Doligez, B., et al. (2011). Plurigaussian simulations in geosciences. Paris: Springer Science & Business Media.
Behera, S., and Panigrahi, M. K. (2021). Mineral prospectivity modelling using singularity mapping and multifractal analysis of stream sediment geochemical data from the auriferous Hutti-Maski schist belt, S. India. Ore Geol. Rev. 131, 104029. doi:10.1016/j.oregeorev.2021.104029
Bencharef, M. H., Eldosouky, A. M., Zamzam, S., and Boubaya, D. (2022). Polymetallic mineralization prospectivity modelling using multi-geospatial data in logistic regression: the diapiric zone, northeastern Algeria. Geocarto Int. 37 (27), 15392–15427. doi:10.1080/10106049.2022.2097481
Blenkinsop, T. G. (2004). Orebody geometry in lode gold deposits from Zimbabwe: implications for fluid flow, deformation and mineralization. J. Struct. Geol. 26 (6–7), 1293–1301. doi:10.1016/j.jsg.2003.11.010
Bonham-Carter, G. F., Agterberg, F. P., and Wright, D. F. (1989). Weights of evidence modelling: a new approach to mapping mineral potential. Statistical applications in the Earth Sciences 89–9, 171–183.
Carranza, E. J. (2004). Weights of evidence modeling of mineral potential: a case study using small number of prospects, Abra, Philippines. Nat. Resour. Res. 13 (3), 173–187. doi:10.1023/b:narr.0000046919.87758.f5
Deng, J., Xu, S., Lv, G., and Chen, Z. (1996). Researches of fracture structure and mineralization in northwest Jiaodong. Geoscience 10 (4), 502–511.
Deutsch, C. V., and Journel, A. G. (1997). GSLIB geostatistical software library and user’s guide. second edition. New York: Oxford University Press.
Dong, X. (2022). Study on mineralization structure, formation process and uplifting history of Jiaojia gold orefield, Jiaodong Peninsula. Beijing: China University of Geosciences.
Fan, H., Lan, T., Li, X., Santosh, M., Yang, K., Hu, F., et al. (2021). Conditions and processes leading to large-scale gold deposition in the Jiaodong province, eastern China. Sci. China Earth Sci. 64 (9), 1504–1523. doi:10.1007/s11430-020-9789-2
Huang, J., Liu, Z., Deng, H., Li, L., Mao, X., and Liu, J. (2022). Exploring multiscale non-stationary influence of ore-controlling factors on mineralization in 3D geological space. Nat. Resour. Res. 31 (6), 3079–3100. doi:10.1007/s11053-022-10112-0
Huang, L., Wang, G., Carranza, E. J., Du, J., Li, J., Zhou, Z., et al. (2019). Multi-scale numerical simulation and 3D modeling for deep mineral exploration in the Jiaojia Gold District, China. Nat. Resour. Res. 29 (1), 415–438. doi:10.1007/s11053-019-09608-z
Li, B., Peng, Y., Zhao, X., Liu, X., Wang, G., Jiang, H., et al. (2022). Combining 3D geological modeling and 3D spectral modeling for deep mineral exploration in the Zhaoxian Gold Deposit, Shandong Province, China. Minerals 12 (10), 1272. doi:10.3390/min12101272
Li, G. M., Shen, P., Shen, Y. C., and Li, H. M. (2002). Multistage deformation of Jinniushan fault belt and its structural control for gold mineralization in Eastern Jiaodong Peninsular. Min. Deposits 21, 617–620.
Lu, L., Fan, H., Hu, F., Yang, K., Zheng, X., and Zhao, H. (2011). Ore-forming fluids and genesis of Xincheng altered rock gold deposit in Northwestern Jiaodong Peninsula. Mineral. Deposits 30 (3), 522–532. doi:10.16111/j.0258-7106.2011.03.013
Lv, G. X., Huo, Q. L., Yuan, Y. L., Xu, Y. Q., Fan, X., Fu, C. W., and Miao, Q. J. (2017). Mineralization of tectono-magmatic upheaval-hydrothermal alteration in the detachment zone, Jiaodong Peninsula. Front. Earth Sci. 24 (2), 95–103. doi:10.13745/j.esf.yx.2016-12-20
Ma, X. (2011). Structure-alteration-mineralization network of Xincheng gold deposit, Jiaodong Peninsula. Beijing: China University of Geosciences.
Mao, X., Zhang, W., Liu, Z., Ren, J., Bayless, R. C., and Deng, H. (2020). 3D mineral prospectivity modeling for the low-sulfidation epithermal gold deposit: a case study of the Axi gold deposit, Western Tianshan, NW China. Minerals 10 (3), 233. doi:10.3390/min10030233
Mao, X. C., Wang, M. J., Liu, Z. K., Chen, J., and Deng, H. (2019). Quantitative analysis of ore-controlling factors based on exploration data of the Dayingezhuang gold deposit in the Jiaodong Peninsula. Earth Sci. Front. 26 (4), 84. doi:10.13745/j.esf.2019.04.010
Matheron, G. (1963). Principles of geostatistics. Econ. Geol. 58 (8), 1246–1266. doi:10.2113/gsecongeo.58.8.1246
Monteiro, R. N., Fyfe, W. S., and Chemale, F. (2004). The impact of the linkage between grade distribution and petrofabric on the understanding of structurally controlled mineral deposits: ouro Fino Gold Mine, Brazil. J. Struct. Geol. 26 (6-7), 1195–1214. doi:10.1016/j.jsg.2003.11.023
Neufeld, C. T., Norrena, K. P., and Deutsch, C. V. (2005). Guide to geostatistical grade control and dig limit determination. Edmonton: Centre for Computational Geostatistics (CCG) Guidebook Series Vol. 1.
Pang, Z., Wang, G., Qiu, H., Sun, S., and Li, J. (2022). Geological and geochemical characteristics of the wulong gold deposit, liaodong Peninsula: implications for gold mineralization. Ore Geol. Rev. 144, 104850. doi:10.1016/j.oregeorev.2022.104850
Pyrcz, M. J., and Deutsch, C. V. (2014). Geostatistical reservoir modeling. USA: Oxford University Press.
Qiu, L., Kong, R., Yan, D.-P., Mu, H.-X., Sun, W., Sun, S., et al. (2022). Paleo–pacific plate subduction on the eastern asian margin: insights from the jurassic foreland system of the overriding plate. GSA Bull. 134 (9–10), 2305–2320. doi:10.1130/b36118.1
Song, M., Yi, P., Xu, J., Cui, S., Shen, K., Jiang, H., et al. (2012). A step metallogenetic model for gold deposits in the Northwestern Shandong Peninsula, China. Sci. China Earth Sci. 55, 940–948. doi:10.1007/s11430-012-4366-7
Song, M. C., Li, S. Z., Santosh, M., Zhao, S., Yu, S., Yi, P. H., et al. (2015). Types, characteristics and metallogenesis of gold deposits in the Jiaodong Peninsula, eastern north China craton. Ore Geol. Rev. 65, 612–625. doi:10.1016/j.oregeorev.2014.06.019
Unal, I. (2017). Defining an optimal cut-point value in ROC analysis: an alternative approach. Comput. Math. Methods Med. 2017, 1–14. doi:10.1155/2017/3762651
Wang, G., Zhang, Z., Li, R., Li, J., Sha, D., Zeng, Q., et al. (2021). Resource prediction and assessment based on 3D/4D big data modeling and deep integration in key ore districts of North China. Sci. China Earth Sci. 64 (9), 1590–1606. doi:10.1007/s11430-020-9791-4
Wang, J. (2020). Geochemical mechanism of gold accumulation in offshore of Northern Sanshandao gold deposit in the Jiaodong gold province, Eastern China. Beijing: China University of Geosciences.
Wang, S., Yang, L., Wang, J., Wang, E., and Xu, Y. (2019). Geostatistical determination of ore shoot plunge and structural control of the Sizhuang world-class epizonal orogenic gold deposit, Jiaodong Peninsula, China. Minerals 9 (4), 214. doi:10.3390/min9040214
Xiao, F., Cheng, Q., Hou, W., and Agterberg, F. P. (2023). Three-dimensional prospectivity modeling of jinshan Ag-Au deposit, southern China by weights-of-evidence. J. Earth Sci. Avaliable at: https://kns.cnki.net/kcms2/detail/42.1788.P.20230524.1000.002.html.
Yang, L., Deng, J., Wang, Z., Guo, L., Li, R., Groves, D., et al. (2016). Relationships between gold and pyrite at the Xincheng gold deposit, Jiaodong Peninsula, China: implications for gold source and deposition in a brittle epizonal environment. Econ. Geol. 111 (1), 105–126. doi:10.2113/econgeo.111.1.105
Youden, W. J. (1950). Index for rating diagnostic tests. Cancer 3 (1), 32–35. doi:10.1002/1097-0142(1950)3:1<32::aid-cncr2820030106>3.0.co;2-3
Yousefi, M., and Carranza, E. J. (2015). Prediction–area (P–A) plot and C–a fractal analysis to classify and evaluate evidential maps for mineral prospectivity modeling. Comput. Geosciences 79, 69–81. doi:10.1016/j.cageo.2015.03.007
Yu, X., Song, M., Li, D., Tian, J., and Wang, L. (2016). Prospecting breakthroughs and prospect of gold deposits in Shandong Province. Acta Geol. Sin. 90 (10), 2847–2862.
Zhang, Z., Wang, G., Carranza, E. J. M., Liu, C., Li, J., Fu, C., et al. (2023). An integrated machine learning framework with uncertainty quantification for three-dimensional lithological modeling from multi-source geophysical data and drilling data. Eng. Geol. 324, 107255. doi:10.1016/j.enggeo.2023.107255
Zhu, R., Fan, H., Li, J., Meng, Q., Li, S., and Zeng, Q. (2015). Decratonic gold deposits. Sci. China Earth Sci. 58 (9), 1523–1537. doi:10.1007/s11430-015-5139-x
Keywords: three-dimensional geological modeling, geostatistical structural analysis, fault morphology, Jiaoxibei gold field, Xincheng deposit
Citation: Liu X, Wang G, Lv J, Peng Y and Zhao X (2024) Three-dimensional modeling and geostatistical structural analysis for ore deposit prospecting trend and wisdom mining: a case study in the Jiaoxibei gold field, China. Front. Earth Sci. 12:1217016. doi: 10.3389/feart.2024.1217016
Received: 04 May 2023; Accepted: 15 January 2024;
Published: 31 January 2024.
Edited by:
Juergen Pilz, University of Klagenfurt, AustriaReviewed by:
Polina Lemenkova, University of Salzburg, AustriaLiang Qiu, China University of Geosciences, China
Ahmed M. Eldosouky, Suez University, Egypt
Fan Xiao, Sun Yat-sen University, China
Yelena Van Der Grijp, AngloGold Ashanti, South Africa
David Rose, University of the Witwatersrand, South Africa
Copyright © 2024 Liu, Wang, Lv, Peng and Zhao. This is an open-access article distributed under the terms of the Creative Commons Attribution License (CC BY). The use, distribution or reproduction in other forums is permitted, provided the original author(s) and the copyright owner(s) are credited and that the original publication in this journal is cited, in accordance with accepted academic practice. No use, distribution or reproduction is permitted which does not comply with these terms.
*Correspondence: Gongwen Wang, Z3d3YW5nQGN1Z2IuZWR1LmNu