 Henry J. M. Gage
 Julia P. Nielsen
 Carolyn H. Eyles
- 1School of Earth, Environment, and Society, McMaster University, Hamilton, ON, Canada
- 2Department of Ecology and Evolutionary Biology, Princeton University, Princeton, NJ, United States
Thermomechanical processes caused by short- and long-term temperature fluctuations are a prevalent weathering mechanism on exposed rock walls. While many authors have explored the potential for thermomechanical weathering in alpine and polar regions, few have examined the effects of seasonality on weathering in temperate climates. This is pertinent as seasonal climatic conditions may influence both short-term temperature oscillations which produce incipient fractures and diurnal-to annual-scale cycles which propagate pre-existing fractures via thermal fatigue. In this study, three rock outcrops located along the Niagara Escarpment in Hamilton, Canada were monitored to examine changes in the thermal regime at the rock surface and within pre-existing fractures over a 1-year period. Temperature was sampled in 1-min intervals, providing data at a fine temporal resolution. Our unique dataset demonstrates that the rock surface and fracture experience minute-scale temperature oscillations which magnify over time. Longer-term temperature cycles during the year are superimposed upon minute- and diurnal-scale fluctuations which likely augment weathering potential. This produces considerable thermal stress over the year which we estimate to be on the order of 18 GPa at the rock surface and 8 GPa in fractures. We also observed diurnal reversals of the temperature gradient between the rock surface and fracture which may further amplify crack propagation. Seasonality and site-specific characteristics interact to modify different components of the rockwall thermal regime. Vegetation shading has seasonal and diurnal-scale impacts on the temperature gradient between the surface and fracture, and the amplitude of daily warming and cooling cycles. Aspect has a stronger influence on minute-scale temperature oscillations. Estimates of diurnal thermal stress indicate that the thermomechanical weathering potential is seasonally variable, but highest in the spring. Our findings demonstrate that in a temperate climate, rockwall thermal regimes experience variability across the gradient of temporal scale with strong seasonal effects.
1 Introduction
Thermomechanical processes are often cited as an influential mechanism for weathering of exposed rock walls, particularly in alpine and polar environments (Hall, 1999; Aldred et al., 2015; Morcioni et al., 2022). Fluctuations in solar radiation perform mechanical work by heating and cooling rock, resulting in expansion-contraction cycles (Hall and Thorn, 2014). When changes in temperature are rapid (i.e., at the scale of 1 minute or less) and of significant magnitude, the tensile strength of the rock may be exceeded. Termed thermal shock, this mechanism is often responsible for critical fracturing in which incipient fractures are produced (Hall and Thorn, 2014; Lamp et al., 2016). There remains significant debate in the literature about the magnitude of temperature changes required for thermal shock to occur or whether such a threshold exists, but many authors suggest that fluctuations must exceed 1°C–5 C/min in situ (Richter and Simmons, 1974; Hall, 1999; Thirumalai and Demou, 2003; Boelhouwers and Jonsson, 2013; Hall and Thorn, 2014; Wang et al., 2016; Fan et al., 2020). In addition to producing fractures via thermal shock, long-term cycles in temperature may cause thermal fatigue, a form of weathering in which expansion-contraction cycles below the tensile strength accumulate over time to drive sub-critical expansion of pre-existing fractures (Hall, 1999; Gunzburger et al., 2005; Vicko et al., 2009; Lamp et al., 2016; Marmoni et al., 2020; Morcioni et al., 2022).
Many authors have explored the role of thermomechanical processes in alpine and polar regions, which are subject to temperature extremes with rapid heating and cooling (Roth, 1965; Smith, 1977; Kerr et al., 1984; McGreevy, 1985; Warke and Smith, 1998; Hall and André, 2001; Hall et al., 2002; Gunzburger et al., 2005; McAllister et al., 2013; Eppes et al., 2016; Lamp et al., 2016; Morcioni et al., 2022). However, few have investigated thermomechanical weathering in temperate climates, despite the potentially significant role that seasonality plays in dictating the thermal regime (Gischig et al., 2011; Warren et al., 2013; Greif et al., 2017; Marmoni et al., 2020). This is a critical knowledge gap to address as data collected on thermomechanical weathering under climatic extremes cannot be translated to temperate climates (McAllister et al., 2017).
This study investigates thermomechanical weathering processes on the exposed rock face of the Niagara Escarpment in Hamilton, Ontario. The Niagara Escarpment is a heavily eroded cuesta located within a temperate climate in the northeastern United States and southern Ontario, Canada. The cuesta creates a topographic divide that bisects urban areas in Hamilton, where the highly fractured caprock renders the escarpment susceptible to rockfall and poses significant risks to urban infrastructure and safety (Formenti et al., 2022). In Hamilton, major roadways are situated meters away from exposed rock walls at high risk of slope failure, which have repeatedly caused significant damage (Dongen, 2016). A more thorough understanding of slope stability in this area is needed, yet few authors have explored the role of thermomechanical weathering processes in this region (Fahey and Lefebure, 1998; Gage et al., 2022).
In a temperate climate, seasonal oscillations in temperature are superimposed upon short-term changes initiated by solar radiation (e.g., Marmoni et al., 2020). This means that studies of weathering in temperate regions should examine the thermal regime across the gradient of temporal scale. Many authors have observed diurnal heating-cooling cycles which follow patterns in solar radiation (Hœrlé, 2006; Eppes et al., 2010; Gunzburger and Merrien-Soukatchoff, 2011; Smith et al., 2011). The magnitude of the diurnal temperature excursion, and rate of morning warming and evening cooling, determine the amount of thermal stress to which the rock is predisposed on a daily basis (Marmoni et al., 2020). In addition to this oscillatory pattern, rapid temperature changes occur as a result of shifts in cloud cover and wind, which cause minute-scale heating and cooling events (McAllister et al., 2013). When combined with seasonal shifts in the thermal regime, this can produce a high level of thermal stress as expansion-contraction processes operating at fine temporal scales augment or counteract temperature changes occurring over longer periods of time.
One issue with many field studies of thermomechanical weathering is that their focus is either on short- (e.g., Mufundirwa et al., 2011) or long-term (e.g., Gischig et al., 2011) temporal scales. This is problematic as the temperature changes relevant to rapid weathering can only be assessed at a temporal resolution of 1 min or finer (Hall, 1999), whereas long-term sub-critical processes such as thermal fatigue emerge at greater temporal scales (Gunzburger et al., 2005). It is therefore necessary to obtain data at a high temporal resolution, but for a sufficiently lengthy study period to interpret the interplay between these mechanisms of weathering.
Studies of thermomechanical processes must also account for the many site-specific characteristics that impact the distribution and intensity of weathering (McAllister et al., 2013). For instance, aspect determines the amount of solar radiation received by an outcrop which influences the diurnal temperature excursion and frequency of rapid temperature changes (McAllister et al., 2017). Vegetation intercepts insolation (Knipling, 1970), which may shift temperature peaks and the rate of warming/cooling experienced throughout the day (Winterringer and Vestal, 1956). Lithology also dictates parameters which control heat distribution (e.g., specific heat capacity, diffusivity; Warke and Smith, 1998; Hall, 1999), and fracturing (e.g., Young’s Modulus, tensile strength; Eppes and Keanini, 2017), while pre-existing fractures may impact the amplitude of thermal cycles (Eppes et al., 2016; Lamp et al., 2016; Marmoni et al., 2020). Given that these characteristics dictate the magnitude and frequency of thermomechanical processes, field studies must consider how they interact with seasonality.
This study seeks to examine the influence of temporal scale and site-specific characteristics on thermomechanical weathering processes along the Niagara Escarpment in Hamilton, Canada, with the following aims: i) to assess the role of seasonality in determining the potential for thermomechanical weathering processes in a temperate climate; ii) to characterize the thermal regime across the gradient of temporal scale in exposed rock outcrops of the Niagara Escarpment; and iii) to evaluate the relationship between site-specific characteristics and the outcrop thermal regime across temporal scales.
2 Materials and methods
2.1 Study site
The Niagara Escarpment is a Paleozoic sedimentary cuesta which spans 1,046 km from the northeastern United States to southern Ontario in Canada (Luczaj, 2013; Figure 1). During the upper Ordovician and lower Silurian periods, dolostone, sandstone, and shale strata accumulated in shallow marine environments across the region (Wallace and Eyles, 2015). Quaternary glaciation caused subsequent glacial and fluvial erosion of these Paleozoic sedimentary rocks creating the steeply sloped cuesta present today (Meyer and Eyles, 2007).
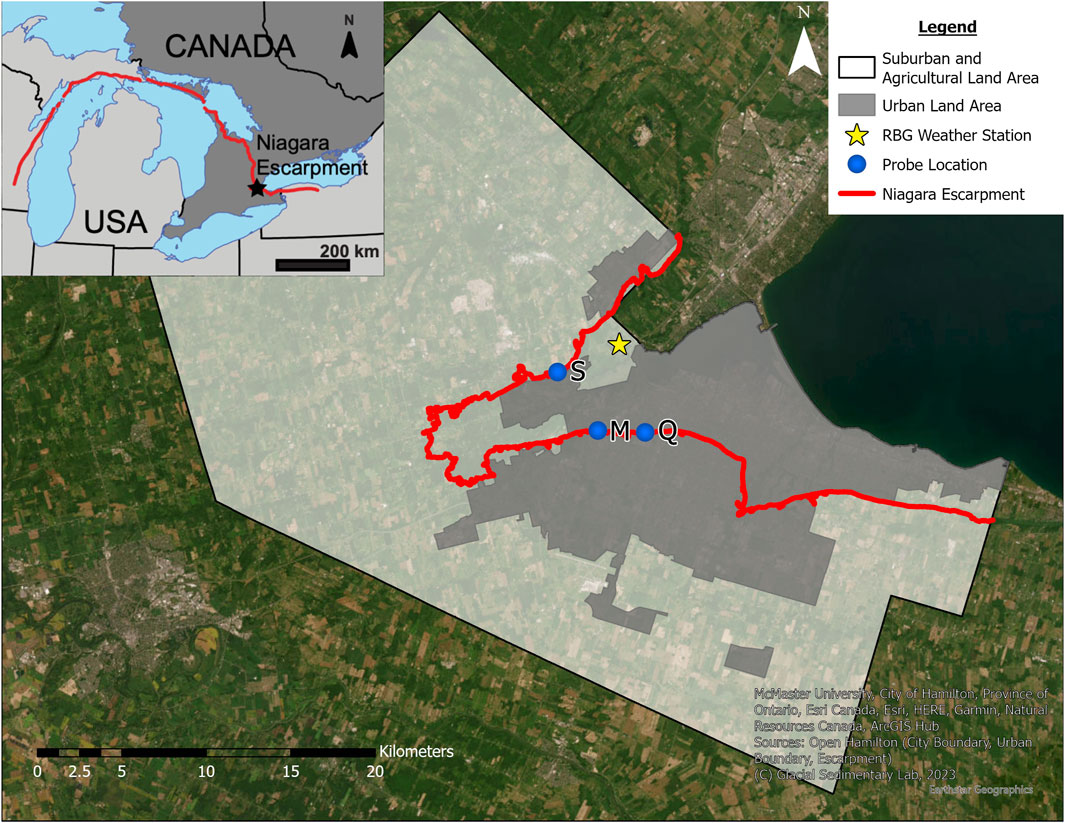
FIGURE 1. Map of study region and in-situ sites along the Niagara Escarpment. Blue dots indicate study sites [S = Sydenham Hill (S1, S2), M = Mountview Falls (M1, M2), Q = Queen St. Hill (Q1, Q2)]; red line indicates Niagara Escarpment.
This study examines the uppermost strata of the cuesta exposed in Hamilton, Ontario, specifically the Gasport Formation, Ancaster Member of the Goat Island Formation, Irondequoit Formation, and Rochester Formation (Figure 2). The Goat Island and Gasport formations belong to the 30 m thick Lockport Group that comprises the highly fractured dolomitic caprock (Hayakawa and Matsukura, 2010). The caprock overlies shales of the Rochester Formation, resulting in abrupt overhangs due to undercutting and differential erosion (Brunton et al., 2009; Stieglitz, 2016).
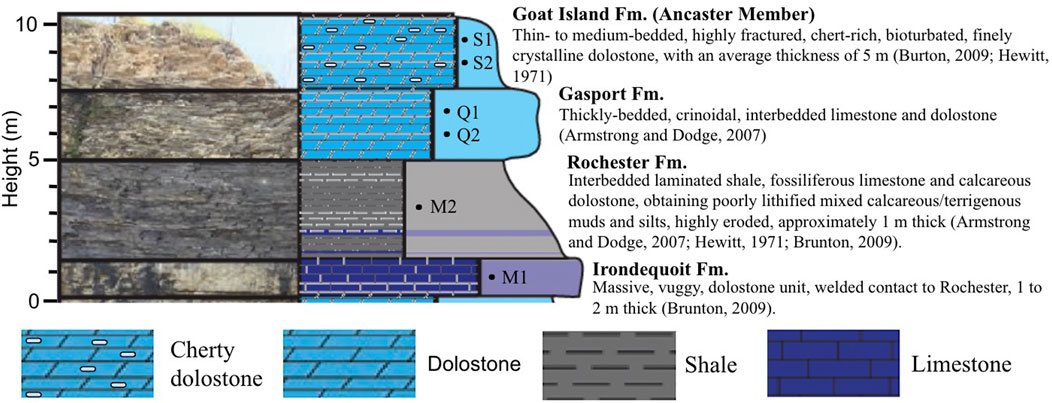
FIGURE 2. Uppermost lithological units exposed along the Niagara Escarpment in the Hamilton region. (Adapted from Formenti et al., 2022).
According to the Köppen-Geiger climate classification Hamilton, Ontario lies within a hot-summer humid continental climatic zone (Peel et al., 2007). This temperate region experiences significant seasonal temperature variability with warm summers (≥22°C) and cool winters (≤0°C). The mean daily maximum temperature of the hottest month is 27.3°C and the mean daily minimum temperature is −8.5°C in the coldest month, with a mean annual temperature range of −4.7°C–22°C (1981–2010; Environment and Climate Change Canada, 2013). The region experiences on average 897.1 mm of precipitation per year, most of which occurs during the summer months (Environment and Climate Change Canada, 2013).
2.2 In-Situ instrumentation
To examine the rockwall thermal regime, rock surface and fracture temperatures were recorded in situ at two sampling locations within three outcrop sites in the study area (Figure 1; Table 1; see Gage et al., 2022) between 1 January 2021 and 1 January 2022. The Sydenham Hill site (sampling locations “S1” and “S2”) is a southeast-facing, highly fractured dolostone outcrop of the Ancaster Member of the Goat Island Formation. Instrument location S1 is an east-facing, vertical fracture that is densely shaded by vegetation during the growing season, whereas S2 is a south-facing vertical fracture with no vegetation cover. The Queen St. Hill site (sampling locations “Q1” and “Q2”) is an east-facing, heavily fractured dolostone exposure of the Gasport Formation. Sampling locations Q1 and Q2 are both horizontal bedding plane fractures which are not directly shaded by vegetation but located in a forested area with high canopy cover during the growing season. The Mountview Falls site (sampling locations “M1” and “M2”) is an outcrop featuring bedded dolostone and shale strata located near a small cascade waterfall. M1 is situated in a vertical fracture within the massively bedded dolostone of the Irondequoit Formation on the east-facing side of the outcrop, with no vegetation cover. The M2 location is in a vertical dolostone fracture of the Rochester Formation on the west-facing side of the outcrop, with light canopy cover during the growing season. All fractures were empty and not involved in water circulation through the outcrop. These sampling locations were selected because they are relatively inaccessible to passersby and vary in site-specific characteristics such as aspect, lithology, fracture aperture, and vegetation cover which are expected to modulate the thermal regime.
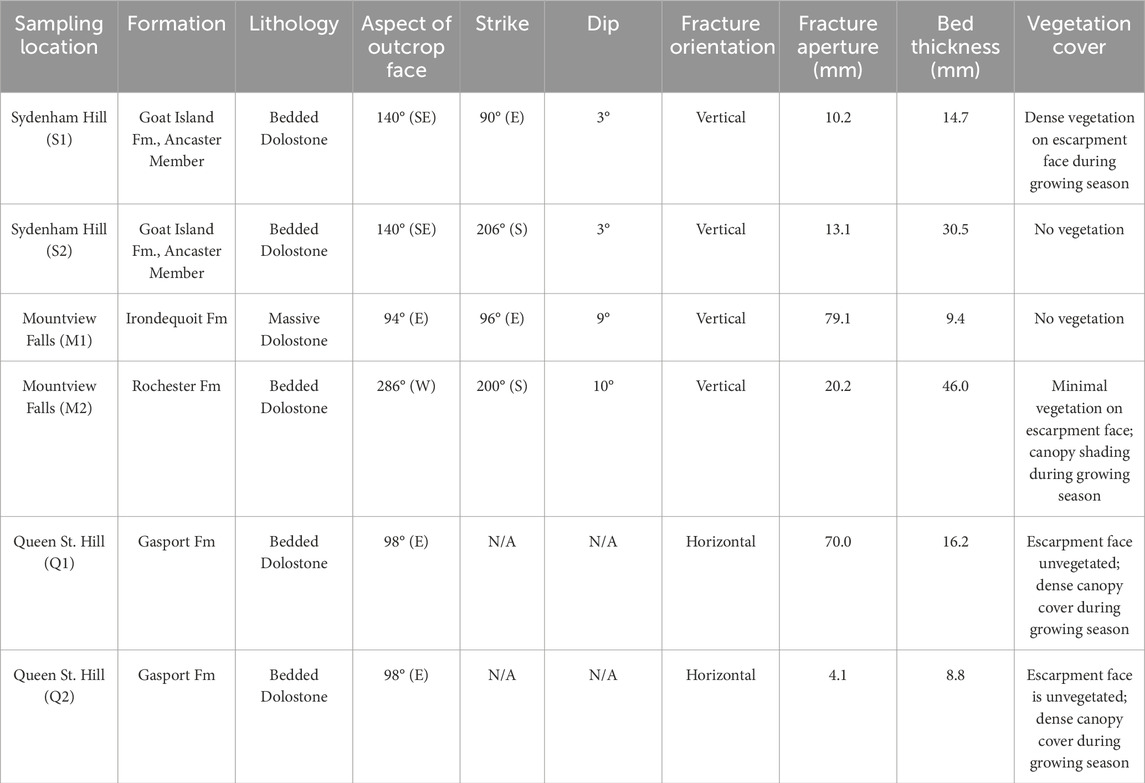
TABLE 1. Site characteristics of sampling locations.
Dual-thermistor HOBO MX2303 Data Loggers (accuracy ±0.2°C) were installed at each site to record temperatures at 1-min intervals throughout the study period, providing sufficiently frequent measurements to assess fine-scale temperature variability at both the surface and fracture. One thermistor tip was inserted at maximum depth into a pre-existing fracture (∼20 cm), while the second was affixed to the rock, touching the surface at the mouth of the fracture using clear silicone gel. Both thermistor tips were coated with dolostone rock dust from the Gasport Formation using a thin layer of clear silicone gel to minimize differences in radiative properties between the thermistor tip and rockwall. Silicone is an insulator and therefore may result in more conservative estimates of temperature changes. We expect this effect to be consistent across sites, which should not impact inter-site comparisons or the interpretation of temperature patterns over time.
2.3 Climate data
Climate data were obtained from the Royal Botanical Gardens Weather Station operated by Environment and Climate Change Canada to describe the seasonal changes in meteorological conditions in the study area. This station is located close to the sampling locations (43° 170′ 11.1″ N, 79° 540′ 18.78″ W; 144 m above sea level; Figure 1) and records hourly air temperature measurements. We defined each season by dividing the year into 3-month periods (winter—December to February; spring—March to May; summer—June to August; autumn—September to November).
2.4 Statistics
The surface-fracture temperature gradient (hereafter “SF gradient”) was determined at each sampling location by calculating the difference between the temperature recorded by the rock surface thermistor and fracture thermistor. This gradient is employed to assess the potential generation of thermal stress within the outcrops, and to quantify diurnal to seasonal shifts in temperature gradients that may produce expansion-contraction cycles related to thermal fatigue. Positive values of the SF gradient indicate that the rock surface is warmer than the fracture, whereas negative values indicate that the fracture is warmer than the surface.
To assess variability in the thermal regime at a fine temporal scale, we identified every minute-scale temperature oscillation occurring at the rock surface and fracture over the study period and measured the amplitude and duration of the oscillation. At the daily scale, we identified diurnal temperature cycles manually by observing the raw data and extracting data points corresponding to the initial trough, peak, and final trough associated with diurnal temperature oscillations. We extracted the data manually as there is considerable variability in the shape of the temperature time series. Many instances where minute-scale rapid temperature changes produce local peaks and troughs made it difficult to correctly identify the diurnal temperature excursion and decline via an automated process. The daily trough and peak temperatures and times were recorded for every third day and verified by two of the authors. These data were then used to calculate the slope of the temperature excursion in the morning and recession in the evening. Given that this analysis was concerned with differences in the rate and magnitude of daily temperature increase and decrease in response to the pattern of insolation, we excluded days which exhibited a monotonic temperature trend, or had temperature peaks well before or after peak insolation had occurred (before ∼8:00 and after ∼21:00). These days represent a significant departure from the typical temperature trend across all sites which closely follows insolation trends, with a temperature peak near midday.
Thermal stress (σ, in units Pa) was estimated from the diurnal temperature cycles and minute-scale oscillations for each site using the following equation, which assumes that each outcrop is of uniform material:
where α represents the thermal expansion coefficient (°K-1), E represents Young’s Modulus (Pa), and ΔT represents the change in temperature (°K) between the initial and final times. Lithological parameters used for each formation are found in Supplementary Table S1. The diurnal magnitude of the temperature excursion and recession for each outcrop was used as ΔT to calculate the thermal stress upon heating and cooling, respectively. Thermal stress from heating and cooling were summed to estimate the total thermal stress experienced during the day. Thermal stress is produced across both temporal and spatial scales (Eppes et al., 2016; Ravaji et al., 2019), and is influenced by factors not considered in this formula, such as the presence of discontinuities, spatial variability in lithology, grain size, and duration of the oscillation (e.g., Lamp et al., 2016; Anderson, 2019). The objective of this study was not to precisely quantify the amount of thermal stress to which the outcrops were subjected, but rather to make comparisons between sites about the potential for thermomechanical weathering.
To investigate the lag time between the rock surface and fracture temperature, we determined the cross-correlation function between the surface and fracture thermistors at each site using the biwavelet package in R 4.3.1. The time interval over which there was the strongest correlation was extracted to determine the lag time between the rock surface and fracture. We grouped the data by season and calculated summary statistics for the SF gradient, minute-scale temperature oscillations, and daily temperature cycles in R 4.3.1.
3 Results
3.1 Climate conditions
Seasonal climate conditions reflect that the study region is situated in a temperate climate, with warm (mean 21.6°C) summers and cold winters (mean −1.11°C; Table 2). The seasonal temperature range during the study period was greatest in the spring (41.2°C) and lowest in the summer (25.4°C), while the mean daily temperature range was greatest in the spring (10.6°C) and summer (10.1°C) and lowest in the winter (6.76°C).
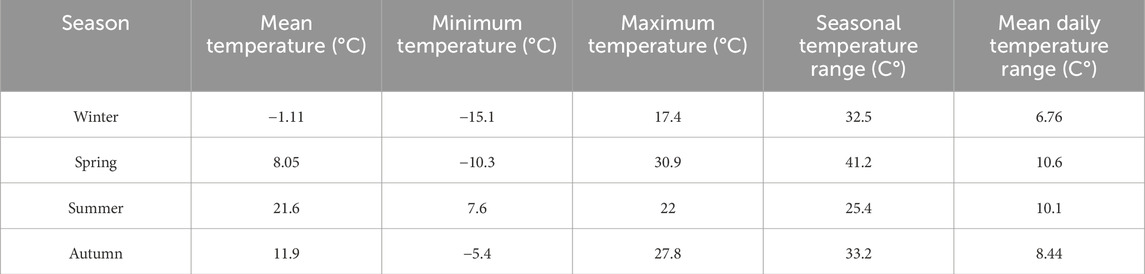
TABLE 2. Temperature conditions during study period 1 January 2021–1 January 2022.
3.2 Minute-scale thermal regime
All sampling locations experienced ∼300 temperature oscillations on a daily basis throughout the study period. At both the rock surface and fracture, the daily mean oscillation length ranged from approximately 4–8 min (Figures 3A,B). The mean rock surface oscillation length was highest at S1 and S2, followed by M1 and M2, and Q1 and Q2 throughout the study period. Oscillation length increased in the spring and summer relative to the autumn and winter. In the fractures, the Sydenham Hill and Queen St. sites experienced similar daily mean oscillation durations across seasons, whereas oscillations at the Mountview sites were about 1 minute shorter on average. Oscillation length exhibited slightly less seasonality in the fractures than at the rock surface.
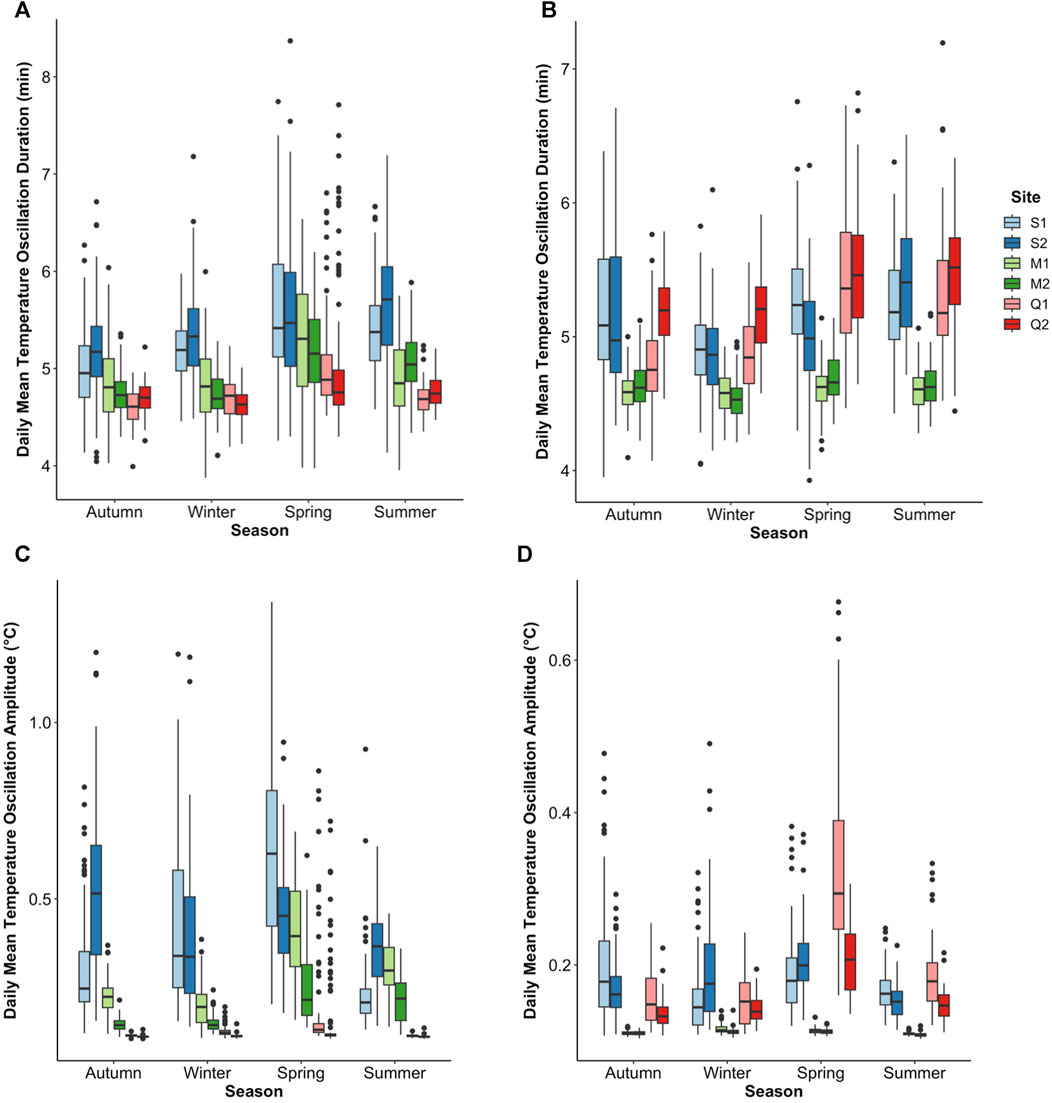
FIGURE 3. Duration (A), rock surface; (B), fracture and magnitude (C), rock surface; (D), fracture of minute-scale temperature oscillations by sampling location (Sydenham Hill, S1, S2; Mountview Falls, M1, M2; Queen Street Hill, Q1, Q2).
Differences among sites in the daily mean oscillation amplitude were more pronounced and followed similar patterns at the rock surface (Figure 3C). Oscillation amplitude was highest at Sydenham Hill, followed by Mountview and Queen St., which had oscillations that were approximately an order of magnitude smaller than at Sydenham. There were few differences across seasons, except for a much higher daily mean amplitude at M1 and M2 during the spring and summer, and a much lower amplitude at S1 and S2 during the summer. As with the oscillation duration, the mean daily amplitude in fractures was similar between the Sydenham and Queen St. sites, except during the summer when Q1 had a much higher daily mean amplitude than any other sampling location (Figure 3D). M1 and M2 experienced very low amplitude oscillations across all seasons.
3.3 Diurnal-scale thermal regime
The SF gradient at the Mountview Falls (M1, M2) and Sydenham Hill sites (S1, S2) followed diurnal patterns in insolation, with a peak in the gradient toward midday in all four seasons (Figure 4). In general, the rock surface was warmer than the fracture during the day, and cooler at night. The opposite was true of the Queen St. Hill sites (Q1, Q2), which peaked in the morning and reached the lowest point in the early afternoon, when the fracture recorded warmer temperatures than the rock surface.
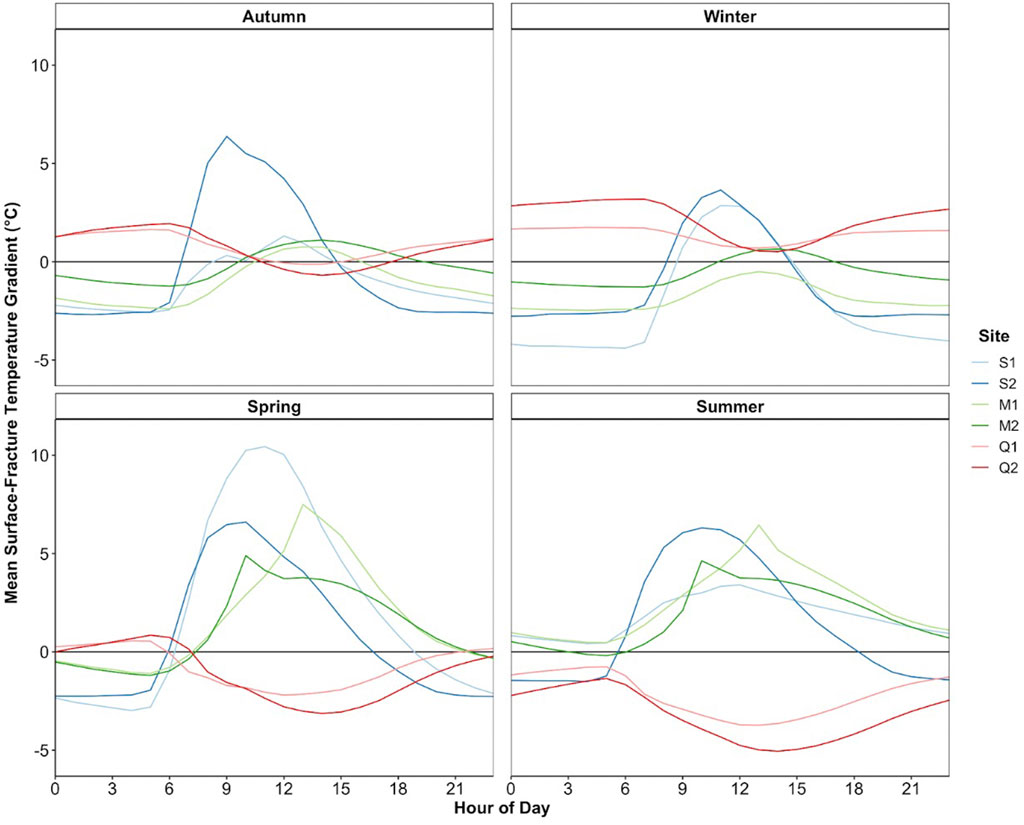
FIGURE 4. Mean diurnal surface-fracture temperature gradient by sampling location (Sydenham Hill, S1, S2; Mountview Falls, M1, M2; Queen Street Hill, Q1, Q2).
The Sydenham Hill sites (S1 and S2) had the greatest mean diurnal range in the SF gradient (S2, 12.3°C ± 5.66°C; S1, 10.8°C ± 7.99°C) throughout the study period, followed by those at Mountview Falls, M1 (8.12°C ± 5.80°C) and M2 (5.94°C ± 4.81°C), and Queen Street Hill, Q1 (4.32°C ± 3.20°C) and Q2 (5.00°C ± 2.59°C).
The mean diurnal temperature excursion at the rock surface was greatest at Sydenham S1 (2.84°C ± 2.35 °C) and S2 (3.04°C ± 2.04 °C), moderate at the Mountview sites M1 (1.22°C ± 1.24 °C) and M2 (1.06°C ± 1.48°C), and small at Queen Street Hill Q1 (0.37°C ± 1.10 °C) and Q2 (0.42°C ± 1.60 °C). In the fracture, mean diurnal temperature excursions were much lower on average, and similar at the Q1 (0.66°C ± 0.97 °C), Q2 (0.73°C ± 0.71 °C), S1 (0.74°C ± 0.73 °C), and S2 (0.82°C ± 0.43 °C) sites. Fracture temperature was relatively stable at M1 (0.07°C ± 0.04 °C) and M2 (0.07°C ± 0.04 °C).
3.4 Seasonal-scale thermal regime
The SF gradient was most positive at Sydenham Hill (S1 and S2) during the spring and most negative during the winter (Figure 5). The maximum SF gradient occurred at about 10:00 at S2 and 11:00 at S1 throughout the study period. At Mountview Falls (M1) the SF gradient in the autumn and winter was more negative than at M2 and similar to Sydenham Hill, with a smaller daily maximum. In the spring and summer, the SF gradient was much larger on average and similar to the values observed at S1 and S2. During the day at the Queen Street Hill sites (Q1 and Q2) there was an inversion of the SF temperature gradient. The gradient was most negative in the spring and summer. In the autumn and winter the average fracture temperature was not warmer than the surface at any time.
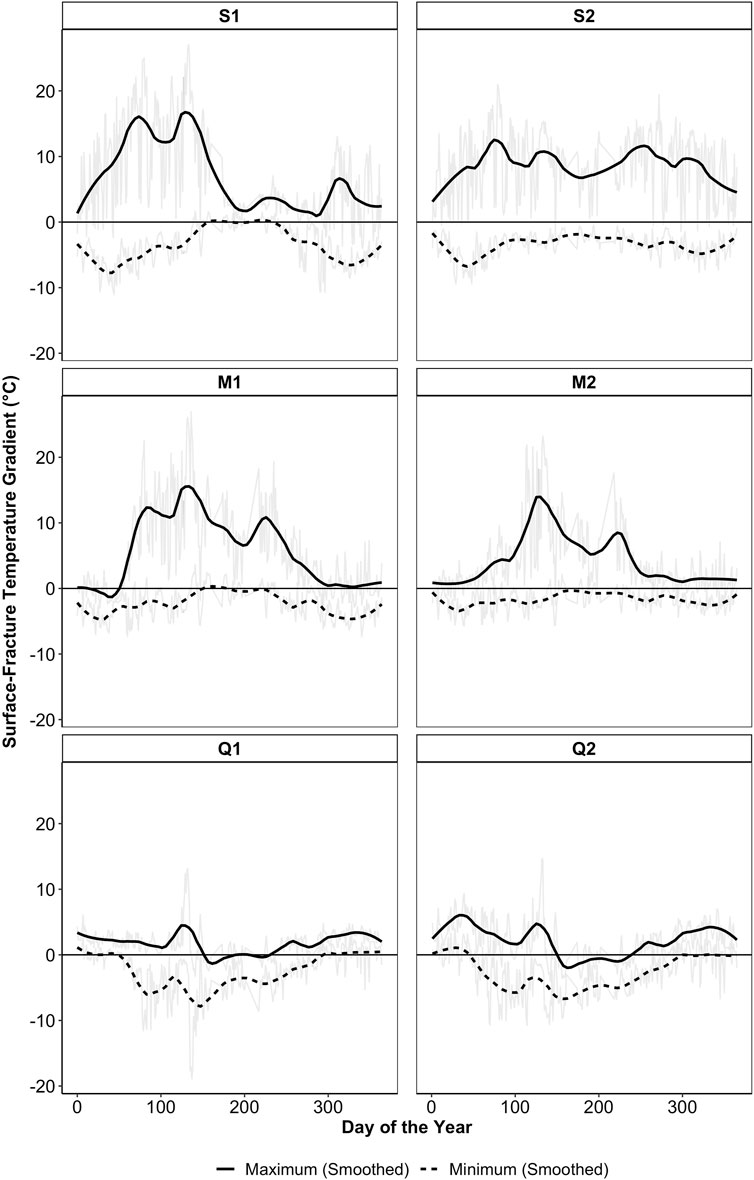
FIGURE 5. Annual variability in the surface-fracture temperature gradient recorded at each sampling site (Sydenham Hill, S1, S2; Mountview Falls, M1, M2; Queen Street Hill, Q1, Q2). Black lines represent loess-smoothed maximum and minimum temperature gradient; light grey lines represent raw data.
The diurnal range in the SF gradient was highest in the late winter and early spring at S1 and M1, and during the spring at Q1 and Q2 (Figure 5). It was stable year-round at S2. All sites reached a peak in the diurnal maximum (positive; surface warmer than the fracture) gradient during the spring, and a relatively small diurnal maximum in the winter. The minimum gradient was negative throughout the study period across all outcrops, indicating that there is a consistent diurnal inversion of the temperature gradient between surface and fracture. The fracture was warmest relative to the surface during the winter at S1 and S2, and during the spring at Q1 and Q2, but the minimum diurnal gradient remained stable year-round at M2.
Across all seasons, the mean rate of warming and cooling recorded at the rock surface was greater than in the fracture, excluding Q2 in the spring (Table 4; Table 5). The Sydenham Hill sites (S1 and S2) consistently experience the fastest warming of the surface, which is at minimum 1.5 times greater than at all other sampling locations. The most drastic surface cooling temperature changes are recorded by S2 during the colder seasons (autumn, winter), and M1 and M2 during the warmer seasons (spring, summer). Q1 and Q2 experienced the slowest rates of surface cooling and warming across all seasons. This trend differs considerably inside the fractures, for which the greatest warming rates are recorded by Q2 during winter and spring (Table 4). Conversely, during autumn and summer, S1 and S2 show the greatest rate of warming in the fracture. The Sydenham Hill site, S2 records the highest rate of cooling in the fracture in summer, fall and winter; the Q1 site shows the highest rate of fracture cooling in the spring (Table 4). The rate of fracture cooling at sites M1 and M2 is consistently low during all seasons.
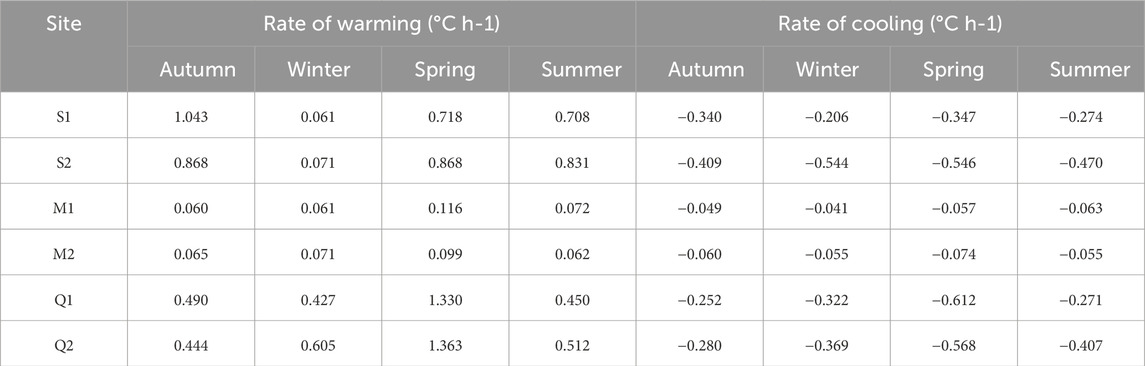
TABLE 4. Rate of fracture diurnal warming and cooling by site (Sydenham Hill, S1, S2; Mountview Falls, M1, M2; Queen Street Hill, Q1, Q2) and season.
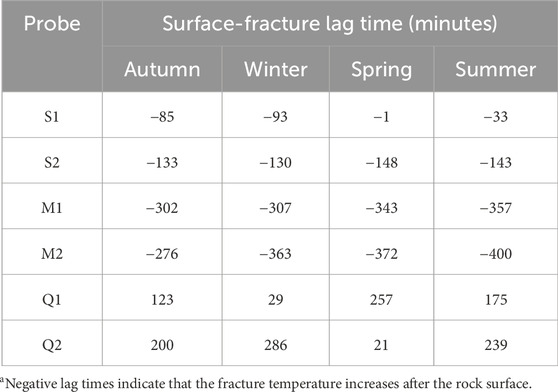
TABLE 5. Wavelet cross-correlation lag times between rock surface and fracture by probe (Sydenham Hill, S1, S2; Mountview Falls, M1, M2; Queen Street Hill, Q1, Q2).
When measuring the amplitude of the daily heating-cooling cycle, we estimated diurnal thermal stress of approximately 1–20 MPa at the rock surface and 0–1 MPa in fractures across sites (Figures 6A,B). Measuring every minute-scale temperature oscillation yielded diurnal thermal stress estimates far larger at both the rock surface (5–100 MPa) and fracture (10–30 MPa; Figures 6C,D). The relatively high thermal stress at S1 and S2 was consistent across seasons, and far larger than at M1 and M2, which was low in the autumn and winter and higher in the spring and summer. At Q1 and Q2, heating-cooling cycles during the study period were insufficient to generate much thermal stress at the rock surface in comparison to the other sites, but larger temperature fluctuations in the fractures produced considerable (≥10 MPa) thermal stress on a daily basis. Over the entire study period we estimate the cumulative thermal stress to be as high as ∼18 GPa at S1 and S2 at the rock surface and ∼8 GPa in the fractures.
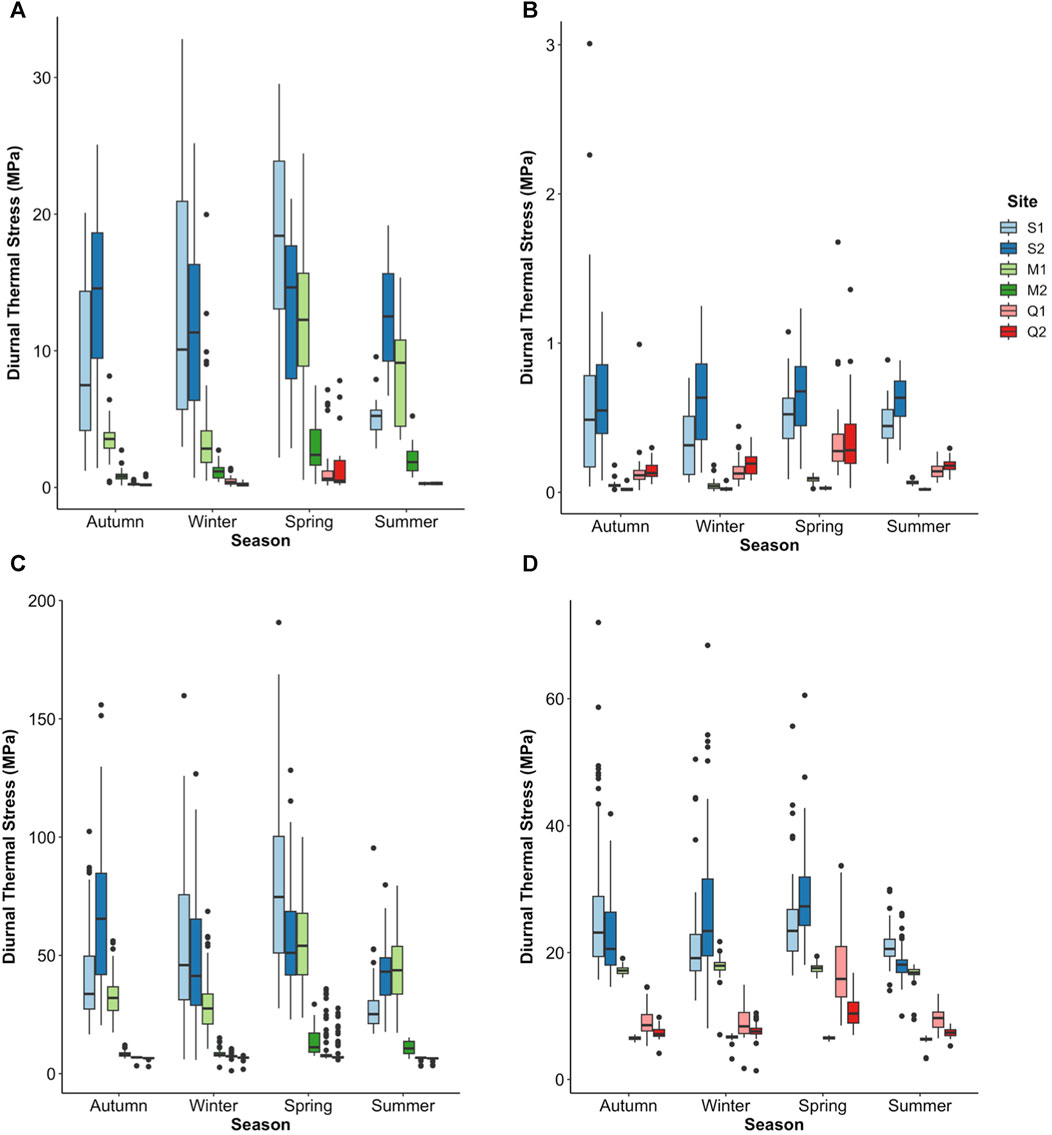
FIGURE 6. Diurnal thermal stress generated at the rock surface and in the fracture by sampling location (Sydenham Hill: S1, S2; Mountview Falls: M1, M2; Queen Street Hill: Q1, Q2) and season. Thermal stress in (A) (rock surface) and (B) (fracture) were estimated from the daily temperature excursion, whereas stress in (C) (rock surface) and (D) (fracture) were estimated by measuring and summing every temperature oscillation throughout the day at the minute-scale.
All sites recorded hysteresis in the mean diurnal rock surface and fracture temperatures (Figure 7). Across all seasons, site S2 experienced the largest diurnal oscillation in both surface and fracture temperature, followed closely by S1. The orientation of the long axis and size of each ellipse shown on the hysteresis plots (Figure 7) indicates that sites M1 and M2 had larger oscillations in surface temperature than fracture temperature, whereas the opposite was true of sites Q1 and Q2. At Sydenham Hill (S1 and S2), the diurnal rise and fall in surface and fracture temperatures are proportional. Notably, the orientation and size of the hysteresis ellipses changed little between seasons, except S1, which shows larger amplitude oscillations in the winter and spring than in the summer and autumn, with an orientation skewed more toward variability in surface temperature. The shape and orientation of hysteresis ellipses are similar between sampling locations at each site.
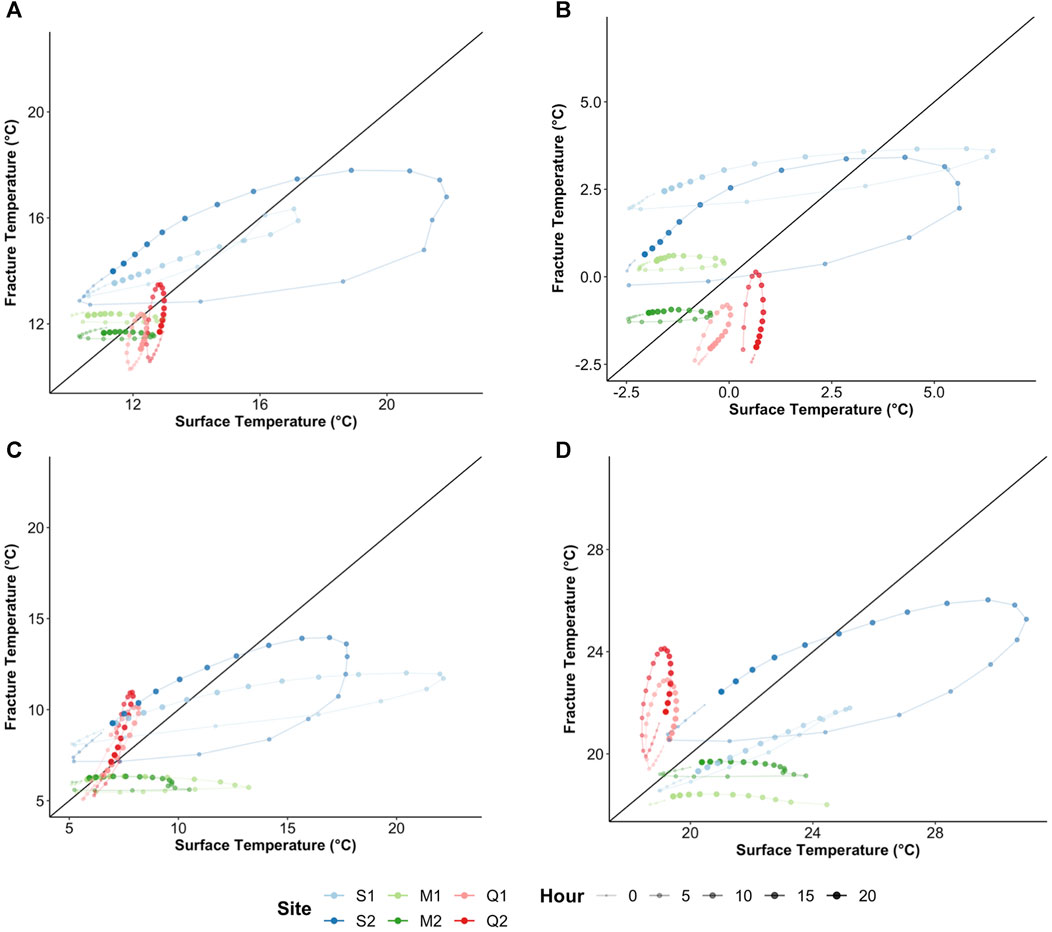
FIGURE 7. Hysteresis plots illustrating mean hourly surface and fracture temperature by probe (Sydenham Hill, S1, S2; Mountview Falls, M1, M2; Queen Street Hill, Q1, Q2) during autumn (A), winter (B), spring (C), and summer (D).
Fracture temperature lagged changes in surface temperature recorded at the Sydenham Hill (S1 and S2) and Mountview sites (M1 and M2), but not at the Queen St. sites (Q1 and Q2; Table 5). Probe S1 experienced very little lag time in the spring and the highest lag time in the winter, whereas the opposite was true of S2, which had the highest lag time in the spring and shortest in the winter. Both M1 and M2 experienced a steady increase in lag time from autumn to summer, respectively. In contrast, changes in surface temperature lagged fracture temperature the greatest amount during the spring at Q1 and winter at Q2, and the least during the winter at Q1 and spring at Q2.
4 Discussion
4.1 Seasonality of thermomechanical processes
Our findings suggest that seasonality exerts a strong influence on the potential for thermal fatigue. At the rock surface, the rates of diurnal warming and cooling were especially high during the spring across all sites, and low during the winter at the rock surface (Table 3). The same trends were observed for the magnitude of diurnal temperature excursions and minute-scale oscillations, with the largest excursions recorded during the spring and the smallest excursions during the winter (Figure 3). We suggest that this is due to the variability in climatic conditions typical of spring in a temperate climate. This includes both precipitation, which can influence insolation and insulate the rockwall during snowfall, and ambient temperature, which was most variable in the spring. A more direct angle of insolation during the spring also increases radiative heat flux throughout the day. The effects of these factors have been documented elsewhere (e.g., Hall and André, 2001; Matsuoka, 2008; Gunzburger and Merrien-Soukatchoff, 2011; Vasile and Vespremeanu-Stroe, 2016; Kellerer-Pirklbauer, 2017; Draebing, 2021; Taye and Viles, 2021), although not in relation to weathering seasonality. Diurnal temperature cycles and minute-scale oscillations occurred more slowly in fractures and rates were consistent across seasons (Table 4; Figure 3). Fractures experienced much smaller temperature oscillations because they do not experience direct insolation for most of the day and are therefore most likely to be controlled by conduction from the rock surface and convection of ambient temperature which operate more slowly and weakly than radiative heat flux (Gunzburger and Merrien-Soukatchoff, 2011).
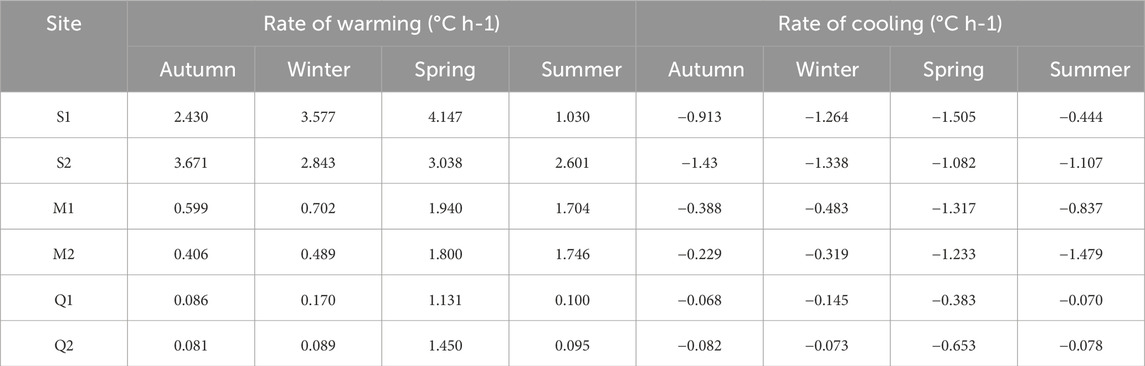
TABLE 3. Rate of surface diurnal warming and cooling by site (Sydenham Hill, S1, S2; Mountview Falls, M1, M2; Queen Street Hill, Q1, Q2) and season.
Collectively, these results indicate that the thermal regime is the most dynamic during the spring and least dynamic during the winter. Given that the rate of warming or cooling necessary for weathering is temperature-independent (i.e., temperature changes are equally effective irrespective of the season; Hall and André, 2001), weathering potential should also be highest in the spring in the study region. A more energetic thermal regime with frequent temperature changes may enhance weathering by raising the probability of rapid temperature changes and amplifying expansion-contraction cycles which drive thermal fatigue (McAllister et al., 2017). These results support the findings of Racek et al. (2021) who measured rock slopes in Czechia and determined that crack movements were greatest during the spring and autumn, during which they recorded the largest oscillation in rock surface temperature. Similarly, Gómez-Heras et al. (2006) investigated thermomechanical weathering in granite and determined that the spring and autumn seasons experience the highest frequency of large, rapid temperature changes which result in weathering. Studies of freeze-thaw processes in alpine and polar regions have also found that the frequency and magnitude of short-term temperature fluctuations are greatest during the shoulder seasons, which results in higher rates of crack formation and expansion (Thorn, 1979; Matsuoka, 2001; 2008). Some studies have determined that thermomechanical weathering intensity is highest during the summer (Greif et al., 2017; Marmoni et al., 2020); however, their results are consistent with our finding that the potential for weathering is linked to temperature variability.
We observed hysteresis between the mean hourly surface and fracture temperatures at all sites during the study period, indicating that both the rock surface and fractures experience routine cyclical heating and cooling year-round (Figure 7). Previous work suggests that these warming-cooling cycles result in a hysteretic temperature-deformation response throughout the day (Collins and Stock, 2016; Fiorucci et al., 2018; Draebing, 2021). The orientation of the hysteretic pattern remained relatively constant across seasons which reflects that the relationship between surface and fracture temperature is independent of seasonality in climatic conditions. The diurnal pattern of the SF gradient was also unimpacted by seasonality, peaking near midday at all sites throughout the study period. This is consistent with Breytenbach (2022), who also observed a peak in the temperature gradient between the rock surface and subsurface near midday when radiative heat flux is strongest. We conclude that seasonality does not strongly influence the timing of diurnal temperature patterns between surface and fracture.
The magnitude of the SF gradient, however, did exhibit strong seasonality, with high positive (surface warmer than fracture) mean values in the spring, and more negative values (fracture warmer than the surface) in the winter months. During the spring, solar insolation heats the surface, while the cooler ambient temperature moves through convective currents in fractures. In the winter, solar insolation is less intense, reducing the surface temperature relative to fractures which retain heat due to the thermal properties of the rockwall (Fiorucci et al., 2018). The exception to this trend was at Queen Street Hill (Q1 and Q2), where the SF gradient was negative during all seasons except in the winter. This is likely due to the orientation of the vegetation canopy relative to the rockwall which is situated in a forested area (see section 4.3). Changes in the SF gradient have implications for thermal fatigue because spatial variability in temperature gradients enhances deformation and weathering rates (Marmoni et al., 2020).
The data do not provide evidence for thermal shock, given that deformation data is required to confirm the rate of temperature change required for critical fracturing to occur in situ (Boelhouwers and Jonsson, 2013; Eppes et al., 2016). However, the data do emphasize that irrespective of vegetation cover or aspect, higher magnitude temperature oscillations occur at the scale of minutes during the spring months at the study site (Figure 3). This may be due to higher variability in climatic conditions during the shoulder seasons which can rapidly alter radiative heat flux. These fine-scale temperature oscillations produce a higher thermal stress than in other seasons (Figure 5), and may be more likely to result in thermal shock (as in Hall and Thorn, 2014; Ravaji et al., 2019) which necessitates rapid temperature fluctuations that exceed the tensile strength of the rock.
The magnitude and duration of minute-scale temperature oscillations exhibited little seasonality in fractures. The fracture thermal regime is unlikely to facilitate rapid temperature changes as it is dominated by conduction through rock or convection of air into the open space of the fracture (Zhou et al., 2022). Our finding aligns with the notion that pre-existing fractures provide planes of weakness for subcritical fracture propagation, rather than the production of incipient cracks (Eppes et al., 2016; Lamp et al., 2016).
4.2 Temporal scales
By collecting data at short 1-min intervals across all seasons, our findings reveal that the temperature regime creates thermal stress across multiple temporal scales. At the finest scale, we observed a high frequency of temperature oscillations <10 min in duration at both the rock surface and fracture. Variability in the thermal regime at this scale is likely due to short-term changes in weather conditions, such as shifts in wind speed and direction or cloud cover which can rapidly heat or cool the rock surface (McFadden et al., 2005; Warren et al., 2013; Lamp et al., 2016). Temperature changes documented in surface rocks were larger and may be sufficient to cause critical fracturing (Hall and Thorn, 2014), or more likely, accelerate subcritical fracture growth throughout the day by causing variability in spatiotemporal stress gradients on the rock surface (Eppes et al., 2016).
Temperatures within pre-existing fractures appear to be relatively unaffected by these surficial changes. Fractures may only be warmed directly by insolation for short portions of the day when the angle of incidence aligns with the fracture orientation. These instances likely explain the occasional high magnitude oscillations observed in the fractures. In general, however, heat flux through the rock does not transmit temperature changes at the surface rapidly to the fracture via conduction. Fracture aperture, surface roughness, infilling material, and specific heat capacity all impact the efficiency of conductive heat transfer (Chen and Zhao, 2020).
At the diurnal scale, all sites experienced warming-cooling cycles resulting from daily patterns of insolation. The mean temperature excursions recorded were 15°C or higher at the rock surface and 5°C in pre-existing fractures (Figure 7). Our findings align with previous work which indicates that minimum rock surface temperatures are similar to the minimum ambient temperature, whereas the maximum daily temperature peak is often about 10°C higher than the maximum ambient temperature across climates (Hall and André, 2001; McKay et al., 2009; Eppes et al., 2016). The temperature changes we observed in fractures are similar to those that have been measured at depths of ∼50 cm in the rock subsurface, which experiences less variability than the rock surface due to thermal diffusivity (Gunzburger and Merrien-Soukatchoff, 2011; Racek et al., 2021; Breytenbach, 2022).
Over time, these diurnal temperature cycles cause subcritical failure (e.g., Eppes et al., 2016; Collins et al., 2018) resulting from repetitive thermal stresses which we estimate to be 5–100 MPa daily when the temperature excursion is greatest (Figure 6). Warming-cooling cycles producing stress of this magnitude are sufficient to cause subcritical fracture propagation by causing routine expansion and contraction of pre-existing fractures (i.e., thermal fatigue; Eppes and Keanini, 2017). Hysteretic crack expansion and contraction resulting from diurnal temperature changes has been observed to result in breakage by expanding discontinuities over time (Draebing, 2021; Racek et al., 2021). Collins and Stock (2016) measured the work performed upon discontinuities by hysteretic cycles which aligns with our finding that diurnal warming and cooling can exert a high magnitude of thermal stress.
In addition to diurnal warming-cooling cycles, we also observed a daily reversal in the temperature gradient between the rock surface and pre-existing fractures (Figure 4). Similar temperature gradient inversions have been documented between the rock surface and subsurface in sandstone blocks (Halsey et al., 1998) and in the field (Breytenbach, 2022). This temperature gradient reversal may impose further thermal stress upon the outcrop by varying the spatiotemporal distribution of warming and cooling rates. When ambient temperatures are cooling, the subsurface is warmer than the rock surface which produces tensile stress through the rock, whereas during ambient warming periods the surface is warmer than the subsurface, creating compressive stress (Hall, 1999). Reversals of the SF gradient likely result from a difference in heat fluxes at the surface and fracture, whereby the surface warms faster in the day due to radiative heat flux while the fracture retains heat in the evening as the surface loses heat via conduction. The temporal lag between the rock surface and fracture may also exaggerate this process.
Diurnal temperature cycles are superimposed upon weekly or monthly-scale variability in the thermal regime which occur at irregular time intervals and magnitudes (e.g., Figure 8). Periodic warm or cool intervals reflect changes in meteorologic conditions, such as changing cloud cover, high winds, and precipitation which can attenuate temperature changes by reducing insolation and cooling (rainfall) or insulating (snow cover) the rock surface (Hall and André, 2001; Matsuoka, 2008; Gunzburger and Merrien-Soukatchoff, 2011; Vasile and Vespremeanu-Stroe, 2016; Kellerer-Pirklbauer, 2017; Fiorucci et al., 2020; Draebing, 2021; Taye and Viles, 2021). While we did not aim to quantify such events, they can certainly be observed in the temperature time series (e.g., Figure 8B), suggesting that outcrops experience net warming or cooling over periods of days to weeks while also fluctuating in temperature diurnally. On the annual scale, seasonality results in the largest warming and cooling cycles which are further superimposed upon the variability we measured at finer temporal scales. Seasonality also modulates diurnal- and hourly-scale variability in the thermal regime as a result of solar path variation and sun elevation (Fiorucci et al., 2018), which may shift the relationship between temperature oscillations occurring across scales as the seasons change (see section 4.1.).
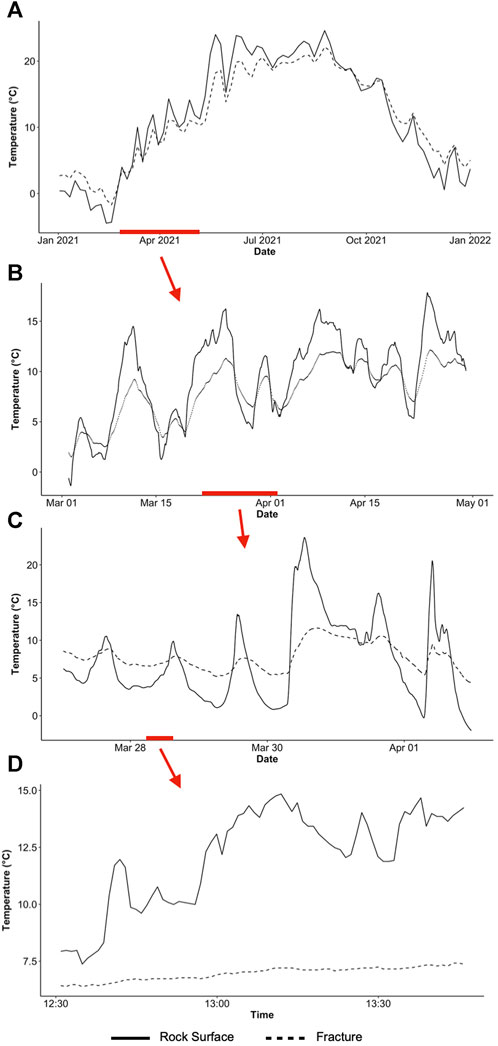
FIGURE 8. Rock surface and fracture temperature oscillations at Sydenham Hill (S1 site) during the study period at (A) annual, (B) monthly, (C) daily, and (D) hourly scales. Data were smoothed with the following parameters: annual scale, loess smoothed (span 0.2); monthly scale, 2-day moving average; daily scale, hourly moving average. Red bars represent the extent of each figure illustrated in the figure below.
Temperature cycles operating at different temporal scales can amplify weathering intensity by increasing spatiotemporal stress gradients. Long-term warming-cooling cycles tend to penetrate deeper into the subsurface than diurnal temperature oscillations and are driven by conduction between the rock surface and subsurface (Gómez-Heras et al., 2006; Fiorucci et al., 2020; Breytenbach, 2022). In the large (centimeter-scale) fractures we instrumented, these prolonged and deeply penetrating temperature cycles are likely responsible for subcritical crack propagation, as has been demonstrated in studies of thermal fatigue (Racek et al., 2021) and freeze-thaw processes (Matsuoka, 2008). Over finer temporal scales, short-term oscillations in temperature do not penetrate deeply but occur frequently and quickly magnify thermal fatigue (Gómez-Heras et al., 2006). Accordingly, the surface and near-subsurface experience many thermal stress events which cause irregularities in the expansion and contraction of the rockwall relative to the deeper subsurface and pre-existing fractures (Racek et al., 2021). This increases thermal loading over time (Gunzburger et al., 2005).
While it is broadly recognized that temperature changes at different temporal scales result in weathering (Halsey et al., 1998; Gunzburger et al., 2005; Collins and Stock, 2016; Draebing, 2021; Racek et al., 2021; Breytenbach, 2022), few authors to date have collected data which characterizes the thermal regime over multiple temporal scales in a temperate climate. Our findings demonstrate the benefit of collecting data at a high temporal frequency over a long study period which can capture temperature changes at the scale of minutes, days, weeks, and months (Figure 8). This has significant implications for weathering because the timing, rate, and magnitude of temperature changes over one temporal scale may either reinforce or counteract changes occurring at another scale (Marmoni et al., 2020).
The discrepancy between the thermal stress we estimated when analyzing only the daily temperature excursion versus minute-scale temperature oscillations reinforces that fine-scale temporal data is required to precisely understand weathering mechanics. Indeed, others have suggested that rock temperature measurements must be taken at a frequency of 1 minute or greater to identify rapid temperature changes related to thermal shock (e.g., Hall, 1999). Yet here we demonstrate that a finer temporal resolution is also critical to capturing the temperature oscillations that drive thermal fatigue. By measuring minute-scale temperature oscillations we estimated the total thermal stress to be nearly an order of magnitude higher on a daily basis than by measuring daily temperature excursions alone.
4.3 Site-specific factors influencing weathering potential
While previous work has described the role of various site-specific factors in thermomechanical weathering (e.g., Warke and Smith, 1998; McAllister et al., 2013; 2017; Eppes et al., 2016), our data illustrate that these factors do so at varying temporal scales, and are only relevant to certain components of the thermal regime (see Figure 9 for conceptual summary). For instance, there is a clear interaction between seasonal temperature variability and vegetation. Much of the vegetation at our study sites is deciduous and intercepts insolation during the growing season. This lowers the surface-fracture temperature gradient by reducing the effect of rapid radiative warming at the rock surface relative to the fracture. At the Sydenham sites, the lack of vegetation at S2 resulted in a relatively stable magnitude of the SF gradient year-round, whereas the growth of vegetation cover at S1 caused a sharp decline in the magnitude of the gradient during the growing season (Figure 5). There was also a very short lag time between surface and fracture temperature at S1, but a long lag time at S2, which suggests that when vegetated, the rockwall thermal regime becomes driven by changes in ambient temperature at both the surface and fracture. Vegetation may also influence temperature oscillations occurring at shorter temporal scales by attenuating the rate and amplitude of daily warming-cooling cycles, as was observed in the growing season at S1 compared to S2 (Figure 4).
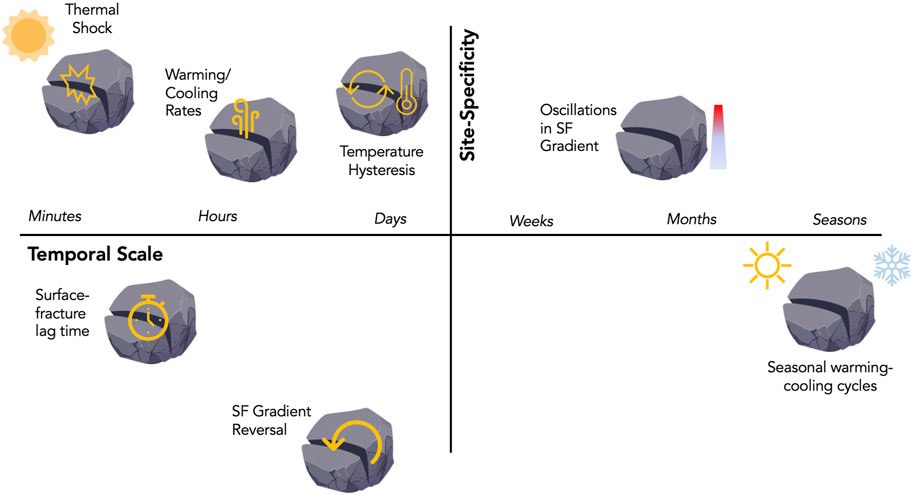
FIGURE 9. Conceptual diagram illustrating relative differences in the temporal scale at which thermomechanical processes occur, and their dependence on site-specific characteristics. SF Gradient—surface-fracture temperature gradient.
At the Queen Street Hill sites, there is a unique trend in the diurnal cycle of the SF temperature gradient, whereby the fracture is warmer than the surface in the late morning and early afternoon, while the surface warms relative to the fracture in the early morning and evening (Figure 4). We suggest that this trend is also due to vegetation cover as both sites are situated on a slope which is heavily vegetated by mature trees. During the early morning, when the solar position is low on the horizon, the sites receive direct insolation as sunlight passes through the tree trunks beneath the canopy. Approaching midday when the solar position is much higher, the canopy intercepts insolation and the rock surface cools relative to the fracture as it is shaded. The same process is likely to occur in the early evening. This may also explain why rock surface temperature change lags behind fracture temperature change, as the rock surface cools once it is shaded by the canopy while the fracture continues to warm as the ambient temperature rises. To our knowledge this is the first observation of this effect and it warrants further investigation.
Unlike vegetation cover, aspect has a strong influence at the minute- and diurnal-scale. Our findings that the southeast-facing Sydenham sites experienced the largest minute-scale temperature oscillations, SF gradient, diurnal temperature excursion, and rates of daily warming and cooling align with previous work emphasizing that south-facing sites experience more intense radiative heat flux during the day (Matsuoka, 2008; Ng et al., 2014; Widen and Munkhammar, 2019). Draebing (2021) also found that aspect influences the thermal regime at the daily scale by producing diurnal temperature variations four times greater at southerly aspects compared to northerly aspects. In turn, the larger amplitude of warming-cooling cycles at south-facing aspects raises weathering rates both in the field and experimentally (Vasile and Vespremeanu-Stroe, 2016; Martínez-Martínez et al., 2023). The magnitude of minute-scale oscillations also increased at the Sydenham sites because changes in cloud cover and precipitation will result in more intense changes to rock surface temperature at southeast-facing aspects (Gunzburger et al., 2005; Fiorucci et al., 2020). The east- and west-facing Mountview Falls (M1 and M2) and Queen Street Hill (Q1 and Q2) sites exhibit similar hysteretic warming-cooling behaviour to Sydenham, but with a smaller magnitude and rate of temperature change due to their aspect relative to the solar position (Garg and Datta, 1993).
Lithology influences variability in the thermal regime at broader temporal scales by dictating the rate and magnitude of temperature changes that result from heat flux into or out of the rock (e.g., via thermal diffusivity and thermal conductivity; Weiss et al., 2004). M1 and M2 are the only sampling locations at the same site which differ in lithology—during the winter months, where the canopy cover is negligible, there were large differences in the peak SF gradient, rates of warming and cooling, and amplitude of diurnal warming-cooling cycles (Figures 4, 7; Tables 3 and 4). This may be due to the fact that these sampling locations differ in thermal conductivity (Modlich, 2014; Maldaner et al., 2019), which influences the rate of conduction that can be achieved between the surface and subsurface, as well as during outward heat flux from the rockwall during the evening. However, it is difficult to attribute these differences entirely to lithology given that there are differences in aspect between M1 and M2.
Lithological parameters also dictate the magnitude of thermal stress imposed on the outcrop by the thermal regime as they control the rate and magnitude of deformation (Weiss et al., 2004). For instance, sites S1 and S2 are in bedded dolostone (Supplementary Table S1) of the Goat Island Fm., with a moderately high thermal expansion coefficient (7.6 × 10⁻⁶ °K-1), and very high Young’s Modulus (62 GPa) in comparison to the shale of the Rochester Fm. (M2) and dolostone of the Goat Island Fm. (Q1 and Q2; 23 GPa and 27 GPa, respectively; Supplementary Table S1). Our estimates of diurnal thermal stress are an order of magnitude larger at S1 and S2 than at most other sites. This, in part, reflects the fact that the magnitude of expansion and contraction with temperature change will be greater in rock with a high thermal expansion coefficient, and that stiffer rock (i.e., with a higher Young’s Modulus) will experience higher tensile and compressive stress during deformation. Eppes and Keanini (2017) developed a model for subcritical cracking resulting from climatic cycles which demonstrates that lithological properties such as these control both the thermal regime experienced by the rock and the propensity for crack propagation to occur during temperature changes. Experimental observations from numerous authors reinforce that deformation in response to temperature change, and consequently thermomechanical weathering rates, differ between lithologies (McGreevy, 1985; Warke et al., 1996; Weiss et al., 2004).
Lithology does not appear to have a significant influence on processes occurring at the minute-scale (e.g., the duration or amplitude of temperature cycles), which are driven by insolation. This is perhaps because the thermal properties that differ between the lithologies examined in this study have a stronger influence on conductive heat flux (e.g., conductivity, diffusivity; Modlich, 2014; Maldaner et al., 2019) than radiative heat flux (e.g., albedo), although more work is required to confirm that this is indeed the case.
An interesting finding was that minute-scale temperature oscillations in the fractures, but not diurnal cycles, appeared to be much larger at Q1 and Q2 than at other sites. One explanation for this trend is that fractures at these sites are oriented horizontally. Vertically-oriented fractures (S1, S2, M1, and M2) may experience more consistent periods of direct insolation when the solar angle is at an appropriate inclination to reach the interior of the fracture. The horizontal fractures at this site may experience more sporadic insolation into the fracture interior at moments when the sun is at a low angle and passes through the trees surrounding the rockwall. Thus, dependent on fracture orientation and time of day, the primary mechanism of heat transfer may alternate between convection controlled by the ambient temperature and radiation through direct insolation. Additionally, the intensity and density of fractures within the thermally active layer of the rockwall can alter heat flux propagation between the surface and fracture crack tips which may explain the rapid oscillations we observed (Fiorucci et al., 2018).
4.4 Limitations and future work
To evaluate the potential influence of site-specific characteristics on the thermal regime, we compared sites differing in aspect, lithology, and vegetation. However, there are numerous other confounding variables that were not monitored here. For instance, topographic variability creates distinct micro-climates across an outcrop by modifying the amount of solar radiation received by the rock face (Dubayah, 1994). Albedo also modifies the absorption of short-wave radiation which impacts subsurface temperatures and SF gradients (Warke and Smith, 1998). Some authors have considered moisture in addition to temperature changes as it may shift the thermal properties of rock outcrops and enhance weathering rates (Elliott, 2008). Further work should consider the role of these factors in controlling thermomechanical weathering processes, and control for each of the site characteristics we examined to isolate their potential effects.
The characteristics (aperture, length, depth) of the fractures we instrumented may further influence the thermal regime by determining the rate at which heat can enter and exit the fracture via convection and conduction (see Gage et al., 2022 for discussion of potential effects of fracture characteristics). For instance, fracture aperture modifies the magnitude of temperature oscillations inside of fractures and thermal stress gradients across an outcrop (Marques et al., 2017). At the Queen Street Hill sites (Q1 and Q2) this may contribute to the inverted SF gradient as these are the only sites with horizontal bedding plane fractures. Even when temperature changes are not significant enough to produce new cracks, insolation-driven thermal stresses expand pre-existing fractures via subcritical cracking, a process dependent on the magnitude and frequency of temperature oscillations (Eppes et al., 2016). To draw conclusions about the role of fracture characteristics future research should examine crack aperture, volume, roughness, orientation, and shape while controlling for other site-specific factors.
There remains much debate in the literature about whether thermomechanical weathering can be consistently identified based solely on rock temperature data (Hall and Thorn, 2014). While our data provide important insight on the seasonality of the thermal regime and potential for subcritical fracture propagation resulting from warming-cooling cycles (i.e., thermal fatigue), future work should gather deformation data to directly link temperature changes to weathering (e.g., Collins and Stock, 2016; Eppes et al., 2016; Draebing, 2021; Racek et al., 2021). We recognize that the use of silicone to affix rock dust to the thermistors is a limitation of our instrumentation. Thermistors insulated with a layer of silicone may underestimate the magnitude of temperature changes. Our absolute temperature measurements should be treated with caution, although we do not expect this to influence our interpretations as this effect was applied uniformly across sites. We prioritized affixing rock dust to the thermistors because the high albedo of the thermistor tip would have variable impacts on temperature measurements across sites given their differences in insolation strength.
5 Conclusion
This work aims to characterize the in situ thermal regime at fractured rock outcrops in a temperate climate. Our unique dataset provides insight on the thermal regime across multiple temporal scales, indicating that the rock surface and fracture experience: i) frequent temperature oscillations at the minute-scale which magnify thermal stress over time; ii) diurnal warming-cooling cycles characteristic of those able to generate thermal fatigue; iii) oscillations in the magnitude and direction of the SF gradient; and iv) long-term seasonal warming and cooling phases superimposed on variability at finer temporal scales. These temperature changes are significant because they may augment or attenuate one another to amplify the thermal stress experienced by the rockwall. The potential for thermomechanical weathering is highest during the spring months, when the amplitude of warming-cooling cycles is the largest and the frequency of minute-scale temperature oscillations is high. Site-specific factors, particularly aspect and vegetation cover, operate at varying temporal scales to modify the thermal regime.
Vegetation influences the thermal regime at the diurnal and seasonal scales by modifying the amount of insolation received by the rock surface. Outcrops with less vegetation cover experienced larger amplitude warming-cooling cycles, and higher surface-fracture temperature gradients year-round than those shaded by vegetation which had attenuated temperature fluctuations during the growing season. At the minute-scale, aspect influences the magnitude of rapid temperature changes; southeast-facing outcrops experience a higher diurnal thermal stress resulting from stronger temperature oscillations throughout the day. Lithology also plays a role in dictating thermal stress by determining daily warming and cooling rates.
The thermal regime we observed is likely to cause subcritical expansion of pre-existing cracks by subjecting outcrops to repeated expansion-contraction cycles. There is potential for critical fracturing to occur at southeast-facing, unvegetated outcrops where insolation is strongest. Future work should aim to control site-specific characteristics to determine the role of individual factors such as fracture aperture and lithology in thermomechanical weathering potential. Our findings emphasize that seasonality and fine-scale thermal variability in temperate climates may facilitate a spatially and temporally dynamic weathering regime.
Data availability statement
The raw data supporting the conclusion of this article will be made available by the authors, without undue reservation.
Author contributions
HG: Conceptualization, Data curation, Formal Analysis, Funding acquisition, Methodology, Project administration, Visualization, Writing–original draft, Writing–review and editing. JN: Data curation, Formal Analysis, Writing–original draft, Writing–review and editing. CE: Conceptualization, Funding acquisition, Project administration, Supervision, Writing–review and editing.
Funding
The author(s) declare that no financial support was received for the research, authorship, and/or publication of this article.
Acknowledgments
We thank Joseph Hansen and Eric Pettipiece for their frequent support with fieldwork throughout the study. We are grateful for the funding which supported this research from the National Science and Engineering Research Council of Canada (HJM Gage, NSERC USRA; C.E., NSERC Discovery Grant: RGPIN-2019-06568), the Geological Society of America (HJM Gage, Northeastern Section Undergraduate Research Grant), and Mitacs (HJM Gage, Mitacs Research Training Award).
Conflict of interest
The authors declare that the research was conducted in the absence of any commercial or financial relationships that could be construed as a potential conflict of interest.
Publisher’s note
All claims expressed in this article are solely those of the authors and do not necessarily represent those of their affiliated organizations, or those of the publisher, the editors and the reviewers. Any product that may be evaluated in this article, or claim that may be made by its manufacturer, is not guaranteed or endorsed by the publisher.
Supplementary material
The Supplementary Material for this article can be found online at: https://www.frontiersin.org/articles/10.3389/feart.2024.1318747/full#supplementary-material
References
Aldred, J., Eppes, M. C., Aquino, K., Deal, R., Garbini, J., Swami, S., et al. (2015). The influence of solar-induced thermal stresses on the mechanical weathering of rocks in humid mid-latitudes. Earth Surf. Process. Landforms 41, 603–614. doi:10.1002/esp.3849
Anderson, S. P. (2019). Breaking it down: mechanical processes in the weathering engine. Elements 15, 247–252. doi:10.2138/gselements.15.4.247
Boelhouwers, J., and Jonsson, M. (2013). Critical assessment of the 2°c-min−1 threshold for thermal stress weathering. Geogr. Ann. Ser. A, Phys. Geogr. 95, 285–293. doi:10.1111/geoa.12026
Breytenbach, I. J. (2022). Seasonal bedrock temperature oscillations and inversions as a function of depth and the implications for thermal fatigue. Phys. Geogr. 43, 401–418. doi:10.1080/02723646.2020.1847242
Brunton, F. R., Turner, E., and Armstrong, D. (2009). A guide to the paleozoic geology and fossils of manitoulin Island and northern bruce peninsula. Ontario: Canada.
Chen, Y., and Zhao, Z. (2020). Heat transfer in a 3D rough rock fracture with heterogeneous apertures. Int. J. Rock Mech. Min. Sci. 134, 104445. doi:10.1016/j.ijrmms.2020.104445
Collins, B. D., and Stock, G. M. (2016). Rockfall triggering by cyclic thermal stressing of exfoliation fractures. Nat. Geosci. 9, 395–400. doi:10.1038/ngeo2686
Collins, B. D., Stock, G. M., Eppes, M.-C., Lewis, S. W., Corbett, S. C., and Smith, J. B. (2018). Thermal influences on spontaneous rock dome exfoliation. Nat. Commun. 9, 762. doi:10.1038/s41467-017-02728-1
Dongen, M. V. (2016). Claremont Access lanes closed indefinitely after ‘slope movement.’ the Hamilton Spectator. Available at: https://www.hamiltonnews.com/news-story/6995666-claremont-access-lanes-closed-indefinitely-after-slope-movement-/.
Draebing, D. (2021). Identification of rock and fracture kinematics in high alpine rockwalls under the influence of elevation. Earth Surf. Dyn. 9, 977–994. doi:10.5194/esurf-9-977-2021
Dubayah, R. C. (1994). Modeling a solar radiation topoclimatology for the rio grande river basin. J. Veg. Sci. 5, 627–640. doi:10.2307/3235879
Elliott, C. (2008). Influence of temperature and moisture availability on physical rock weathering along the Victoria Land coast, Antarctica. Antarct. Sci. 20, 61–67. doi:10.1017/S0954102007000685
Environment and Climate Change Canada (2013). Canadian climate normals 1981-2010 station data. Available at: https://climate.weather.gc.ca/climate_normals/results_1981_2010_e.html?stnID=4937&autofwd=1.
Eppes, M.-C., and Keanini, R. (2017). Mechanical weathering and rock erosion by climate-dependent subcritical cracking. Rev. Geophys. 55, 470–508. doi:10.1002/2017RG000557
Eppes, M. C., Magi, B., Hallet, B., Delmelle, E., Mackenzie-Helnwein, P., Warren, K., et al. (2016). Deciphering the role of solar-induced thermal stresses in rock weathering. GSA Bull. 128, 1315–1338. doi:10.1130/B31422.1
Eppes, M. C., McFadden, L. D., Wegmann, K. W., and Scuderi, L. A. (2010). Cracks in desert pavement rocks: further insights into mechanical weathering by directional insolation. Geomorphology 123, 97–108. doi:10.1016/j.geomorph.2010.07.003
Fahey, B. D., and Lefebure, T. H. (1998). The freeze-thaw weathering regime at a section of the Niagara escarpment on the Bruce Peninsula, Southern Ontario, Canada. Earth Surf. Process. Landforms 13, 293–304. doi:10.1002/esp.3290130403
Fan, L., Gao, J., Du, X., and Wu, Z. (2020). Spatial gradient distributions of thermal shock-induced damage to granite. J. Rock Mech. Geotechnical Eng. 12, 917–926. doi:10.1016/j.jrmge.2020.05.004
Fiorucci, M., Marmoni, G. M., Martino, S., and Mazzanti, P. (2018). Thermal response of jointed rock masses inferred from infrared thermographic surveying (acuto test-site, Italy). Sensors 18, 2221. doi:10.3390/s18072221
Fiorucci, M., Martino, S., Bozzano, F., and Prestininzi, A. (2020). Comparison of approaches for data analysis of multi-parametric monitoring systems: insights from the acuto test-site (Central Italy). Appl. Sci. 10, 7658. doi:10.3390/app10217658
Formenti, S., Peace, A., Eyles, C., Lee, R., and Waldron, J. W. (2022). Fractures in the Niagara Escarpment in Ontario, Canada: distribution, connectivity, and geohazard implications. Geol. Mag. 159, 1936–1951. doi:10.1017/S0016756822000462
Gage, H. J. M., Eyles, C. H., and Peace, A. L. (2022). Winter weathering of fractured sedimentary rocks in a temperate climate: observation of freeze–thaw and thermal processes on the Niagara Escarpment, Hamilton, Ontario. Geol. Mag. 159, 2060–2081. doi:10.1017/S0016756822000887
Garg, H. P., and Datta, G. (1993). Fundamentals and characteristics of solar radiation. Renewable Energy 3, 305–319. doi:10.1016/0960-1481(93)90098-2
Gischig, V. S., Moore, J. R., Evans, K. F., Amann, F., and Loew, S. (2011). Thermomechanical forcing of deep rock slope deformation: 1. Conceptual study of a simplified slope. J. Geophys. Res. Earth Surf. 116, F04010. doi:10.1029/2011JF002006
Gómez-Heras, M., Smith, B. J., and Fort, R. (2006). Surface temperature differences between minerals in crystalline rocks: implications for granular disaggregation of granites through thermal fatigue. Geomorphology 78, 236–249. doi:10.1016/j.geomorph.2005.12.013
Greif, V., Brcek, M., Vlcko, J., Varilova, Z., and Zvelebil, J. (2017). Thermomechanical behavior of pravcicka brana rock arch (Czech republic). Landslides 14, 1441–1455. doi:10.1007/s10346-016-0784-5
Gunzburger, Y., and Merrien-Soukatchoff, V. (2011). Near-surface temperatures and heat balance of bare outcrops exposed to solar radiation. Earth Surf. Process. Landforms 36, 1577–1589. doi:10.1002/esp.2167
Gunzburger, Y., Merrien-Soukatchoff, V., and Guglielmi, Y. (2005). Influence of daily surface temperature fluctuations on rock slope stability: case study of the Rochers de Valabres slope (France). Int. J. Rock Mech. Min. Sci. 42, 331–349. doi:10.1016/j.ijrmms.2004.11.003
Hall, K. (1999). The role of thermal stress fatigue in the breakdown of rock in cold regions. Geomorphology 31, 47–63. doi:10.1016/S0169-555X(99)00072-0
Hall, K., and André, M.-F. (2001). New insights into rock weathering from high-frequency rock temperature data: an Antarctic study of weathering by thermal stress. Geomorphology 41, 23–35. doi:10.1016/S0169-555X(01)00101-5
Hall, K., Thorn, C., Matsuoka, N., and Prick, A. (2002). Weathering in cold regions: some thoughts and perspectives. Prog. Phys. Geogr. 26, 577–603. doi:10.1191/0309133302pp353ra
Hall, K., and Thorn, C. E. (2014). Thermal fatigue and thermal shock in bedrock: an attempt to unravel the geomorphic processes and products. Geomorphology 206, 1–13. doi:10.1016/j.geomorph.2013.09.022
Halsey, D. P., Mitchell, D. J., and Dews, S. J. (1998). Influence of climatically induced cycles in physical weathering. Q. J. Eng. Geol. Hydrogeology 31, 359–367. doi:10.1144/GSL.QJEG.1998.031.P4.09
Hayakawa, Y. S., and Matsukura, Y. (2010). Stability analysis of waterfall cliff face at Niagara Falls: an implication to erosional mechanism of waterfall. Eng. Geol. 116, 178–183. doi:10.1016/j.enggeo.2010.08.004
Hœrlé, S. (2006). Rock temperatures as an indicator of weathering processes affecting rock art. Earth Surf. Process. Landforms 31, 383–389. doi:10.1002/esp.1329
Kellerer-Pirklbauer, A. (2017). Potential weathering by freeze-thaw action in alpine rocks in the European Alps during a nine year monitoring period. Geomorphology 296, 113–131. doi:10.1016/j.geomorph.2017.08.020
Kerr, A., Smith, B. J., Brian Whalley, W., and McGreevy, J. P. (1984). Rock temperatures from southeast Morocco and their significance for experimental rock-weathering studies. Geology 12, 306–309. doi:10.1130/0091-7613(1984)12<306:RTFSMA>2.0.CO;2
Knipling, E. B. (1970). Physical and physiological basis for the reflectance of visible and near-infrared radiation from vegetation. Remote Sens. Environ. 1, 155–159. doi:10.1016/S0034-4257(70)80021-9
Lamp, J. L., Marchant, D. R., Mackay, S. L., and Head, J. W. (2016). Thermal stress weathering and the spalling of Antarctic rocks. J. Geophys. Res. Earth Surf. 122, 3–24. doi:10.1002/2016JF003992
Maldaner, C. H., Munn, J. D., Coleman, T. I., Molson, J. W., and Parker, B. L. (2019). Groundwater flow quantification in fractured rock boreholes using active distributed temperature sensing under natural gradient conditions. Water Resour. Res. 55, 3285–3306. doi:10.1029/2018WR024319
Marmoni, G. M., Fiorucci, M., Grechi, G., and Martino, S. (2020). Modelling of thermo-mechanical effects in a rock quarry wall induced by near-surface temperature fluctuations. Int. J. Rock Mech. Min. Sci. 134, 104440. doi:10.1016/j.ijrmms.2020.104440
Marques, E. A. G., Williams, D. J., Assis, I. R., and Leão, M. F. (2017). Effects of weathering on characteristics of rocks in a subtropical climate: weathering morphology, in situ, laboratory and mineralogical characterization. Environ. Earth Sci. 76, 602. doi:10.1007/s12665-017-6936-7
Martínez-Martínez, J., Berrezueta, E., Aguilera, H., and Fusi, N. (2023). Aspect influence on the weathering micro-rates of limestones exposed under semiarid coastal Mediterranean climate. Constr. Build. Mater. 392, 131942. doi:10.1016/j.conbuildmat.2023.131942
Matsuoka, N. (2001). Direct observation of frost wedging in alpine bedrock. Earth Surf. Process. Landforms 26, 601–614. doi:10.1002/esp.208
Matsuoka, N. (2008). Frost weathering and rockwall erosion in the southeastern Swiss Alps: long-term (1994–2006) observations. Geomorphology 99, 353–368. doi:10.1016/j.geomorph.2007.11.013
McAllister, D., McCabe, S., Smith, B. J., Srinivasan, S., and Warke, P. A. (2013). Low temperature conditions in building sandstone: the role of extreme events in temperate environments. Eur. J. Environ. Civ. Eng. 17, 99–112. doi:10.1080/19648189.2012.751225
McAllister, D., Warke, P., and McCabe, S. (2017). Stone temperature and moisture variability under temperate environmental conditions: implications for sandstone weathering. Geomorphology 280, 137–152. doi:10.1016/j.geomorph.2016.12.010
McFadden, L. D., Eppes, M. C., Gillespie, A. R., and Hallet, B. (2005). Physical weathering in arid landscapes due to diurnal variation in the direction of solar heating. GSA Bull. 117, 161–173. doi:10.1130/B25508.1
McGreevy, J. P. (1985). Thermal properties as controls on rock surface temperature maxima, and possible implications for rock weathering. Earth Surf. Process. Landforms 10, 125–136. doi:10.1002/esp.3290100205
McKay, C. P., Molaro, J. L., and Marinova, M. M. (2009). High-frequency rock temperature data from hyper-arid desert environments in the Atacama and the Antarctic Dry Valleys and implications for rock weathering. Geomorphology 110, 182–187. doi:10.1016/j.geomorph.2009.04.005
Meyer, P. A., and Eyles, C. H. (2007). Nature and origin of sediments infilling poorly defined buried bedrock valleys adjacent to the Niagara Escarpment, southern Ontario, Canada. Can. J. Earth Sci. 44, 89–105. doi:10.1139/e06-085
Modlich, M. A. (2014). Thermal maturity of gas shales in the Appalachian plateau of Pennsylvania. Available at: https://etda.libraries.psu.edu/files/final_submissions/10353.
Morcioni, A., Apuani, T., and Cecinato, F. (2022). The role of temperature in the stress–strain evolution of alpine rock-slopes: thermo-mechanical modelling of the cimaganda rockslide. Rock Mech. Rock Eng. 55, 2149–2172. doi:10.1007/s00603-022-02786-y
Mufundirwa, A., Fujii, Y., Kodama, N., and Kodama, J. (2011). Analysis of natural rock slope deformations under temperature variation: a case from a cool temperate region in Japan. Cold Regions Sci. Technol. 65, 488–500. doi:10.1016/j.coldregions.2010.11.003
Ng, K. M., Adam, N. M., Inayatullah, O., and Kadir, M. Z. A.Ab. (2014). Assessment of solar radiation on diversely oriented surfaces and optimum tilts for solar absorbers in Malaysian tropical latitude. Int. J. Energy Environ. Eng. 5, 75. doi:10.1007/s40095-014-0075-7
Peel, M. C., Finlayson, B. L., and McMahon, T. A. (2007). Updated world map of the Köppen-Geiger climate classification. Hydrology Earth Syst. Sci. 11, 1633–1644. doi:10.5194/hess-11-1633-2007
Racek, O., Blahůt, J., and Hartvich, F. (2021). Observation of the rock slope thermal regime, coupled with crackmeter stability monitoring: initial results from three different sites in Czechia (central Europe). Geoscientific Instrum. Methods Data Syst. 10, 203–218. doi:10.5194/gi-10-203-2021
Ravaji, B., Alí-Lagoa, V., Delbo, M., and Wilkerson, J. W. (2019). Unraveling the mechanics of thermal stress weathering: rate-effects, size-effects, and scaling laws. J. Geophys. Res. Planets 124, 3304–3328. doi:10.1029/2019JE006019
Richter, D., and Simmons, G. (1974). Thermal expansion behavior of igneous rocks. Int. J. Rock Mech. Min. Sci. Geomechanics Abstr. 11, 403–411. doi:10.1016/0148-9062(74)91111-5
Roth, E. S. (1965). Temperature and water content as factors in desert weathering. Univ. Chic. Press 73, 454–468. doi:10.1086/627077
Smith, B. J. (1977). Rock temperature measurements from the northwest Sahara and their implications for rock weathering. CATENA 4, 41–63. doi:10.1016/0341-8162(77)90011-X
Smith, B. J., Srinivasan, S., Gomez-Heras, M., Basheer, P. A. M., and Viles, H. A. (2011). Near-surface temperature cycling of stone and its implications for scales of surface deterioration. Geomorphology 130, 76–82. doi:10.1016/j.geomorph.2010.10.005
Stieglitz, R. D. (2016). Processes that have shaped the Niagara escarpmen. Geoscience Wisconsin 22. Available at: https://wgnhs.wisc.edu/pubshare/GS22-a02.pdf.
Taye, B., and Viles, H. (2021). Impacts of climatic seasonality on weathering of rock-cut structures at Lalibela, Ethiopia. Copernic. Meet. doi:10.5194/egusphere-egu21-16253
Thirumalai, K., and Demou, S. G. (2003). Effect of reduced pressure on thermal-expansion behavior of rocks and its significance to thermal fragmentation. J. Appl. Phys. 41, 5147–5151. doi:10.1063/1.1658636
Thorn, C. E. (1979). Bedrock freeze-thaw weathering regime in an alpine environment, Colorado front range. Earth Surf. Process. 4, 211–228. doi:10.1002/esp.3290040303
Vasile, M., and Vespremeanu-Stroe, A. (2016). Thermal weathering of granite spheroidal boulders in a dry-temperate climate, Northern Dobrogea, Romania. Earth Surf. Process. Landforms 42, 259–271. doi:10.1002/esp.3984
Vicko, J., Greif, V., Grof, V., Jezny, M., Petro, L., and Brcek, M. (2009). Rock displacement and thermal expansion study at historic heritage sites in Slovakia. Environ. Geol. 58, 1727–1740. doi:10.1007/s00254-008-1672-7
Wallace, K., and Eyles, N. (2015). Seismites within Ordovician–Silurian carbonates and clastics of Southern Ontario, Canada and implications for intraplate seismicity. Sediment. Geol. 316, 80–95. doi:10.1016/j.sedgeo.2014.12.004
Wang, P., Xu, J., Liu, S., Wang, H., and Liu, S. (2016). Static and dynamic mechanical properties of sedimentary rock after freeze-thaw or thermal shock weathering. Eng. Geol. 210, 148–157. doi:10.1016/j.enggeo.2016.06.017
Warke, P. A., and Smith, B. J. (1998). Effects of direct and indirect heating on the validity of rock weathering simulation studies and durability tests. Geomorphology 22, 347–357. doi:10.1016/S0169-555X(97)00078-0
Warke, P. A., Smith, B. J., and Magee, R. W. (1996). Thermal response characteristics of stone: implications for weathering of soiled surfaces in urban environments. Earth Surf. Process. Landforms 21, 295–306. doi:10.1002/(SICI)1096-9837(199603)21:3<295::AID-ESP637>3.0.CO;2-8
Warren, K., Eppes, M.-C., Swami, S., Garbini, J., and Putkonen, J. (2013). Automated field detection of rock fracturing, microclimate, and diurnal rock temperature and strain fields. Geoscientific Instrum. Methods Data Syst. 2, 275–288. doi:10.5194/gi-2-275-2013
Weiss, T., Siegesmund, S., Kirchner, D., and Sippel, J. (2004). Insolation weathering and hygric dilatation: two competitive factors in stone degradation. Env. Geol. 46, 402–413. doi:10.1007/s00254-004-1041-0
Widen, J., and Munkhammar, J. (2019). Solar radiation theory. Available at: https://uu.diva-portal.org/smash/get/diva2:1305017/FULLTEXT01.pdf.
Winterringer, G. S., and Vestal, A. G. (1956). Rock-ledge vegetation in southern Illinois. Ecol. Monogr. 26, 105–130. doi:10.2307/1943286
Keywords: thermomechanical weathering, temperate climate, Niagara Escarpment, fractures, seasonality
Citation: Gage HJM, Nielsen JP and Eyles CH (2024) Temporal variability and site specificity of thermomechanical weathering in a temperate climate. Front. Earth Sci. 12:1318747. doi: 10.3389/feart.2024.1318747
Received: 11 October 2023; Accepted: 22 January 2024;
Published: 19 February 2024.
Edited by:
Jan Blahůt, Institute of Rock Structure and Mechanics (ASCR), CzechiaReviewed by:
Oliver Sass, University of Bayreuth, GermanyMatteo Fiorucci, University of Cassino, Italy
Copyright © 2024 Gage, Nielsen and Eyles. This is an open-access article distributed under the terms of the Creative Commons Attribution License (CC BY). The use, distribution or reproduction in other forums is permitted, provided the original author(s) and the copyright owner(s) are credited and that the original publication in this journal is cited, in accordance with accepted academic practice. No use, distribution or reproduction is permitted which does not comply with these terms.
*Correspondence: Henry J. M. Gage, aGdhZ2VAcHJpbmNldG9uLmVkdQ==