 Niaz Muhammad Shahani1,2
 Qin Xiaowei2Xin Wei1*Li Jun3*Tuerhong Aizitiliwumaier1Ma Xiaohu1Qiu Shigui1Cao Weikang2Liu Longhe1
- 1School of Mines, China University of Mining and Technology, Xuzhou, Jiangsu, China
- 2Shanxi Guxian Jingu Coal Industry Co., Ltd., Linfen, Shanxi, China
- 3Renjiazhuan CoLLiery, Ningxia Coal Industry Co., Ltd., Lingwu, China
The mechanical characteristics of rocks, specifically uniaxial compressive strength (UCS) and elastic modulus (E), serve as crucial factors in ensuring the integrity and stability of relevant projects in mining and civil engineering. This study proposes a novel hybrid PSO (particle swarm optimization) with tree-based models, such as gradient boosting regressor (GBR), light gradient boosting machine (LightGBM), random forest (RF), and extreme gradient boosting (XGBoost) for predicting UCS and E of rock samples from Block IX of the Thar Coalfield in Pakistan. A total of 122 datasets were divided into training and testing sets, with an 80:20 ratio, respectively, to develop the predictive models. Key performance metrics, including the coefficient of determination (R2), mean absolute error (MAE), and root mean square error (RMSE), were employed to assess the model’s predictive performance. The results indicate that the PSO-XGBoost model demonstrated the highest accuracy in predicting UCS and E, outperforming the other models, which exhibited inferior predictive performance. Furthermore, this study utilized the SHAP (Shapley Additive exPlanations) machine learning method to enhance our understanding of how each input feature variable influences the output values of UCS and E. In conclusion, the proposed framework offers significant advantages in evaluating the strength and deformation of rocks at Thar Coalfield, with promising applications in the field of mining and rock engineering.
1 Introduction
1.1 Background
The rock’s mechanical characteristics, including uniaxial compressive strength [UCS (MPa)] and elastic modulus [E (GPa)], play a pivotal role in the planning and design of relevant projects in mining and civil engineering. The success of both underground and surface mining endeavors greatly relies on a comprehensive understanding of various rock characteristics, with UCS and E being pivotal components of rock mechanical assessment. Ensuring the accuracy and precision of UCS and E measurements is fundamental in the design and execution of any mining engineering project. The development of machine learning (ML) intelligent indirect methods for studying subsurface structures based on limited data holds the potential to save time and cost while ensuring structural stability. This study carries significant socio-economic advantages and stands as an essential contributor to sustainable development. Furthermore, it specifically focuses on Block IX of the Thar Coalfield in Pakistan, with the primary objective of assessing the stability of the surrounding rock during underground excavation. This effort aims to prevent any disturbance to overlying aquifers and the ground surface due to underground mining while minimizing adverse environmental impacts. The study offers an in-depth exploration of rock deformation and characterization induced by changes in the stress field. “Various forms of rock deformation behavior have been scrutinized by researchers (Zhao et al., 2017; Rahimi and Nygaard, 2018; Davarpanah et al., 2019; Xiong et al., 2019), and the methods for estimating rock strength and deformation encompass both destructive and non-destructive techniques”. As per the recommended standards of the International Society for Rock Mechanics (ISRM) and the American Society for Testing and Materials (ASTM), the direct estimation of UCS and E through laboratory-based destructive testing is recognized as a difficult, time-consuming, and expensive endeavor, especially when working with delicate, internally fractured, thin, or highly foliated rock samples (Jing et al., 2021). Consequently, exploring indirect methods to assess UCS and E, such as rock index tests or predictive approaches based on ML-based intelligent methods.
The investigation of the rocks’ mechanical characteristics is integral to the extraction of energy resources and forms the fundamental basis for their safe exploitation. The importance of rock mechanics extends to the advancement of natural resource extraction, encompassing the safeguarding of energy reserves, such as petroleum products (oil, coal, and natural gas), and the preservation of the surrounding geological environment. Furthermore, waste disposal and hydroelectric energy projects necessitate a deeper exploration of rocks and soils, mandating comprehensive research into the mechanical characteristics of rocks (National Research Council, 1978; Demirdag et al., 2010). Various numerical techniques, such as peridynamic models, general particle dynamics, and uniaxial compression experiments on granite rock samples, have been employed to investigate the fracture behavior of brittle materials featuring preexisting cracks. These methods offer valuable insights into the complex mechanisms governing fracture (Zhou et al., 2014; Zhou et al., 2015; Wang et al., 2016; Wang et al., 2017; Wang et al., 2018; Zhou et al., 2019). The UCS and E of rocks play pivotal roles in addressing issues related to rock mechanics and the design of coal mining operations (Török and Vásárhelyi, 2010; Hakan and Kanik, 2012; Jahed Armaghani et al., 2015a; Armaghani et al., 2016).
“Typically, two common methods, namely, static and dynamic, are utilized to determine E. Static E is often derived by analyzing the stress-strain curve up to 50% of the maximum strength of the rock core sample. Conversely, dynamic E is determined by considering the rock’s density and the velocities of compressional and shear waves”. The disparity between static and dynamic E is a well-researched aspect of rock engineering (Brotons et al., 2016). It is generally observed that the dynamic E tends to be slightly higher than the static E, as observed by various researchers (Zhang, 2006; Kolesnikov, 2009). The dynamic-to-static E ratio has been reported in the range of 1–20 (Wang, 2000).
1.2 Related work
Different authors have devised predictive models to mitigate these challenges, employing various ML approaches (Ozcelik et al., 2013; Abdi et al., 2018; Yang et al., 2020; Cao et al., 2021; Duan et al., 2021; Harandizadeh and Armaghani, 2021; Pham et al., 2021; Armaghani et al., 2022). This departure from the direct utilization of tests prescribed by international standards is primarily due to the perceived drawbacks of those tests, including their time-consuming, costly, and unreliable nature (Jahed Armaghani et al., 2016; Jamshidi et al., 2016). “The evolution of ML has been strongly influenced by the emergence of novel learning algorithms, theoretical advancements, as well as the continuous enhancement of online data resources and high-speed computing capabilities” (Jordan and Mitchell, 2015). Although these models excel in addressing complex problems promptly and effectively, they predominantly focus on unraveling intricate relationships among variables for goal estimation, rather than offering insights into the associations between predictors and output values (Chelgani et al., 2016). Abdi and Taheri-Garavand (2020) developed the ANFIS (adaptive neuro-fuzzy inference system) algorithm to estimate the UCS of a sandstone consisting of 136 data points. ANFIS proved to be highly accurate based on the evaluation of the model by R2, RMSE and VAF. Ceryan and Samui (2020) predicted the volcanic rocks’ UCS using extreme learning machine (ELM) and minimum probabilistic machine regression (MPMR), and also incorporated the least square support vector machine (LS-SVM) model to compare the performance of the model. The results showed that ELM and MPMR gave better results than LS-SVM. Aboutaleb et al. (2018) used simple regression analysis (SRA), MRA, ANN (artificial neural networks), and support vector regression (SVR) to predict the UCS of carbonate rock. It was found that the SVR model was more accurate than the other models. Ceryan et al. (2018) used various ML models, namely, FIS (fuzzy inference system), ANN, and LV-SVM. So, the LV-SVM model was the best in predicting UCS. Ghasemi et al. (2018) employed the model tree method to estimate the UCS of carbonate rocks and demonstrated the high performance of the method. For predicting the UCS of travertine rocks, (Barzegar et al., 2020) used RF, M5 model trees, and multiple adaptive regression splines (MARS). In addition, they built an ANN model based on an ensemble committee to correlate the results of the implemented models. The results showed that the MARS model outperformed the other models (Barzegar et al., 2020). Zhong et al. (2021) predicted UCS employing the XGBoost model with highly accurate results. Yesiloglu-Gultekin and Gokceoglu (2022) developed NLMR, ANN, and ANFIS models using 137 data points (including unit weight, porosity, and sound velocity) as input features to indirectly estimate the UCS of basalt. The ANN was successful based on the performance metrics of R2, RMSE, VAF, and a20-index. Predicting rock strength is an efficient alternative technique to direct estimation. Diamantis and Moussas (2021) applied multiple regression and ANNs to estimate the UCS of peridotites collected from central Greece. Based on their results, the proposed ANNs were found to be the most effective instead of multiple regression. Mai et al. (2021) employed RF, one of the most powerful ML models to predict concrete strength using GBFS, and concluded that RF is the most powerful prediction tool with R2 = 0.97, which is recommended for engineers to reduce the cost of experiments. The mechanical properties of rock, specifically UCS are considered a key parameter that plays an important role in the design of any rock engineering structure and energy resource recovery and development. Therefore, an accurate estimation of it is essential. UCS was predicted using RF by Matin et al. (2018). For comparison, multivariate regression (MVR) and generalized regression neural network (GRNN) were used for the prediction. According to their results, RF yielded more satisfactory conclusions than MVR and GRNN. Wang et al. (2020) determined the UCS of rocks indirectly by developing RF as a prediction tool using two indirect input features, namely, Schmidt hammer rebound values (L-type) and Vp. Thus, the applied RF model has high accuracy and suggests that the predicted UCS values can be better applied in the fields of rock mechanics and engineering geology. Gupta and Natarajan (2021) developed new intelligent prediction models, namely, RF, ELM, LSSVR, and primal least squares dual SVR (PLSTSVR) proposed as density-weighted least squares twin support vector regression (PDWLSTSVR) to predict the UCS of rock samples. The model’s efficiency was estimated identically at the testing dataset of 47 samples out of overall 179 samples. Consequently, PDWLSTSVR performed well with high accuracy compared to other studied models such as RF, ELM, LSSVR, and PLSTSVR. The UCS of rocks was modeled using soft computing methods such as MLPNN (multilayer perceptron neural network), M5 model tree, and ELM by Gül et al. (2021). The MLPNN model performed excellently with an R2 of 0.9982. Sampath et al. (2019) utilized advanced soft computing models, especially ANFIS and ANN, to effectively predict the strength alterations. Similarly, Abdi et al. (2018) introduced ANN and MRA for predictive modeling of E. Their study incorporated input variables, including porosity, dry density, P-wave velocity, and water absorption. The findings demonstrated that the ANN model outperformed the MRA model. Ghasemi et al. (2018) employed a model tree-based method to evaluate the E of carbonate rocks. Their findings indicated that the studied technique yielded the best predictive results. Shahani et al. (2021) utilized a novel XGBoost algorithm. The applied model, XGBoost achieved a high level of accuracy in predicting E. Furthermore, Shahani et al. (2022a) developed six ML models such as “LightGBM, SVM, Catboost, GBRT, RF, and XGBoost” to estimate E of the Thar Coalfield. Thus, the XGBoost model showed better results than the other models. Umrao et al. (2018) studied the ANFIS method to determine the strength and E of non-homogeneous sedimentary rocks. The anticipated ANFIS model exhibited excellent predictive capabilities. Davarpanah et al. (2020) established both linear and nonlinear relationships between static and dynamic deformation parameters in various types of rocks. Their research revealed a strong correlation between these parameters. For predicting E of CO2-rich coals, Guha Roy and Singh (2018) employed ANN, ANFIS, and MR techniques. The findings indicated that both ANN and ANFIS have outdone the MR model. Jahed Armaghani et al. (2015b) conducted a study where they predicted the E of rocks, comparing the ANFIS against MRA and ANN. The consequences demonstrated that ANFIS exhibited superior performance compared to MRA and ANN. Singh et al. (2012) introduced the ANFIS architecture as a method for predicting rock E. Cao et al. (2022) adopted an innovative approach by combining XGBoost and the Firefly Algorithm (FA) in supervised ML to predict E. The results showed that this novel method was effective. Yang et al. (2019) used a Bayesian method to predict intact granite’s E, and the model produced suitable predictions. Rastegarnia et al. (2018) predicted the mechanical characteristics of sedimentary rocks, especially UCS and E, using ANN with R2 of 0.99 and 0.97, respectively. Singh et al. (2017) assessed a range of geomechanical parameters, with a specific focus on the parameter E using a combination of MRVA and ANFIS methods. As a result, the ANFIS model yielded a significantly more accurate.
1.3 Significance of the study
Considering the limitations in existing literature and conventional prediction methods, a single model often proves to be insufficiently adaptable and inclusive, leading to suboptimal solutions in complex scenarios, with varying performance outcomes dependent on input features. To our knowledge, previous research has addressed complex and unpredictable engineering situations without leveraging intelligent prediction methods, specifically in the context of the Thar Coalfield. There is a dearth of research focused on predicting the UCS and E, and the comprehensive exploration of model selection and application in UCS and E prediction remains uncharted territory. To address this gap, this study employs a hybrid ML-based model that amalgamates multiple models to counterbalance the limitations of a single-model approach, substantially enhancing the accuracy of predictive results. In this study, hybrid PSO with tree-based models, such as gradient boosting regressor (GBR), light gradient boosting machine (LightGBM), random forest (RF), and extreme gradient boosting (XGBoost) including wet density (WD) in g/cm3, moisture in %, dry density (DD) in g/cm3, and (BTS) in MPa and shore hardness (SH) as input features. The dataset used in this study was collected from Block IX of the Thar Coalfield in Pakistan. A training-testing split of 80% and 20%, respectively, was implemented on a dataset consisting of 122 samples. To optimize the performance of the developed models, a repetitive hyperparameters tuning and cross-validation method is employed. Furthermore, SHAP (Shapley Additive exPlanations) ML analysis was conducted to identify the influence of each input feature on the predicted UCS and E. This research represents the first application of a hybrid model to predict UCS and E at Block IX of the Thar Coalfield in Pakistan. Figure 1 illustrates the flowchart of the research methodology used in this study.
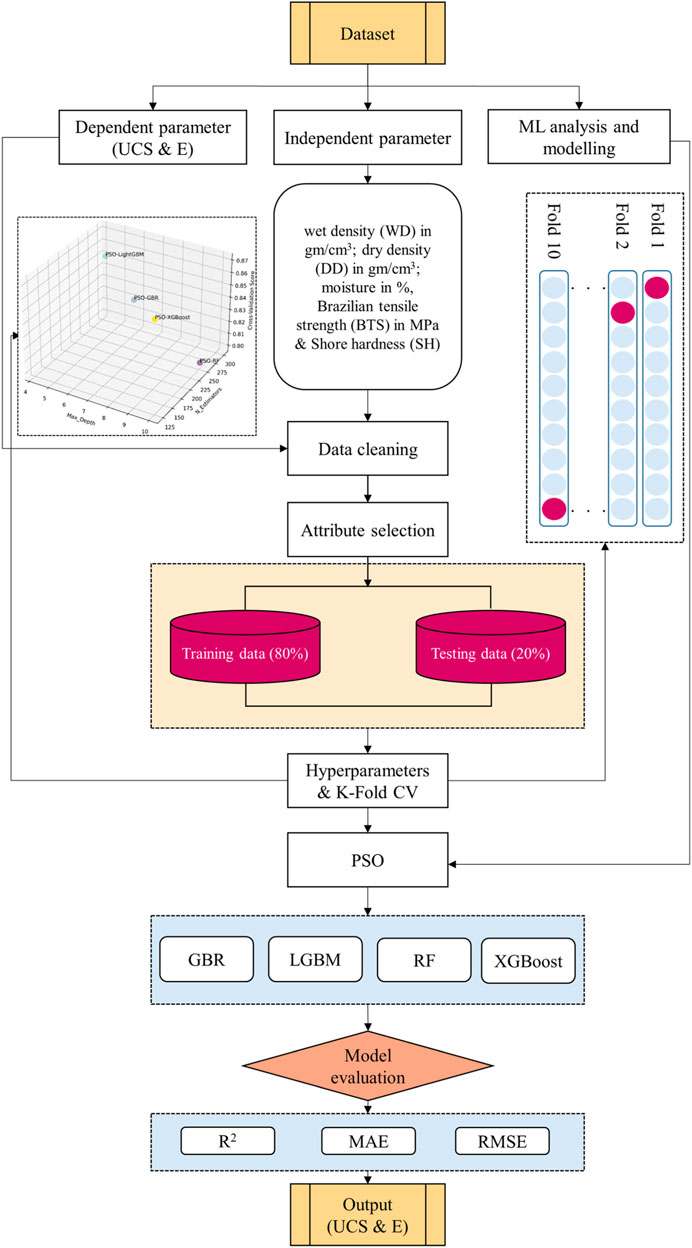
FIGURE 1. The flowchart of the research methodology.
2 Materials and methods
The Thar Coalfield in Pakistan ranks as the seventh-largest coal field globally (Ahmed et al., 2020). The Thar Coalfield consists of a total of 12 individual blocks surrounded by dune sand that extend over distances of up to 80 m. Shahani et al. (2019); Shahani et al. (2020) introduced the application of the mechanized longwall top coal caving mining (LTCC) method at Block IX of the Thar Coalfield. Thus, the accurate assessment of rock mechanical characteristics, with a specific focus on UCS and E, at Block IX of the Thar Coalfield is of utmost importance for the pre-mining evaluation of roof and ground stability, and overall behavior of the mining environment. Furthermore, the application of ML-based methodologies for predicting UCS and E serves to address stability challenges during mining operations and also offers solutions for water resource management, particularly concerning aquifers, in the context of Block IX of the Thar Coalfield in Pakistan. Figure 2 depicts the location map of Block IX of the Thar Coalfield.
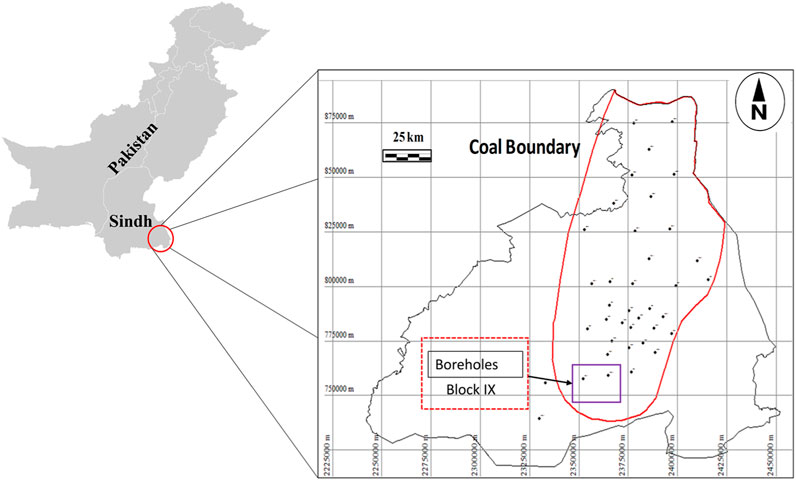
FIGURE 2. Geographical map of Block IX of the Thar Coalfield region [modified after (Ahmed et al., 2020)].
2.1 Dataset
In this study, 122 stratigraphic rock samples including siltstone, claystone, sandstone, and coal were collected from Block IX of Thar Coalfield using the borehole coring method. These rock samples underwent careful preparation and splitting procedures following the guidelines set forth by the ISRM (International Society for Rock Mechanics) (Brown, 2007) and the ASTM (American Society for Testing and Materials) (ASTM Committee D-18 on Soil and Rock, 2013) to keep consistent core dimensions and geometric features. Subsequent investigational tests were conducted on these rock samples at the laboratory, to determine their physico-mechanical properties. Key properties assessed included wet density (WD), moisture, dry density (DD), Brazilian tensile strength (BTS), shore hardness (SH), elastic modulus (E), and uniaxial compressive strength (UCS). Previously (Shahani et al., 2022a), we used 106 datasets and 4 input parameters with a single predictive model. However, this study used more datasets and input parameters and a hybrid optimization prediction model to improve the accuracy of the data. Table 1 defines the statistical distribution of the original dataset used in this study.
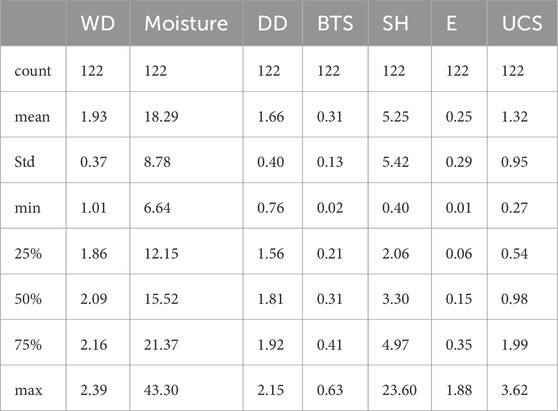
TABLE 1. Statistical distribution of the original dataset used in this study.
The UCS test carried out following ISRM standards, involved the use of a uniaxial testing machine (UTM) on standardized core samples with NX dimensions, featuring a diameter of 54 mm, and applied a loading rate of 0.5 MPa/s. This test was performed to ascertain the UCS and E of the rock samples. Additionally, to evaluate the BTS of the rock samples, Brazilian tests were performed using the same UTM apparatus.
The Seaborn module in Python was used for visualizing the original dataset in this study. Specifically, Figure 3 presents three-dimensional (3D) surface plots illustrating the relationships between input parameters and the output variables UCS and E.
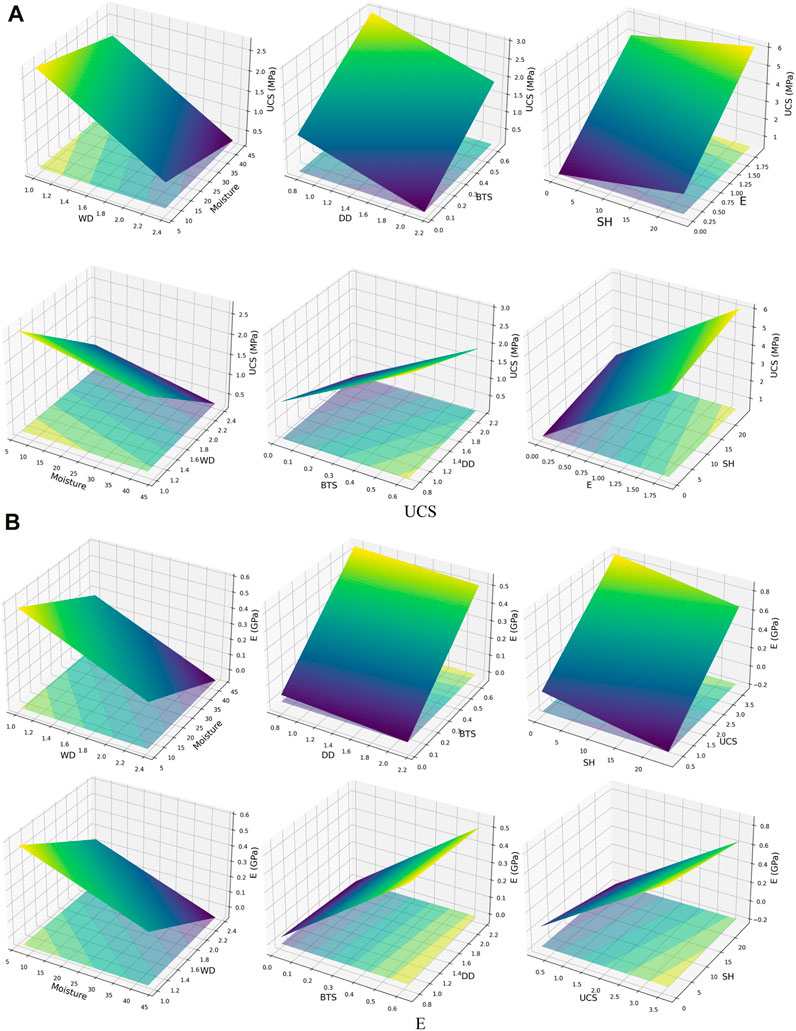
FIGURE 3. Three-dimensional surface plots of the original dataset: (A) UCS and (B) E.
Additionally, Figure 4 shows a correlation heatmap for the complete dataset. In Figure 4, there are positive correlations between BTS and moisture, as well as SH and E with output UCS, while WD and DD exhibit negative correlations. Similarly, for output E, Figure 4 reveals positive correlations with BTS, SH, and UCS, and negative correlations with WD and DD. The representation of moisture does not exhibit a correlation with the E. RStudio software was employed for the formation of Figure 4, and it is important to note that UCS and E were considered as interrelated input parameters in the analysis.
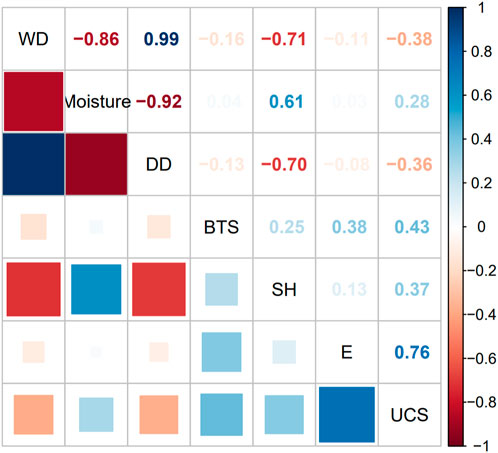
FIGURE 4. Correlation matrix of the original dataset.
2.2 Methods
In developing countries like Pakistan, the use of large-scale conventional tests to determine rock mechanical characteristics, namely, UCS and E is often impractical. Consequently, there is a growing imperative to design intelligent predictive algorithms using ML techniques to address the challenge of data scarcity, which is the focus of this study. This study employs hybrid PSO with tree-based models, including GBR, LightGBM, RF, and XGBoost. The study aims to forecast the UCS and E of rock samples collected from Block-IX of the Thar Coalfield in Pakistan. A concise overview of the developed method is given below.
2.2.1 Particle swarm optimization
Kennedy and Eberhart in 1995 (Kennedy and Eberhart, 1995) proposed the particle swarm optimization (PSO) algorithm, which is considered a new approach to swarm intelligence. The PSO algorithm is based on the performance of birds in nature and is considered to be the most prominent metaheuristic algorithm. In the PSO, individuals, also referred to as particles, are organized into a group known as a swarm. This swarm operates as a population-based search process (Engelbrecht, 2007; Sumathi and Paneerselvam, 2010). Each particle within the swarm denotes a potential solution for addressing the optimization problem. Particles in the PSO algorithm are dispersed over a hyper-dimensional search space. The behavior of particles within the search area is influenced by the social-psychological tendency of individuals to imitate the successful actions of others. As a result, each particle in a swarm is driven by a blend of its individual history and the information it acquires from its neighboring particles. Figure 5 shows a flowchart of the optimized models by the PSO framework. PSO has been successfully used for addressing optimization problems and finding ideal solutions based on two major factors: location (x) and velocity (V). Eq. 1 could be used to update the velocity:
where pbest is the ith particle’s optimum position and gbest is the global optimum value achieved by various particles.
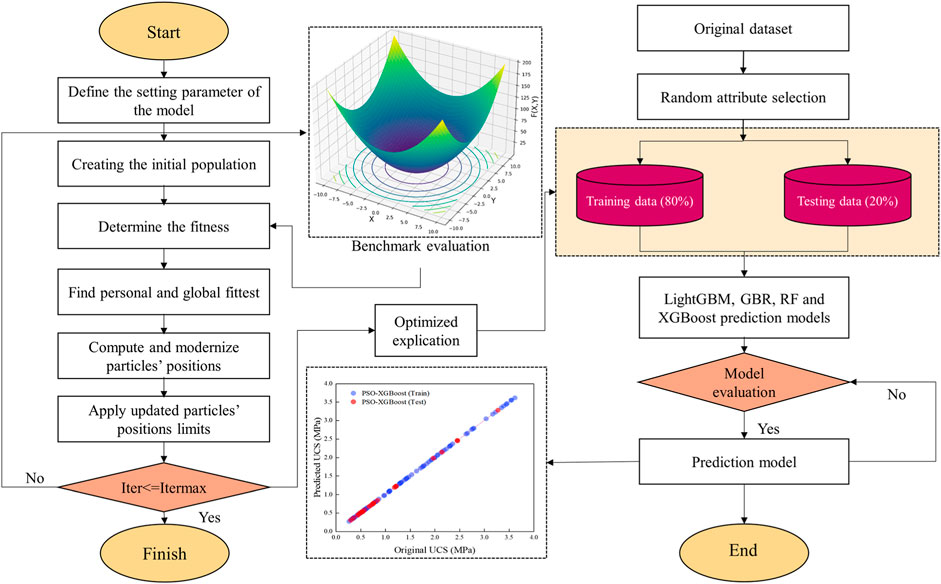
FIGURE 5. Optimized models by PSO framework.
The xi(k) represents the particle’s position at time step (k), Vi(k) represents the particle’s velocity at the time (k), w represents the coefficient of inertia, r1 and r2 represent random coefficients, c1, and c2 represent acceleration coefficients, and Vi(k + 1) represents the freshly simplified velocity. The value of w can be calculated using Eq. 2 (Kennedy and Eberhart, 1995).
where wmin is the smallest weight and wmax is the largest weight, iter is the number of iterations, and itermax is the maximum number of iterations. Eq. 3 is used to transfer the particles into their new positions:
The 3D benchmark function utilized in model development, as illustrated in Figure 6, represents a mathematical equation that results from the sum of the squares of two variables, denoted as X and Y. This function presents a convex, continuous surface with a distinctive “bowl“-like shape. PSO optimization algorithms make use of this particular function to navigate through multidimensional search spaces. It serves as a comprehensible benchmark problem in this context to demonstrate optimization behaviors. The function is characterized as a quadratic, multimodal equation, and its output is contingent on the square values of the input variables. Figure 7 presents the results of model development using PSO-optimized GBR, LightGBM, RF, and XGBoost, where the selection was based on the lowest root mean square error (RMSE) for predicting UCS and E.
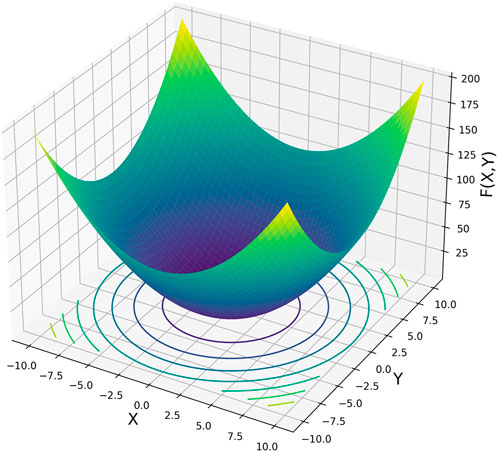
FIGURE 6. 3D benchmark function plot by PSO optimization.
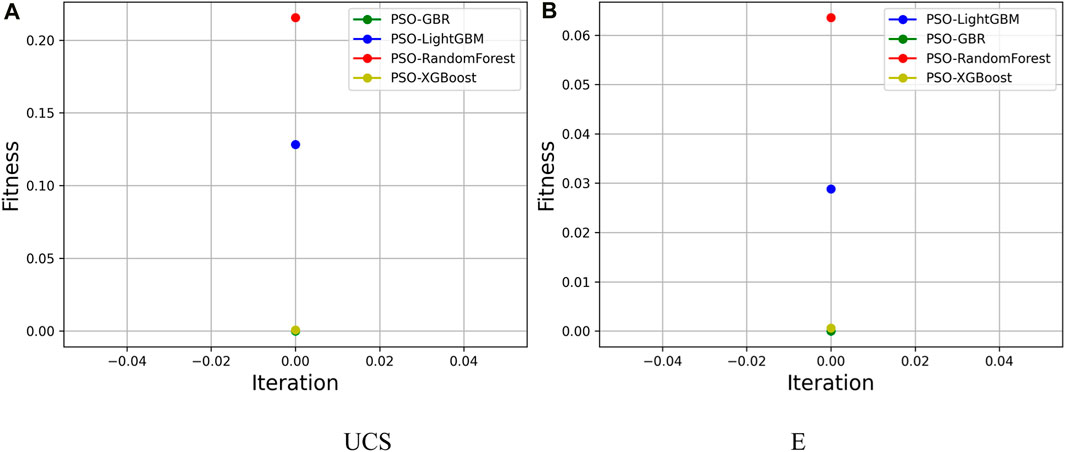
FIGURE 7. PSO-based optimized GBR, LightGBM, RF, and XGBoost model development results for (A) UCS and (B) E.
PSO method draws inspiration from natural social behavior, specifically the coordinated movements observed in bird flocks. It leverages this inspiration to predict intensity physically. PSO is employed to emulate the search behavior of particles within a solution space, aiming to optimize the parameters of a predictive model in the realm of intensity prediction.
The ability of PSO to efficiently explore the solution space and converge towards optimal parameter values makes it a preferred choice over alternative approaches. PSO proves particularly valuable in optimizing the parameters of models employed for predicting intensity, showcasing proficiency in solving complex, non-linear optimization problems. When compared to specific alternative optimization techniques, its simplicity, ease of implementation, and effectiveness in identifying global optima contribute to its appeal. Nevertheless, the nature of the problem at hand and the characteristics of the data may influence the selection of the optimization method.
2.2.2 Gradient boosting regressor
The gradient boosting regressor (GBR) combines weak learners (i.e., algorithms that perform moderately compared to random algorithms) into strong learners within the ensemble technique (Freund et al., 1999). In comparison to bagging, boosting algorithms iteratively generate base frameworks. By concentrating priority on assessing intricate learning information, they create multiple frameworks, thereby enhancing the robustness of the predictive model. In boosting algorithms, basic frameworks are often developed in the training dataset that was previously unsuitable for estimation compared to those models that undergo precise evaluation. Each auxiliary base framework is used to correct errors produced by its previous base framework. The existence of boosting algorithms stems from Schapire’s response to Kearns’ inquiry (Kearns, 1988; Schapire, 1990): is the combination of weak learners a substitute to differentiate strong learners? Algorithms that exhibit strong performance when compared to random approximations are commonly termed weak learners, while more practical classification or regression algorithms that effectively align with the problem’s inherent challenges are known as strong base frameworks. The response to this investigation is highly significant. Evaluation of weak frameworks is usually unchallenging compared to strong frameworks. Schapire argued that Kearns’ query can be responded affirmatively, indicating that numerous weak frameworks can be merged to create a unified, robust framework.
2.2.3 Light gradient boosting machine
Light gradient boosting machine or LightGBM is a free and open-source distributed gradient boosting framework used for ML, initially developed by Microsoft. It is based on the decision tree algorithm and is used for ranking, classification, and regression ML tasks (Ke et al., 2017). LightGBM places continuous feature values into separate buckets, offering higher agility and faster training speed. LightGBM utilizes the histogram-based approach (Zeng et al., 2019; Liang et al., 2020) to optimize the learning phase, reduce memory usage, and integrate modified communication networks to enhance training efficiency. This algorithm is commonly referred to as the parallel voting decision tree ML algorithm. To select the top-k elements and derive global voting strategies, the approach involves partitioning the learning data into multiple trees and applying local voting techniques in each iteration. LightGBM employs a leaf-wise technique to determine the leaf with the highest splitter gain. By utilizing the leaf-wise distribution method, which is considered a primary and more effective component of the execution algorithm, it constructs a more intricate tree compared to the level-wise distribution approach. While this complexity can potentially result in overfitting, LightGBM mitigates this risk by implementing a maximum depth parameter.
2.2.4 Random forest
1n 2001, random forest (RF) was initially originated by Breiman, which falls under the category of ELM algorithm (Breiman, 2001), and has broad applications in both regression analysis and classification tasks. RF is an advanced method of ensemble or bagging. In the realm of other recognized artificial intelligence computations, RF has recognized a unique relationship between model representation and predictive accuracy (Yang et al., 2010).
In this study, an RF model with 100 trees and a set of default parameters was employed to evaluate the model’s performance.
2.2.5 Extreme gradient boosting
Extreme gradient boosting or XGBoost is a well-known ensemble learning algorithm in the field of ML. It combines advanced boosting techniques with traditional regression and classification trees (Meng et al., 2016). Boosting works by constructing multiple trees instead of relying on a single tree, and then combining them to develop a consistent predictive model to enhance the accuracy estimation of the system (Ranka and Singh, 1998). XGBoost follows the general concept of gradient boosting, where weak learners are combined with strong learners. Nevertheless, XGBoost demonstrates improved predictive capabilities by introducing additional regularization terms into the objective function. These regularization terms help mitigate overfitting and control the complexity of the model. The objective function is defined as follows in Eqs (4) and (5).
where,
XGBoost is a popular ML algorithm that combines the powerful capabilities of the gradient boosting technique. It achieves a robust and coherent performance in various regression prediction tasks, providing numerical outputs. Moreover, it can be readily applied to probabilistic regression frameworks. Ensembles are established using decision tree models, which are interconnected to refine the accuracy of forecasting models. This ensemble ML approach is commonly referred to as boosting. These frameworks are constructed by employing various gradient descent optimization techniques and different loss functions. During model implementation, the gradient loss function is minimized, giving rise to the term “gradient boosting” for this mechanism.
3 Hyperparameter tuning and model evaluation
3.1 Hyperparameter tuning
Grid Search Cross-Validation is a method used for tuning hyperparameters (Bergstra and Bengio, 2012). This method allows for a search within a specified range of hyperparameters and identifies the expected hyperparameter combinations that yield the best results in terms of evaluation metrics such as R2, MAE, and RMSE. In the Python programming language, the GridSearchCV() function is typically used to implement this strategy, and it is readily available in the scikit-learn library. This method essentially computes Cross-Validation scores for all possible combinations within a specific range of hyperparameters.
This study, as shown in Figure 8, conducted 10-fold Cross-Validation to comprehensively assess the performance of hyperparameter combinations. GridSearchCV() not only allows us to discover the optimal hyperparameter combinations but also provides performance metrics for these combinations.
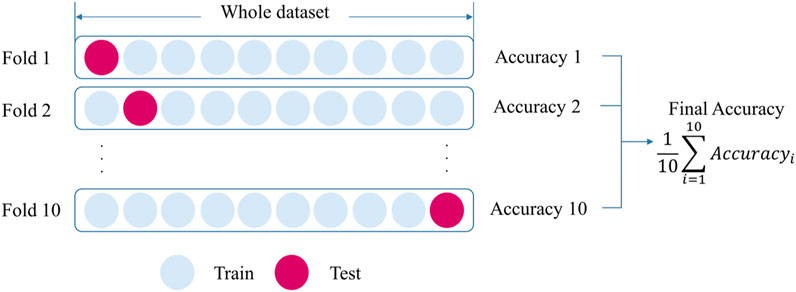
FIGURE 8. A 10-fold Cross-Validation diagram.
The optimal selection of hyperparameters, specifically max_depth and n_estimators, plays a crucial role in constructing a robust model for predicting UCS and E. max_depth determines the maximum depth of the decision tree, while n_estimators signifies the total number of trees in the forest. Given the computational cost associated with hyperparameter tuning, we employed Python’s range function to efficiently explore the parameter space. For max_depth, values between 4 and 10 are considered, taking into account the computational resources required for selection. Similarly, a range of 10 for n_estimators is utilized, spanning from 10 to 300. The learning rate was kept at its default value. Figure 9; Table 2 illustrate the visualization plot for hyperparameter optimization of the developed models: (a) UCS and (b) E.

FIGURE 9. Visualization plot for hyperparameter optimization: (A) UCS and (B) E.

TABLE 2. Hyperparameters and tuning range.
3.2 Model evaluation
Different performance matrices such as R2 (Shahani et al., 2022b; Wei et al., 2023), MAE (Willmott, 1982), and RMSE (Shahani et al., 2022c) have been used by different scholars to evaluate high-accuracy ML models. This suggests that the higher the R2 value and the smaller the MAE and RMSE, the more the model is considered the best predictive model when predicting UCS and E from their original values. In this study, R2, MAE, and RMSE are utilized to assess the relationship between the original and predicted values of UCS and E.
where,
4 Results and discussion
Hybrid PSO with other ML techniques, plays a vital role in data forecasting. This study introduces a nature-inspired population-based PSO with tree-based models, such as GBR, LightGBM, RF, and XGBoost. These algorithms are utilized to predict the mechanical characteristics of rock samples, specifically UCS and E, utilizing input features like wet density, moisture, dry density, BTS, and SH. The dataset employed in this research was sourced from Block-IX of the Thar Coalfield in Pakistan. The PSO model development involved the use of a 3D benchmark function, characterized by a convex, continuous surface with a distinctive “bowl“-like shape. The integration of PSO with GBR, LightGBM, RF, and XGBoost development was evaluated based on RMSE. A 10-fold Cross-Validation technique was applied, and optimal hyperparameters were determined to enhance the predictive capabilities of these models. The dataset was divided into two splits, with 80% (97 samples) allocated for training and 20% (25 samples) for testing each developed model. The performance of the models was evaluated using key metrics, including R2, MAE, and RMSE, to identify the most suitable model for UCS and E prediction. Additionally, SHAP ML analysis was conducted to investigate the influence of each input variable on the predicted values of UCS and E.
The evaluation of predictive accuracy for the models under development was conducted on the train and test datasets. Figure 10A depicts the performance for UCS, while Figure 10B presents the results for E. The models were organized in increasing order, ranging from lower to higher performance levels. The performance metrics for UCS, including R2, MAE and RMSE for the models PSO-GBR, PSO-LightGBM, PSO-RF and PSO-XGBoost are as 0.988, 0.0238 and 0.0307 and 0.492, 0.4752 and 0.7632, 0.81, 0.2826 and 0.4035 and 0.54, 0.4656 and 0.7051, 0.758, 0.3521 and 0.4842 and 0.755, 0.2826 and 0.4018, 0.999, 0.0042 and 1.7883 and 0.999, 0.0032 and 1.3482, respectively. Similarly, the performance metrics for E, including R2, MAE, and RMSE of model PSO-LightGBM, PSO-GBR, PSO-RF, and PSO-XGBoost are 0.907, 0.0499 and 0.0823 and 0.692, 0.1380 and 0.2694, 0.997, 0.0103 and 0.0137 and 0.725, 0.1271 and 0.2365, 0. 816, 0.0492 and 0.0.1118 and 0.814, 0.1047 and 0.1865, 0.999, 0.0011 and 2.3160 and 0.999, 0.0006 and 2.9249, respectively.

FIGURE 10. Scatter plots of PSO-optimized models: (A) UCS (MPa) and (B) E (GPa).
Figures 11A, B depict density line plots illustrating the predicted data for UCS and E at both the train and test datasets. These plots provide valuable insights into the model’s performance in predicting the data at each data point.
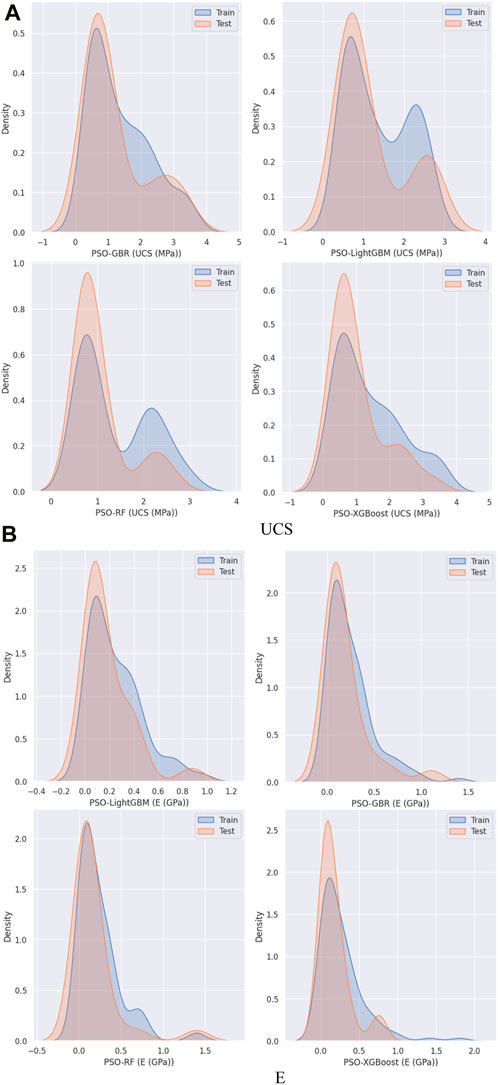
FIGURE 11. Kernel density plots for PSO-optimized models: (A) UCS (MPa) and (B) E (GPa).
Furthermore, this study has endeavored an access the predictive accuracy of UCS and E to gain a deeper insight into the predictive capabilities of the models created. This evaluation is especially important given the wide range of values for UCS and E present within the dataset under consideration. The residuals from the developed models were utilized to assess the accuracy of the UCS and E predictions. These residuals provide a measure of the variation between the original dataset values and the corresponding predicted values for UCS and E at each data point.
As depicted in Figure 12, the residuals exhibit a direct relationship with the original values of (a) UCS and (b) E in both the train and test data as predicted by the developed models. However, important to highlight that the PSO-XGBoost model defines residual values that are consistently near zero due to its high predictive accuracy when predicting UCS and E. This suggests that as the residual values increase, both UCS and E tend to increase, and vice versa. The study reveals that when the original values of UCS and E are low, these models tend to predict UCS and E values that are higher than the original UCS and E values, whereas when the original UCS and E values are high, their predicted UCS and E values appear to be lower than the original UCS and E values.
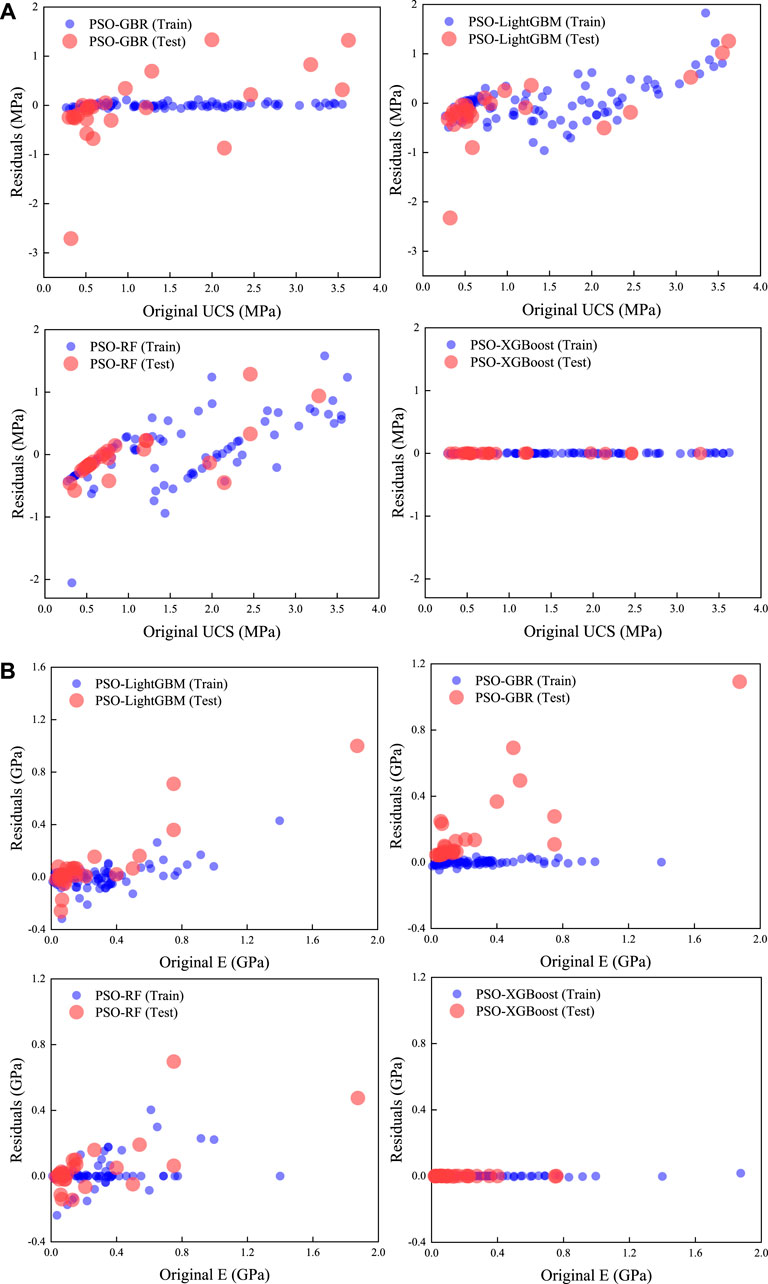
FIGURE 12. Residuals plots of PSO-optimized models: (A) UCS (MPa) and (B) E (GPa).
Table 3 illustrates hybrid PSO with GBR, LightGBM, RF, and XGBoost, for predicting UCS and E. We evaluated the performance of these models using a range of performance metrics determined by Eqs 6–8. Notably, the PSO-XGBoost model demonstrated outstanding predictive performance, achieving R2 values of 0.999 and 0.999, MAE values of 0.00325 and 0.00064, and RMSE values of 0.0312 and 2.92491 for UCS and E, respectively, on the test dataset. These results establish the superiority of the PSO-XGBoost model, indicating its status as the optimal model in this study due to its exceptional accuracy, as shown in Figure 13.

TABLE 3. Performance metrics of the hybrid PSO with tree-based models for UCS and E.
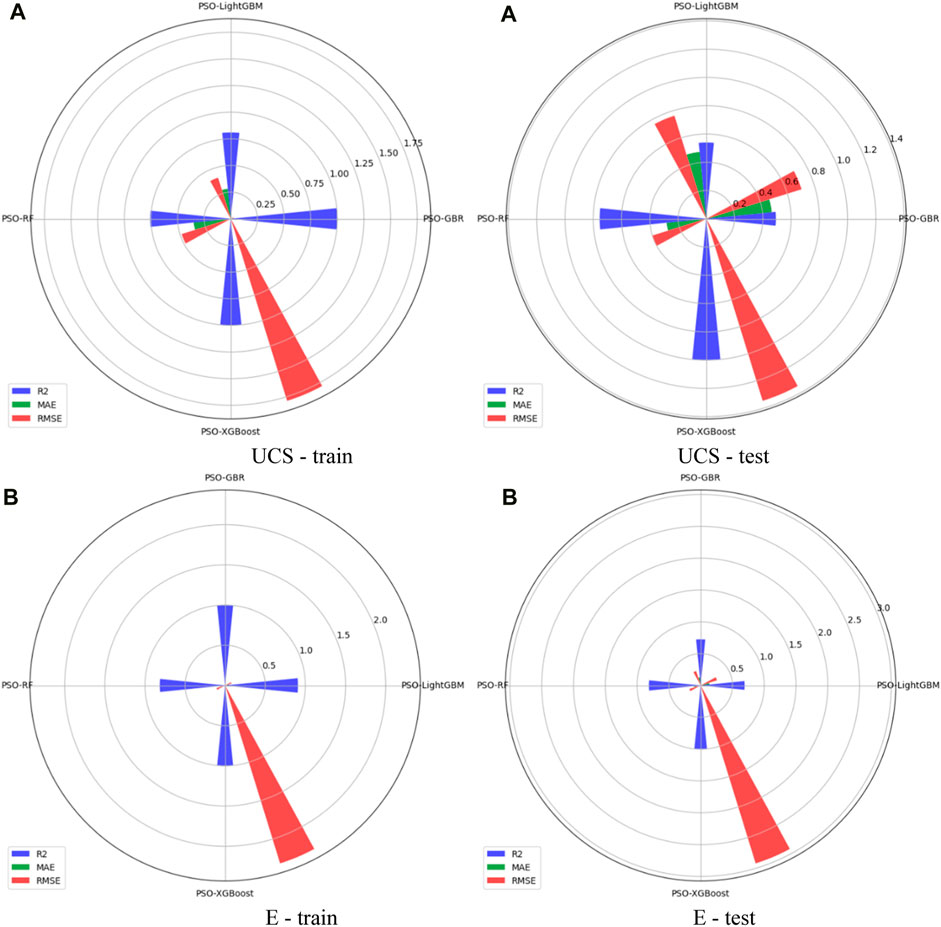
FIGURE 13. Predictive performance metrics of the PSO-optimized models on the train and test dataset: (A) UCS (MPa) and (B) E (GPa).
The Taylor diagram provides a concise quantitative summary of the accuracy of a model in terms of standard deviations and correlations. In this study, Figure 14, depicts a Taylor diagram analysis comparing the predicted and original values of UCS and E for four models: PSO-GBR, PSO-LightGBM, PSO-RF, and PSO-XGBoost. The analysis considers key metrics such as standard deviation (STD), RMSE, and R2 for both the training and test datasets. Thus, PSO-XGBoost exhibits a notably strong correlation with the original UCS and E values, distinguishing it from the other models examined in this study.
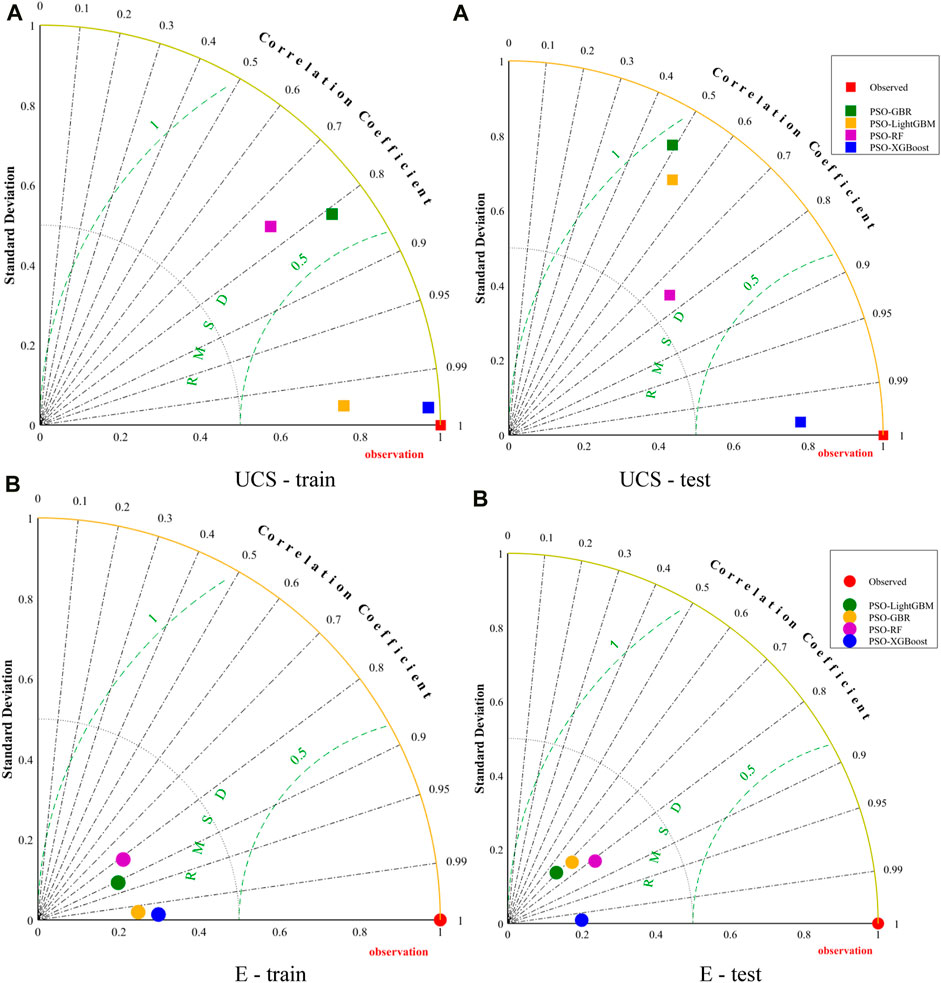
FIGURE 14. Taylor diagram representation of (A) UCS and (B) E.
In Figure 14, the analysis indicates that the STD of the PSO-XGBoost model is closest to its corresponding original STD, suggesting that it provides a reliable prediction. Drawing from a comprehensive review of publicly available literature (Ghose and Chakraborti, 1986; Katz et al., 2000; Tiryaki, 2008; Jahed Armaghani et al., 2015b; Guha Roy and Singh, 2018; Umrao et al., 2018; Davarpanah et al., 2020; Shahani et al., 2021; Zhong et al., 2021; Shahani et al., 2022a), this study has identified the optimal model, which consistently delivers highly accurate predictions for both UCS and E. While the STD values of other models also approach their original counterparts, they exhibit comparatively lower R2 values.
SHAP is derived from game theory, and it is a multivariate method used to compute the importance values of each feature, helping to understand the influence of each feature on model predictions. Figures 15A, B use SHAP values for each data point in the train and test dataset for UCS and E to illustrate the importance of assessment of various variable features. This intuitive representation develops an association between each feature value and its corresponding SHAP value. Specifically, taking the key feature ‘E' in UCS and “UCS” in E as an example, higher feature values are associated with higher SHAP values, and vice versa. This observation indicates that an increase in feature values leads to an increase in the output value. So, when SHAP values are higher, it signifies a tendency to enhance the output probability or output value.
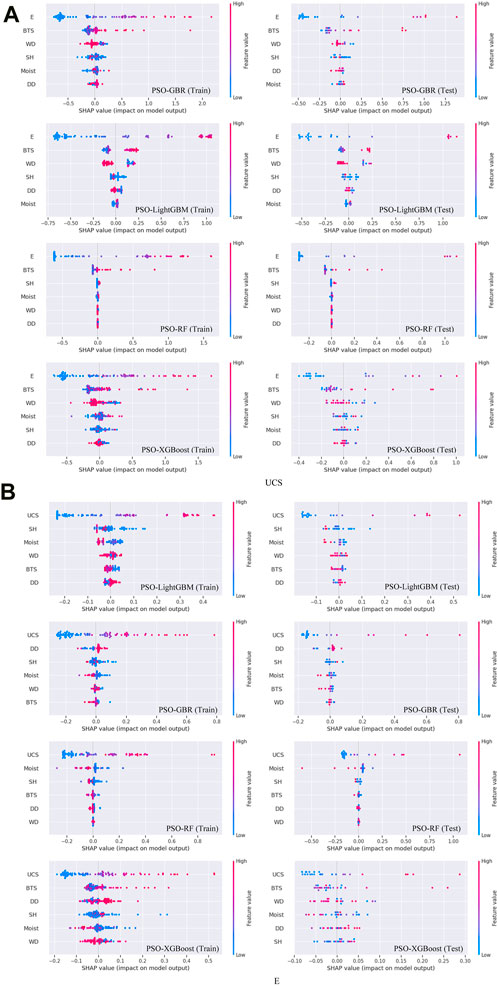
FIGURE 15. SHAP summary plots of the developed optimized models at the train and test datasets: (A) UCS and (B) E.
In Figures 15A, B, the SHAP value exemplifies the extent to which each original value impacts the prediction value, either positively or negatively. Higher original values are represented by brighter colors, while darker colors represent lower original values.
5 Engineering applications
Machine learning or ML is the study of the application of computer programs that allow robust intelligent models without being explicitly programmed. Over the past decade, the use of ML has experienced significant application in a wide range of industries. The recent advances in smart mining technology have made it possible to make use of limited data in real-time scenarios. Proper estimation of correlations between pertinent rock parameters like UCS and E is integral to reliable rock and mining engineering design and analysis. Thus, research employing ML that utilizes data should be actively conducted in the mining industry. In mining applications, where uncertainty is an intrinsic part, ML can be effectively used to develop robust prediction models for rock engineering characteristics or behavior. Furthermore, mining design parameters are frequently approximated using empirical or numerical correlations that are developed by regression fitting to a dataset rather than being explicitly measured from laboratory and in situ experiments. These empirical correlations usually use linear regression approaches. A major limitation of this approach is that the rock parameters are rarely addressed by analytical and empirical approaches because of underlying non-linearity. However, hybrid PSO with tree-based prediction models developed in this study can improve the estimation of these parameters significantly. For a more in-depth comprehension, the following explanation can provide additional clarity:
5.1 Basic engineering applications
In conventional rock and mining engineering, accurate estimation of essential parameters such as UCS and E is critical for reliable design and analysis. However, conventional methods, often based on linear regression approaches, face limitations due to the inherent non-linearity of rock parameters. The hybrid PSO with tree-based prediction models proposed in this study offers significant improvements in parameter estimation.
For instance, in the context of Block IX of the Thar Coalfield in Pakistan, where the application of the longwall top coal caving (LTCC) method has been proposed (Shahani et al., 2019; Shahani et al., 2020), real-time estimation of UCS and E can play a crucial role. This estimation directly influences the customization and modification of LTCC design and operations, ensuring safe and cost-effective mining practices. The accurate determination of rock mechanical parameters, particularly UCS and E, is essential for designing mining structures and earth surface profiles, thereby contributing to the safety, economic viability, and sustainability of mining operations.
5.2 ML-based engineering applications
Although numerous basic studies have been conducted to determine the mechanical properties of rocks at Thar Coalfield, the requirement for more robust models and more diverse datasets is crucial to developing reliable information on the impacts of the consideration of mechanical characteristics of rock, which will be very useful for mine planning and design. ML-based prediction targets making models that after learning from specific training datasets can make accurate predictions on concealed data that has never been introduced to the model, i.e., a model that can be generalized by Chollet in 2018 (Chollet, 2021). Therefore, the main ML-based engineering applications of this study are outlined below:
(1) ML Indirect Techniques for Designing and Excavating Underground Structures: The study introduces ML as a tool for designing and excavating underground structures, leveraging limited data for cost-effective and stable mining structure development. This has technical, economic, and social implications, aligning with sustainability objectives.
(2) Implication of ML for Deep Excavations and Rock Behavior Prediction: ML’s application for predicting UCS and E enhances stability considerations, particularly in deep excavations. The study emphasizes the advantages of ML algorithms over empirical and analytical methods, highlighting their accuracy, robustness, and reliability. The hybrid PSO with tree-based models is positioned as a valuable tool for addressing challenges in mining engineering, where acquiring data is difficult due to safety concerns, time constraints, and associated costs.
(3) Addressing Variability in Rock Attributes with ML: ML is recognized as a solution to manage variability in rock attributes, particularly where analytical solutions are lacking, and existing models have simplifying assumptions. The hybrid PSO with tree-based models is positioned to contribute to the development of generalized models, applicable to domains with similar attributes.
The prediction of UCS and E using hybrid PSO with tree-based models not only contributes to the stability of underground mine roadway excavation but also addresses uncertainties associated with sparse datasets. This approach empowers mining and rock engineers to assess the level of uncertainty surrounding predictions, ensuring a more informed decision-making process for the safe and continuous operation of mining activities at Block IX of the Thar Coalfield.
6 Conclusion
This study explores the effectiveness of hybrid PSO with tree-based models, such as GBR, LightGBM, RF, and XGBoost, for estimating the UCS and E of rocks from Block-IX of the Thar Coalfield in Pakistan. A dataset of 122 samples is split with 80% for training and 20% for testing each model. To improve the performance of the constructed model, a 10-fold cross-validation iteration technique is employed. This study seeks to establish a fundamental framework for assessing the stability of surrounding rock to prevent situations detrimental to environmental protection, such as unstable surrounding rock leading to damage to overlying aquifers and severe surface subsidence.
The PSO-XGBoost model exhibits superior predictive performance on both the train and test dataset, with an R2 of 0.999, MAE of 0.00424 and RMSE of 1.78836 and R2 of 0.999, MAE of 0.00325 and RMSE of 1.34825 for UCS and an R2 of 0.999, MAE of 0.00118 and RMSE of 2.31605 and R2 of 0.999, MAE of 0.00064 and RMSE of 2.92491 for E. In contrast, PSO-RF also displays a strong accuracy in predicting UCS and E, although it is not without notable limitations. Meanwhile, PSO-GBR and PSO-LightGBM exhibit limited predictive performance.
Furthermore, Based on the Taylor diagram analysis, it can be observed that the PSO-XGBoost model exhibits a standard deviation that is in close agreement with the original standard deviation value. A comprehensive SHAP analysis was also conducted to gain deeper insights into the significant impact of each input feature on the final output.
In this study, the application of a hybrid PSO with tree-based models has demonstrated the feasibility of forming underground engineering construction plans with limited data. This approach not only enhances construction safety but also yields cost reduction and accelerated progress. The findings of this study make valuable contributions to sustainable mining development. The utilization of the hybrid model has facilitated the construction of optimized models, thereby providing accurate predictive models for UCS and E at Block IX of the Thar Coalfield.
Effective fieldwork is needed for informed decision-making in future engineering projects. The use of innovative methods, like the PSO-XGBoost model, shows outstanding performance in predicting UCS and E. Thus, it is highly recommended for inclusion in future study endeavors and holds significant potential for extensive application in the engineering field, particularly when dealing with large datasets to overcome existing limitations.
Data availability statement
The raw data supporting the conclusion of this article will be made available by the authors, without undue reservation.
Author contributions
NS: Conceptualization, Investigation, Methodology, Writing–original draft. QX: Data curation, Methodology, Writing–review and editing. XW: Formal Analysis, Funding acquisition, Writing–review and editing. LJ: Data curation, Investigation, Resources, Writing–review and editing. TA: Formal Analysis, Supervision, Visualization, Writing–review and editing. MX: Software, Validation, Visualization, Writing–review and editing. QS: Data curation, Validation, Writing–review and editing. CW: Validation, Visualization, Writing–review and editing. LL: Data curation, Validation, Writing–review and editing.
Funding
The author(s) declare that no financial support was received for the research, authorship, and/or publication of this article.
Acknowledgments
We are grateful to the esteemed editors and esteemed reviewers for their valuable suggestions to improve the quality of our article.
Conflict of interest
Authors NS, QX, and CW were employed by Shanxi Guxian Jingu Coal Industry Co., Ltd. Author LJ was employed by Ningxia Coal Industry Co., Ltd.
The remaining authors declare that the research was conducted in the absence of any commercial or financial relationships that could be construed as a potential conflict of interest.
Publisher’s note
All claims expressed in this article are solely those of the authors and do not necessarily represent those of their affiliated organizations, or those of the publisher, the editors and the reviewers. Any product that may be evaluated in this article, or claim that may be made by its manufacturer, is not guaranteed or endorsed by the publisher.
Abbreviations
ANFIS, Adaptive neuro-fuzzy inference system; ANN, Artificial neural networks; ASTM, American Society for Testing and Materials; BTS, Brazilian tensile strength; DD, Dry density; E, Elastic modulus; ELM, Extreme learning machine; GBR, Gradient boosting regressor; GRNN, Generalized regression neural network; ISRM, International Society for Rock Mechanics; LightGBM, Light gradient boosting machine; LS-SVM, Least square support vector machine; MAE, Mean absolute error; ML, Machine learning; MPMR, Minimum probabilistic machine regression; MRA, Multiple regression analysis; MVR, Multivariate regression; PSO, Particle swarm optimization; R2, Coefficient of determination; RF, Random forest; RMSE, Root mean square error; SHAP, Shapley Additive exPlanations; SH, Shore hardness; UCS, Uniaxial compressive strength; XGBoost, Extreme gradient boosting; WD, Wet density.
References
Abdi, Y., Garavand, A. T., and Sahamieh, R. Z. (2018). Prediction of strength parameters of sedimentary rocks using artificial neural networks and regression analysis. Arab. J. Geosci. 11 (19), 587–611. doi:10.1007/s12517-018-3929-0
Abdi, Y., and Taheri-Garavand, A. (2020). Application of the ANFIS approach for estimating the mechanical properties of sandstones. Emir. J. Eng. Res. 25 (4), 1.
Aboutaleb, S., Behnia, M., Bagherpour, R., and Bluekian, B. (2018). Using nondestructive tests for estimating uniaxial compressive strength and static Young’s modulus of carbonate rocks via some modeling techniques. Bull. Eng. Geol. Environ. 77 (4), 1717–1728. doi:10.1007/s10064-017-1043-2
Ahmed, W., Muhammad, K., and Siddiqui, F. I. (2020). Predicting calorific value of thar lignite deposit: a comparison between back-propagation neural networks (BPNN), gradient boosting trees (gbt), and multiple linear regression (mlr). Appl. Artif. Intell. 34 (14), 1124–1136. doi:10.1080/08839514.2020.1824091
Armaghani, D. J., Harandizadeh, H., Momeni, E., Maizir, H., and Zhou, J. (2022). An optimized system of GMDH-ANFIS predictive model by ICA for estimating pile bearing capacity. Artif. Intell. Rev. 55 (3), 2313–2350. doi:10.1007/s10462-021-10065-5
Armaghani, D. J., Mohamad, E. T., Momeni, E., Monjezi, M., and Narayanasamy, M. S. (2016). Prediction of the strength and elasticity modulus of granite through an expert artificial neural network. Arab. J. Geosci. 9 (1), 1–16. doi:10.1007/s12517-015-2057-3
ASTM Committee D-18 on Soil and Rock (2013). Standard practices for preparing rock core as cylindrical test specimens and verifying conformance to dimensional and shape tolerances. West Conshohocken, PA: ASTM—American Society for Tenting and Materials.
Barzegar, R., Sattarpour, M., Deo, R., Fijani, E., and Adamowski, J. (2020). An ensemble tree-based machine learning model for predicting the uniaxial compressive strength of travertine rocks. Neural Comput. Appl. 32 (13), 9065–9080. doi:10.1007/s00521-019-04418-z
Bergstra, J., and Bengio, Y. (2012). Random search for hyper-parameter optimization. J. Mach. Learn Res. 13, 281–305.
Brotons, V., Tomás, R., Ivorra, S., Grediaga, A., Martínez-Martínez, J., Benavente, D., et al. (2016). Improved correlation between the static and dynamic elastic modulus of different types of rocks. Mater Struct. 49 (8), 3021–3037. doi:10.1617/s11527-015-0702-7
Brown, E. T. (2007). Rock characterization testing and monitoring—ISRM suggested methods, ISRM—international Society for Rock Mechanics, 211. London, UK: Pergamon Press. Google Scholar.
Cao, J., Gao, J., Nikafshan Rad, H., Mohammed, A. S., Hasanipanah, M., and Zhou, J. (2022). A novel systematic and evolved approach based on XGBoost-firefly algorithm to predict Young’s modulus and unconfined compressive strength of rock. Eng. Comput. 38 (S5), 3829–3845. doi:10.1007/s00366-020-01241-2
Cao, J., Gao, J., Rad, H. N., Mohammed, A. S., Hasanipanah, M., and Zhou, J. (2021). A novel systematic and evolved approach based on XGBoost-firefly algorithm to predict Young’s modulus and unconfined compressive strength of rock. Eng. Comput. 2021, 1–17.
Ceryan, N., and Can, N. K. (2018). “Prediction of the uniaxial compressive strength of rocks materials,” in Handbook of research on trends and digital advances in engineering geology Ceryan N. Editor P. A. Hershey (IGI Global Publishers), 31–96.
Ceryan, N., and Samui, P. (2020). Application of soft computing methods in predicting uniaxial compressive strength of the volcanic rocks with different weathering degree. Arab. J. Geosci. 13 (7), 288. doi:10.1007/s12517-020-5273-4
Chelgani, S. C., Matin, S. S., and Hower, J. C. (2016). Explaining relationships between coke quality index and coal properties by Random Forest method. Fuel 182, 754–760. doi:10.1016/j.fuel.2016.06.034
Chen, T., and Guestrin, C. (2016). “Xgboost: a scalable tree boosting system,” in Proceedings of the 22nd ACM SIGKDD international conference on knowledge discovery and data mining, 785–794. doi:10.1145/2939672.2939785
Davarpanah, M., Somodi, G., Kovács, L., and Vásárhelyi, B. (2019). Complex analysis of uniaxial compressive tests of the Mórágy granitic rock formation (Hungary). Stud. Geotech. Mec. 41 (1), 21–32. doi:10.2478/sgem-2019-0010
Davarpanah, S. M., Ván, P., and Vásárhelyi, B. (2020). Investigation of the relationship between dynamic and static deformation moduli of rocks. Geomech. Geophys Geo Energy Geo Resour. 6 (1), 29. doi:10.1007/s40948-020-00155-z
Demirdag, S., Tufekci, KENAN, Kayacan, R., Yavuz, H., and Altindag, R. (2010). Dynamic mechanical behavior of some carbonate rocks. Int. J. Rock Mech. Min. Sci. 47 (2), 307–312. doi:10.1016/j.ijrmms.2009.12.003
Diamantis, K., and Moussas, V. C. (2021). Estimating uniaxial compressive strength of peridotites from simple tests using neural networks. Arab. J. Geosci. 14 (23), 2690. doi:10.1007/s12517-021-09101-z
Duan, J., Asteris, P. G., Nguyen, H., Bui, X. N., and Moayedi, H. (2021). A novel artificial intelligence technique to predict compressive strength of recycled aggregate concrete using ICA-XGBoost model. Eng. Comput. 37 (4), 3329–3346. doi:10.1007/s00366-020-01003-0
Freund, Y., Schapire, R., and Abe, N. (1999). A short introduction to boosting. J. Jpn. Soc. Artif. Intell. 14 (5), 771–780.
Ghasemi, E., Kalhori, H., Bagherpour, R., and Yagiz, S. (2018). Model tree approach for predicting uniaxial compressive strength and Young’s modulus of carbonate rocks. Bull. Eng. Geol. Environ. 77 (1), 331–343. doi:10.1007/s10064-016-0931-1
Ghose, A. K., and Chakraborti, S. (1986). “Empirical strength indices of Indian coals,” in Proceedings of the 27th U.S. Symposium on Rock Mechanics, Tuscaloosa, AL, USA, Jun 23-25 1986.
Guha Roy, D. G., and Singh, T. N. (2018). Regression and soft computing models to estimate Young’s modulus of CO2 saturated coals. Measurement 129, 91–101. doi:10.1016/j.measurement.2018.07.016
Gül, E., Ozdemir, E., and Eren Sarıcı, D. E. (2021). Modeling uniaxial compressive strength of some rocks from Turkey using soft computing techniques. Measurement 171, 108781. doi:10.1016/j.measurement.2020.108781
Gupta, D., and Natarajan, N. (2021). Prediction of uniaxial compressive strength of rock samples using density weighted least squares twin support vector regression. Neural Comput. Appl. 33 (22), 15843–15850. doi:10.1007/s00521-021-06204-2
Hakan, E., and Kanik, D. (2012). Multicriteria decision-making analysis based methodology for predicting carbonate rocks’ uniaxial compressive strength. Earth Sci. Res. J. 16 (1), 65–74.
Harandizadeh, H., and Armaghani, D. J. (2021). Prediction of air-overpressure induced by blasting using an ANFIS-PNN model optimized by GA. Appl. Soft Comput. 99, 106904. doi:10.1016/j.asoc.2020.106904
Jahed Armaghani, D., Tonnizam Mohamad, E., Hajihassani, M., Yagiz, S., and Motaghedi, H. (2016). Application of several non-linear prediction tools for estimating uniaxial compressive strength of granitic rocks and comparison of their performances. Eng. Comput. 32 (2), 189–206. doi:10.1007/s00366-015-0410-5
Jahed Armaghani, D., Tonnizam Mohamad, E., Momeni, E., Narayanasamy, M. S., and Mohd Amin, M. F. (2015a). An adaptive neuro-fuzzy inference system for predicting unconfined compressive strength and Young’s modulus: a study on Main Range granite. Bull. Eng. Geol. Environ. 74 (4), 1301–1319. doi:10.1007/s10064-014-0687-4
Jahed Armaghani, D., Tonnizam Mohamad, E., Momeni, E., Narayanasamy, M. S., and Mohd Amin, M. F. (2015b). An adaptive neuro-fuzzy inference system for predicting unconfined compressive strength and Young’s modulus: a study on Main Range granite. Bull. Eng. Geol. Environ. 74 (4), 1301–1319. doi:10.1007/s10064-014-0687-4
Jamshidi, A., Nikudel, M. R., Khamehchiyan, M., and Sahamieh, R. Z. (2016). The effect of specimen diameter size on uniaxial compressive strength, P-wave velocity and the correlation between them. Geomech. Geoeng 11 (1), 13–19. doi:10.1080/17486025.2015.1006264
Jing, H., Nikafshan Rad, H., Hasanipanah, M., Jahed Armaghani, D., and Qasem, S. N. (2021). Design and implementation of a new tuned hybrid intelligent model to predict the uniaxial compressive strength of the rock using SFS-ANFIS. Eng. Comput. 37 (4), 2717–2734. doi:10.1007/s00366-020-00977-1
Jordan, M. I., and Mitchell, T. M. (2015). Machine learning: trends, perspectives, and prospects. Science 349 (6245), 255–260. doi:10.1126/science.aaa8415
Katz, O., Reches, Z., and Roegiers, J.-C. (2000). Evaluation of mechanical rock properties using a Schmidt Hammer. Int. J. Rock Mech. Min. Sci. 37 (4), 723–728. doi:10.1016/S1365-1609(00)00004-6
Ke, G., Meng, Q., Finley, T., Wang, T., Chen, W., Ma, W., et al. (2017). Lightgbm: a highly efficient gradient boosting decision tree. Adv. Neural Inf. Process Syst. 30, 3146–3154.
Kennedy, J., and Eberhart, R. C. (1995). “Particle swarm optimization,” in Proceedings of the IEEE international conference on neural networks, Perth, Australia, 1942–1948. doi:10.1109/ICNN.1995.488968
Kolesnikov, Y. I. (2009). Dispersion effect of velocities on the evaluation of material elasticity. J. Min. Sci. 45 (4), 347–354. doi:10.1007/s10913-009-0043-4
Liang, W., Luo, S., Zhao, G., and Wu, H. (2020). Predicting hard rock pillar stability using GBDT, XGBoost, and LightGBM algorithms. Mathematics 8 (5), 765. doi:10.3390/math8050765
Mai, H. T., Nguyen, T. A., Ly, H. B., and Tran, V. Q. (2021). Prediction compressive strength of concrete containing GGBFS using random forest Model. Adv. Civ. Eng. 2021, 1–12. doi:10.1155/2021/6671448
Matin, S. S., Farahzadi, L., Makaremi, S., Chelgani, S. C., and Sattari, G. (2018). Variable selection and prediction of uniaxial compressive strength and modulus of elasticity by random forest. Appl. Soft Comput. 70, 980–987. doi:10.1016/j.asoc.2017.06.030
Meng, Q., Ke, G., Wang, T., Chen, W., Ye, Q., Ma, Z. M., et al. (2016). A communication-efficient parallel algorithm for decision tree. Adv. Neural Inf. Process Syst., 1271–1279.
National Research Council (1978). Limitations of rock mechanics in energy-resource recovery and development: report of a study.
Ozcelik, Y., Bayram, F., and Yasitli, N. E. (2013). Prediction of engineering properties of rocks from microscopic data. Arab. J. Geosci. 6 (10), 3651–3668. doi:10.1007/s12517-012-0625-3
Pham, B. T., Nguyen, M. D., Nguyen-Thoi, T., Ho, L. S., Koopialipoor, M., Kim Quoc, N., et al. (2021). A novel approach for classification of soils based on laboratory tests using Adaboost, Tree and ANN modeling. Transp. Geotech. 27, 100508. doi:10.1016/j.trgeo.2020.100508
Rahimi, R., and Nygaard, R. (2018). Effect of rock strength variation on the estimated borehole breakout using shear failure criteria. Geomech. Geophys Geo Energy Geo Resour. 4 (4), 369–382. doi:10.1007/s40948-018-0093-7
Ranka, S., and Singh, V. (1998). “Clouds: a decision tree classifier for large datasets,” in Proceedings of the 4th knowledge discovery and data mining conference, 2–8.
Rastegarnia, A., Sharifi Teshnizi, E. S., Hosseini, S., Shamsi, H., and Etemadifar, M. (2018). Estimation of punch strength index and static properties of sedimentary rocks using neural networks in south west of Iran. Measurement 128, 464–478. doi:10.1016/j.measurement.2018.05.080
Sampath, KHSM, Perera, M. S. A., Ranjith, P. G., Matthai, S. K., Tao, X., and Wu, B. (2019). Application of neural networks and fuzzy systems for the intelligent prediction of CO2-induced strength alteration of coal. Measurement 135, 47–60. doi:10.1016/j.measurement.2018.11.031
Schapire, R. E. (1990). The strength of weak learnability. Mach. Learn 5 (2), 197–227. doi:10.1007/BF00116037
Shahani, N. M., Kamran, M., Zheng, X., and Liu, C. (2022c). Predictive modeling of drilling rate index using machine learning approaches: LSTM, simple RNN, and RFA. Petrol Sci. Technol. 40 (5), 534–555. doi:10.1080/10916466.2021.2003386
Shahani, N. M., Ullah, B., Shah, K. S., Hassan, F. U., Ali, R., Elkotb, M. A., et al. (2022b). Predicting angle of internal friction and cohesion of rocks based on machine learning algorithms. Mathematics 10 (20), 3875. doi:10.3390/math10203875
Shahani, N. M., Wan, Z., Guichen, L., Siddiqui, F. I., Pathan, A. G., Yang, P., et al. (2019). Numerical analysis of top coal recovery ratio by using discrete element method. Pak. J. Eng. Appl. Sci.
Shahani, N. M., Wan, Z., Zheng, X., Guichen, L., Liu, C., Siddiqui, F. I., et al. (2020). Numerical modeling of longwall top coal caving method at thar coalfield. J. Met. Mater Min. 30 (1). doi:10.55713/jmmm.v30i1.593
Shahani, N. M., Zheng, X., Guo, X., and Wei, X. (2022a). Machine learning-based intelligent prediction of elastic modulus of rocks at thar coalfield. Sustainability 14 (6), 3689. doi:10.3390/su14063689
Shahani, N. M., Zheng, X., Liu, C., Hassan, F. U., and Li, P. (2021). Developing an XGBoost regression model for predicting Young’s modulus of intact sedimentary rocks for the stability of surface and subsurface structures. Front. Earth Sci. 9, 761990. doi:10.3389/feart.2021.761990
Singh, R., Kainthola, A., and Singh, T. N. (2012). Estimation of elastic constant of rocks using an ANFIS approach. Appl. Soft Comput. 12 (1), 40–45. doi:10.1016/j.asoc.2011.09.010
Singh, R., Umrao, R. K., Ahmad, M., Ansari, M. K., Sharma, L. K., and Singh, T. N. (2017). Prediction of geomechanical parameters using soft computing and multiple regression approach. Measurement 99, 108–119. doi:10.1016/j.measurement.2016.12.023
Sumathi, S., and Paneerselvam, S. (2010). Computational intelligence paradigms: theory and applications using MATLAB. New York: CRC Press.
Tiryaki, B. (2008). Predicting intact rock strength for mechanical excavation using multivariate statistics, artificial neural networks and regression trees. Eng. Geol. 99 (1-2), 51–60. doi:10.1016/j.enggeo.2008.02.003
Török, Á., and Vásárhelyi, B. (2010). The influence of fabric and water content on selected rock mechanical parameters of travertine, examples from Hungary. Eng. Geol. 115 (3-4), 237–245. doi:10.1016/j.enggeo.2010.01.005
Umrao, R. K., Sharma, L. K., Singh, R., and Singh, T. N. (2018). Determination of strength and modulus of elasticity of heterogenous sedimentary rocks: an ANFIS predictive technique. Measurement 126, 194–201. doi:10.1016/j.measurement.2018.05.064
Wang, M., Wan, W., and Zhao, Y. (2020). Prediction of the uniaxial compressive strength of rocks from simple index tests using a random forest predictive model. C R. Mec. 348 (1), 3–32. doi:10.5802/crmeca.3
Wang, Y., Zhou, X., and Shou, Y. (2017). The modeling of crack propagation and coalescence in rocks under uniaxial compression using the novel conjugated bond-based peridynamics. Int. J. Mech. Sci. 128, 614–643. doi:10.1016/j.ijmecsci.2017.05.019
Wang, Y., Zhou, X., Wang, Y., and Shou, Y. (2018). A 3-D conjugated bond-pair-based peridynamic formulation for initiation and propagation of cracks in brittle solids. Int. J. Solids Struct. 134, 89–115. doi:10.1016/j.ijsolstr.2017.10.022
Wang, Y., Zhou, X., and Xu, X. (2016). Numerical simulation of propagation and coalescence of flaws in rock materials under compressive loads using the extended non-ordinary state-based peridynamics. Eng. Fract. Mech. 163, 248–273. doi:10.1016/j.engfracmech.2016.06.013
Wang, Z. (2000). Dynamic versus static elastic properties of reservoir rocks. Seism. Acoust. Veloc. Reserv. Rocks 3, 531–539.
Wei, X., Shahani, N. M., and Zheng, X. (2023). Predictive modeling of the uniaxial compressive strength of rocks using an artificial neural network approach. Mathematics 11 (7), 1650. doi:10.3390/math11071650
Willmott, C. J. (1982). Some comments on the evaluation of model performance. Bull. Am. Meteorol. Soc. 63 (11), 1309–1313. doi:10.1175/1520-0477(1982)063<1309:SCOTEO>2.0.CO;2
Xiong, L. X., Xu, Z. Y., Li, T. B., and Zhang, Y. (2019). Bonded-particle discrete element modeling of mechanical behaviors of interlayered rock mass under loading and unloading conditions. Geomech. Geophys Geo Energy Geo Resour. 5 (1), 1–16. doi:10.1007/s40948-018-0090-x
Yang, F., Li, Z., Wang, Q., Jiang, B., Yan, B., Zhang, P., et al. (2020). Cluster-formula-embedded machine learning for design of multicomponent β-Ti alloys with low Young’s modulus. npj Comp. Mater 6 (1), 101–111. doi:10.1038/s41524-020-00372-w
Yang, L., Feng, X., and Sun, Y. (2019). Predicting the Young’s modulus of granites using the Bayesian model selection approach. Bull. Eng. Geol. Environ. 78 (5), 3413–3423. doi:10.1007/s10064-018-1326-2
Yang, P., Hwa Yang, Y., Zhou, B., and Zomaya A, Y. (2010). A review of ensemble methods in bioinformatics. Curr. Bioinform 5 (4), 296–308. doi:10.2174/157489310794072508
Yesiloglu-Gultekin, N., and Gokceoglu, C. (2022). A comparison among some non-linear prediction tools on indirect determination of uniaxial compressive strength and modulus of elasticity of basalt. J. Nondestr Eval. 41 (1), 10–24. doi:10.1007/s10921-021-00841-2
Zeng, H., Yang, C., Zhang, H., Wu, Z. H., Zhang, J., Dai, G. J., et al. (2019). A lightGBM-based EEG analysis method for driver mental states classification. Comp. Intell. Neurosci. 2019, 1–11. doi:10.1155/2019/3761203
Zhao, Y. S., Wan, Z. J., Feng, Z. J., Xu, Z. H., and Liang, W. G. (2017). Evolution of mechanical properties of granite at high temperature and high pressure. Geomech. Geophys Geo Energy Geo Resour. 3 (2), 199–210. doi:10.1007/s40948-017-0052-8
Zhong, R., Tsang, M., Makusha, G., Yang, B., and Chen, Z. (2021). “Improving rock mechanical properties estimation using machine learning,” in Proceedings of the 2021 Resource operators conference, Min Eng. University of Wollongong.
Zhou, X. P., Bi, J., and Qian, Q. H. (2015). Numerical simulation of crack growth and coalescence in rock-like materials containing multiple pre-existing flaws. Rock Mech. Rock Eng. 48, 1097–1114. doi:10.1007/s00603-014-0627-4
Zhou, X. P., Cheng, H., and Feng, Y. F. (2014). An experimental study of crack coalescence behaviour in rock-like materials containing multiple flaws under uniaxial compression. Rock Mech. Rock Eng. 47, 1961–1986. doi:10.1007/s00603-013-0511-7
Keywords: metaheuristic algorithm, mining rock mechanics, tree-based models, uniaxial compressive strength and elastic modulus, Thar Coalfield
Citation: Shahani NM, Xiaowei Q, Wei X, Jun L, Aizitiliwumaier T, Xiaohu M, Shigui Q, Weikang C and Longhe L (2024) Hybrid PSO with tree-based models for predicting uniaxial compressive strength and elastic modulus of rock samples. Front. Earth Sci. 12:1337823. doi: 10.3389/feart.2024.1337823
Received: 13 November 2023; Accepted: 30 January 2024;
Published: 15 February 2024.
Edited by:
Xiaoping Zhou, Chongqing University, ChinaReviewed by:
Jian-Zhi Zhang, Fuzhou University, ChinaNan Xiao, Changsha University of Science and Technology, China
Copyright © 2024 Shahani, Xiaowei, Wei, Jun, Aizitiliwumaier, Xiaohu, Shigui, Weikang and Longhe. This is an open-access article distributed under the terms of the Creative Commons Attribution License (CC BY). The use, distribution or reproduction in other forums is permitted, provided the original author(s) and the copyright owner(s) are credited and that the original publication in this journal is cited, in accordance with accepted academic practice. No use, distribution or reproduction is permitted which does not comply with these terms.
*Correspondence: Xin Wei, dHMyMTAyMDA1OWEzMUBjdW10LmVkdS5jbg==; Li Jun, ZmVuZ3hpbmczMjNAMTYzLmNvbQ==